Embed Size (px)
Citation preview
CREEP AND CREEP-RUPTURE BEHAVIOR OF ALLOY 718*
C. R. Brinkman’, M. K. Booke?, and J. L. Ding3 1. Oak Ridge National Laboratory, Oak Ridge, TN 37831-6154
2. University of Arkansas, Fayetteville, AR 72703 3. Washington State University, Pullman, WA 99164-2920
Abstract
Data obtained from creep and creep-rupture tests conducted on 18 heats of Alloy 718 were used to formulate models for predicting high temperature time dependent behavior of this alloy. Creep tests were conducted on specimens taken from a number of commercial product forms including plate, bar, and forging material that had been procured and heat treated in accordance with ASTM specifications B-670 or B-637. Data were obtained over the temperature range of 427 to 760°C and at test times to about 87,000 h. Comparisons are given between experimental data and the analytical models. The analytical models for creep-rupture included one based on lot-centering regression analysis, which uses a single heat constant to distinguish between behavior of individual heats, and one based on the Minimum Commitment Method, which used two heat constants. A ‘master” curve approach was used to develop an equation for estimating creep deformation up to the onset of tertiary creep.
*Research sponsored by the U.S. Department of Energy, Office of Technology Support Programs, under contract DE-AC05840R21400 with Martin Marietta Energy Systems, Inc.
Superalloys 718,625 and Various Derivatives Edited by Edward A. Iaria
The Minerals, Metals & Materials Society, 1991
519
Introduction
Several years ago, the U.S. Department of Energy was actively pursuing construction of the Clinch River Breeder Reactor Plant which required use of Alloy 718 for a number of high temperature, non-welded, and non-pressure boundary applications within the reactor vessel. The alloy in the form of forged bar, plate, or extrusions was to be subjected to a number of potentially long term damaging mechanisms (1) including fatigue, creep, creep-fatigue, and loss of strength due to overaging. It was expected that most of the long term service would be at temperatures less than about 649°C but with some limited service exposure to as high as 704°C. An extensive program was therefore undertaken to fully characterize a number of heats and product forms procured to American Society for Testing Materials specifications ASTM A-670 or A-637. This characterization involved generation of considerable amounts of mechanical properties data including crack propagation (2), fracture toughness (3), tensile, low and high cycle fatigue, creep-fatigue, Charpy impact, and creep and creep-rupture. It is the objective of this paper to present the analysis that was performed of the creep-rupture and creep data either generated or assembled from the literature in support of this program. Other papers by Korth et al. published in the proceedings of this symposium or to be published elsewhere (4) will deal with other mechanical properties generated as a pan of this effort.
Data Sources
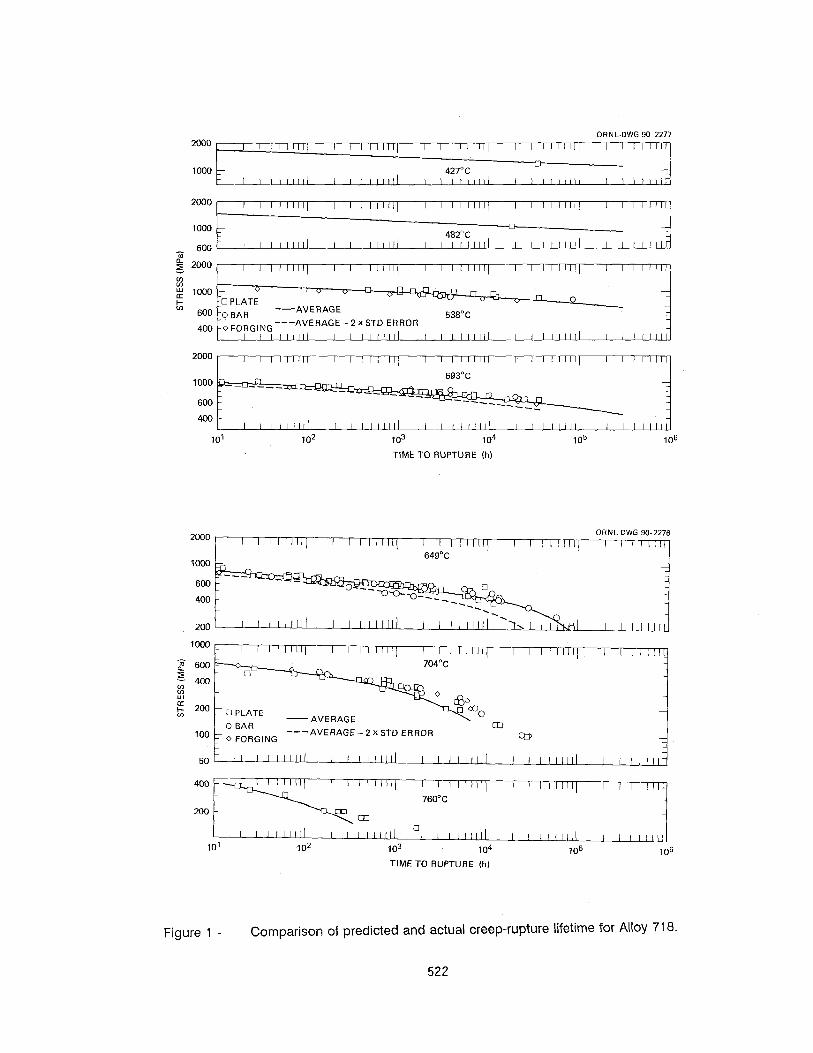
Data utilized in developing stress-rupture models came from several sources including Oak Ridge National Laboratory, Idaho National Engineering Laboratory (5), International Nickel Company (5), General Electric Co. (6) Allegheny Ludlum Steel Corporation (7), and Handford Engineering Development Laboratory (8). Material was generally procured to two specifications as ASTM A-670 or ASTM A-637 depending upon the product forms. Product forms were forgings (pancake or bar), bar, or plate. The heat treatment generally consisted of the following: heat to solution temperature of 954 -t 14°C and hold for 1 h. Air cool to below aging temperature. Age at 718°C for 8 h. Furnace cool at a rate of 55 -L 8°C per hour to 621°C. Hold at 621 “C for 8 h, or sufficient time to provide a total accumulated aging time of 18 h, and air cool to room temperature. Two lots used in the analysis were solution treated at 982”C, which is slightly out of the above range but it was decided to include them in the analysis in order to give the results a wider scope (all other lots were solution treated at 954°C as indicated above). Grain size values when reported ranged from ASTM No, 2 - 9. Results from some 261 tests from 18 heats that had been conducted over the temperature range of 482 to 760°C were included in the analysis. Rupture times ranged from IO to over 80,000 h. Subsequent to the initial analysis, three latter test results (5) became available. These included single test results at 427°C (34,981 h to failure), 593°C (21,343 h to failure), and 704°C (28,545 h to failure). These data were included in the comparison data plots (Figs. 1 and 2) discussed below.
Stress-Rupture Model Development
The ability to extrapolate rupture lives of Alloy 718 procured to ASTM specification B-637 was required in order to set stress allowables for this material used as bolting at temperatures to 566°C and for times up to 300,000 h as defined in ASME Code Case N-47-28. Other product forms also were once under active consideration for this code case as well. To develop stress-rupture models the data were first plotted in terms of stress versus log rupture life in order to identify trends in behavior. The data for various heats and product forms appeared to be approximately parallel when isothermal data sets were examined. Thus it appeared appropriate to adopt the technique of ‘lot-centering” to analyze the data (9). This technique uses one lot (heat) constant to describe the behavior of an individual heat relative to all other heats in the data base. Another trend that emerged from this initial and visual evaluation of the data was that all heats given a 954°C solution treatment appeared similar to each other: and the heats given a 982°C solution treatment appeared similar to each other but different from the behavior of the 954°C solution treated heats. At short times, the 982”C-treated material showed inferior creep rupture resistance in comparison to the 954”C-treated material. At longer times, the service exposure appeared to negate the effects of the solution treating and the two sets of data converged. The time required for convergence increased as test temperature decreased.
The above effects clearly indicate that the differences in behavior were due to the different solution treatment temperatures. The actual physical nature of the effect (grain size, etc.) could not be determined from available information. Thus, we attempted to resolve the differences in terms of solution treatment temperature, T,, alone. We found that a relationship existed between stress for a
520
given rupture life for T, = 954°C and T, = 982°C at various test temperatures. The difference between the stress for T, = 954°C (~~54) and the stress for T, = 982°C (a,3 is given by
agu - ogs2 = ho = log ogs2 - 2.7
0.00242
for (Jr%32 r 500 MPa. For lower stresses, as% = usB2.
Equation 1 worked well for the data used to develop it, but those data were insufficient to provide faith in its general application. We used Eq. 1 to normalize the available T, = 982°C data to be consistent with the T, = 954°C data. As a result, the results obtained in these analyses are strictly applicable only to material receiving the 954 * 14°C solution treatment even though available specifications generally allow higher solution treatment temperatures.
The lot-centered regression analysis technique (9) allows data from a variety of lots or heats with differing strengths to be analyzed simultaneously while maintaining the individual strength characteristics of each lot as the final result. The analysis was performed and the optimum model selected. Stress-rupture curves shown as solid lines were calculated from the following equation, which will be called the ORNL model or Eq. in this paper, and compared with the data in Fig. 1.
log t, = C,, - 193.662 log u + 88.117 (log o)* - 12.807(log CF)~ - 0.01052 T log u t2)
where the base for all logarithms is IO;
t, = rupture life (h); (J = stress (MPa) T = Temperature (K).
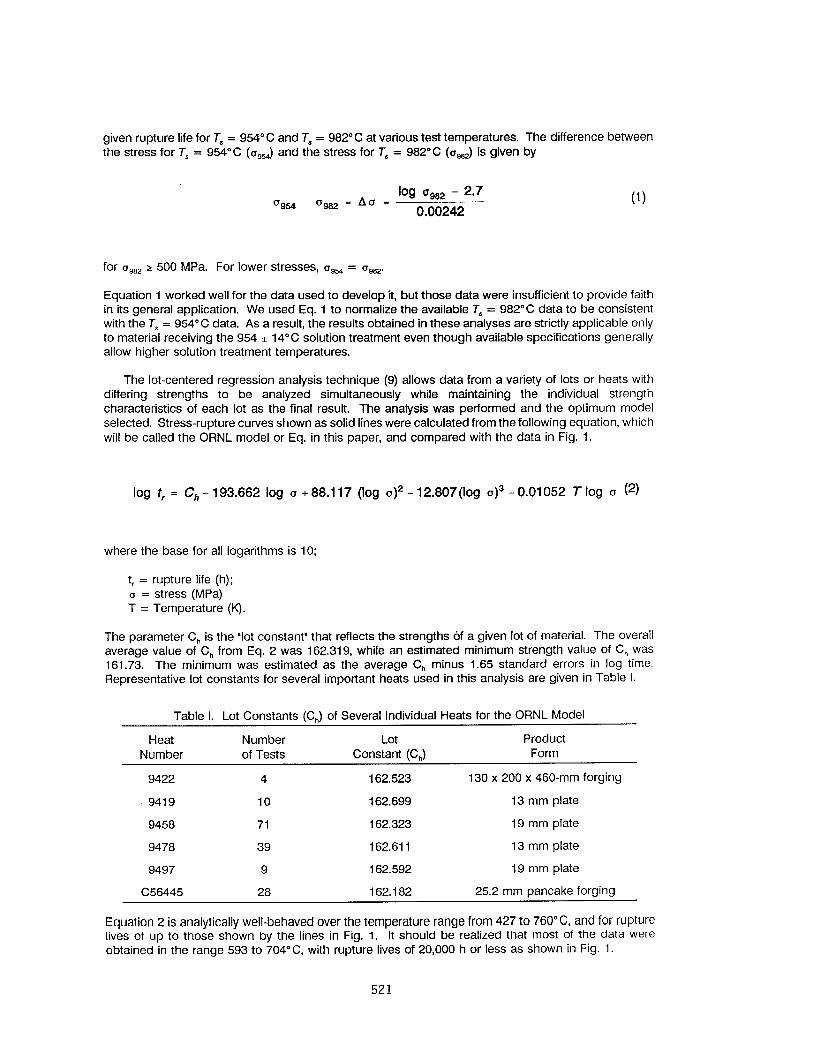
The parameter C, is the “lot constant” that reflects the strengths of a given lot of material. The overall average value of C, from Eq. 2 was 162.319, while an estimated minimum strength value of C, was 161.73. The minimum was estimated as the average C, minus 1.65 standard errors in log time. Representative lot constants for several important heats used in this analysis are given in Table I.
Table I. Lot Constants (C,) of Several Individual Heats for the ORNL Model
Heat Number Lot Product Number of Tests Constant (C,) Form
9422 4 162.523 130 x 200 x 460-mm forging
9419 IO 162.699 13 mm plate
9458 71 162.323 19 mm plate
9478 39 162.611 13 mm plate
9497 9 162.592 19 mm plate
C56445 28 162.182 25.2 mm pancake forging
Equation 2 is analytically well-behaved over the temperature range from 427 to 76O”C, and for rupture lives of up to those shown by the lines in Fig. 1. It should be realized that most of the data were obtained in the range 593 to 704°C with rupture lives of 20,000 h or less as shown in Fig. I.
521
ORNL-DWG 90.2277
2000 I I1111111 I I llllll/ I I ll~lll~ I I Illilll I I illllr
427°C CJ-
1000 r I I111111~ I I I IllIll I I IIIIII~ I I 1111111 I I ltllir
2000 I I llllll~ I I llilll~ I l ll1lll/ I I llllll~ I I I Illil
1000 r
~ ImJ- I I lllllll I I l1lilll I I1llllll I I Illlill I I I IllIT.
2 2000. I I ll~lll( I I llllll( I Ill1lll~ I I Illllll I I I Illll
n rk ” n 0
-AVERAGE 538°C
400 -0FORGING ---AVERAGE- 2 X STD ERROR
I I IIIIIII I I1111111 I I 111111~ I I llllll~ I I IllIlL
2000 , , I , I 1 , I I I iIilll~ I I lll~~i( I I111111( I I IllIll
593°C
400 - I I Illlll I I llli1l1 I I llll1ll I I lll1lll I I IllIll.
101 102 103 104 105 106
TIME TO RUPTURE (h)
2000 OHNL-OWG 90.2276
loo0
600
400
200
loo0 - ’ I I ’ I ‘II’ I 1 I illll~ I I liilll~ I IlllIly
2 600 z “00 ‘I w ii b 2
1
50 I I lllllll I I I Illlll I I lllllll I I lllllll I I lllll
400 - I I1lllll~ I lllll1l~ I I IIIIIC
760°C 200 -
I I1111111 I I I IllIll 0
I I l1llll1 I I II(IIll I I Ill/II
10’ 102 103 104 105 106
TIME TO RUPTURE (h)
Figure 1 - Comparison of predicted and actual creep-rupture lifetime for Alloy 718.
522
Subsequently, rupture data were analyzed using Manson’s two lot constant Minimum Commitment Method (IO), and a computer program developed by Pepe (11). All of the data available from 264 test results were used in this analysis, and Eq. 1 was not used to adjust for differences in solution heat treatment. The Minimum Commitment Method (MCM) equation developed was as follows:
log r, + [R, (T - T middle) +R2 (f - T Addle) ’ = Ah
(3) + B, log u + D a + E u2
where the base for all logarithms is IO;
t, = rupture life (h); (I = stress (MPa); T = temperature (K); T middle = 867 K
The constants l?,, R,, D, and E were determined to be 2.14547 x 10e2, -5,622.76, -2.71294 x 1O-3 and -2.96015 x IO’” respectively. The lot constants A, and 6, for the corresponding heats given in Table I are listed in Table II. The averaged values for A,, and B, are 9.66956 and -0.899187 respectively.
Table II. Lot constants (A,, and B,,) of several individual heats for the MCM Model
Heat Number Number of Tests
9419 10
9422 4
9458 71
9478 42
9497 9
C56445 28
Lot Lot Constant (A,) Constant (BJ
7.0744 0.13058
13.070 -2.0772
9.0220 -0.69101
9.1545 -0.63656
11.778 -1.5920
13.508 -2.3358
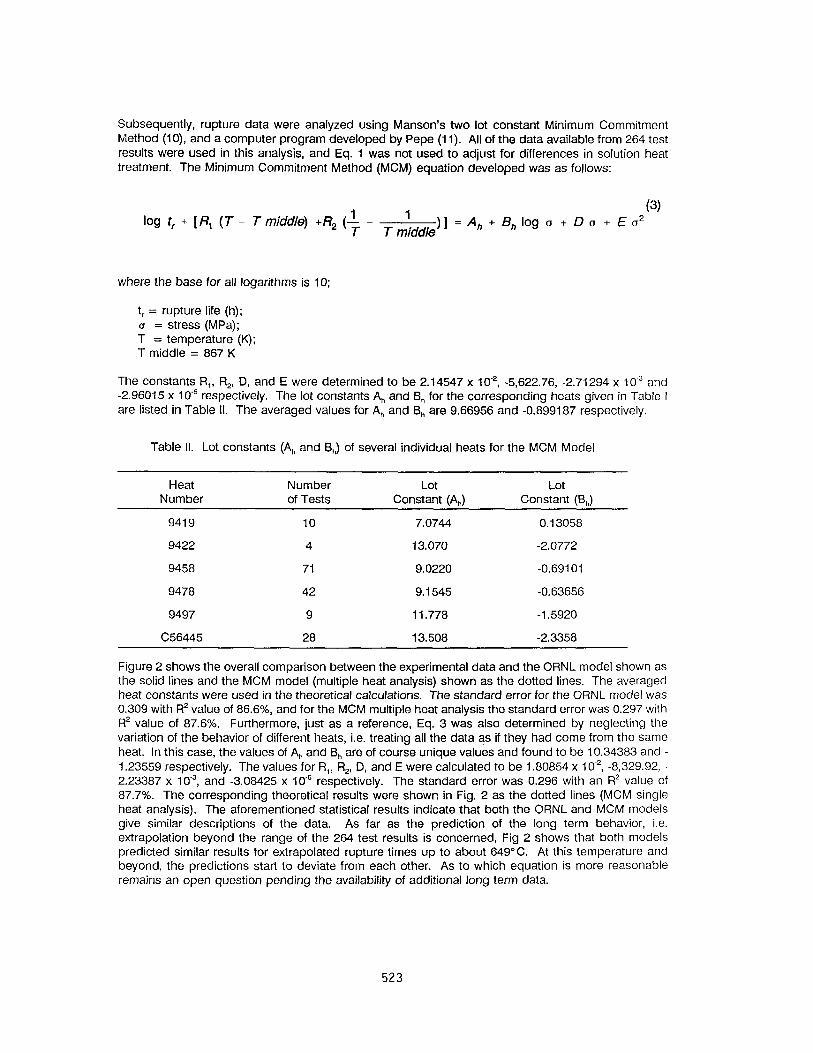
Figure 2 shows the overall comparison between the experimental data and the ORNL model shown as the solid lines and the MCM model (multiple heat analysis) shown as the dotted lines. The averaged heat constants were used in the theoretical calculations. The standard error for the ORNL model was 0.309 with R’value of 86.6%, and for the MCM multiple heat analysis the standard error was 0.297 with R2 value of 87.6%. Furthermore, just as a reference, Eq. 3 was also determined by neglecting the variation of the behavior of different heats, i.e. treating all the data as if they had come from the same heat. In this case, the values of A,, and B, are of course unique values and found to be 10.34383 and - 1.23559 respectively. The values for R,, R,, D, and E were calculated to be 1.80854 x IO-‘, -8,329.92, - 2.23387 x 1U3, and -3.08425 x 10e6 respectively. The standard error was 0.296 with an R2 value of 87.7%. The corresponding theoretical results were shown in Fig. 2 as the dotted lines (MCM single heat analysis). The aforementioned statistical results indicate that both the ORNL and MCM models give similar descriptions of the data. As far as the prediction of the long term behavior, i.e. extrapolation beyond the range of the 264 test results is concerned, Fig 2 shows that both models predicted similar results for extrapolated rupture times up to about 649°C. At this temperature and beyond, the predictions start to deviate from each other. As to which equation is more reasonable remains an open question pending the availability of additional long term data.
523
ORNL DWC 9617422
TIME TO RUPTURE (year) 0.114 1.14 11.4 114
J - ORNLEQN. t
- MCM EQN. (Multiple Heat Analysis) t
------ MCM EQN. (Single Heat Analysis)
IO’ I - * . ..*-*I - - “,,,‘I I m “““‘I ’ “’
10’ 102 103 104 105 106
TIME TO RUPTURE (h)
Figure 2 - Comparison of creep-rupture data base and isothermal curves established using
several equations.
524

REU
UC
TIO
N
OF
AREA
(%
) R
EDU
CTI
ON
O
F AR
EA
(%)
RED
UC
TIO
N
OF
AREA
(%
)
-4
j ..-
..- ..
I I .
-...
..-. y.
.“.
..-..
-~
.-,...
.I
&.-.
.._
_ “.
. ..-.
&.“..
“..
0
1 1
(
v-l
N 0-l
I. ..I..
Y
” i
t ..--i-
...
I ...I..
. .--
1
1 ~_
._i_
._
I
-
0 1 10
20 t --- /.f..#j...”
ii- -
0 m 10’ lb2
RUPTURE T,&h,
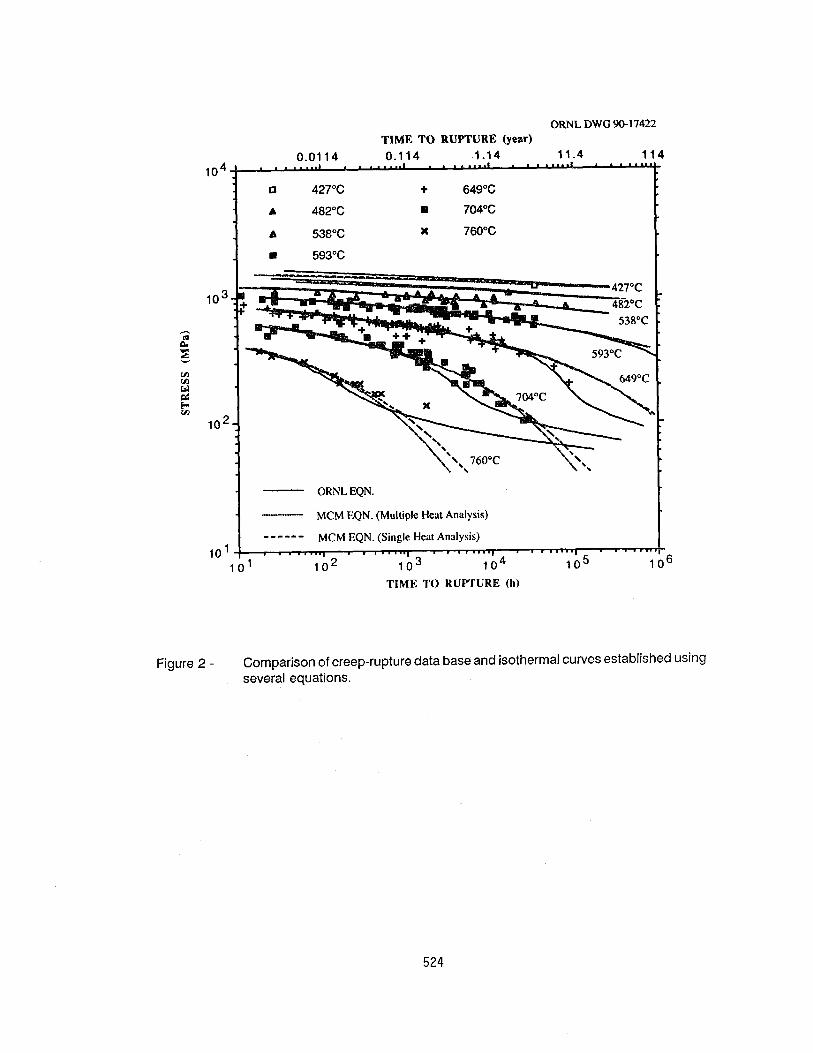
Figure 3 - (continued)
Part of the difficulties in predicting the long term behavior of Alloy 718 at temperatures above 649°C may be due to metallurgical instability. As evidence, the rupture ductility values from the data base are plotted as a function of time for temperatures ranging from 638 to 704°C as shown in Fig. 3. It can be seen at temperatures of 649°C and beyond that there is an indication of an increase in ductility with time as one would expect from consideration of metallurgical reactions due to overaging.
Analvsis of Tertiary Creep Data
Available data for time to tertiary creep (r*J as determined by the 0.2%-offset definition were next analyzed, since the stress to cause onset of tertiary creep in time (r) is one of the criteria used to determine time-dependent allowable stresses in some sections of the ASME Code. Data for the creep strain to the onset of tertiary creep (eJ were also examined because a knowledge of r,, and ess has been found to be useful in describing creep strain-time behavior.
It is common practice to relate rsZ to f, by use of a simple power law expression.
tss = At,!
Detailed study showed that both A and p remained constant over the range of the data examined, being given by 0.442 and 1.04, respectively. Note that since the value of p is greater than one, the ratio of r,, to t, increases with time, and t will in fact at some point exceed r,. This trend obviously becomes unrealistic at some point, but the data indicate it is accurate up to t, = IO5 h. At this point tJ, iir 0.7. For this reason, it is recommend that the value of t,,lt, be maintained at 0.7 for longer times. Such an assumption prevents unrealistic predictions and is conservative in the estimation of allowable stresses by the tertiary creep criterion.
Strain to the onset of tertiary creep was then calculated as follows. The average creep rate to the onset of tertiary creep, ie,,, was defined as
8, = (e, - 0.2)/t,,, (5)
where creep strain is in percent. For the current data a relationship of the following form described the data well.
or combining Eqs. 4-6
526
e *s = 0.2 + (0.442)(B) ty+‘-@’
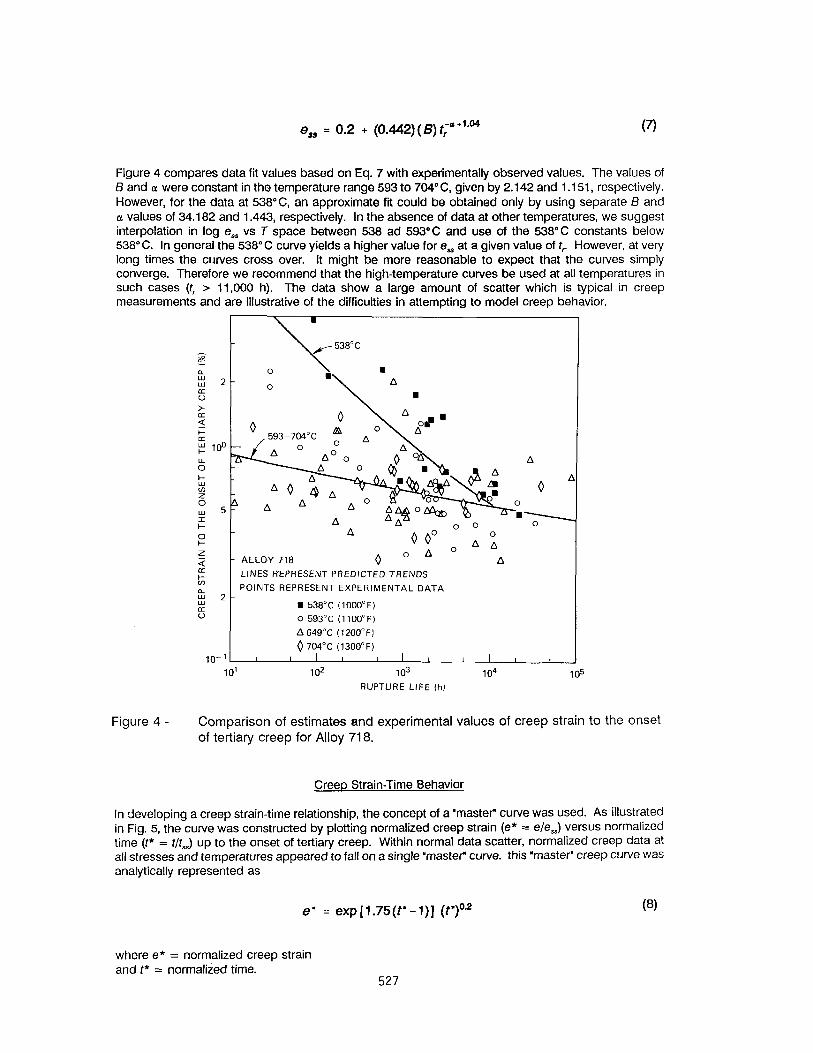
Figure 4 compares data fit values based on Eq. 7 with experimentally observed values. The values of 5 and a were constant in the temperature range 593 to 704°C given by 2.142 and 1 .I 51, respectively. However, for the data at 538°C an approximate fit could be obtained only by using separate B and CL values of 34.182 and 1.443, respectively. In the absence of data at other temperatures, we suggest interpolation in log ess vs T space between 538 ad 593°C and use of the 538°C constants below 538°C. In general the 538°C curve yields a higher value for ess at a given value of t, However, at very long times the curves cross over. It might be more reasonable to expect that the curves simply converge. Therefore we recommend that the high-temperature curves be used at all temperatures in such cases (t, > 11,000 h). The data show a large amount of scatter which is typical in creep measurements and are illustrative of the difficulties in attempting to model creep behavior.
0 1;;
A A
0
00' ' A 1
ALLOY 718 ooAo A
LINES REPRESENT PREDICTED TRENDS
POINTS REPRESENT EXPERIMENTAL DATA
W 538°C (1OOO’F)
0 593°C (1100°F)
A649"C (1200°F)
0 704°C (1300°F) I I I I I I I 1 I I f
102 103
RUPTURE LIFE (h) 104 105
Figure 4 - Comparison of estimates and experimental values of creep strain to the onset of tertiary creep for Alloy 718.
Creep Strain-Time Behavior
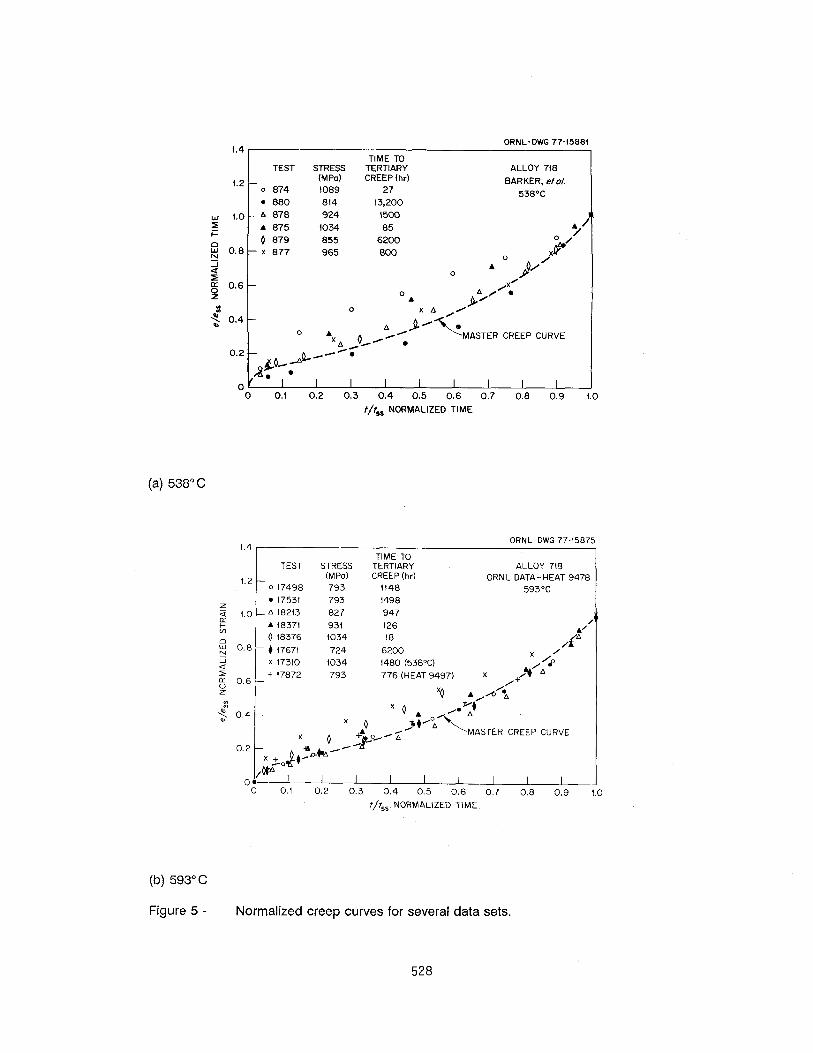
In developing a creep strain-time relationship, the concept of a “master” curve was used. As illustrated in Fig. 5, the curve was constructed by plotting normalized creep strain (e* = e/e,) versus normalized time (f* = f&J up to the onset of tertiary creep. Within normal data scatter, normalized creep data at all stresses and temperatures appeared to fall on a single “master” curve. this ‘master” creep curve was analytically represented as
e” = exp[1.75(t*-1)) (t*)Os2 (8)
where e* = normalized creep strain and t* = normalized time.
527
ORNL-DWG 77-15881 1.4 I
TIME TO TEST STRESS TERTIARY
1.2 (MPo) CREEP (hr) -
0 874 1089 27
l 880 814 13,200
ALLOY 718
BARKER, et al
538OC
x 1.0 - * 878 924 $500
I= A
875 1034 85 “/’
; 0.8-X877 0 879 855 965 6200 800 o *F
a A g 0 p’ 0.6-
/X’
z 0 */ l
. 2 cl a’
8 0.4-
0 * ‘A // 0
“, A “<FASTER CREEP CURVE
/( .
o.2 -p/y *
0’ . I I I I I I I I
0 0.1 0.2 0.3 0.4 0.5 0.6 0.7 0.8 0.9 1.0
t/tss NORMALIZED TIME
(a) 538°C
ORNL-OWG 77-15875 1.4
TIME TO TEST STRESS TERTIARY ALLOY 718
4.2 (MPo) CREEP (hr) - ORNL DATA-HEAT 9478
0 17498 793 (148 593°C
z . 17531 793 1498
Z 1.0 - * 18213 827 947
E
Ii A (837! 934 (26
2 0.8-417671 0 18376 to34 724 6200 18 ,2”
i 2
x + 173!0 I034 1480 (538°C)
6 0.6- 776 (HEAT 9497) 17872 793 x ,+kp
/+ z “0 A’\
2 -$ x 0.4 - x 0 ,.4
0 x b 0.2 - oc,:*@Q /c +$/
.+‘%ASTER CREEP CURVE A A
)ph
On I I I I I I I I I
0 0.1 0.2 0.3 0.4 0.5 0.6 0.7 0.8 0.9 1.0
t/t,, NORMALIZED TIME
(b) 593°C
Figure 5 - Normalized creep curves for several data sets.
528
ORNL-DWG 77-15876 1.4
TIME TO TEST STRESS TERTIARY ALLOY 718
1.2 (MPa) CREEP (hr) ORNL DATA-HEAT 9478 -
0 18208 552 1705 649°C . 17175 579 1188
-
A
17474 620 548 A 17475 758 42 r /* # 17957 570 900 (HEAT 9419) *%
-x 18405 882 5 #n' ,6
+ 17728 620 435 (HEAT 9497) ?,A l
0 0.1 0.2 0.3 0.4 0.5 0.6 0.7 0.0 0.9 1.0
t/f,, NORMALIZED TIME
(c) 649°C
I-
OANL-DWG 77-!5877
TIME TO TEST STRESS TERTIARY ALLOY 718
(MPo) CREEP (hr) ORNL DATA-HEAT 9478 o’i7314 241 1980 704 “C l 17176 365 745
.A 17576 414 436 /
0 18367 476 210
x 17971 365 888 (HEAT 9497)
RATIONAL POLYNOMIAL
0.1 0.2 0.3 0.4 0.5 0.6 0.7 0.0 0.9 1.0
t/t,, NORMALIZED TIME
(d) 704°C
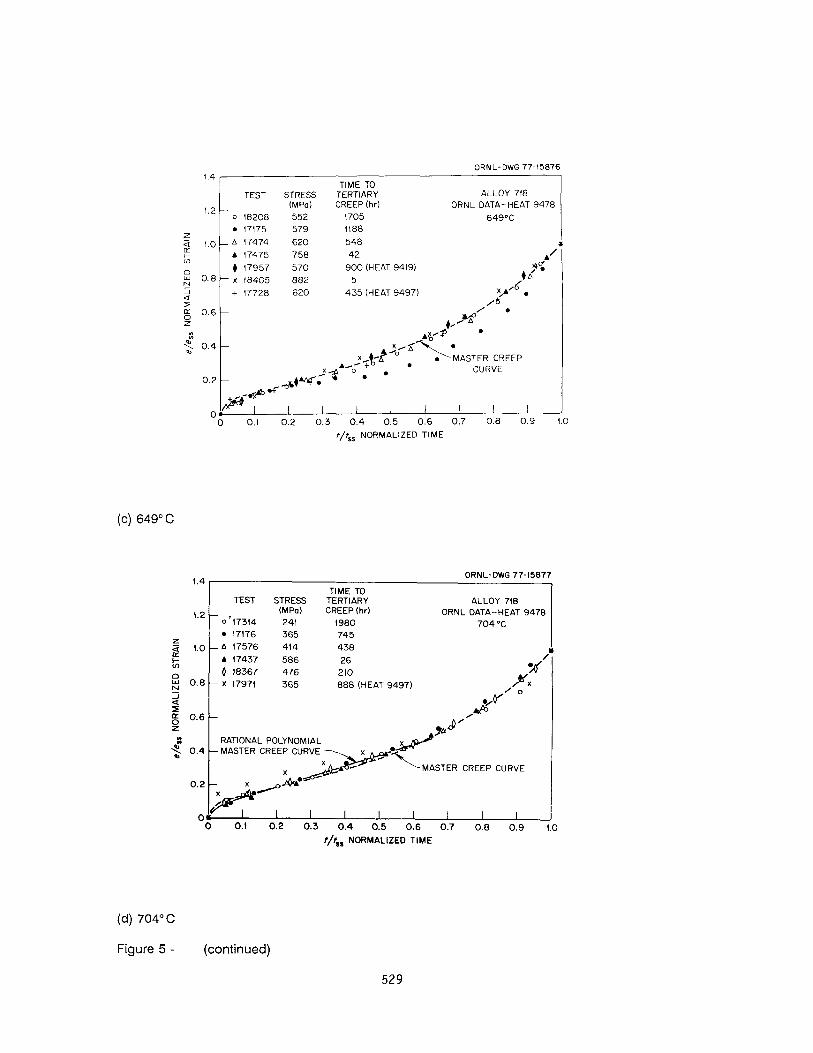
Figure 5 - (continued)
529

This simple equation form predicts the desired curve shape with only two constants, both independent of heat, stress, and temperature within the range of available data. Moreover, there are no specific trends that indicate problems in extrapolating this relationship to stresses, temperatures, or heats beyond the range of the present data. Variations in behavior due to these factors can be reflected simply by variations in f, and e,; these variations can be estimated as described above.
Alternatively, as shown in Fig. 5 (d), the master curve up to about t* = 0.6 can be described by a rational polynomial form as follows:
g* = 6t’ + 0.65t’ 1 .+- loot’
Equation 9 includes all of the advantages of its simple rational polynomial form, but Eq. 8 describes more of the creep curve. However, the power law factor in Eq. 8 produces an infinite initial (t = 0) creep rate.
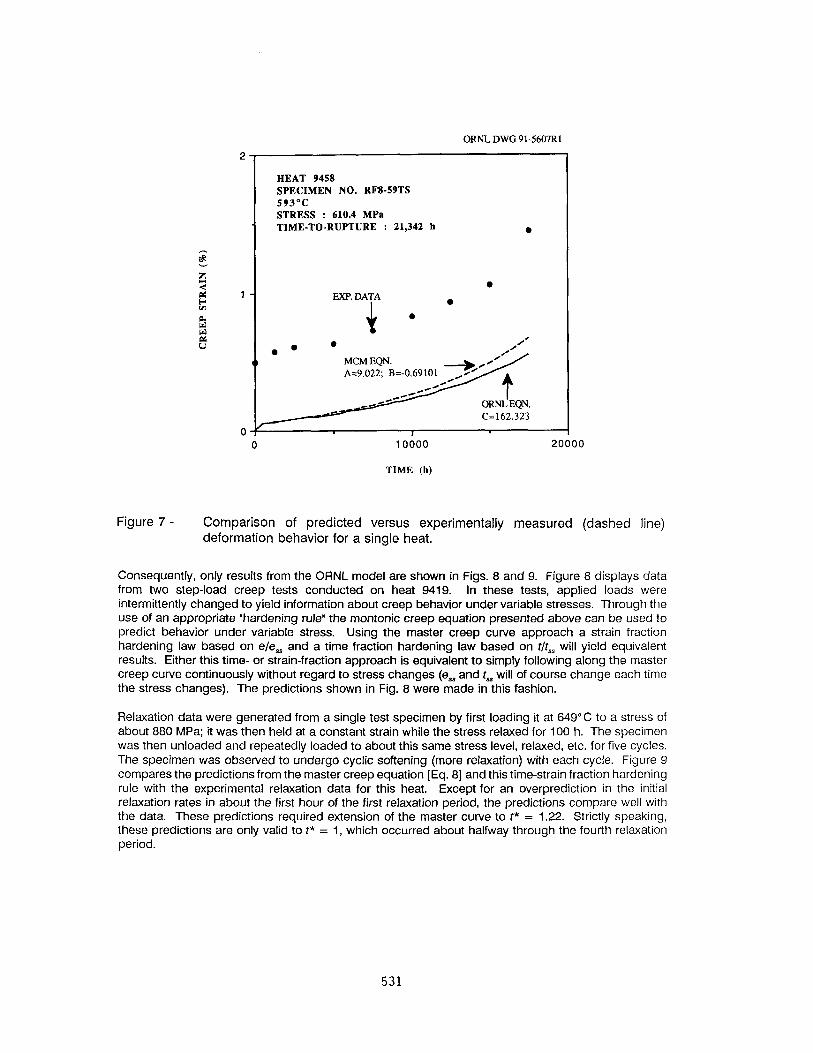
Predictions of deformation behavior were made using Eqs. 2, 3, 4, 7, and 8 for a number of constant and step load creep test conditions as well as stress relaxation response as shown in Figs. 6 - 9. Figure 6 compares experimental data with predicted response for a constant load creep test. Excellent agreement is achieved between experimental data and predicted responses from both the ORNL and MCM models using the average lot constants for this heat as given in Tables 1 and 2. Figure 6 also shows the marked influence of lot constant values (ORNL model) on predicted deformation behavior when possible minimum and maximum values were chosen. Figure 7 shows another example comparison between estimated and measured creep response. The data given in Fig. 7 are from another heat tested at a somewhat lower stress such that the failure time was considerably longer than the test results shown in Fig. 6. The agreement between predicted and experimentally measured creep response shown in Fig. 7 is not as good as that shown in Fig. 6. It should also be noticed that predictions from both the ORNL and MCM models are very close to each other. This is of course not unexpected based on the fact that the only parameter involved in Eqs. 4, 7, and 8 for a given temperature is the rupture time (t,). Therefore, if two models predict similar results in rupture time, they shou-Id also give similar creep behavior.
ORNL. DWG 91-5608R2 0.8 -a
0.8
HEAT 9418 SPECIMEN NO. 6-17-23 593-c STRESS : 792.9 MPa TIME-TO-RUPTURE : 1,860 h
0.2 545; B=-0.63656
0 200 400 600 800 10-00 1:
TIME (h)
10
Figure 6 - Comparison of predicted versus experimentally measured (dashed line) deformation behavior for a single heat. Also shown is the influence of lot constant on predicted deformation.
530
ORNL DWG 91-5607Rl
2
HEAT 9458 SPECIMEN NO. RFS-59TS 593°C STRESS : 610.4 MPa
’ TIME-TO-RUPTURE : 21,342 h l
l l- EX? DATA
10000
TIME (h)
20000
Figure 7 - Comparison of predicted versus experimentally measured (dashed line) deformation behavior for a single heat.
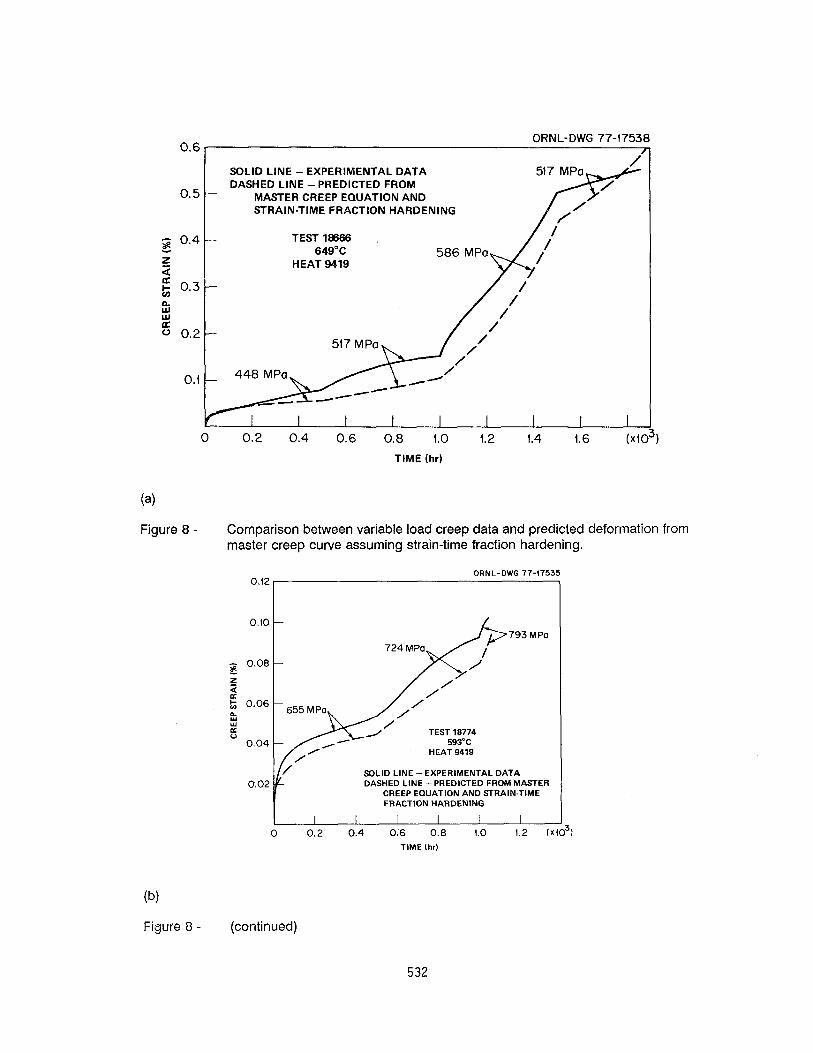
Consequently, only results from the ORNL model are shown in Figs. 8 and 9. Figure 8 displays data from two step-load creep tests conducted on heat 9419. In these tests, applied loads were intermittently changed to yield information about creep behavior under variable stresses. Through the use of an appropriate “hardening rule” the montonic creep equation presented above can be used to predict behavior under variable stress. Using the master creep curve approach a strain fraction hardening law based on e/e, and a time fraction hardening law based on f/r*, will yield equivalent results. Either this time- or strain-fraction approach is equivalent to simply following along the master creep curve continuously without regard to stress changes (e, and f, will of course change each time the stress changes). The predictions shown in Fig. 8 were made in this fashion.
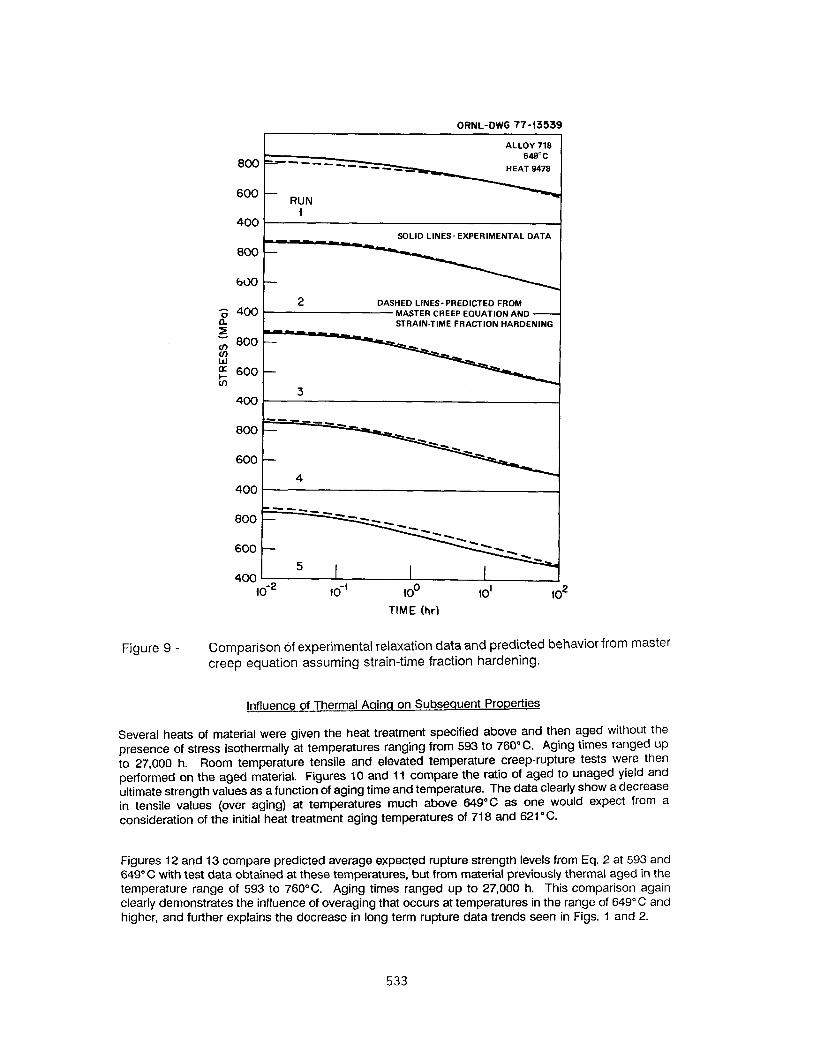
Relaxation data were generated from a single test specimen by first loading it at 649°C to a stress of about 880 MPa; it was then held at a constant strain while the stress relaxed for 100 h. The specimen was then unloaded and repeatedly loaded to about this same stress level, relaxed, etc. for five cycles. The specimen was observed to undergo cyclic softening (more relaxation) with each cycle. Figure 9 compares the predictions from the master creep equation [Eq. 81 and this time-strain fraction hardening rule with the experimental relaxation data for this heat. Except for an overprediction in the initial relaxation rates in about the first hour of the first relaxation period, the predictions compare well with the data. These predictions required extension of the master curve to t* = 1.22. Strictly speaking, these predictions are only valid to t* = 1, which occurred about halfway through the fourth relaxation period.
531
SOLID LINE - EXPERIMENTAL DATA DASHED LINE -PREDICTED FROM
0.5 ! MASTER CREEP EQUATION AND STRAIN-TIME FRACTION HARDENING
g 0.4
z ;i 1
TEST 19669 649°C
HEAT 9419 586 MPo
//
/
/’ /
/ /’
I--
r I I I I ); 0 0.2 0.4 0.6 0.8 1.0
TIME (hr)
1.2 1.4 1.6 (XlC
0.6, ORNL-DWG 77-17538 /
3,
(4
Figure 8 - Comparison between variable load creep data and predicted deformation from master creep curve assuming strain-time fraction hardening.
ORNL-DWG 7747535
o”2 1
/ P SOLID LINE-EXPERIMENTAL DATA 0.02 DASHED LINE -PREDICTED FROM MASTER
CREEP EQUATION AND STRAIN-TIME FRACTION HARDENING
I I I I I I I 0 0.2 0.4 0.6 0.8 1.0 1.2 (Xi03)
TIME (hr)
lb)
Figure 8 - (continued)
532
ORNL-OWG 77-13539
ALLOY 718
800 = 649°C
--------- HEAT 9478
600 - RUN
1 400
SOLID LINES-EXPERIMENTAL DATA
If--r
l0” TIME (hr)
Figure 9 - Comparison of experimental relaxation data and predicted behavior from master creep equation assuming strain-time fraction hardening.
Influence of Thermal Aqinq on Subsequent Properties
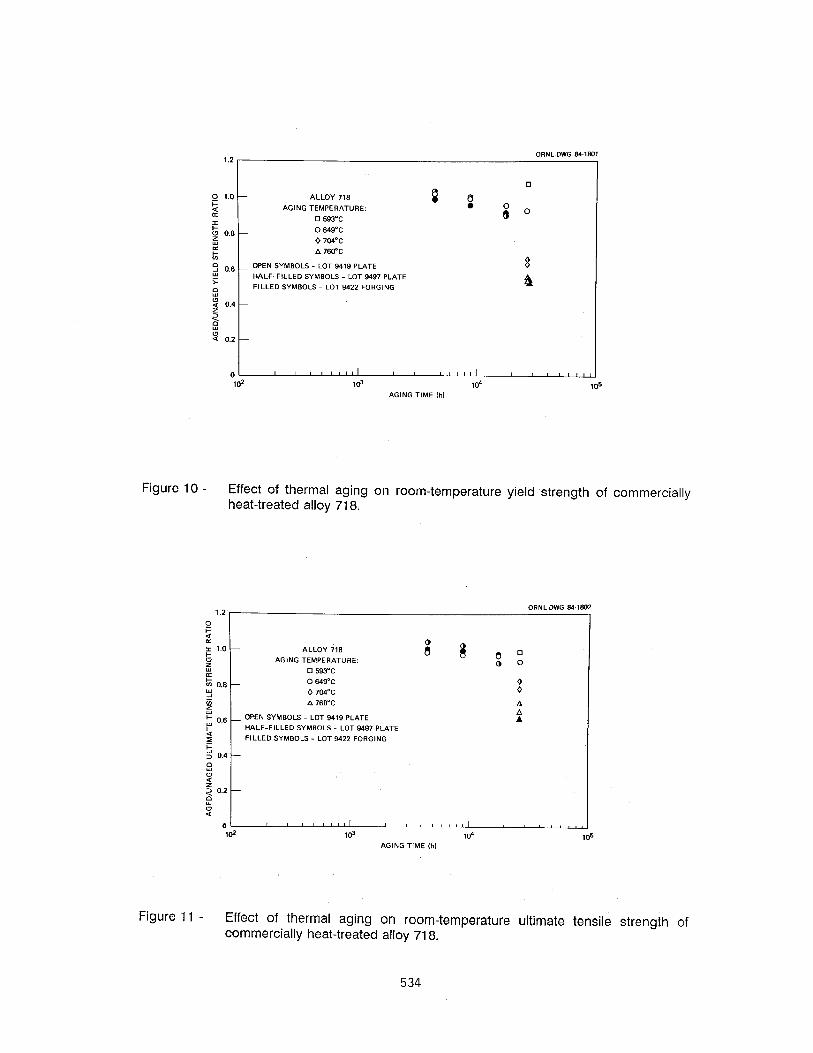
Several heats of material were given the heat treatment specified above and then aged without the presence of stress isothermally at temperatures ranging from 593 to 760°C. Aging times ranged up to 27,000 h. Room temperature tensile and elevated temperature creep-rupture tests were then performed on the aged material. Figures 10 and 11 compare the ratio of aged to unaged yield and ultimate strength values as a function of aging time and temperature. The data clearly show a decrease in tensile values (over aging) at temperatures much above 649°C as one would expect from a consideration of the initial heat treatment aging temperatures of 718 and 621°C.
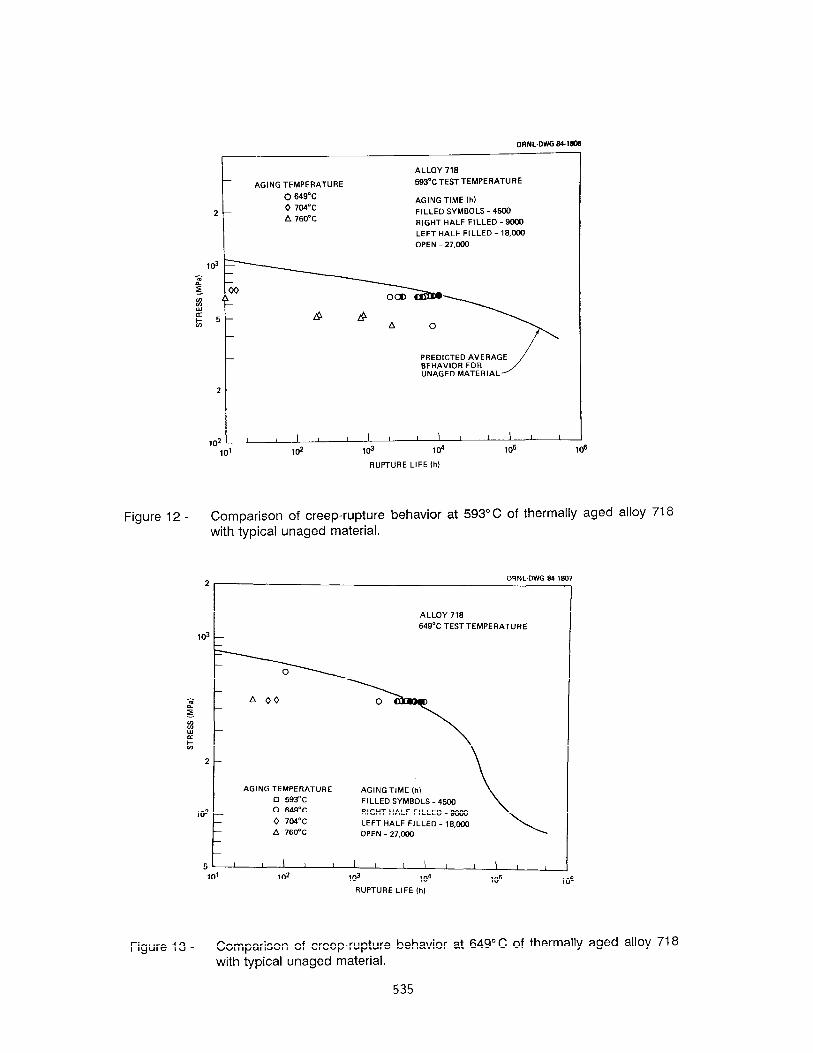
Figures 12 and 13 compare predicted average expected rupture strength levels from Eq. 2 at 593 and 649°C with test data obtained at these temperatures, but from material previously thermal aged in the temperature range of 593 to 760°C. Aging times ranged up to 27,000 h. This comparison again clearly demonstrates the influence of overaging that occurs at temperatures in the range of 649°C and higher, and further explains the decrease in long term rupture data trends seen in Figs. 1 and 2.
533
E ‘.O 2 F 0 0.6 - 5 E 2 0.6 - > 0 s: 0.4 - f B : 4 0.2 -
q
ALLOY 716 6 AGING TEMPERATURE: B
q 593T a” 0
0 649°C
0 7wc
A 76O’C
OPEN S”M6OLS - LOT 9419 PLATE 8 HALF-FILLED SYMBOLS - LOT 9497 PLATE
FILLED SYMBOLS - LOT 9422 FORGlNG B
DRNL-DWG 6416m 1.2
10’ 10’ 104 105 AGING TIME I,,,
Figure 10 - Effect of thermal aging on room-temperature yield strength of commercially heat-treated alloy 718.
ALLOY 716
AGING TEMPERATURE: lJ 0 0 593°C
- 0 649’C 0 704°C
A 760°C A
_ OPEN SYMBOLS - LOT 9419 PLATE
HALF-FILLED SYMBOLS - LOT 9497 PLATE
FILLED SYMBOLS - LOT 9422 FORGING
4
!a
1
10' 103 104 105 AGING TIME (h)
Figure 11 - Effect of thermal aging on room-temperature ultimate tensile strength of commercially heat-treated alloy 718.
534
OANL.DWG 84.1806
ALLOY 718
AGING TEMPERATURE 593°C TEST TEMPERATURE
0 649’C AGING TIME (h)
2- 0 704v FILLED SYMBOLS - 4500 A 760°C RIGHT HALF FILLED - 9ooo
LEFT HALF FILLED - 18,ooO
OPEN - 27,000
PREDICTED AVERAGE BEHAVIOR FOR UNAGED MATERIAL
2-
102 I , I I I I I I 4 I I I I
10’ 102 103 104 105 106
RUPTURE LIFE (hl
Figure 12 - Comparison of creep-rupture behavior at 593” C of thermally aged alloy 718 with typical unaged material.
2
ld
f z
I : a
2
102
5
ORNL.DWG 64.11
ALLOY 718
649% TEST TEMPERATURE
A 00
AGING TEMPERATURE AGING TIME (hl u 593°C FILLED SYMBOLS - 4500 0 649°C RIGHT HALF FILLED - 9ooo 0 704% LEFT HALF FILLED - lS,O(lO A 76O'C OPEN - 27,000
10’ 1W 104
RUPTURE LIFE (hi
Figure 13 - Comparison of creep-rupture behavior at 649°C of thermally aged alloy 718 with typical unaged material.
535
Conclusions
Creep and creep-rupture expressions were developed for Alloy 718 procured to ASTM specifications A-670 or A-637. The pre-test heat treatment employed was generally a 954 f 14°C solution treatment followed by a duplex aging treatment. Following are general conclusions from this analysis.
1. Creep-rupture equations were developed using data obtained from specimens taken from eighteen heats in several product forms and tested at temperatures from 427 to 760°C and at test times up to about 87,000 h. The equations developed were based on concepts of lot- centering regressions analysis with one constant and the Minimum Commitment Method with two lot constants. Both methods gave similar results in terms of fitting the data and ability to extrapolate in time up to temperatures of about 649°C when overaging was observed to occur in the material. Both models developed are given with lot constants for several heats allowing estimates of rupture lives for individual heats to be made. Alternately, tests could be conducted on another or new heat with the assumption that the equations were applicable and new lot constants for that heat estimated from the new data.
2. Estimates of creep deformation for monotonically loaded, step-loaded, and stress-relaxation tests were made by first developing a “master” creep curve equation. This equation was used to estimate creep deformation up to about the onset of tertiary creep. The master creep equation was used with the lot-centering creep-rupture expression and several other equations in order to approximate the shapes of the experimentally determined creep curves and to allow heat-to-heat variations to be included in creep deformation estimates.
References
1, P. Marshall and C. R. Brinkman, Nuclear Energy, Vol. 20, No. 3, June 1981, pp. 257-64.
2. L. A. James, “Superalloy 718 Metallurgy and Applications,’ edited by E. A. Loria, The Minerals, Metals, and Materials Society 1989, pp. 499-515.
3. W. J. Mills, “Superalloy 718 Metallurgy and Applications,’ edited by E. A. Loria, The Minerals, Metals, and Materials Society 1989, pp. 517-32.
4. S. Yukawa, “Review and Evaluation of the Toughness of Austenitic Steels and Nickel Alloys After Long-Term Elevated Temperatures Exposure,’ private communication to be published.
5. G. E. Korth, Idaho National Engineering Laboratory, unpublished data.
6. J. f. Barker et al., ‘Long Time Stability of lnconel 718,” J. Met. 22: January 1970, pp. 31-41.
7. Private communication, R. L. Cook, Allegheny Ludlum Steel Corporation, to M. K. Booker, ORNL, June 1979.
8. Private communication, L. D. Blackburn, Hanford Engineering Development Laboratory, to M. K. Booker, ORNL, June 1979.
9. L. H. Sjodahl, “A Comprehensive Method of Rupture Data Analysis with Simplified Models,” in Characterization of Materials for Service at Elevated Temperatures, MPG7, 1978, pp. 501-I 5.
IO. S. S. Manson, and U. Muralidharan, “Analysis of Creep Rupture Data for Five Multi-heat Alloys by the Minimum Commitment Method Using Double Heat Term Centering,’ Progress in Analysis of Fatigue and Stress Rupture, MPC-23, ASME , 1984, pp. l-46.
Il. J. J. Pepe in Materials Property Data: Applications and Access, edited by J. G. Kaufman, MPD- Vol. 1, PVP-Vol. 111, The American Society of Mechanical Engineers, 1986, pp. 43-60.
536