Embed Size (px)
Citation preview
Statistics Canada – Catalogue no. 85-002-XPE, Vol. 25, no. 5
Crime Statistics in Canada, 2004
by Julie Sauvé
Highlights
• Following an increase in 2003, the national police-reported crime rate fell slightly (-1%) in 2004. Although most crimesdeclined in 2004, noticeable increases were seen in homicides and drug incidents.
• The overall decrease in crime was largely driven by a 5% decline in Ontario. Most of this decline was due to large decreasesin crime in the Hamilton, Ottawa, St. Catharines-Niagara and Toronto census metropolitan areas. Ontario’s crime rate wasthe lowest in the country for the second year in a row.
• There were just over 302,000 violent crimes accounting for about 1 in 10 criminal incidents, with common assault accountingfor nearly two-thirds of these. The total violent crime rate dropped by 2%.
• After reaching a 36-year low in 2003, the homicide rate increased by 12% in 2004. Police reported 622 victims of homicidein 2004, 73 more than the previous year. This resulted in a rate of 1.9 homicides per 100,000 population, 5% lower than adecade ago. The rate of attempted murders remained stable in 2004.
• There were about 27,000 robberies in 2004, a 4% drop in the rate from 2003. This resumed the general downward trendevident since 1996. Robberies with firearms decreased 3% in 2004.
• Nearly 1.3 million property crimes were reported in 2004, with thefts of $5,000 and under accounting for slightly more thanhalf of these. The property crime rate was 3% lower than in 2003. Most property crimes declined, with the exception ofpossession of stolen goods and fraud which increased by 6% and 4% respectively.
• Break-ins resumed their downward trend following the first increase in more than 10 years in 2003. There were about275,000 break-ins, 4% lower than the previous year. There were nearly 170,000 motor vehicle thefts in 2004, resulting in a4% drop in the vehicle theft rate.
• In 2003, police reported a large drop in cannabis incidents as a result of a climate of uncertainty within the law enforcementcommunity given the introduction of legislation to decriminalize possession of small amounts of cannabis. In 2004, however,the rate of cannabis incidents resumed its upward trend, with a 10% increase. Cannabis possession comprised 7 in10 cannabis offences.
• The youth crime rate dropped 4% in 2004. The rate of youths charged by police dropped 6%, while the rate of youthscleared by means other than a formal charge declined 2%.
2 Statistics Canada – Catalogue no. 85-002, Vol. 25, no. 5
Ordering and subscription informationAll prices exclude sales taxThis product, Catalogue no. 85-002-XPE,is published as a standard printed publication ata price of CAN$11.00 per issue and CAN$100.00for a one-year subscription.ISSN 0715-271XThe following additional shipping charges applyfor delivery outside Canada:
Single Annualissue subscription
United States CAN$6.00 CAN$78.00Other countries CAN$10.00 CAN$130.00This product is also available in electronic formaton the Statistics Canada Internet site asCatalogue no. 85-002-XIE at a price of CAN$9.00per issue and CAN$75.00 for a one-yearsubscription. To obtain single issues or tosubscribe, visit our website at ww.statcan.ca,and select Our Products and Services.ISSN 1209-6393July 2005Published by authority of the Ministerresponsible for Statistics Canada.© Minister of Industry, 2005
All rights reserved. Use of this product is limitedto the licensee and its employees. The productcannot be reproduced and transmitted to anyperson or organization outside of the licensee’sorganization.Reasonable rights of use of the content of thisproduct are granted solely for personal, corporate orpublic policy research, or educational purposes.This permission includes the use of the content inanalyses and the reporting of results andconclusions, including the citation of limitedamounts of supporting data extracted from the dataproduct in these documents. These materials aresolely for non-commercial purposes. In such cases,the source of the data must be acknowledged asfollows: Source (or “Adapted from”, if appropriate):Statistics Canada, name of product, catalogue,volume and issue numbers, reference period andpage(s). Otherwise, users shall seek prior writtenpermission of Licensing Services, MarketingDivision, Statistics Canada, Ottawa, Ontario, Canada,K1A 0T6.
Note of appreciationCanada owes the success of its statisticalsystem to a long-standing partnership betweenStatistics Canada, the citizens of Canada, itsbusinesses and governments. Accurate andtimely statistical information could not beproduced without their continued cooperationand goodwill.
Standards of service to the publicStatistics Canada is committed to serving itsclients in a prompt, reliable and courteousmanner and in the official language of theirchoice. To this end, the agency has developedstandards of service which its employeesobserve in serving its clients. To obtain a copyof these service standards, please contactStatistics Canada toll free at 1 800 263-1136.Theservice standards are also published onwww.statcan.ca under About Statistics Canada >Providing services to Canadians.The paper used in this publication meetsthe minimum requirements of American nationalStandard for Information Sciences – Perma-nence of Paper for Printed Library Materials,ANSI Z39.48 – 1984. ∞
1. Maire Gannon, 2005, General Social Survey, Cycle 18: an overview of findings, Catalogue 85-565-XIE,Statistics Canada.
2. A detailed analysis will be available in the report Criminal Victimization in Canada, Juristat, StatisticsCanada, forthcoming.
3. Besserer, S and Trainor, C., 2000, “Criminal Victimization in Canada”, Juristat, Catalogue 85-002,Vol. 20, no. 10, p. 11 & 12, Statistics Canada.
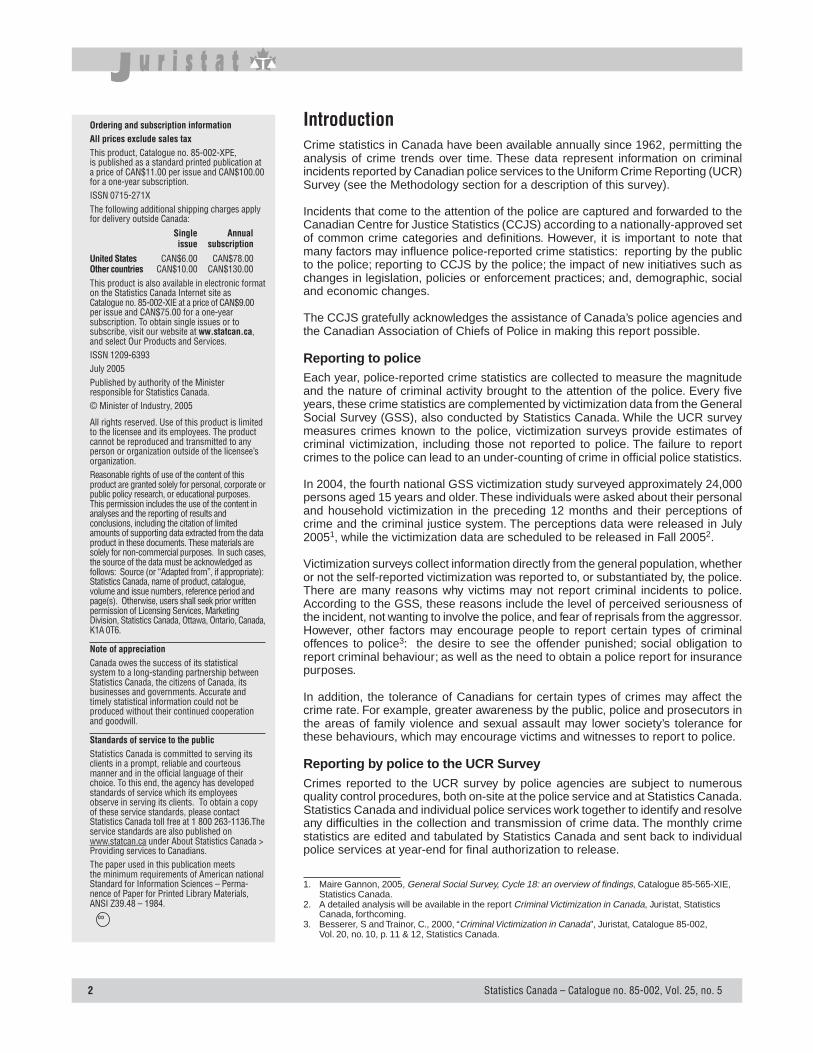
IntroductionCrime statistics in Canada have been available annually since 1962, permitting theanalysis of crime trends over time. These data represent information on criminalincidents reported by Canadian police services to the Uniform Crime Reporting (UCR)Survey (see the Methodology section for a description of this survey).
Incidents that come to the attention of the police are captured and forwarded to theCanadian Centre for Justice Statistics (CCJS) according to a nationally-approved setof common crime categories and definitions. However, it is important to note thatmany factors may influence police-reported crime statistics: reporting by the publicto the police; reporting to CCJS by the police; the impact of new initiatives such aschanges in legislation, policies or enforcement practices; and, demographic, socialand economic changes.
The CCJS gratefully acknowledges the assistance of Canada’s police agencies andthe Canadian Association of Chiefs of Police in making this report possible.
Reporting to policeEach year, police-reported crime statistics are collected to measure the magnitudeand the nature of criminal activity brought to the attention of the police. Every fiveyears, these crime statistics are complemented by victimization data from the GeneralSocial Survey (GSS), also conducted by Statistics Canada. While the UCR surveymeasures crimes known to the police, victimization surveys provide estimates ofcriminal victimization, including those not reported to police. The failure to reportcrimes to the police can lead to an under-counting of crime in official police statistics.
In 2004, the fourth national GSS victimization study surveyed approximately 24,000persons aged 15 years and older. These individuals were asked about their personaland household victimization in the preceding 12 months and their perceptions ofcrime and the criminal justice system. The perceptions data were released in July20051, while the victimization data are scheduled to be released in Fall 20052.
Victimization surveys collect information directly from the general population, whetheror not the self-reported victimization was reported to, or substantiated by, the police.There are many reasons why victims may not report criminal incidents to police.According to the GSS, these reasons include the level of perceived seriousness ofthe incident, not wanting to involve the police, and fear of reprisals from the aggressor.However, other factors may encourage people to report certain types of criminaloffences to police3: the desire to see the offender punished; social obligation toreport criminal behaviour; as well as the need to obtain a police report for insurancepurposes.
In addition, the tolerance of Canadians for certain types of crimes may affect thecrime rate. For example, greater awareness by the public, police and prosecutors inthe areas of family violence and sexual assault may lower society’s tolerance forthese behaviours, which may encourage victims and witnesses to report to police.
Reporting by police to the UCR SurveyCrimes reported to the UCR survey by police agencies are subject to numerousquality control procedures, both on-site at the police service and at Statistics Canada.Statistics Canada and individual police services work together to identify and resolveany difficulties in the collection and transmission of crime data. The monthly crimestatistics are edited and tabulated by Statistics Canada and sent back to individualpolice services at year-end for final authorization to release.
Statistics Canada – Catalogue no. 85-002, Vol. 25, no. 5 3
Changes in legislation, policies and practicesChanges in legislation, policies and police enforcementpractices may also have an impact on police-reported statistics.When an amendment to the Criminal Code creates a newoffence or broadens the definition of an existing offence, thenumber of incidents reported to police and by police will likelyincrease or decrease in reaction to these changes.
Changes in police enforcement practices, such as specialoperations to target certain types of crimes, will be reflected inofficial crime statistics. For certain crimes, the number ofoffences reported is largely driven by police enforcement.Crimes such as prostitution and drug offences are most oftenidentified through police-enforcement activities or proactivepolicing, and are rarely reported by the public.
With the implementation of the Youth Criminal Justice Act(YCJA) in April 2003, police services adjusted their policies totry and follow the principles set out in the YCJA to reduce youthcontact with the formal justice system. Police-reported dataconfirm this, as the number of youths formally charged havedropped in both 2003 and 2004, while the number of youthscleared by means other than a charge increased in 2003 anddecreased slightly in 2004.
Social, economic and demographic factors affectingthe crime rateIn terms of demographics, persons aged 15 to 24 have higherrates of offending and of being victims of crime than other agegroups. In 2004, persons aged 15 to 24 represented 14% ofthe Canadian population while accounting for 32% of thoseaccused of property crimes and 42% of those accused ofviolent crimes. Decreasing crime rates in the 1990s havefrequently been explained by changing demographics duringthe same period, as the proportion of young persons in theoverall population continues to decline. As well, unemploymentand measures of poverty and inequality are frequently citedas factors influencing crime rates.
A recent study4 further explored the relationship betweenselected crime trends (for the offences of homicide, robbery,break and enter and motor vehicle theft) and various demo-graphic and economic changes such as the age compositionof the population, unemployment, inflation and alcohol con-sumption. Results show that different factors have a differentassociation, depending on the type of crime being examined.For example, shifts in the age composition of the populationwere found to be associated with shifts in break and enter butwere not statistically significant for the other crime types beingstudied. Shifts in inflation were found to be associated withchanges in financially-motivated crimes: robbery, motor vehicletheft and break and enter. Finally, shifts in alcohol consumptionand the unemployment rate were found to be associated withshifts in the homicide rate. For a more detailed analysisconcerning crimes and socio-demographic and economictrends, consult the report Exploring Crime Patterns in Canada,released by Statistics Canada.
2004 Crime DataIn 2004, nearly 2.6 million Criminal Code incidents (excludingtraffic incidents and other federal statutes such as drug
offences) were reported by police. Of these, 12% were violentcrimes, 50% were property crimes, and the remaining 39%were other Criminal Code offences such as mischief, counter-feiting, disturbing the peace and bail violations (Table 1).Twenty-five years ago this distribution was quite different, withviolent crimes accounting for 8%, property 64% and otherCriminal Code 28%.
In addition, there were close to 119,000 Criminal Code trafficincidents (of which two-thirds were for impaired driving), 97,000drug incidents and more than 34,000 other federal statuteincidents (e.g. Immigration and Refugee Protection Act, CanadaShipping Act). In total, police reported 2.8 million criminalincidents in 2004.
It is important to note that when making comparisons (acrossprovinces, CMAs or historically), UCR data are subject tocertain data quality limitations which are detailed in theMethodology section under “Data Revisions / Notes”.
Following an increase in 2003, the crime ratedropped slightly in 2004While the number of homicides and drug incidents increasedin 2004, most crimes were on the decline. After having recordedthe first increase in crime in more than 10 years in 2003 (+6%),the crime rate decreased slightly (-1%) in 2004. Both the violent
Text Box 1 : Key terminology and definitions
Criminal IncidentOne incident can include more than one offence. For incidents involving multipleoffences, only the most serious offence in the incident is counted. Except forrobbery, violent crime counts reflect the number of victims in the incident,whereas non-violent crime counts reflect the number of incidents or occurrencesof crime.
Crime rateCrime rates are based on the number of incidents reported to police per 100,000population. Rates are used to make comparisons among geographic areaswith different populations and over time. The “crime rate” represents allCriminal Code incidents excluding traffic violations and other federalstatutes, such as drug offences.
Accused personsIncludes all persons identified by police as having committed a crime, andagainst whom enough evidence exists to lay a charge, regardless of whetherthey have been formally charged with an offence.
Persons cleared by chargeThis term refers to persons who have been formally charged or recommendedto be charged by police.
Persons cleared otherwiseThis term refers to people who have not been formally charged by police,though there is sufficient evidence for the police to do so. This could occur fora number of reasons: the police used extrajudicial measures (see Youth Crimesection), the police may have used discretion and decided not to lay a charge,the complainant did not want police to lay a charge, the accused was involvedin other incidents in which one or more charges were laid, or death of theaccused.
For more information on the Uniform Crime Reporting Survey, refer to theMethodology section at the end of this report.
4. Holly Johnson and Valerie Potte Bunge, 2005, Exploring Crime Trends inCanada, Catalogue 85-561-XPE, no. 5, Statistics Canada.
4 Statistics Canada – Catalogue no. 85-002, Vol. 25, no. 5
0
2,000
4,000
6,000
8,000
10,000
12,000
1962 1968 1974 1980 1986 1992 1998 2004
Rate per 100,000 population
Total Criminal Code
Property Crimes
Violent Crimes
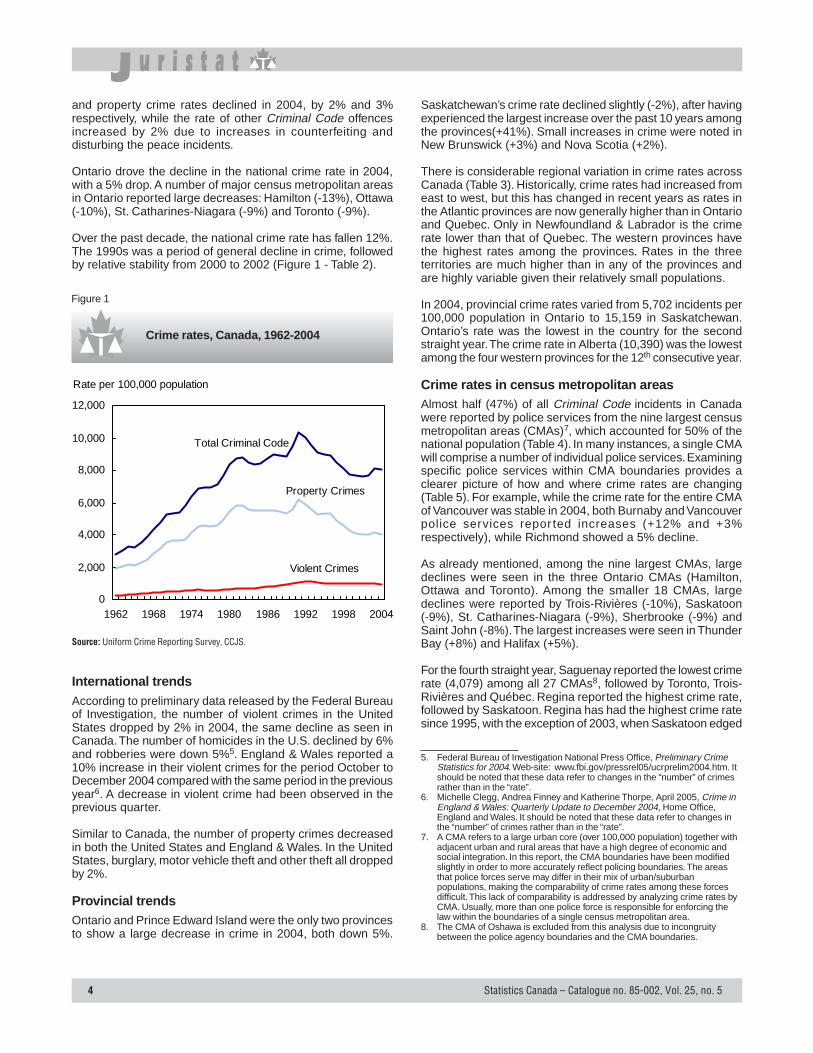
and property crime rates declined in 2004, by 2% and 3%respectively, while the rate of other Criminal Code offencesincreased by 2% due to increases in counterfeiting anddisturbing the peace incidents.
Ontario drove the decline in the national crime rate in 2004,with a 5% drop. A number of major census metropolitan areasin Ontario reported large decreases: Hamilton (-13%), Ottawa(-10%), St. Catharines-Niagara (-9%) and Toronto (-9%).
Over the past decade, the national crime rate has fallen 12%.The 1990s was a period of general decline in crime, followedby relative stability from 2000 to 2002 (Figure 1 - Table 2).
Crime rates, Canada, 1962-2004
Figure 1
Source: Uniform Crime Reporting Survey, CCJS.
International trendsAccording to preliminary data released by the Federal Bureauof Investigation, the number of violent crimes in the UnitedStates dropped by 2% in 2004, the same decline as seen inCanada. The number of homicides in the U.S. declined by 6%and robberies were down 5%5. England & Wales reported a10% increase in their violent crimes for the period October toDecember 2004 compared with the same period in the previousyear6. A decrease in violent crime had been observed in theprevious quarter.
Similar to Canada, the number of property crimes decreasedin both the United States and England & Wales. In the UnitedStates, burglary, motor vehicle theft and other theft all droppedby 2%.
Provincial trendsOntario and Prince Edward Island were the only two provincesto show a large decrease in crime in 2004, both down 5%.
Saskatchewan’s crime rate declined slightly (-2%), after havingexperienced the largest increase over the past 10 years amongthe provinces(+41%). Small increases in crime were noted inNew Brunswick (+3%) and Nova Scotia (+2%).
There is considerable regional variation in crime rates acrossCanada (Table 3). Historically, crime rates had increased fromeast to west, but this has changed in recent years as rates inthe Atlantic provinces are now generally higher than in Ontarioand Quebec. Only in Newfoundland & Labrador is the crimerate lower than that of Quebec. The western provinces havethe highest rates among the provinces. Rates in the threeterritories are much higher than in any of the provinces andare highly variable given their relatively small populations.
In 2004, provincial crime rates varied from 5,702 incidents per100,000 population in Ontario to 15,159 in Saskatchewan.Ontario’s rate was the lowest in the country for the secondstraight year. The crime rate in Alberta (10,390) was the lowestamong the four western provinces for the 12th consecutive year.
Crime rates in census metropolitan areasAlmost half (47%) of all Criminal Code incidents in Canadawere reported by police services from the nine largest censusmetropolitan areas (CMAs)7, which accounted for 50% of thenational population (Table 4). In many instances, a single CMAwill comprise a number of individual police services. Examiningspecific police services within CMA boundaries provides aclearer picture of how and where crime rates are changing(Table 5). For example, while the crime rate for the entire CMAof Vancouver was stable in 2004, both Burnaby and Vancouverpolice services repor ted increases (+12% and +3%respectively), while Richmond showed a 5% decline.
As already mentioned, among the nine largest CMAs, largedeclines were seen in the three Ontario CMAs (Hamilton,Ottawa and Toronto). Among the smaller 18 CMAs, largedeclines were reported by Trois-Rivières (-10%), Saskatoon(-9%), St. Catharines-Niagara (-9%), Sherbrooke (-9%) andSaint John (-8%). The largest increases were seen in ThunderBay (+8%) and Halifax (+5%).
For the fourth straight year, Saguenay reported the lowest crimerate (4,079) among all 27 CMAs8, followed by Toronto, Trois-Rivières and Québec. Regina reported the highest crime rate,followed by Saskatoon. Regina has had the highest crime ratesince 1995, with the exception of 2003, when Saskatoon edged
5. Federal Bureau of Investigation National Press Office, Preliminary CrimeStatistics for 2004. Web-site: www.fbi.gov/pressrel05/ucrprelim2004.htm. Itshould be noted that these data refer to changes in the “number” of crimesrather than in the “rate”.
6. Michelle Clegg, Andrea Finney and Katherine Thorpe, April 2005, Crime inEngland & Wales: Quarterly Update to December 2004, Home Office,England and Wales. It should be noted that these data refer to changes inthe “number” of crimes rather than in the “rate”.
7. A CMA refers to a large urban core (over 100,000 population) together withadjacent urban and rural areas that have a high degree of economic andsocial integration. In this report, the CMA boundaries have been modifiedslightly in order to more accurately reflect policing boundaries. The areasthat police forces serve may differ in their mix of urban/suburbanpopulations, making the comparability of crime rates among these forcesdifficult. This lack of comparability is addressed by analyzing crime rates byCMA. Usually, more than one police force is responsible for enforcing thelaw within the boundaries of a single census metropolitan area.
8. The CMA of Oshawa is excluded from this analysis due to incongruitybetween the police agency boundaries and the CMA boundaries.
Statistics Canada – Catalogue no. 85-002, Vol. 25, no. 5 5
higher. However, Saskatoon’s 9% drop in crime in 2004 wasone of the largest year over year decrease among CMAs under500,000 population. Other CMAs with a crime rate of over10,000 were all in the western provinces and includedAbbotsford, Winnipeg, Vancouver, Edmonton and Victoria.
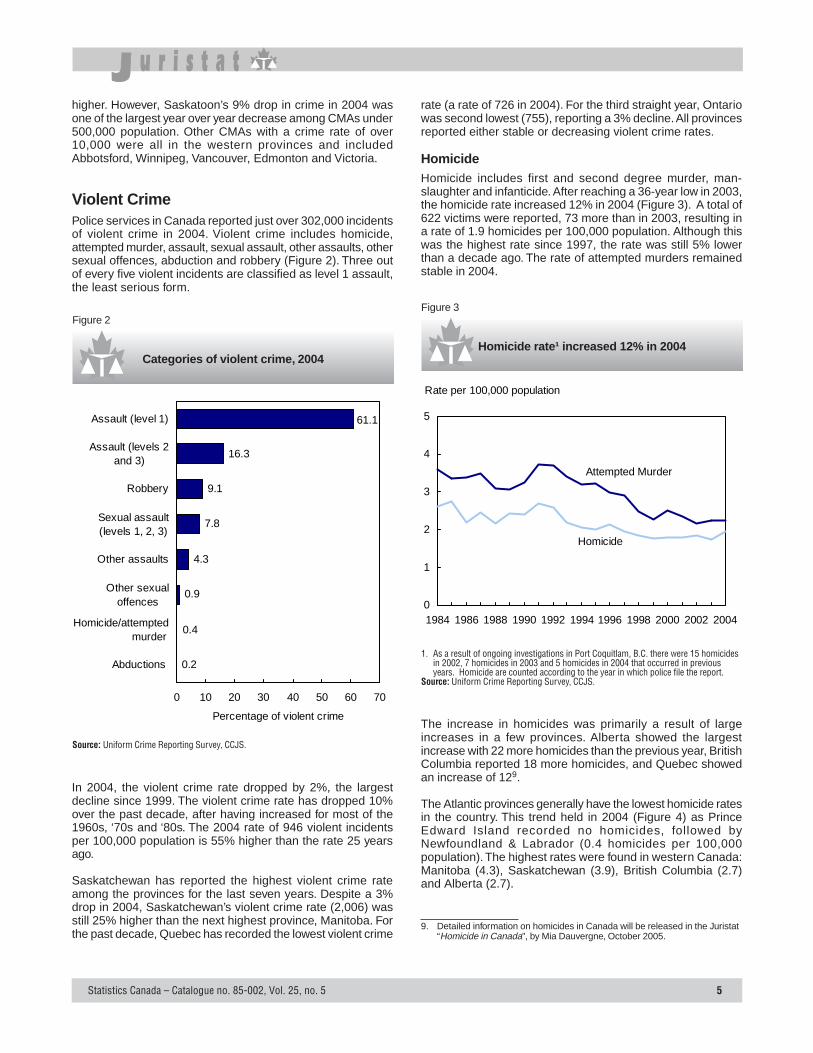
Violent CrimePolice services in Canada reported just over 302,000 incidentsof violent crime in 2004. Violent crime includes homicide,attempted murder, assault, sexual assault, other assaults, othersexual offences, abduction and robbery (Figure 2). Three outof every five violent incidents are classified as level 1 assault,the least serious form.
Categories of violent crime, 2004
Figure 2
Source: Uniform Crime Reporting Survey, CCJS.
61.1
16.3
9.1
7.8
4.3
0.9
0.4
0.2
0 10 20 30 40 50 60 70
Abductions
Homicide/attempted murder
Other sexualoffences
Other assaults
Sexual assault(levels 1, 2, 3)
Robbery
Assault (levels 2and 3)
Assault (level 1)
Percentage of violent crime
In 2004, the violent crime rate dropped by 2%, the largestdecline since 1999. The violent crime rate has dropped 10%over the past decade, after having increased for most of the1960s, ‘70s and ‘80s. The 2004 rate of 946 violent incidentsper 100,000 population is 55% higher than the rate 25 yearsago.
Saskatchewan has reported the highest violent crime rateamong the provinces for the last seven years. Despite a 3%drop in 2004, Saskatchewan’s violent crime rate (2,006) wasstill 25% higher than the next highest province, Manitoba. Forthe past decade, Quebec has recorded the lowest violent crime
rate (a rate of 726 in 2004). For the third straight year, Ontariowas second lowest (755), reporting a 3% decline. All provincesreported either stable or decreasing violent crime rates.
HomicideHomicide includes first and second degree murder, man-slaughter and infanticide. After reaching a 36-year low in 2003,the homicide rate increased 12% in 2004 (Figure 3). A total of622 victims were reported, 73 more than in 2003, resulting ina rate of 1.9 homicides per 100,000 population. Although thiswas the highest rate since 1997, the rate was still 5% lowerthan a decade ago. The rate of attempted murders remainedstable in 2004.
Homicide rate¹ increased 12% in 2004
Figure 3
1. As a result of ongoing investigations in Port Coquitlam, B.C. there were 15 homicidesin 2002, 7 homicides in 2003 and 5 homicides in 2004 that occurred in previousyears. Homicide are counted according to the year in which police file the report.
Source: Uniform Crime Reporting Survey, CCJS.
0
1
2
3
4
5
1984 1986 1988 1990 1992 1994 1996 1998 2000 2002 2004
Rate per 100,000 population
Attempted Murder
Homicide
The increase in homicides was primarily a result of largeincreases in a few provinces. Alberta showed the largestincrease with 22 more homicides than the previous year, BritishColumbia reported 18 more homicides, and Quebec showedan increase of 129.
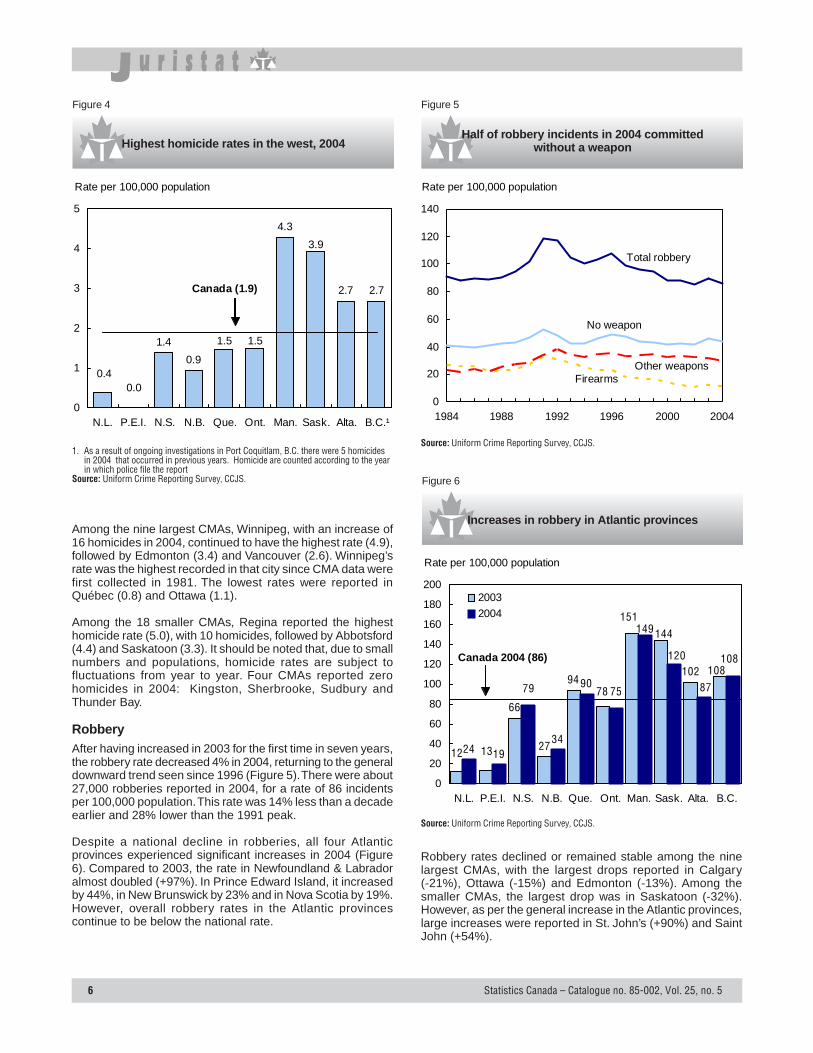
The Atlantic provinces generally have the lowest homicide ratesin the country. This trend held in 2004 (Figure 4) as PrinceEdward Island recorded no homicides, followed byNewfoundland & Labrador (0.4 homicides per 100,000population). The highest rates were found in western Canada:Manitoba (4.3), Saskatchewan (3.9), British Columbia (2.7)and Alberta (2.7).
9. Detailed information on homicides in Canada will be released in the Juristat“Homicide in Canada”, by Mia Dauvergne, October 2005.
6 Statistics Canada – Catalogue no. 85-002, Vol. 25, no. 5
0
20
40
60
80
100
120
140
1984 1988 1992 1996 2000 2004
Rate per 100,000 population
Total robbery
Other weapons
No weapon
Firearms
Highest homicide rates in the west, 2004
Figure 4
1. As a result of ongoing investigations in Port Coquitlam, B.C. there were 5 homicidesin 2004 that occurred in previous years. Homicide are counted according to the yearin which police file the report
Source: Uniform Crime Reporting Survey, CCJS.
1.4
0.9
4.3
2.7 2.7
1.5
3.9
0.00.4
1.5
0
1
2
3
4
5
N.L. P.E.I. N.S. N.B. Que. Ont. Man. Sask. Alta. B.C.¹
Rate per 100,000 population
Canada (1.9)
Among the nine largest CMAs, Winnipeg, with an increase of16 homicides in 2004, continued to have the highest rate (4.9),followed by Edmonton (3.4) and Vancouver (2.6). Winnipeg’srate was the highest recorded in that city since CMA data werefirst collected in 1981. The lowest rates were reported inQuébec (0.8) and Ottawa (1.1).
Among the 18 smaller CMAs, Regina reported the highesthomicide rate (5.0), with 10 homicides, followed by Abbotsford(4.4) and Saskatoon (3.3). It should be noted that, due to smallnumbers and populations, homicide rates are subject tofluctuations from year to year. Four CMAs reported zerohomicides in 2004: Kingston, Sherbrooke, Sudbury andThunder Bay.
RobberyAfter having increased in 2003 for the first time in seven years,the robbery rate decreased 4% in 2004, returning to the generaldownward trend seen since 1996 (Figure 5). There were about27,000 robberies reported in 2004, for a rate of 86 incidentsper 100,000 population. This rate was 14% less than a decadeearlier and 28% lower than the 1991 peak.
Despite a national decline in robberies, all four Atlanticprovinces experienced significant increases in 2004 (Figure6). Compared to 2003, the rate in Newfoundland & Labradoralmost doubled (+97%). In Prince Edward Island, it increasedby 44%, in New Brunswick by 23% and in Nova Scotia by 19%.However, overall robbery rates in the Atlantic provincescontinue to be below the national rate.
Robbery rates declined or remained stable among the ninelargest CMAs, with the largest drops reported in Calgary(-21%), Ottawa (-15%) and Edmonton (-13%). Among thesmaller CMAs, the largest drop was in Saskatoon (-32%).However, as per the general increase in the Atlantic provinces,large increases were reported in St. John’s (+90%) and SaintJohn (+54%).
Half of robbery incidents in 2004 committedwithout a weapon
Figure 5
Source: Uniform Crime Reporting Survey, CCJS.
Increases in robbery in Atlantic provinces
Figure 6
Source: Uniform Crime Reporting Survey, CCJS.
66
27
94102
24 1934
90
151
108
144
1312
78
149
108
87
120
79 75
0
20
40
60
80
100
120
140
160
180
200
N.L. P.E.I. N.S. N.B. Que. Ont. Man. Sask. Alta. B.C.
2003
2004
Rate per 100,000 population
Canada 2004 (86)
Statistics Canada – Catalogue no. 85-002, Vol. 25, no. 5 7
Text Box 2: Characteristics of robbery in Canada
Location – In 2004, about 4 out of 10 robberies were committed in commercialestablishments: 16% in convenience stores and gas stations, 5% in banksand 20% in other commercial locations such as restaurants. Streets and roadswere the next most common location (30%), followed by private residences(8%), parking lots (6%) and open areas (5%).
One recent trend has been the increase in robberies committed on publictransit and in transit stations. Although the numbers are small, the proportionof robberies occurring in these areas has more than doubled over the past7 years, from 1.6% of all robberies in 1998 to 3.5% in 2004. These facilitiesinclude buses, subways and all other public transit facilities.
Weapons – In 2004, half (51%) of all robberies were committed without aweapon, similar to the previous year. Of the 27,000 robbery incidents reportedby police, 14% were committed with a firearm and the remaining 35% with aweapon other than a firearm. Handguns are the most common type of firearmpresent during robberies, accounting for more than four out of every five firearmrobberies. Knives accounted for three out of every five robberies committedwith a weapon other than a firearm in 2004.
Following an increase in 2003, the rate of firearm robbery resumed its downwardtrend evident since 1991, with a 3% drop in 2004 (Figure 5). Since 1991, therate has decreased 63%. The rates of robberies committed with a weaponother than a firearm (-5%) and without a weapon (-4%) both decreased aswell.
Weapons by location – Police-reported data show that, in 2004, the type ofweapon used to commit a robbery varies by the location of the robbery. In 3 outof every 5 robberies in public transit facilities, physical force was most commonlyused by the attacker. For robberies committed in convenience stores and gasstations, a little less than 4 out of 10 were committed with a knife or othercutting instrument. Three out of ten bank robberies were committed with afirearm. In residential robberies, physical force was most commonly used.
Multiple attackers - Of all incidents of robbery in a public place10 (which accountfor more than 2 in 5 robberies) occurring in 2004, 8% involved more than oneattacker, sometimes referred to as “swarming”. The locations most frequent forthis type of robbery were schools, where one in every five robberies involvedmultiple accused.
Sources: Canadian Centre for Justice Statistics, UCR2 Research Database,UCR2 Trend Database, UCR Aggregate Database.
Despite a 2% decrease in 2004, Winnipeg11 still reported thehighest robbery rate (229 incidents per 100,000 population)among all 27 CMAs, followed by Regina (211), Saskatoon (209)and Halifax (161). The lowest rates were found in Saguenay(18) and Sudbury (41).
Sexual assaultSexual assault is classified into one of three levels accordingto the seriousness of the incident: level 1 (the category of leastphysical injury to the victim); level 2 (sexual assault with aweapon, threats to use a weapon, or causing bodily harm);and level 3 (sexual assault that wounds, maims, disfigures orendangers the life of the victim). Among the more than 23,000sexual assaults reported by police in 2004, 98% were classifiedas level 1.
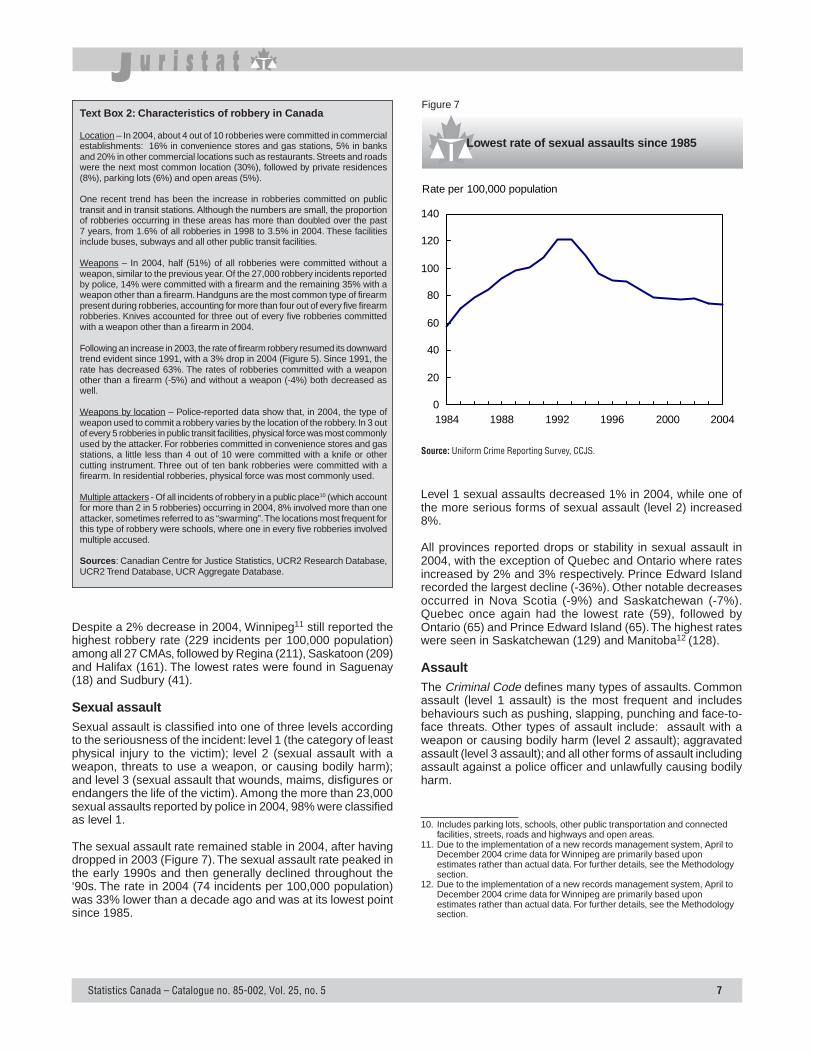
The sexual assault rate remained stable in 2004, after havingdropped in 2003 (Figure 7). The sexual assault rate peaked inthe early 1990s and then generally declined throughout the‘90s. The rate in 2004 (74 incidents per 100,000 population)was 33% lower than a decade ago and was at its lowest pointsince 1985.
Lowest rate of sexual assaults since 1985
Figure 7
Source: Uniform Crime Reporting Survey, CCJS.
0
20
40
60
80
100
120
140
1984 1988 1992 1996 2000 2004
Rate per 100,000 population
10. Includes parking lots, schools, other public transportation and connectedfacilities, streets, roads and highways and open areas.
11. Due to the implementation of a new records management system, April toDecember 2004 crime data for Winnipeg are primarily based uponestimates rather than actual data. For further details, see the Methodologysection.
12. Due to the implementation of a new records management system, April toDecember 2004 crime data for Winnipeg are primarily based uponestimates rather than actual data. For further details, see the Methodologysection.
Level 1 sexual assaults decreased 1% in 2004, while one ofthe more serious forms of sexual assault (level 2) increased8%.
All provinces reported drops or stability in sexual assault in2004, with the exception of Quebec and Ontario where ratesincreased by 2% and 3% respectively. Prince Edward Islandrecorded the largest decline (-36%). Other notable decreasesoccurred in Nova Scotia (-9%) and Saskatchewan (-7%).Quebec once again had the lowest rate (59), followed byOntario (65) and Prince Edward Island (65). The highest rateswere seen in Saskatchewan (129) and Manitoba12 (128).
AssaultThe Criminal Code defines many types of assaults. Commonassault (level 1 assault) is the most frequent and includesbehaviours such as pushing, slapping, punching and face-to-face threats. Other types of assault include: assault with aweapon or causing bodily harm (level 2 assault); aggravatedassault (level 3 assault); and all other forms of assault includingassault against a police officer and unlawfully causing bodilyharm.
8 Statistics Canada – Catalogue no. 85-002, Vol. 25, no. 5
0
200
400
600
800
1,000
1,200
1,400
1,600
1,800
1984 1988 1992 1996 2000 2004
Rate per 100,000 population
Total breaking and entering
Business premises
Residences
Other premises
1.4
2.8
7.6
13.3
21.5
53.4
0 10 20 30 40 50 60
Theft over $5,000
Possession of stolen goods
Fraud
Motor vehicle theft
Break-ins
Theft $5,000 & under
Percentage of Property Crime
In 2004, police reported about 234,000 assaults, resulting in arate of 732 assaults per 100,000 population. This was 2% lowerthan 2003 and 5% below the rate a decade earlier.
Common assaults, which account for 4 out of every 5 assaultincidents, decreased by 3% in 2004. Level 3 assaults alsodeclined, down 8%. However, level 2 assaults increased slightly(+2%) for the 5th consecutive year, and are one of the fewviolent crimes to be showing an increase (+12%) over the pastdecade.
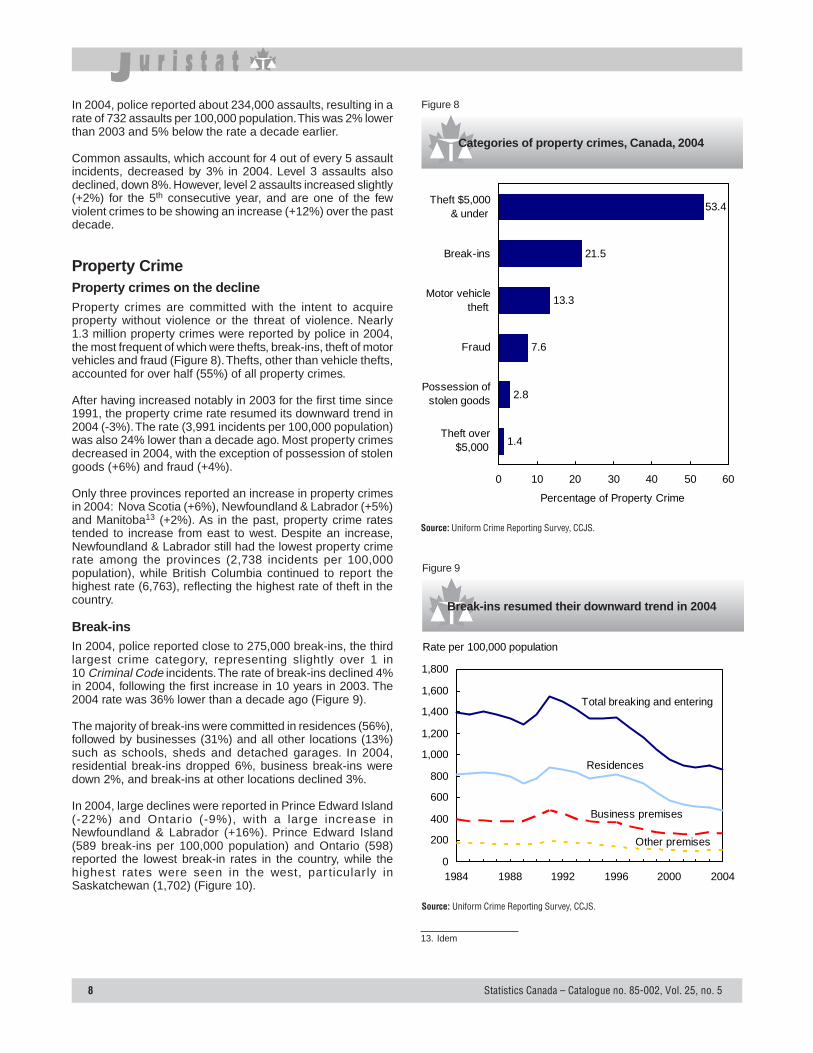
Property CrimeProperty crimes on the declineProperty crimes are committed with the intent to acquireproperty without violence or the threat of violence. Nearly1.3 million property crimes were reported by police in 2004,the most frequent of which were thefts, break-ins, theft of motorvehicles and fraud (Figure 8). Thefts, other than vehicle thefts,accounted for over half (55%) of all property crimes.
After having increased notably in 2003 for the first time since1991, the property crime rate resumed its downward trend in2004 (-3%). The rate (3,991 incidents per 100,000 population)was also 24% lower than a decade ago. Most property crimesdecreased in 2004, with the exception of possession of stolengoods (+6%) and fraud (+4%).
Only three provinces reported an increase in property crimesin 2004: Nova Scotia (+6%), Newfoundland & Labrador (+5%)and Manitoba13 (+2%). As in the past, property crime ratestended to increase from east to west. Despite an increase,Newfoundland & Labrador still had the lowest property crimerate among the provinces (2,738 incidents per 100,000population), while British Columbia continued to report thehighest rate (6,763), reflecting the highest rate of theft in thecountry.
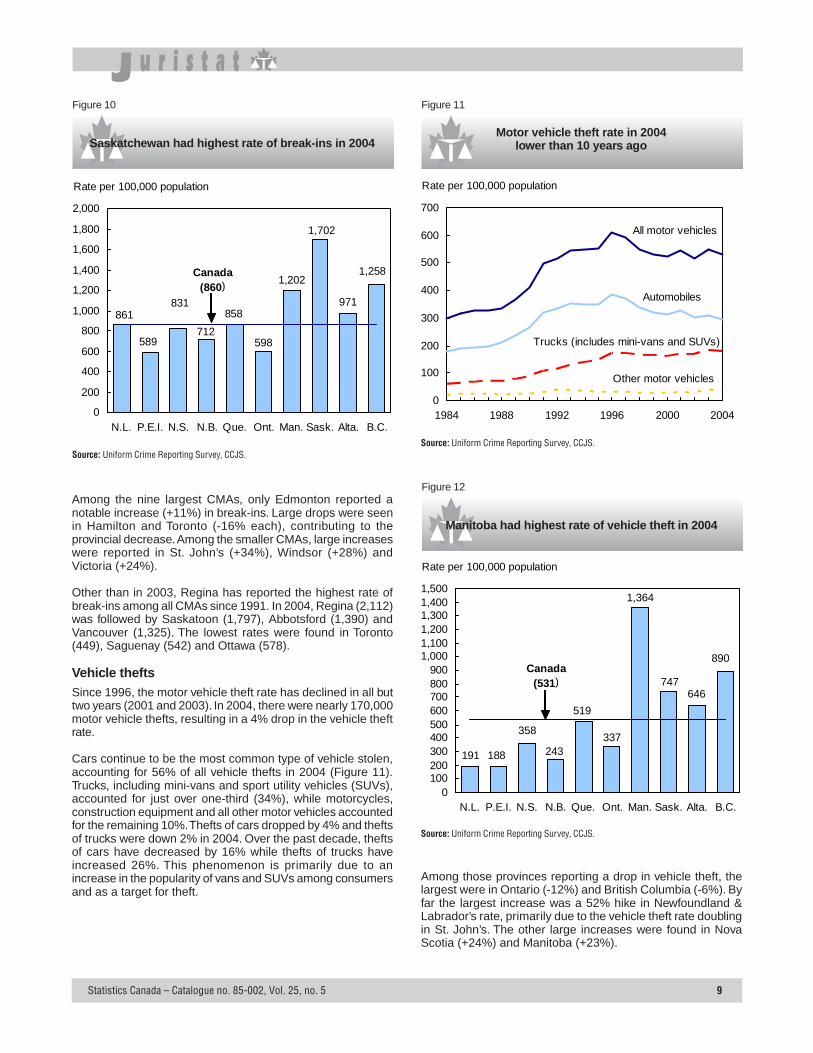
Break-insIn 2004, police reported close to 275,000 break-ins, the thirdlargest crime category, representing slightly over 1 in10 Criminal Code incidents. The rate of break-ins declined 4%in 2004, following the first increase in 10 years in 2003. The2004 rate was 36% lower than a decade ago (Figure 9).
The majority of break-ins were committed in residences (56%),followed by businesses (31%) and all other locations (13%)such as schools, sheds and detached garages. In 2004,residential break-ins dropped 6%, business break-ins weredown 2%, and break-ins at other locations declined 3%.
In 2004, large declines were reported in Prince Edward Island(-22%) and Ontario (-9%), with a large increase inNewfoundland & Labrador (+16%). Prince Edward Island(589 break-ins per 100,000 population) and Ontario (598)reported the lowest break-in rates in the country, while thehighest rates were seen in the west, par ticular ly inSaskatchewan (1,702) (Figure 10).
Categories of property crimes, Canada, 2004
Figure 8
Source: Uniform Crime Reporting Survey, CCJS.
Break-ins resumed their downward trend in 2004
Figure 9
Source: Uniform Crime Reporting Survey, CCJS.
13. Idem
Statistics Canada – Catalogue no. 85-002, Vol. 25, no. 5 9
646
1,364
243337
519
890
191 188
358
747Canada
(531)
0100200300400500600700800900
1,0001,1001,2001,3001,4001,500
N.L. P.E.I. N.S. N.B. Que. Ont. Man. Sask. Alta. B.C.
Rate per 100,000 population
0
100
200
300
400
500
600
700
1984 1988 1992 1996 2000 2004
Rate per 100,000 population
All motor vehicles
Automobiles
Trucks (includes mini-vans and SUVs)
Other motor vehicles
Saskatchewan had highest rate of break-ins in 2004
Figure 10
Source: Uniform Crime Reporting Survey, CCJS.
971
1,202
712598
858
1,258
861
589
831
1,702
Canada (860)
0
200
400
600
800
1,000
1,200
1,400
1,600
1,800
2,000
N.L. P.E.I. N.S. N.B. Que. Ont. Man. Sask. Alta. B.C.
Rate per 100,000 population
Among the nine largest CMAs, only Edmonton reported anotable increase (+11%) in break-ins. Large drops were seenin Hamilton and Toronto (-16% each), contributing to theprovincial decrease. Among the smaller CMAs, large increaseswere reported in St. John’s (+34%), Windsor (+28%) andVictoria (+24%).
Other than in 2003, Regina has reported the highest rate ofbreak-ins among all CMAs since 1991. In 2004, Regina (2,112)was followed by Saskatoon (1,797), Abbotsford (1,390) andVancouver (1,325). The lowest rates were found in Toronto(449), Saguenay (542) and Ottawa (578).
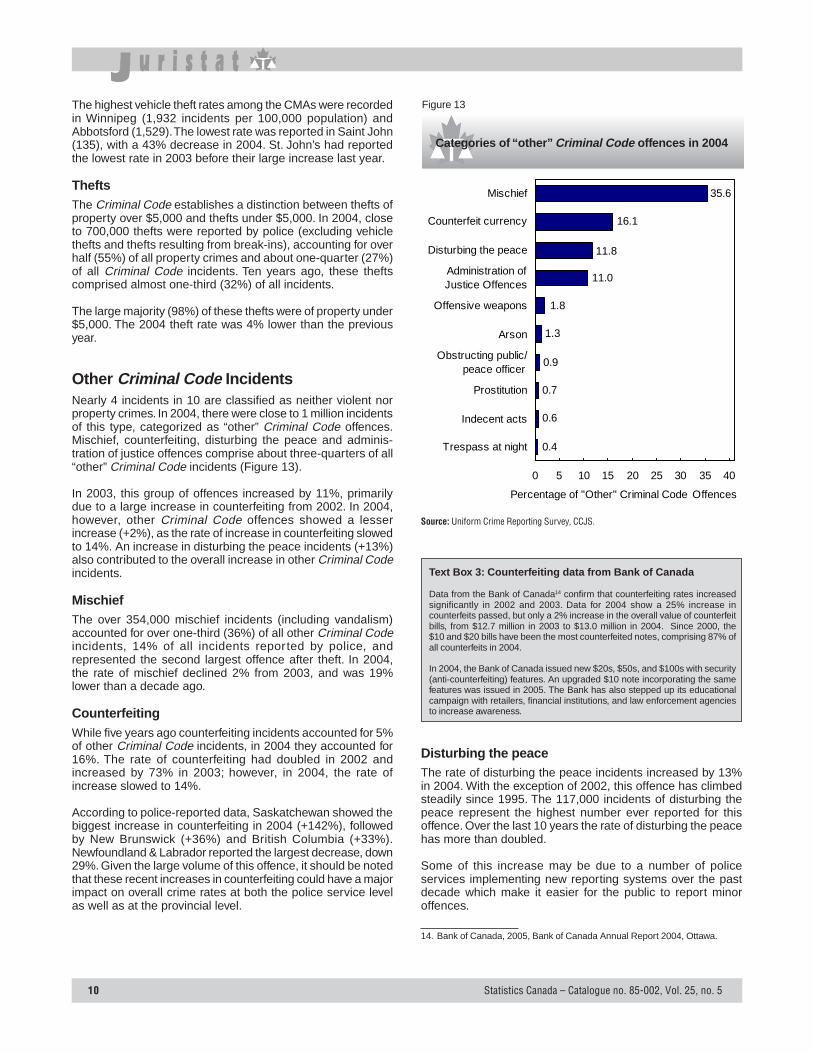
Vehicle theftsSince 1996, the motor vehicle theft rate has declined in all buttwo years (2001 and 2003). In 2004, there were nearly 170,000motor vehicle thefts, resulting in a 4% drop in the vehicle theftrate.
Cars continue to be the most common type of vehicle stolen,accounting for 56% of all vehicle thefts in 2004 (Figure 11).Trucks, including mini-vans and sport utility vehicles (SUVs),accounted for just over one-third (34%), while motorcycles,construction equipment and all other motor vehicles accountedfor the remaining 10%. Thefts of cars dropped by 4% and theftsof trucks were down 2% in 2004. Over the past decade, theftsof cars have decreased by 16% while thefts of trucks haveincreased 26%. This phenomenon is primarily due to anincrease in the popularity of vans and SUVs among consumersand as a target for theft.
Motor vehicle theft rate in 2004lower than 10 years ago
Figure 11
Source: Uniform Crime Reporting Survey, CCJS.
Manitoba had highest rate of vehicle theft in 2004
Figure 12
Source: Uniform Crime Reporting Survey, CCJS.
Among those provinces reporting a drop in vehicle theft, thelargest were in Ontario (-12%) and British Columbia (-6%). Byfar the largest increase was a 52% hike in Newfoundland &Labrador’s rate, primarily due to the vehicle theft rate doublingin St. John’s. The other large increases were found in NovaScotia (+24%) and Manitoba (+23%).
10 Statistics Canada – Catalogue no. 85-002, Vol. 25, no. 5
The highest vehicle theft rates among the CMAs were recordedin Winnipeg (1,932 incidents per 100,000 population) andAbbotsford (1,529). The lowest rate was reported in Saint John(135), with a 43% decrease in 2004. St. John’s had reportedthe lowest rate in 2003 before their large increase last year.
TheftsThe Criminal Code establishes a distinction between thefts ofproperty over $5,000 and thefts under $5,000. In 2004, closeto 700,000 thefts were reported by police (excluding vehiclethefts and thefts resulting from break-ins), accounting for overhalf (55%) of all property crimes and about one-quarter (27%)of all Criminal Code incidents. Ten years ago, these theftscomprised almost one-third (32%) of all incidents.
The large majority (98%) of these thefts were of property under$5,000. The 2004 theft rate was 4% lower than the previousyear.
Other Criminal Code IncidentsNearly 4 incidents in 10 are classified as neither violent norproperty crimes. In 2004, there were close to 1 million incidentsof this type, categorized as “other” Criminal Code offences.Mischief, counterfeiting, disturbing the peace and adminis-tration of justice offences comprise about three-quarters of all“other” Criminal Code incidents (Figure 13).
In 2003, this group of offences increased by 11%, primarilydue to a large increase in counterfeiting from 2002. In 2004,however, other Criminal Code offences showed a lesserincrease (+2%), as the rate of increase in counterfeiting slowedto 14%. An increase in disturbing the peace incidents (+13%)also contributed to the overall increase in other Criminal Codeincidents.
MischiefThe over 354,000 mischief incidents (including vandalism)accounted for over one-third (36%) of all other Criminal Codeincidents, 14% of all incidents reported by police, andrepresented the second largest offence after theft. In 2004,the rate of mischief declined 2% from 2003, and was 19%lower than a decade ago.
CounterfeitingWhile five years ago counterfeiting incidents accounted for 5%of other Criminal Code incidents, in 2004 they accounted for16%. The rate of counterfeiting had doubled in 2002 andincreased by 73% in 2003; however, in 2004, the rate ofincrease slowed to 14%.
According to police-reported data, Saskatchewan showed thebiggest increase in counterfeiting in 2004 (+142%), followedby New Brunswick (+36%) and British Columbia (+33%).Newfoundland & Labrador reported the largest decrease, down29%. Given the large volume of this offence, it should be notedthat these recent increases in counterfeiting could have a majorimpact on overall crime rates at both the police service levelas well as at the provincial level.
Categories of “other” Criminal Code offences in 2004
Figure 13
0.6
0.7
0.9
1.3
11.0
16.1
0.4
11.8
1.8
35.6
0 5 10 15 20 25 30 35 40
Trespass at night
Indecent acts
Prostitution
Obstructing public/ peace officer
Arson
Offensive weapons
Administration ofJustice Offences
Disturbing the peace
Counterfeit currency
Mischief
Percentage of "Other" Criminal Code Offences
Source: Uniform Crime Reporting Survey, CCJS.
Text Box 3: Counterfeiting data from Bank of Canada
Data from the Bank of Canada14 confirm that counterfeiting rates increasedsignificantly in 2002 and 2003. Data for 2004 show a 25% increase incounterfeits passed, but only a 2% increase in the overall value of counterfeitbills, from $12.7 million in 2003 to $13.0 million in 2004. Since 2000, the$10 and $20 bills have been the most counterfeited notes, comprising 87% ofall counterfeits in 2004.
In 2004, the Bank of Canada issued new $20s, $50s, and $100s with security(anti-counterfeiting) features. An upgraded $10 note incorporating the samefeatures was issued in 2005. The Bank has also stepped up its educationalcampaign with retailers, financial institutions, and law enforcement agenciesto increase awareness.
14. Bank of Canada, 2005, Bank of Canada Annual Report 2004, Ottawa.
Disturbing the peaceThe rate of disturbing the peace incidents increased by 13%in 2004. With the exception of 2002, this offence has climbedsteadily since 1995. The 117,000 incidents of disturbing thepeace represent the highest number ever reported for thisoffence. Over the last 10 years the rate of disturbing the peacehas more than doubled.
Some of this increase may be due to a number of policeservices implementing new reporting systems over the pastdecade which make it easier for the public to report minoroffences.
Statistics Canada – Catalogue no. 85-002, Vol. 25, no. 5 11
Administration of justice offencesThere were more than 109,000 administration of justiceoffences reported by police in 2004. These include suchoffences as judicial interim release violations (also referred toas bail violations), failure to appear in court, failure to complywith a condition of undertaking or recognizance, a summonsor an appearance notice and escaping custody. Together, theseoffences account for 11% of other Criminal Code incidents.
These offences remained relatively stable through the 1990s,but began to increase in 2000. Since then, these offences haveincreased by 25%, including a 2% increase in the rate in 2004.The volume of these offences impacts the entire justice systemby interrupting existing prosecution and court processes,increasing remand rates and adding to backlogs in the courtsystem.
Offensive weaponsIn 2004, police reported 18,000 Criminal Code offensiveweapons incidents, resulting in a rate similar to 2003. The rateof illegal possession of a weapon increased by 6% andaccounted for 6 in 10 weapons offences. Illegal possessionincludes having an unregistered firearm or failing to obtain alicense to possess a firearm.
A further 11% of weapons-related offences fell into the illegalfirearms usage category (e.g. using a firearm in the commissionof an offence or pointing a firearm). This category dropped by6% in 2004 as did the remaining 28% comprising “other”weapons offences (e.g. careless use, illegal destruction of afirearm, tampering with serial numbers).
Criminal Code Traffic IncidentsPolice reported about 119,000 Criminal Code traffic incidentsin 2004. Two-thirds of these incidents were impaired drivingoffences, 20% were for failure to stop or remain at an accident,8% were for dangerous driving and the remaining 5% were fordriving while prohibited.
Impaired drivingImpaired driving offences include impaired operation of a motorvehicle, boat or aircraft causing death or bodily harm; drivingwith over 80 mg of alcohol per 100 ml of blood; and, failing toprovide a breath and/or blood sample when requested by apolice officer. The number of impaired driving incidents includesinstances of police issuing road-side suspensions, rather thanlaying a formal charge, to drivers found to have a blood-alcoholreading slightly above the legal limit.
In 2004, police reported close to 79,000 incidents of impaireddriving, or 247 incidents per 100,000 population. This rateremained stable compared to 2003.
With the exception of a small increase in 2001, the rate ofimpaired driving has been decreasing over the past 20 years.The 2004 rate was 33% lower than a decade ago. The rate ofimpaired driving offences can be quite sensitive to changes inenforcement policies and practices such as the presence ofroadside spot checks and increased police patrols duringparticular time periods.
Saskatchewan recorded the highest rate among the provinces(561). Despite reporting the largest drop in impaired drivingincidents (-11%), Prince Edward Island still recorded thesecond highest rate (393). Since 2000, the lowest rates havebeen seen in Ontario (a rate of 147 in 2004) and Newfoundland& Labrador (170).
Drug IncidentsDrug incidents back on the increaseIn 2003, the large decline in the rate of cannabis possessionoffences, which drove down the overall drug rate, may havebeen the result of a climate of uncertainty within the law enforce-ment and criminal justice community given the introduction oflegislation to decriminalize possession of small amounts ofcannabis, as well as a number of court rulings questioning theconstitutionality of current laws regarding cannabis possession.It may also have been a result of a re-prioritization of policeresources towards more serious offences that could have agreater impact on the drug trade. In 2004, this legislation wasre-introduced and still stands before the House of Commons.
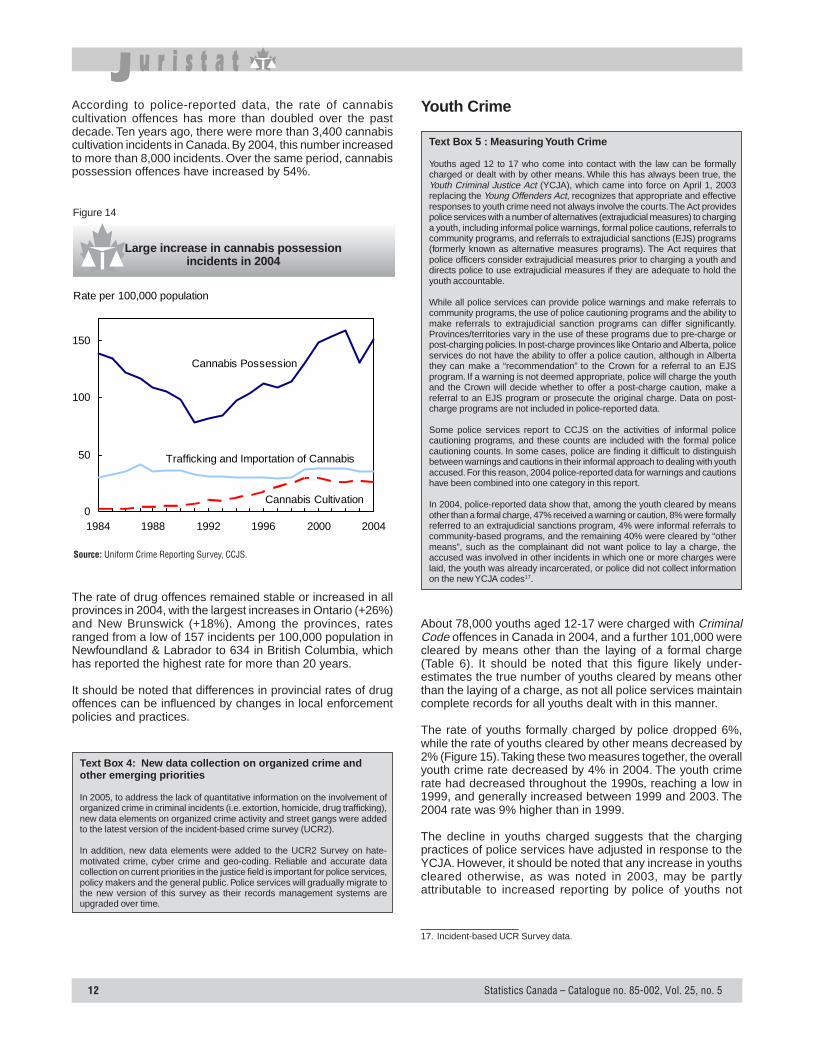
After the 7% drop in drug crimes in 2003, the rate of drugcrimes increased once again in 2004, up 11% (Figure 14).Total cannabis offences increased 10%, with cannabispossession offences up 15%. The rate of cocaine (+17%) andheroin (+19%) offences increased as well, though heroinincidents numbered fewer than 800 in total. Over the pastdecade, the rate of heroin incidents has declined by half(-55%).
In 2004, police reported more than 97,000 incidents under theControlled Drugs and Substances Act. Cannabis offencesaccounted for 7 in 10 of these incidents. Cannabis possessioncomprised 71% of cannabis incidents and almost half (49%)of all drug incidents.
One growing issue related to drugs is the cultivation ofcannabis, sometimes referred to as marijuana grow operations.According to Criminal Intelligence Service Canada (CISC), thenumber of marijuana grow operations continues to rise andmuch of this phenomena is linked to organized crime15.Marijuana grow operations appear to be a profitable marketfor organized crime, due to the high demand for cannabis. Policeservices across all provinces are reporting grow operationsas one of their main drug enforcement problems.
According to a report released by the RCMP16, most indoorresidential grow operations pose some form of risk. Growoperations represent a risk to the health and safety not only ofthe occupants of the residences in which the cultivation occurs,but to the surrounding occupants as well. For example, groupsinvolved in cannabis cultivation steal electricity by circum-venting utility meters, resulting in an increased risk of fire.
15. Criminal Intelligence Service Canada, 2004, Annual Report on OrganizedCrime, Ottawa.
16. RCMP, 2004, Illegal Drug Situation in Canada – 2003, CriminalInvestigations Division, Ottawa.
12 Statistics Canada – Catalogue no. 85-002, Vol. 25, no. 5
According to police-reported data, the rate of cannabiscultivation offences has more than doubled over the pastdecade. Ten years ago, there were more than 3,400 cannabiscultivation incidents in Canada. By 2004, this number increasedto more than 8,000 incidents. Over the same period, cannabispossession offences have increased by 54%.
Large increase in cannabis possessionincidents in 2004
Figure 14
Source: Uniform Crime Reporting Survey, CCJS.
0
50
100
150
1984 1988 1992 1996 2000 2004
Rate per 100,000 population
Cannabis Possession
Cannabis Cultivation
Trafficking and Importation of Cannabis
The rate of drug offences remained stable or increased in allprovinces in 2004, with the largest increases in Ontario (+26%)and New Brunswick (+18%). Among the provinces, ratesranged from a low of 157 incidents per 100,000 population inNewfoundland & Labrador to 634 in British Columbia, whichhas reported the highest rate for more than 20 years.
It should be noted that differences in provincial rates of drugoffences can be influenced by changes in local enforcementpolicies and practices.
Text Box 4: New data collection on organized crime andother emerging priorities
In 2005, to address the lack of quantitative information on the involvement oforganized crime in criminal incidents (i.e. extortion, homicide, drug trafficking),new data elements on organized crime activity and street gangs were addedto the latest version of the incident-based crime survey (UCR2).
In addition, new data elements were added to the UCR2 Survey on hate-motivated crime, cyber crime and geo-coding. Reliable and accurate datacollection on current priorities in the justice field is important for police services,policy makers and the general public. Police services will gradually migrate tothe new version of this survey as their records management systems areupgraded over time.
Youth Crime
Text Box 5 : Measuring Youth Crime
Youths aged 12 to 17 who come into contact with the law can be formallycharged or dealt with by other means. While this has always been true, theYouth Criminal Justice Act (YCJA), which came into force on April 1, 2003replacing the Young Offenders Act, recognizes that appropriate and effectiveresponses to youth crime need not always involve the courts. The Act providespolice services with a number of alternatives (extrajudicial measures) to charginga youth, including informal police warnings, formal police cautions, referrals tocommunity programs, and referrals to extrajudicial sanctions (EJS) programs(formerly known as alternative measures programs). The Act requires thatpolice officers consider extrajudicial measures prior to charging a youth anddirects police to use extrajudicial measures if they are adequate to hold theyouth accountable.
While all police services can provide police warnings and make referrals tocommunity programs, the use of police cautioning programs and the ability tomake referrals to extrajudicial sanction programs can differ significantly.Provinces/territories vary in the use of these programs due to pre-charge orpost-charging policies. In post-charge provinces like Ontario and Alberta, policeservices do not have the ability to offer a police caution, although in Albertathey can make a “recommendation” to the Crown for a referral to an EJSprogram. If a warning is not deemed appropriate, police will charge the youthand the Crown will decide whether to offer a post-charge caution, make areferral to an EJS program or prosecute the original charge. Data on post-charge programs are not included in police-reported data.
Some police services report to CCJS on the activities of informal policecautioning programs, and these counts are included with the formal policecautioning counts. In some cases, police are finding it difficult to distinguishbetween warnings and cautions in their informal approach to dealing with youthaccused. For this reason, 2004 police-reported data for warnings and cautionshave been combined into one category in this report.
In 2004, police-reported data show that, among the youth cleared by meansother than a formal charge, 47% received a warning or caution, 8% were formallyreferred to an extrajudicial sanctions program, 4% were informal referrals tocommunity-based programs, and the remaining 40% were cleared by “othermeans”, such as the complainant did not want police to lay a charge, theaccused was involved in other incidents in which one or more charges werelaid, the youth was already incarcerated, or police did not collect informationon the new YCJA codes17.
About 78,000 youths aged 12-17 were charged with CriminalCode offences in Canada in 2004, and a further 101,000 werecleared by means other than the laying of a formal charge(Table 6). It should be noted that this figure likely under-estimates the true number of youths cleared by means otherthan the laying of a charge, as not all police services maintaincomplete records for all youths dealt with in this manner.
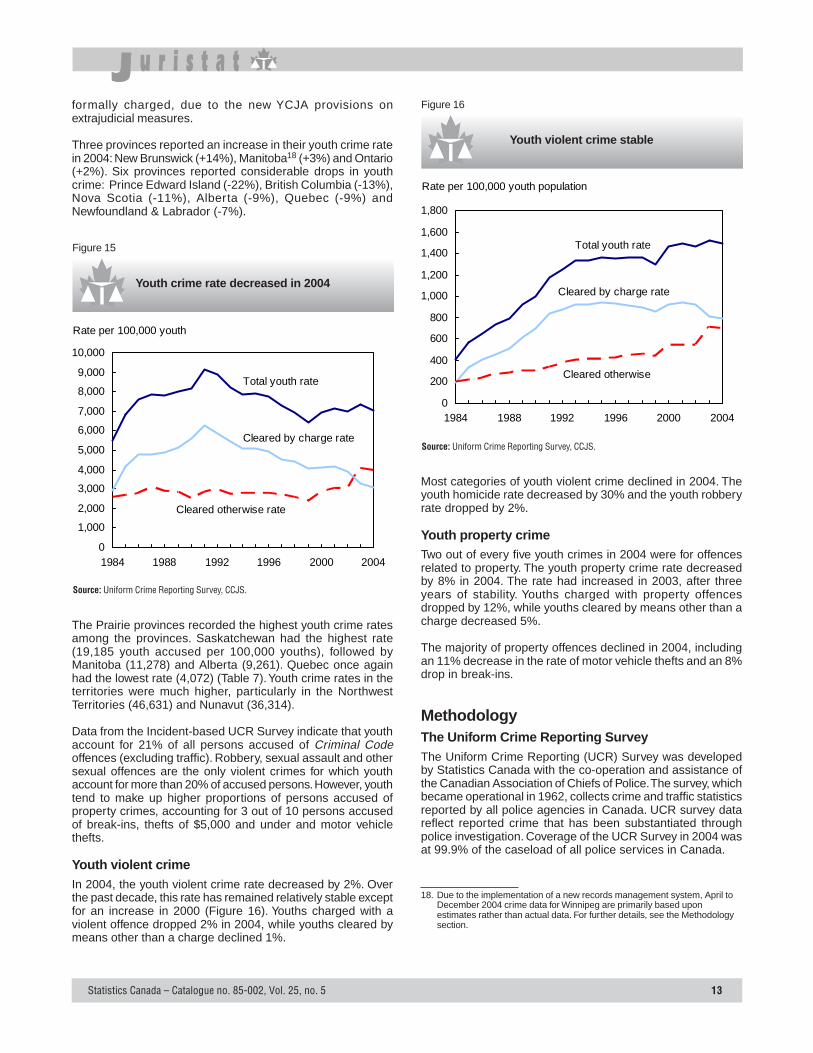
The rate of youths formally charged by police dropped 6%,while the rate of youths cleared by other means decreased by2% (Figure 15). Taking these two measures together, the overallyouth crime rate decreased by 4% in 2004. The youth crimerate had decreased throughout the 1990s, reaching a low in1999, and generally increased between 1999 and 2003. The2004 rate was 9% higher than in 1999.
The decline in youths charged suggests that the chargingpractices of police services have adjusted in response to theYCJA. However, it should be noted that any increase in youthscleared otherwise, as was noted in 2003, may be partlyattributable to increased reporting by police of youths not
17. Incident-based UCR Survey data.
Statistics Canada – Catalogue no. 85-002, Vol. 25, no. 5 13
formally charged, due to the new YCJA provisions onextrajudicial measures.
Three provinces reported an increase in their youth crime ratein 2004: New Brunswick (+14%), Manitoba18 (+3%) and Ontario(+2%). Six provinces reported considerable drops in youthcrime: Prince Edward Island (-22%), British Columbia (-13%),Nova Scotia (-11%), Alberta (-9%), Quebec (-9%) andNewfoundland & Labrador (-7%).
Youth crime rate decreased in 2004
Figure 15
Source: Uniform Crime Reporting Survey, CCJS.
18. Due to the implementation of a new records management system, April toDecember 2004 crime data for Winnipeg are primarily based uponestimates rather than actual data. For further details, see the Methodologysection.
0
1,000
2,000
3,000
4,000
5,000
6,000
7,000
8,000
9,000
10,000
1984 1988 1992 1996 2000 2004
Rate per 100,000 youth
Total youth rate
Cleared by charge rate
Cleared otherwise rate
The Prairie provinces recorded the highest youth crime ratesamong the provinces. Saskatchewan had the highest rate(19,185 youth accused per 100,000 youths), followed byManitoba (11,278) and Alberta (9,261). Quebec once againhad the lowest rate (4,072) (Table 7). Youth crime rates in theterritories were much higher, particularly in the NorthwestTerritories (46,631) and Nunavut (36,314).
Data from the Incident-based UCR Survey indicate that youthaccount for 21% of all persons accused of Criminal Codeoffences (excluding traffic). Robbery, sexual assault and othersexual offences are the only violent crimes for which youthaccount for more than 20% of accused persons. However, youthtend to make up higher proportions of persons accused ofproperty crimes, accounting for 3 out of 10 persons accusedof break-ins, thefts of $5,000 and under and motor vehiclethefts.
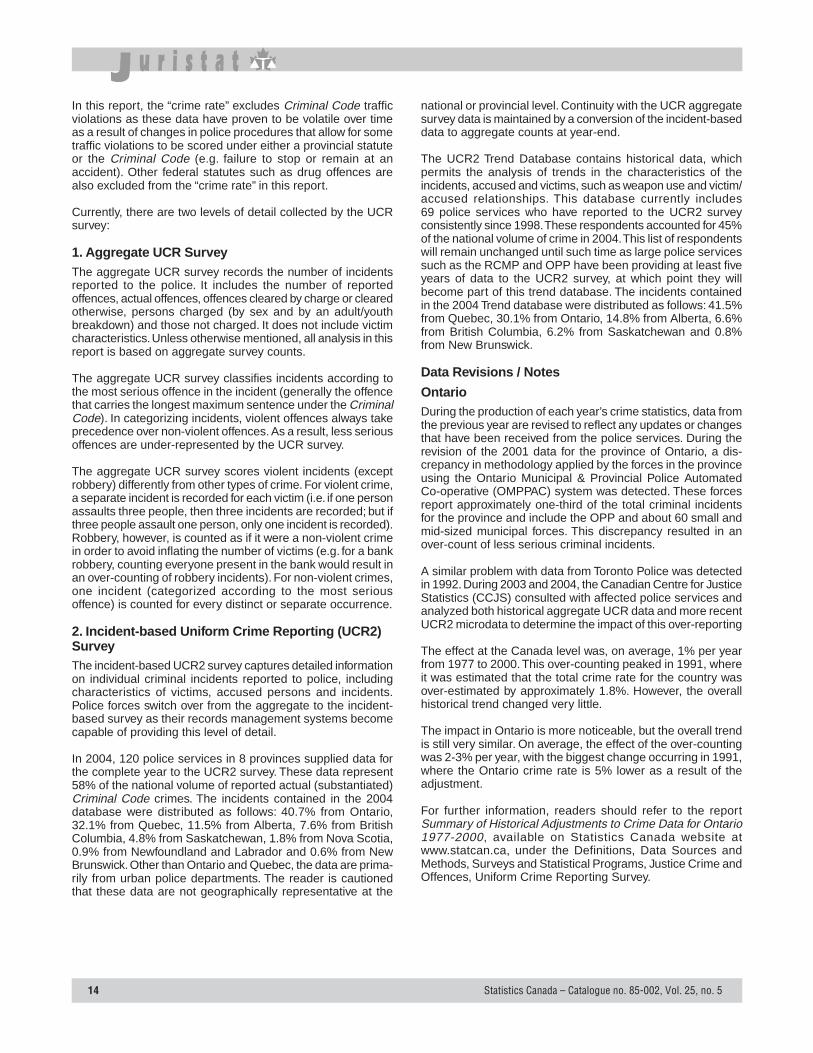
Youth violent crimeIn 2004, the youth violent crime rate decreased by 2%. Overthe past decade, this rate has remained relatively stable exceptfor an increase in 2000 (Figure 16). Youths charged with aviolent offence dropped 2% in 2004, while youths cleared bymeans other than a charge declined 1%.
Most categories of youth violent crime declined in 2004. Theyouth homicide rate decreased by 30% and the youth robberyrate dropped by 2%.
Youth property crimeTwo out of every five youth crimes in 2004 were for offencesrelated to property. The youth property crime rate decreasedby 8% in 2004. The rate had increased in 2003, after threeyears of stability. Youths charged with property offencesdropped by 12%, while youths cleared by means other than acharge decreased 5%.
The majority of property offences declined in 2004, includingan 11% decrease in the rate of motor vehicle thefts and an 8%drop in break-ins.
MethodologyThe Uniform Crime Reporting SurveyThe Uniform Crime Reporting (UCR) Survey was developedby Statistics Canada with the co-operation and assistance ofthe Canadian Association of Chiefs of Police. The survey, whichbecame operational in 1962, collects crime and traffic statisticsreported by all police agencies in Canada. UCR survey datareflect reported crime that has been substantiated throughpolice investigation. Coverage of the UCR Survey in 2004 wasat 99.9% of the caseload of all police services in Canada.
Youth violent crime stable
Figure 16
Source: Uniform Crime Reporting Survey, CCJS.
0
200
400
600
800
1,000
1,200
1,400
1,600
1,800
1984 1988 1992 1996 2000 2004
Rate per 100,000 youth population
Total youth rate
Cleared by charge rate
Cleared otherwise
14 Statistics Canada – Catalogue no. 85-002, Vol. 25, no. 5
In this report, the “crime rate” excludes Criminal Code trafficviolations as these data have proven to be volatile over timeas a result of changes in police procedures that allow for sometraffic violations to be scored under either a provincial statuteor the Criminal Code (e.g. failure to stop or remain at anaccident). Other federal statutes such as drug offences arealso excluded from the “crime rate” in this report.
Currently, there are two levels of detail collected by the UCRsurvey:
1. Aggregate UCR SurveyThe aggregate UCR survey records the number of incidentsreported to the police. It includes the number of reportedoffences, actual offences, offences cleared by charge or clearedotherwise, persons charged (by sex and by an adult/youthbreakdown) and those not charged. It does not include victimcharacteristics. Unless otherwise mentioned, all analysis in thisreport is based on aggregate survey counts.
The aggregate UCR survey classifies incidents according tothe most serious offence in the incident (generally the offencethat carries the longest maximum sentence under the CriminalCode). In categorizing incidents, violent offences always takeprecedence over non-violent offences. As a result, less seriousoffences are under-represented by the UCR survey.
The aggregate UCR survey scores violent incidents (exceptrobbery) differently from other types of crime. For violent crime,a separate incident is recorded for each victim (i.e. if one personassaults three people, then three incidents are recorded; but ifthree people assault one person, only one incident is recorded).Robbery, however, is counted as if it were a non-violent crimein order to avoid inflating the number of victims (e.g. for a bankrobbery, counting everyone present in the bank would result inan over-counting of robbery incidents). For non-violent crimes,one incident (categorized according to the most seriousoffence) is counted for every distinct or separate occurrence.
2. Incident-based Uniform Crime Reporting (UCR2)SurveyThe incident-based UCR2 survey captures detailed informationon individual criminal incidents reported to police, includingcharacteristics of victims, accused persons and incidents.Police forces switch over from the aggregate to the incident-based survey as their records management systems becomecapable of providing this level of detail.
In 2004, 120 police services in 8 provinces supplied data forthe complete year to the UCR2 survey. These data represent58% of the national volume of reported actual (substantiated)Criminal Code crimes. The incidents contained in the 2004database were distributed as follows: 40.7% from Ontario,32.1% from Quebec, 11.5% from Alberta, 7.6% from BritishColumbia, 4.8% from Saskatchewan, 1.8% from Nova Scotia,0.9% from Newfoundland and Labrador and 0.6% from NewBrunswick. Other than Ontario and Quebec, the data are prima-rily from urban police departments. The reader is cautionedthat these data are not geographically representative at the
national or provincial level. Continuity with the UCR aggregatesurvey data is maintained by a conversion of the incident-baseddata to aggregate counts at year-end.
The UCR2 Trend Database contains historical data, whichpermits the analysis of trends in the characteristics of theincidents, accused and victims, such as weapon use and victim/accused relationships. This database currently includes69 police services who have reported to the UCR2 surveyconsistently since 1998. These respondents accounted for 45%of the national volume of crime in 2004. This list of respondentswill remain unchanged until such time as large police servicessuch as the RCMP and OPP have been providing at least fiveyears of data to the UCR2 survey, at which point they willbecome part of this trend database. The incidents containedin the 2004 Trend database were distributed as follows: 41.5%from Quebec, 30.1% from Ontario, 14.8% from Alberta, 6.6%from British Columbia, 6.2% from Saskatchewan and 0.8%from New Brunswick.
Data Revisions / Notes
OntarioDuring the production of each year’s crime statistics, data fromthe previous year are revised to reflect any updates or changesthat have been received from the police services. During therevision of the 2001 data for the province of Ontario, a dis-crepancy in methodology applied by the forces in the provinceusing the Ontario Municipal & Provincial Police AutomatedCo-operative (OMPPAC) system was detected. These forcesreport approximately one-third of the total criminal incidentsfor the province and include the OPP and about 60 small andmid-sized municipal forces. This discrepancy resulted in anover-count of less serious criminal incidents.
A similar problem with data from Toronto Police was detectedin 1992. During 2003 and 2004, the Canadian Centre for JusticeStatistics (CCJS) consulted with affected police services andanalyzed both historical aggregate UCR data and more recentUCR2 microdata to determine the impact of this over-reporting
The effect at the Canada level was, on average, 1% per yearfrom 1977 to 2000. This over-counting peaked in 1991, whereit was estimated that the total crime rate for the country wasover-estimated by approximately 1.8%. However, the overallhistorical trend changed very little.
The impact in Ontario is more noticeable, but the overall trendis still very similar. On average, the effect of the over-countingwas 2-3% per year, with the biggest change occurring in 1991,where the Ontario crime rate is 5% lower as a result of theadjustment.
For further information, readers should refer to the reportSummary of Historical Adjustments to Crime Data for Ontario1977-2000, available on Statistics Canada website atwww.statcan.ca, under the Definitions, Data Sources andMethods, Surveys and Statistical Programs, Justice Crime andOffences, Uniform Crime Reporting Survey.
Statistics Canada – Catalogue no. 85-002, Vol. 25, no. 5 15
ManitobaDue to the implementation of a new records managementsystem, the 2004 crime data for Winnipeg is primarily basedupon estimates rather than actual data for the full year. Withthe exception of homicide and motor vehicle theft statistics,actual data was only available from January to March 2004and had to be estimated for the remaining nine months of 2004.
This was done by the Winnipeg Police Service by substitutingApril to December 2003 data for the same time period in 2004.As a result, the data may not be an accurate reflection of theactual crime statistics for 2004. The same concerns apply tothe Manitoba provincial crime statistics as Winnipeg is thelargest city in Manitoba and accounts for the majority of itscrime statistics.
16 Statistics Canada – Catalogue no. 85-002, Vol. 25, no. 5
Table 1
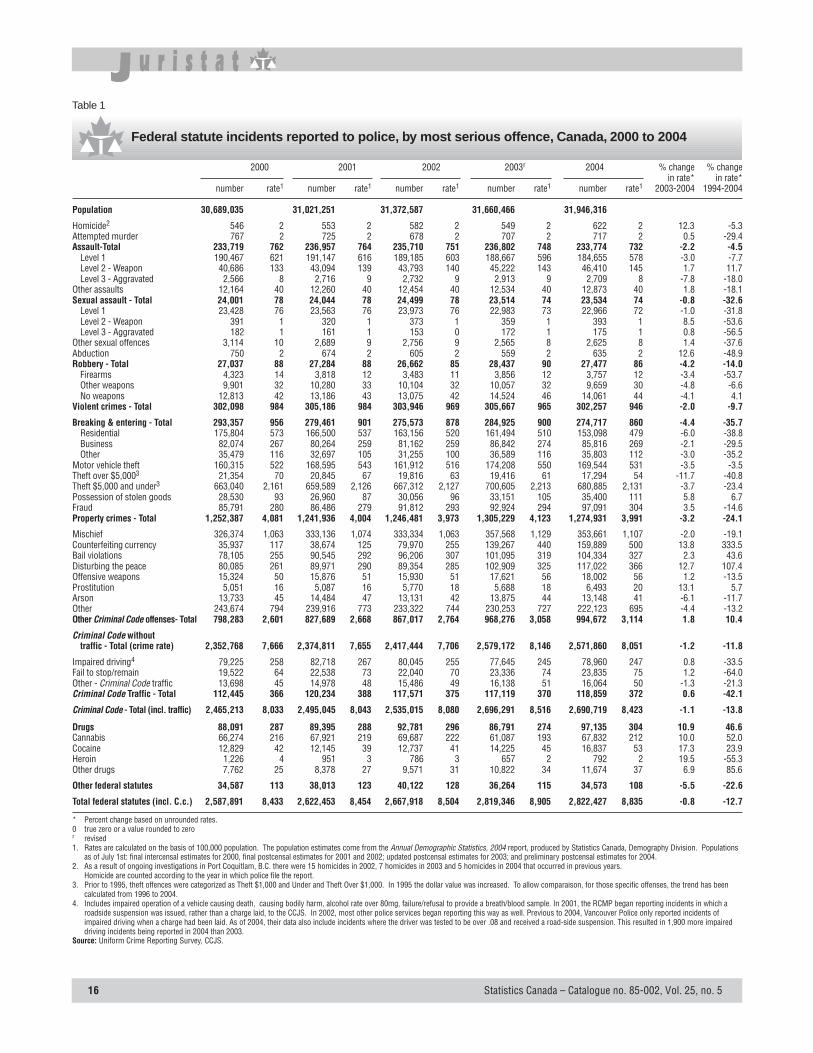
Federal statute incidents reported to police, by most serious offence, Canada, 2000 to 2004
2000 2001 2002 2003r 2004 % change % changein rate* in rate*
number rate1 number rate1 number rate1 number rate1 number rate1 2003-2004 1994-2004
Population 30,689,035 31,021,251 31,372,587 31,660,466 31,946,316
Homicide2 546 2 553 2 582 2 549 2 622 2 12.3 -5.3Attempted murder 767 2 725 2 678 2 707 2 717 2 0.5 -29.4Assault-Total 233,719 762 236,957 764 235,710 751 236,802 748 233,774 732 -2.2 -4.5
Level 1 190,467 621 191,147 616 189,185 603 188,667 596 184,655 578 -3.0 -7.7Level 2 - Weapon 40,686 133 43,094 139 43,793 140 45,222 143 46,410 145 1.7 11.7Level 3 - Aggravated 2,566 8 2,716 9 2,732 9 2,913 9 2,709 8 -7.8 -18.0
Other assaults 12,164 40 12,260 40 12,454 40 12,534 40 12,873 40 1.8 -18.1Sexual assault - Total 24,001 78 24,044 78 24,499 78 23,514 74 23,534 74 -0.8 -32.6
Level 1 23,428 76 23,563 76 23,973 76 22,983 73 22,966 72 -1.0 -31.8Level 2 - Weapon 391 1 320 1 373 1 359 1 393 1 8.5 -53.6Level 3 - Aggravated 182 1 161 1 153 0 172 1 175 1 0.8 -56.5
Other sexual offences 3,114 10 2,689 9 2,756 9 2,565 8 2,625 8 1.4 -37.6Abduction 750 2 674 2 605 2 559 2 635 2 12.6 -48.9Robbery - Total 27,037 88 27,284 88 26,662 85 28,437 90 27,477 86 -4.2 -14.0
Firearms 4,323 14 3,818 12 3,483 11 3,856 12 3,757 12 -3.4 -53.7Other weapons 9,901 32 10,280 33 10,104 32 10,057 32 9,659 30 -4.8 -6.6No weapons 12,813 42 13,186 43 13,075 42 14,524 46 14,061 44 -4.1 4.1
Violent crimes - Total 302,098 984 305,186 984 303,946 969 305,667 965 302,257 946 -2.0 -9.7
Breaking & entering - Total 293,357 956 279,461 901 275,573 878 284,925 900 274,717 860 -4.4 -35.7Residential 175,804 573 166,500 537 163,156 520 161,494 510 153,098 479 -6.0 -38.8Business 82,074 267 80,264 259 81,162 259 86,842 274 85,816 269 -2.1 -29.5Other 35,479 116 32,697 105 31,255 100 36,589 116 35,803 112 -3.0 -35.2
Motor vehicle theft 160,315 522 168,595 543 161,912 516 174,208 550 169,544 531 -3.5 -3.5Theft over $5,0003 21,354 70 20,845 67 19,816 63 19,416 61 17,294 54 -11.7 -40.8Theft $5,000 and under3 663,040 2,161 659,589 2,126 667,312 2,127 700,605 2,213 680,885 2,131 -3.7 -23.4Possession of stolen goods 28,530 93 26,960 87 30,056 96 33,151 105 35,400 111 5.8 6.7Fraud 85,791 280 86,486 279 91,812 293 92,924 294 97,091 304 3.5 -14.6Property crimes - Total 1,252,387 4,081 1,241,936 4,004 1,246,481 3,973 1,305,229 4,123 1,274,931 3,991 -3.2 -24.1
Mischief 326,374 1,063 333,136 1,074 333,334 1,063 357,568 1,129 353,661 1,107 -2.0 -19.1Counterfeiting currency 35,937 117 38,674 125 79,970 255 139,267 440 159,889 500 13.8 333.5Bail violations 78,105 255 90,545 292 96,206 307 101,095 319 104,334 327 2.3 43.6Disturbing the peace 80,085 261 89,971 290 89,354 285 102,909 325 117,022 366 12.7 107.4Offensive weapons 15,324 50 15,876 51 15,930 51 17,621 56 18,002 56 1.2 -13.5Prostitution 5,051 16 5,087 16 5,770 18 5,688 18 6,493 20 13.1 5.7Arson 13,733 45 14,484 47 13,131 42 13,875 44 13,148 41 -6.1 -11.7Other 243,674 794 239,916 773 233,322 744 230,253 727 222,123 695 -4.4 -13.2Other Criminal Code offenses- Total 798,283 2,601 827,689 2,668 867,017 2,764 968,276 3,058 994,672 3,114 1.8 10.4
Criminal Code withouttraffic - Total (crime rate) 2,352,768 7,666 2,374,811 7,655 2,417,444 7,706 2,579,172 8,146 2,571,860 8,051 -1.2 -11.8
Impaired driving4 79,225 258 82,718 267 80,045 255 77,645 245 78,960 247 0.8 -33.5Fail to stop/remain 19,522 64 22,538 73 22,040 70 23,336 74 23,835 75 1.2 -64.0Other - Criminal Code traffic 13,698 45 14,978 48 15,486 49 16,138 51 16,064 50 -1.3 -21.3Criminal Code Traffic - Total 112,445 366 120,234 388 117,571 375 117,119 370 118,859 372 0.6 -42.1
Criminal Code - Total (incl. traffic) 2,465,213 8,033 2,495,045 8,043 2,535,015 8,080 2,696,291 8,516 2,690,719 8,423 -1.1 -13.8
Drugs 88,091 287 89,395 288 92,781 296 86,791 274 97,135 304 10.9 46.6Cannabis 66,274 216 67,921 219 69,687 222 61,087 193 67,832 212 10.0 52.0Cocaine 12,829 42 12,145 39 12,737 41 14,225 45 16,837 53 17.3 23.9Heroin 1,226 4 951 3 786 3 657 2 792 2 19.5 -55.3Other drugs 7,762 25 8,378 27 9,571 31 10,822 34 11,674 37 6.9 85.6
Other federal statutes 34,587 113 38,013 123 40,122 128 36,264 115 34,573 108 -5.5 -22.6
Total federal statutes (incl. C.c.) 2,587,891 8,433 2,622,453 8,454 2,667,918 8,504 2,819,346 8,905 2,822,427 8,835 -0.8 -12.7
* Percent change based on unrounded rates.0 true zero or a value rounded to zeror revised1. Rates are calculated on the basis of 100,000 population. The population estimates come from the Annual Demographic Statistics, 2004 report, produced by Statistics Canada, Demography Division. Populations
as of July 1st: final intercensal estimates for 2000, final postcensal estimates for 2001 and 2002; updated postcensal estimates for 2003; and preliminary postcensal estimates for 2004.2. As a result of ongoing investigations in Port Coquitlam, B.C. there were 15 homicides in 2002, 7 homicides in 2003 and 5 homicides in 2004 that occurred in previous years.
Homicide are counted according to the year in which police file the report.3. Prior to 1995, theft offences were categorized as Theft $1,000 and Under and Theft Over $1,000. In 1995 the dollar value was increased. To allow comparaison, for those specific offenses, the trend has been
calculated from 1996 to 2004.4. Includes impaired operation of a vehicle causing death, causing bodily harm, alcohol rate over 80mg, failure/refusal to provide a breath/blood sample. In 2001, the RCMP began reporting incidents in which a
roadside suspension was issued, rather than a charge laid, to the CCJS. In 2002, most other police services began reporting this way as well. Previous to 2004, Vancouver Police only reported incidents ofimpaired driving when a charge had been laid. As of 2004, their data also include incidents where the driver was tested to be over .08 and received a road-side suspension. This resulted in 1,900 more impaireddriving incidents being reported in 2004 than 2003.
Source: Uniform Crime Reporting Survey, CCJS.
Statistics Canada – Catalogue no. 85-002, Vol. 25, no. 5 17
Total Criminal Code Other Criminal Codeoffences 2 Violent crime Property crime offenses
rate % change* rate % change* rate % change* rate % change*
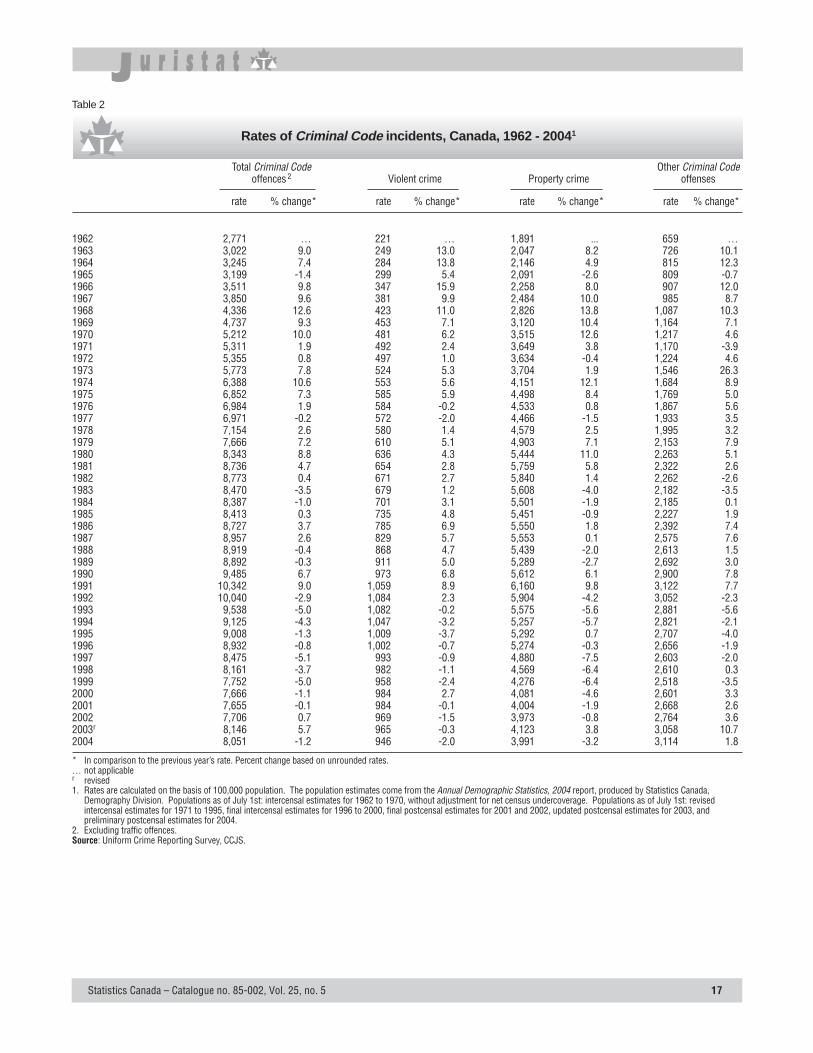
1962 2,771 … 221 … 1,891 ... 659 …1963 3,022 9.0 249 13.0 2,047 8.2 726 10.11964 3,245 7.4 284 13.8 2,146 4.9 815 12.31965 3,199 -1.4 299 5.4 2,091 -2.6 809 -0.71966 3,511 9.8 347 15.9 2,258 8.0 907 12.01967 3,850 9.6 381 9.9 2,484 10.0 985 8.71968 4,336 12.6 423 11.0 2,826 13.8 1,087 10.31969 4,737 9.3 453 7.1 3,120 10.4 1,164 7.11970 5,212 10.0 481 6.2 3,515 12.6 1,217 4.61971 5,311 1.9 492 2.4 3,649 3.8 1,170 -3.91972 5,355 0.8 497 1.0 3,634 -0.4 1,224 4.61973 5,773 7.8 524 5.3 3,704 1.9 1,546 26.31974 6,388 10.6 553 5.6 4,151 12.1 1,684 8.91975 6,852 7.3 585 5.9 4,498 8.4 1,769 5.01976 6,984 1.9 584 -0.2 4,533 0.8 1,867 5.61977 6,971 -0.2 572 -2.0 4,466 -1.5 1,933 3.51978 7,154 2.6 580 1.4 4,579 2.5 1,995 3.21979 7,666 7.2 610 5.1 4,903 7.1 2,153 7.91980 8,343 8.8 636 4.3 5,444 11.0 2,263 5.11981 8,736 4.7 654 2.8 5,759 5.8 2,322 2.61982 8,773 0.4 671 2.7 5,840 1.4 2,262 -2.61983 8,470 -3.5 679 1.2 5,608 -4.0 2,182 -3.51984 8,387 -1.0 701 3.1 5,501 -1.9 2,185 0.11985 8,413 0.3 735 4.8 5,451 -0.9 2,227 1.91986 8,727 3.7 785 6.9 5,550 1.8 2,392 7.41987 8,957 2.6 829 5.7 5,553 0.1 2,575 7.61988 8,919 -0.4 868 4.7 5,439 -2.0 2,613 1.51989 8,892 -0.3 911 5.0 5,289 -2.7 2,692 3.01990 9,485 6.7 973 6.8 5,612 6.1 2,900 7.81991 10,342 9.0 1,059 8.9 6,160 9.8 3,122 7.71992 10,040 -2.9 1,084 2.3 5,904 -4.2 3,052 -2.31993 9,538 -5.0 1,082 -0.2 5,575 -5.6 2,881 -5.61994 9,125 -4.3 1,047 -3.2 5,257 -5.7 2,821 -2.11995 9,008 -1.3 1,009 -3.7 5,292 0.7 2,707 -4.01996 8,932 -0.8 1,002 -0.7 5,274 -0.3 2,656 -1.91997 8,475 -5.1 993 -0.9 4,880 -7.5 2,603 -2.01998 8,161 -3.7 982 -1.1 4,569 -6.4 2,610 0.31999 7,752 -5.0 958 -2.4 4,276 -6.4 2,518 -3.52000 7,666 -1.1 984 2.7 4,081 -4.6 2,601 3.32001 7,655 -0.1 984 -0.1 4,004 -1.9 2,668 2.62002 7,706 0.7 969 -1.5 3,973 -0.8 2,764 3.62003r 8,146 5.7 965 -0.3 4,123 3.8 3,058 10.72004 8,051 -1.2 946 -2.0 3,991 -3.2 3,114 1.8
* In comparison to the previous year’s rate. Percent change based on unrounded rates.… not applicabler revised1. Rates are calculated on the basis of 100,000 population. The population estimates come from the Annual Demographic Statistics, 2004 report, produced by Statistics Canada,
Demography Division. Populations as of July 1st: intercensal estimates for 1962 to 1970, without adjustment for net census undercoverage. Populations as of July 1st: revisedintercensal estimates for 1971 to 1995, final intercensal estimates for 1996 to 2000, final postcensal estimates for 2001 and 2002, updated postcensal estimates for 2003, andpreliminary postcensal estimates for 2004.
2. Excluding traffic offences.Source: Uniform Crime Reporting Survey, CCJS.
Table 2
Rates of Criminal Code incidents, Canada, 1962 - 20041
18 Statistics Canada – Catalogue no. 85-002, Vol. 25, no. 5
Table 3
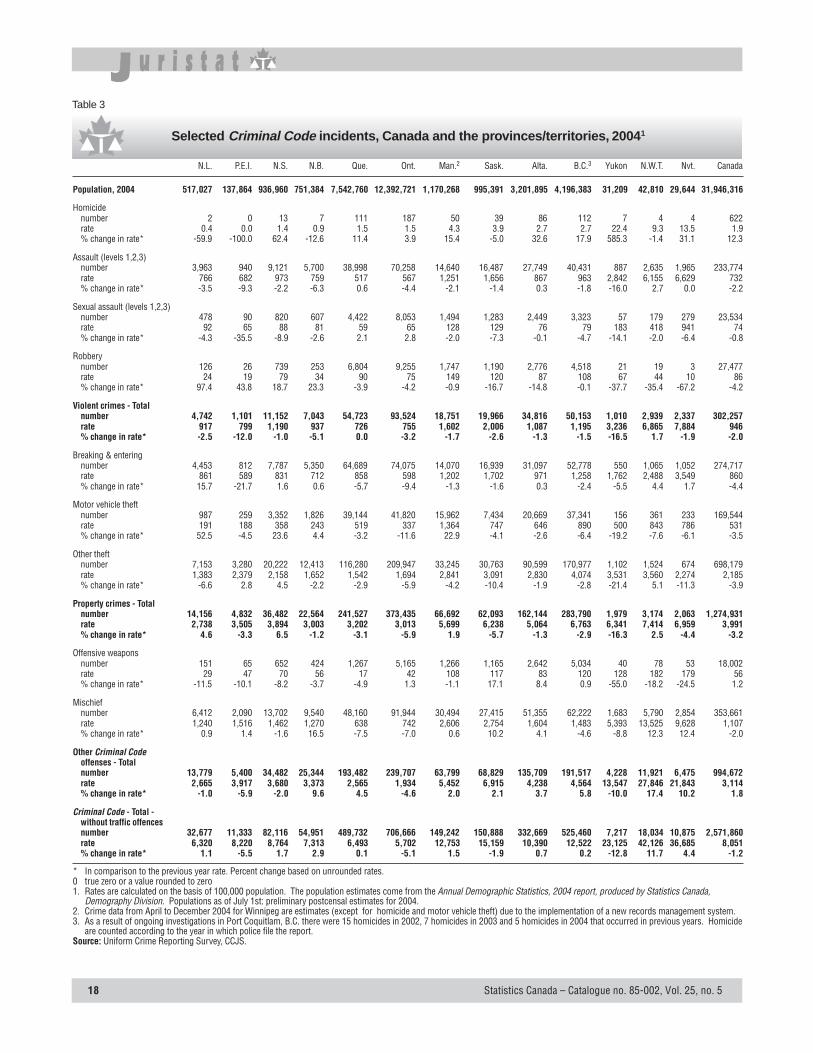
Selected Criminal Code incidents, Canada and the provinces/territories, 20041
N.L. P.E.I. N.S. N.B. Que. Ont. Man.2 Sask. Alta. B.C.3 Yukon N.W.T. Nvt. Canada
Population, 2004 517,027 137,864 936,960 751,384 7,542,760 12,392,721 1,170,268 995,391 3,201,895 4,196,383 31,209 42,810 29,644 31,946,316
Homicidenumber 2 0 13 7 111 187 50 39 86 112 7 4 4 622rate 0.4 0.0 1.4 0.9 1.5 1.5 4.3 3.9 2.7 2.7 22.4 9.3 13.5 1.9% change in rate* -59.9 -100.0 62.4 -12.6 11.4 3.9 15.4 -5.0 32.6 17.9 585.3 -1.4 31.1 12.3
Assault (levels 1,2,3)number 3,963 940 9,121 5,700 38,998 70,258 14,640 16,487 27,749 40,431 887 2,635 1,965 233,774rate 766 682 973 759 517 567 1,251 1,656 867 963 2,842 6,155 6,629 732% change in rate* -3.5 -9.3 -2.2 -6.3 0.6 -4.4 -2.1 -1.4 0.3 -1.8 -16.0 2.7 0.0 -2.2
Sexual assault (levels 1,2,3)number 478 90 820 607 4,422 8,053 1,494 1,283 2,449 3,323 57 179 279 23,534rate 92 65 88 81 59 65 128 129 76 79 183 418 941 74% change in rate* -4.3 -35.5 -8.9 -2.6 2.1 2.8 -2.0 -7.3 -0.1 -4.7 -14.1 -2.0 -6.4 -0.8
Robberynumber 126 26 739 253 6,804 9,255 1,747 1,190 2,776 4,518 21 19 3 27,477rate 24 19 79 34 90 75 149 120 87 108 67 44 10 86% change in rate* 97.4 43.8 18.7 23.3 -3.9 -4.2 -0.9 -16.7 -14.8 -0.1 -37.7 -35.4 -67.2 -4.2
Violent crimes - Totalnumber 4,742 1,101 11,152 7,043 54,723 93,524 18,751 19,966 34,816 50,153 1,010 2,939 2,337 302,257rate 917 799 1,190 937 726 755 1,602 2,006 1,087 1,195 3,236 6,865 7,884 946% change in rate* -2.5 -12.0 -1.0 -5.1 0.0 -3.2 -1.7 -2.6 -1.3 -1.5 -16.5 1.7 -1.9 -2.0
Breaking & enteringnumber 4,453 812 7,787 5,350 64,689 74,075 14,070 16,939 31,097 52,778 550 1,065 1,052 274,717rate 861 589 831 712 858 598 1,202 1,702 971 1,258 1,762 2,488 3,549 860% change in rate* 15.7 -21.7 1.6 0.6 -5.7 -9.4 -1.3 -1.6 0.3 -2.4 -5.5 4.4 1.7 -4.4
Motor vehicle theftnumber 987 259 3,352 1,826 39,144 41,820 15,962 7,434 20,669 37,341 156 361 233 169,544rate 191 188 358 243 519 337 1,364 747 646 890 500 843 786 531% change in rate* 52.5 -4.5 23.6 4.4 -3.2 -11.6 22.9 -4.1 -2.6 -6.4 -19.2 -7.6 -6.1 -3.5
Other theftnumber 7,153 3,280 20,222 12,413 116,280 209,947 33,245 30,763 90,599 170,977 1,102 1,524 674 698,179rate 1,383 2,379 2,158 1,652 1,542 1,694 2,841 3,091 2,830 4,074 3,531 3,560 2,274 2,185% change in rate* -6.6 2.8 4.5 -2.2 -2.9 -5.9 -4.2 -10.4 -1.9 -2.8 -21.4 5.1 -11.3 -3.9
Property crimes - Totalnumber 14,156 4,832 36,482 22,564 241,527 373,435 66,692 62,093 162,144 283,790 1,979 3,174 2,063 1,274,931rate 2,738 3,505 3,894 3,003 3,202 3,013 5,699 6,238 5,064 6,763 6,341 7,414 6,959 3,991% change in rate* 4.6 -3.3 6.5 -1.2 -3.1 -5.9 1.9 -5.7 -1.3 -2.9 -16.3 2.5 -4.4 -3.2
Offensive weaponsnumber 151 65 652 424 1,267 5,165 1,266 1,165 2,642 5,034 40 78 53 18,002rate 29 47 70 56 17 42 108 117 83 120 128 182 179 56% change in rate* -11.5 -10.1 -8.2 -3.7 -4.9 1.3 -1.1 17.1 8.4 0.9 -55.0 -18.2 -24.5 1.2
Mischiefnumber 6,412 2,090 13,702 9,540 48,160 91,944 30,494 27,415 51,355 62,222 1,683 5,790 2,854 353,661rate 1,240 1,516 1,462 1,270 638 742 2,606 2,754 1,604 1,483 5,393 13,525 9,628 1,107% change in rate* 0.9 1.4 -1.6 16.5 -7.5 -7.0 0.6 10.2 4.1 -4.6 -8.8 12.3 12.4 -2.0
Other Criminal Codeoffenses - Totalnumber 13,779 5,400 34,482 25,344 193,482 239,707 63,799 68,829 135,709 191,517 4,228 11,921 6,475 994,672rate 2,665 3,917 3,680 3,373 2,565 1,934 5,452 6,915 4,238 4,564 13,547 27,846 21,843 3,114% change in rate* -1.0 -5.9 -2.0 9.6 4.5 -4.6 2.0 2.1 3.7 5.8 -10.0 17.4 10.2 1.8
Criminal Code - Total -without traffic offencesnumber 32,677 11,333 82,116 54,951 489,732 706,666 149,242 150,888 332,669 525,460 7,217 18,034 10,875 2,571,860rate 6,320 8,220 8,764 7,313 6,493 5,702 12,753 15,159 10,390 12,522 23,125 42,126 36,685 8,051% change in rate* 1.1 -5.5 1.7 2.9 0.1 -5.1 1.5 -1.9 0.7 0.2 -12.8 11.7 4.4 -1.2
* In comparison to the previous year rate. Percent change based on unrounded rates.0 true zero or a value rounded to zero1. Rates are calculated on the basis of 100,000 population. The population estimates come from the Annual Demographic Statistics, 2004 report, produced by Statistics Canada,
Demography Division. Populations as of July 1st: preliminary postcensal estimates for 2004.2. Crime data from April to December 2004 for Winnipeg are estimates (except for homicide and motor vehicle theft) due to the implementation of a new records management system.3. As a result of ongoing investigations in Port Coquitlam, B.C. there were 15 homicides in 2002, 7 homicides in 2003 and 5 homicides in 2004 that occurred in previous years. Homicide
are counted according to the year in which police file the report.Source: Uniform Crime Reporting Survey, CCJS.
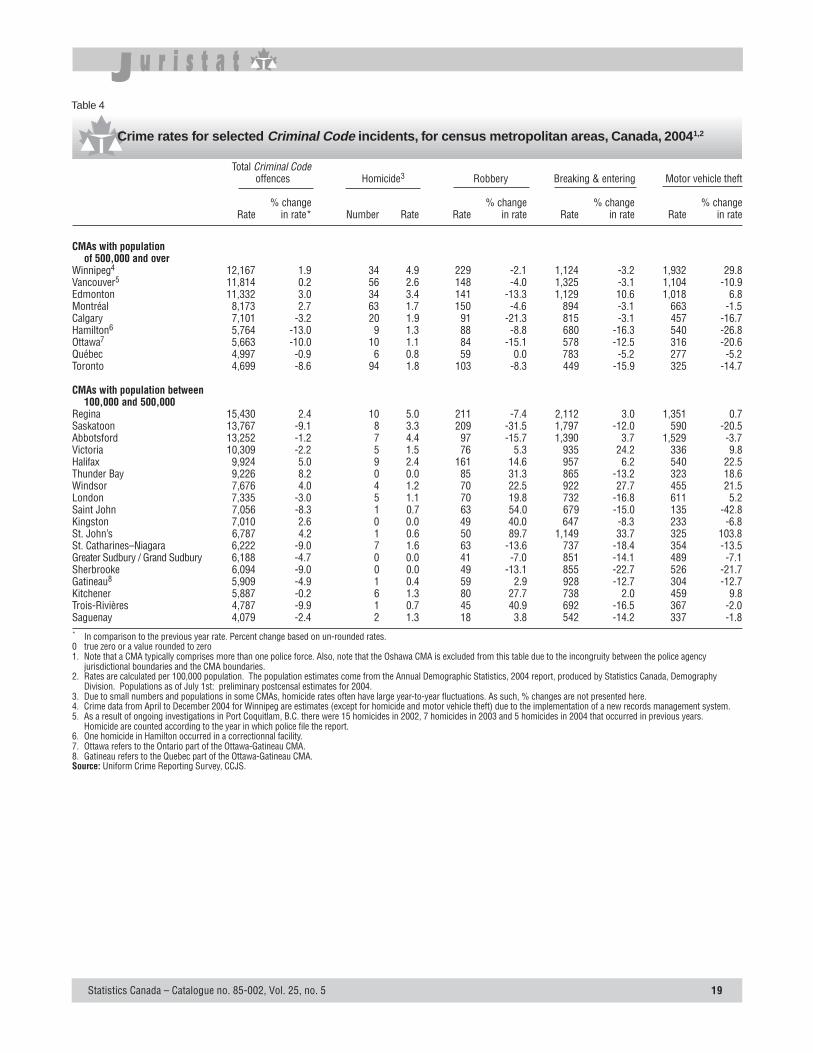
Statistics Canada – Catalogue no. 85-002, Vol. 25, no. 5 19
Total Criminal Code offences Homicide3 Robbery Breaking & entering Motor vehicle theft
% change % change % change % changeRate in rate* Number Rate Rate in rate Rate in rate Rate in rate
CMAs with populationof 500,000 and over
Winnipeg4 12,167 1.9 34 4.9 229 -2.1 1,124 -3.2 1,932 29.8Vancouver5 11,814 0.2 56 2.6 148 -4.0 1,325 -3.1 1,104 -10.9Edmonton 11,332 3.0 34 3.4 141 -13.3 1,129 10.6 1,018 6.8Montréal 8,173 2.7 63 1.7 150 -4.6 894 -3.1 663 -1.5Calgary 7,101 -3.2 20 1.9 91 -21.3 815 -3.1 457 -16.7Hamilton6 5,764 -13.0 9 1.3 88 -8.8 680 -16.3 540 -26.8Ottawa7 5,663 -10.0 10 1.1 84 -15.1 578 -12.5 316 -20.6Québec 4,997 -0.9 6 0.8 59 0.0 783 -5.2 277 -5.2Toronto 4,699 -8.6 94 1.8 103 -8.3 449 -15.9 325 -14.7
CMAs with population between100,000 and 500,000
Regina 15,430 2.4 10 5.0 211 -7.4 2,112 3.0 1,351 0.7Saskatoon 13,767 -9.1 8 3.3 209 -31.5 1,797 -12.0 590 -20.5Abbotsford 13,252 -1.2 7 4.4 97 -15.7 1,390 3.7 1,529 -3.7Victoria 10,309 -2.2 5 1.5 76 5.3 935 24.2 336 9.8Halifax 9,924 5.0 9 2.4 161 14.6 957 6.2 540 22.5Thunder Bay 9,226 8.2 0 0.0 85 31.3 865 -13.2 323 18.6Windsor 7,676 4.0 4 1.2 70 22.5 922 27.7 455 21.5London 7,335 -3.0 5 1.1 70 19.8 732 -16.8 611 5.2Saint John 7,056 -8.3 1 0.7 63 54.0 679 -15.0 135 -42.8Kingston 7,010 2.6 0 0.0 49 40.0 647 -8.3 233 -6.8St. John’s 6,787 4.2 1 0.6 50 89.7 1,149 33.7 325 103.8St. Catharines–Niagara 6,222 -9.0 7 1.6 63 -13.6 737 -18.4 354 -13.5Greater Sudbury / Grand Sudbury 6,188 -4.7 0 0.0 41 -7.0 851 -14.1 489 -7.1Sherbrooke 6,094 -9.0 0 0.0 49 -13.1 855 -22.7 526 -21.7Gatineau8 5,909 -4.9 1 0.4 59 2.9 928 -12.7 304 -12.7Kitchener 5,887 -0.2 6 1.3 80 27.7 738 2.0 459 9.8Trois-Rivières 4,787 -9.9 1 0.7 45 40.9 692 -16.5 367 -2.0Saguenay 4,079 -2.4 2 1.3 18 3.8 542 -14.2 337 -1.8* In comparison to the previous year rate. Percent change based on un-rounded rates.0 true zero or a value rounded to zero1. Note that a CMA typically comprises more than one police force. Also, note that the Oshawa CMA is excluded from this table due to the incongruity between the police agency
jurisdictional boundaries and the CMA boundaries.2. Rates are calculated per 100,000 population. The population estimates come from the Annual Demographic Statistics, 2004 report, produced by Statistics Canada, Demography
Division. Populations as of July 1st: preliminary postcensal estimates for 2004.3. Due to small numbers and populations in some CMAs, homicide rates often have large year-to-year fluctuations. As such, % changes are not presented here.4. Crime data from April to December 2004 for Winnipeg are estimates (except for homicide and motor vehicle theft) due to the implementation of a new records management system.5. As a result of ongoing investigations in Port Coquitlam, B.C. there were 15 homicides in 2002, 7 homicides in 2003 and 5 homicides in 2004 that occurred in previous years.
Homicide are counted according to the year in which police file the report.6. One homicide in Hamilton occurred in a correctionnal facility.7. Ottawa refers to the Ontario part of the Ottawa-Gatineau CMA.8. Gatineau refers to the Quebec part of the Ottawa-Gatineau CMA.Source: Uniform Crime Reporting Survey, CCJS.
Table 4
Crime rates for selected Criminal Code incidents, for census metropolitan areas, Canada, 20041,2
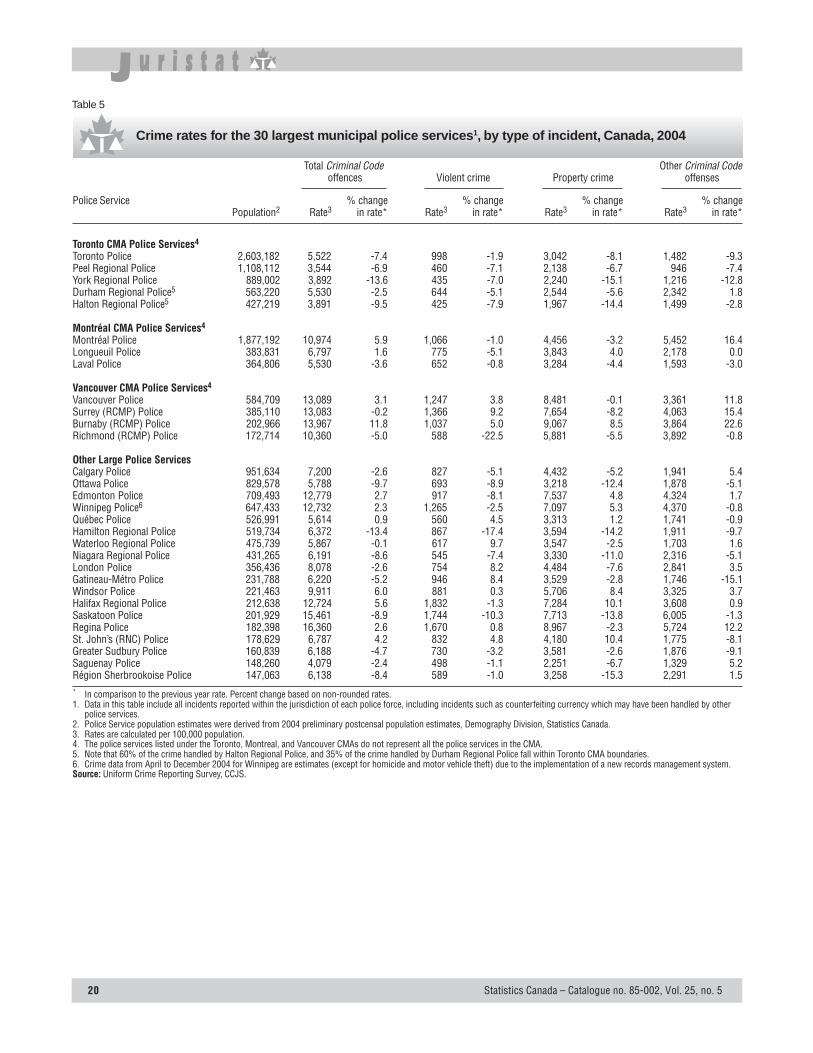
20 Statistics Canada – Catalogue no. 85-002, Vol. 25, no. 5
Total Criminal Code Other Criminal Code offences Violent crime Property crime offenses
Police Service % change % change % change % changePopulation2 Rate3 in rate* Rate3 in rate* Rate3 in rate* Rate3 in rate*
Toronto CMA Police Services4
Toronto Police 2,603,182 5,522 -7.4 998 -1.9 3,042 -8.1 1,482 -9.3Peel Regional Police 1,108,112 3,544 -6.9 460 -7.1 2,138 -6.7 946 -7.4York Regional Police 889,002 3,892 -13.6 435 -7.0 2,240 -15.1 1,216 -12.8Durham Regional Police5 563,220 5,530 -2.5 644 -5.1 2,544 -5.6 2,342 1.8Halton Regional Police5 427,219 3,891 -9.5 425 -7.9 1,967 -14.4 1,499 -2.8
Montréal CMA Police Services4
Montréal Police 1,877,192 10,974 5.9 1,066 -1.0 4,456 -3.2 5,452 16.4Longueuil Police 383,831 6,797 1.6 775 -5.1 3,843 4.0 2,178 0.0Laval Police 364,806 5,530 -3.6 652 -0.8 3,284 -4.4 1,593 -3.0
Vancouver CMA Police Services4
Vancouver Police 584,709 13,089 3.1 1,247 3.8 8,481 -0.1 3,361 11.8Surrey (RCMP) Police 385,110 13,083 -0.2 1,366 9.2 7,654 -8.2 4,063 15.4Burnaby (RCMP) Police 202,966 13,967 11.8 1,037 5.0 9,067 8.5 3,864 22.6Richmond (RCMP) Police 172,714 10,360 -5.0 588 -22.5 5,881 -5.5 3,892 -0.8
Other Large Police ServicesCalgary Police 951,634 7,200 -2.6 827 -5.1 4,432 -5.2 1,941 5.4Ottawa Police 829,578 5,788 -9.7 693 -8.9 3,218 -12.4 1,878 -5.1Edmonton Police 709,493 12,779 2.7 917 -8.1 7,537 4.8 4,324 1.7Winnipeg Police6 647,433 12,732 2.3 1,265 -2.5 7,097 5.3 4,370 -0.8Québec Police 526,991 5,614 0.9 560 4.5 3,313 1.2 1,741 -0.9Hamilton Regional Police 519,734 6,372 -13.4 867 -17.4 3,594 -14.2 1,911 -9.7Waterloo Regional Police 475,739 5,867 -0.1 617 9.7 3,547 -2.5 1,703 1.6Niagara Regional Police 431,265 6,191 -8.6 545 -7.4 3,330 -11.0 2,316 -5.1London Police 356,436 8,078 -2.6 754 8.2 4,484 -7.6 2,841 3.5Gatineau-Métro Police 231,788 6,220 -5.2 946 8.4 3,529 -2.8 1,746 -15.1Windsor Police 221,463 9,911 6.0 881 0.3 5,706 8.4 3,325 3.7Halifax Regional Police 212,638 12,724 5.6 1,832 -1.3 7,284 10.1 3,608 0.9Saskatoon Police 201,929 15,461 -8.9 1,744 -10.3 7,713 -13.8 6,005 -1.3Regina Police 182,398 16,360 2.6 1,670 0.8 8,967 -2.3 5,724 12.2St. John’s (RNC) Police 178,629 6,787 4.2 832 4.8 4,180 10.4 1,775 -8.1Greater Sudbury Police 160,839 6,188 -4.7 730 -3.2 3,581 -2.6 1,876 -9.1Saguenay Police 148,260 4,079 -2.4 498 -1.1 2,251 -6.7 1,329 5.2Région Sherbrookoise Police 147,063 6,138 -8.4 589 -1.0 3,258 -15.3 2,291 1.5* In comparison to the previous year rate. Percent change based on non-rounded rates.1. Data in this table include all incidents reported within the jurisdiction of each police force, including incidents such as counterfeiting currency which may have been handled by other
police services.2. Police Service population estimates were derived from 2004 preliminary postcensal population estimates, Demography Division, Statistics Canada.3. Rates are calculated per 100,000 population.4. The police services listed under the Toronto, Montreal, and Vancouver CMAs do not represent all the police services in the CMA.5. Note that 60% of the crime handled by Halton Regional Police, and 35% of the crime handled by Durham Regional Police fall within Toronto CMA boundaries.6. Crime data from April to December 2004 for Winnipeg are estimates (except for homicide and motor vehicle theft) due to the implementation of a new records management system.Source: Uniform Crime Reporting Survey, CCJS.
Table 5
Crime rates for the 30 largest municipal police services1, by type of incident, Canada, 2004
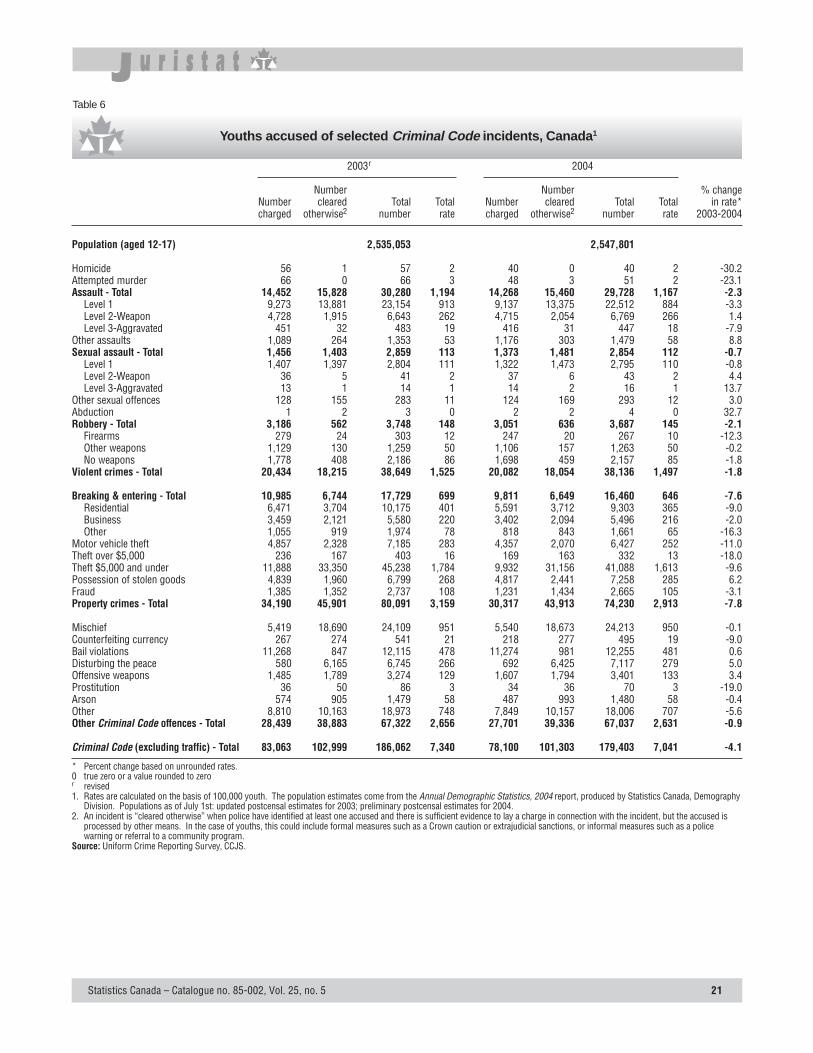
Statistics Canada – Catalogue no. 85-002, Vol. 25, no. 5 21
Table 6
Youths accused of selected Criminal Code incidents, Canada1
2003r 2004
Number Number % changeNumber cleared Total Total Number cleared Total Total in rate*charged otherwise2 number rate charged otherwise2 number rate 2003-2004
Population (aged 12-17) 2,535,053 2,547,801
Homicide 56 1 57 2 40 0 40 2 -30.2Attempted murder 66 0 66 3 48 3 51 2 -23.1Assault - Total 14,452 15,828 30,280 1,194 14,268 15,460 29,728 1,167 -2.3
Level 1 9,273 13,881 23,154 913 9,137 13,375 22,512 884 -3.3Level 2-Weapon 4,728 1,915 6,643 262 4,715 2,054 6,769 266 1.4Level 3-Aggravated 451 32 483 19 416 31 447 18 -7.9
Other assaults 1,089 264 1,353 53 1,176 303 1,479 58 8.8Sexual assault - Total 1,456 1,403 2,859 113 1,373 1,481 2,854 112 -0.7
Level 1 1,407 1,397 2,804 111 1,322 1,473 2,795 110 -0.8Level 2-Weapon 36 5 41 2 37 6 43 2 4.4Level 3-Aggravated 13 1 14 1 14 2 16 1 13.7
Other sexual offences 128 155 283 11 124 169 293 12 3.0Abduction 1 2 3 0 2 2 4 0 32.7Robbery - Total 3,186 562 3,748 148 3,051 636 3,687 145 -2.1
Firearms 279 24 303 12 247 20 267 10 -12.3Other weapons 1,129 130 1,259 50 1,106 157 1,263 50 -0.2No weapons 1,778 408 2,186 86 1,698 459 2,157 85 -1.8
Violent crimes - Total 20,434 18,215 38,649 1,525 20,082 18,054 38,136 1,497 -1.8
Breaking & entering - Total 10,985 6,744 17,729 699 9,811 6,649 16,460 646 -7.6Residential 6,471 3,704 10,175 401 5,591 3,712 9,303 365 -9.0Business 3,459 2,121 5,580 220 3,402 2,094 5,496 216 -2.0Other 1,055 919 1,974 78 818 843 1,661 65 -16.3
Motor vehicle theft 4,857 2,328 7,185 283 4,357 2,070 6,427 252 -11.0Theft over $5,000 236 167 403 16 169 163 332 13 -18.0Theft $5,000 and under 11,888 33,350 45,238 1,784 9,932 31,156 41,088 1,613 -9.6Possession of stolen goods 4,839 1,960 6,799 268 4,817 2,441 7,258 285 6.2Fraud 1,385 1,352 2,737 108 1,231 1,434 2,665 105 -3.1Property crimes - Total 34,190 45,901 80,091 3,159 30,317 43,913 74,230 2,913 -7.8
Mischief 5,419 18,690 24,109 951 5,540 18,673 24,213 950 -0.1Counterfeiting currency 267 274 541 21 218 277 495 19 -9.0Bail violations 11,268 847 12,115 478 11,274 981 12,255 481 0.6Disturbing the peace 580 6,165 6,745 266 692 6,425 7,117 279 5.0Offensive weapons 1,485 1,789 3,274 129 1,607 1,794 3,401 133 3.4Prostitution 36 50 86 3 34 36 70 3 -19.0Arson 574 905 1,479 58 487 993 1,480 58 -0.4Other 8,810 10,163 18,973 748 7,849 10,157 18,006 707 -5.6Other Criminal Code offences - Total 28,439 38,883 67,322 2,656 27,701 39,336 67,037 2,631 -0.9
Criminal Code (excluding traffic) - Total 83,063 102,999 186,062 7,340 78,100 101,303 179,403 7,041 -4.1
* Percent change based on unrounded rates.0 true zero or a value rounded to zeror revised1. Rates are calculated on the basis of 100,000 youth. The population estimates come from the Annual Demographic Statistics, 2004 report, produced by Statistics Canada, Demography
Division. Populations as of July 1st: updated postcensal estimates for 2003; preliminary postcensal estimates for 2004.2. An incident is “cleared otherwise” when police have identified at least one accused and there is sufficient evidence to lay a charge in connection with the incident, but the accused is
processed by other means. In the case of youths, this could include formal measures such as a Crown caution or extrajudicial sanctions, or informal measures such as a policewarning or referral to a community program.
Source: Uniform Crime Reporting Survey, CCJS.
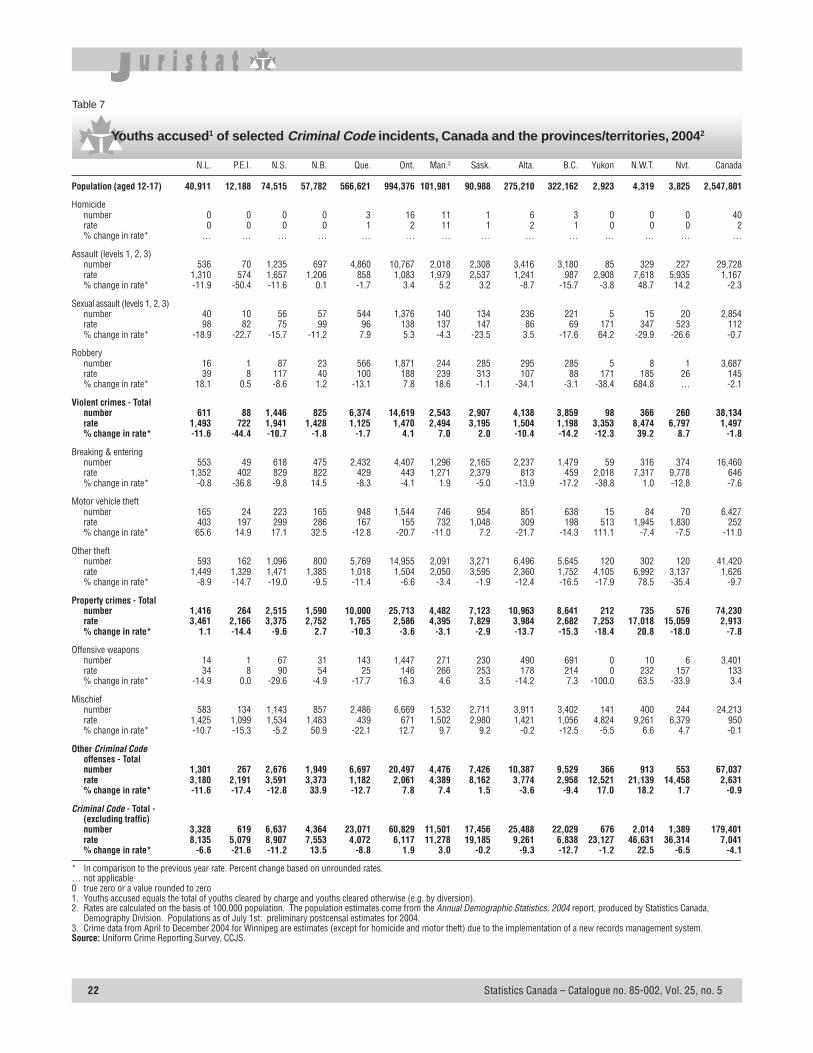
22 Statistics Canada – Catalogue no. 85-002, Vol. 25, no. 5
N.L. P.E.I. N.S. N.B. Que. Ont. Man.3 Sask. Alta. B.C. Yukon N.W.T. Nvt. Canada
Population (aged 12-17) 40,911 12,188 74,515 57,782 566,621 994,376 101,981 90,988 275,210 322,162 2,923 4,319 3,825 2,547,801
Homicidenumber 0 0 0 0 3 16 11 1 6 3 0 0 0 40rate 0 0 0 0 1 2 11 1 2 1 0 0 0 2% change in rate* … … … … … … … … … … … … … …
Assault (levels 1, 2, 3)number 536 70 1,235 697 4,860 10,767 2,018 2,308 3,416 3,180 85 329 227 29,728rate 1,310 574 1,657 1,206 858 1,083 1,979 2,537 1,241 987 2,908 7,618 5,935 1,167% change in rate* -11.9 -50.4 -11.6 0.1 -1.7 3.4 5.2 3.2 -8.7 -15.7 -3.8 48.7 14.2 -2.3
Sexual assault (levels 1, 2, 3)number 40 10 56 57 544 1,376 140 134 236 221 5 15 20 2,854rate 98 82 75 99 96 138 137 147 86 69 171 347 523 112% change in rate* -18.9 -22.7 -15.7 -11.2 7.9 5.3 -4.3 -23.5 3.5 -17.6 64.2 -29.9 -26.6 -0.7
Robberynumber 16 1 87 23 566 1,871 244 285 295 285 5 8 1 3,687rate 39 8 117 40 100 188 239 313 107 88 171 185 26 145% change in rate* 18.1 0.5 -8.6 1.2 -13.1 7.8 18.6 -1.1 -34.1 -3.1 -38.4 684.8 … -2.1
Violent crimes - Totalnumber 611 88 1,446 825 6,374 14,619 2,543 2,907 4,138 3,859 98 366 260 38,134rate 1,493 722 1,941 1,428 1,125 1,470 2,494 3,195 1,504 1,198 3,353 8,474 6,797 1,497% change in rate* -11.6 -44.4 -10.7 -1.8 -1.7 4.1 7.0 2.0 -10.4 -14.2 -12.3 39.2 8.7 -1.8
Breaking & enteringnumber 553 49 618 475 2,432 4,407 1,296 2,165 2,237 1,479 59 316 374 16,460rate 1,352 402 829 822 429 443 1,271 2,379 813 459 2,018 7,317 9,778 646% change in rate* -0.8 -36.8 -9.8 14.5 -8.3 -4.1 1.9 -5.0 -13.9 -17.2 -38.8 1.0 -12.8 -7.6
Motor vehicle theftnumber 165 24 223 165 948 1,544 746 954 851 638 15 84 70 6,427rate 403 197 299 286 167 155 732 1,048 309 198 513 1,945 1,830 252% change in rate* 65.6 14.9 17.1 32.5 -12.8 -20.7 -11.0 7.2 -21.7 -14.3 111.1 -7.4 -7.5 -11.0
Other theftnumber 593 162 1,096 800 5,769 14,955 2,091 3,271 6,496 5,645 120 302 120 41,420rate 1,449 1,329 1,471 1,385 1,018 1,504 2,050 3,595 2,360 1,752 4,105 6,992 3,137 1,626% change in rate* -8.9 -14.7 -19.0 -9.5 -11.4 -6.6 -3.4 -1.9 -12.4 -16.5 -17.9 78.5 -35.4 -9.7
Property crimes - Totalnumber 1,416 264 2,515 1,590 10,000 25,713 4,482 7,123 10,963 8,641 212 735 576 74,230rate 3,461 2,166 3,375 2,752 1,765 2,586 4,395 7,829 3,984 2,682 7,253 17,018 15,059 2,913% change in rate* 1.1 -14.4 -9.6 2.7 -10.3 -3.6 -3.1 -2.9 -13.7 -15.3 -18.4 20.8 -18.0 -7.8
Offensive weaponsnumber 14 1 67 31 143 1,447 271 230 490 691 0 10 6 3,401rate 34 8 90 54 25 146 266 253 178 214 0 232 157 133% change in rate* -14.9 0.0 -29.6 -4.9 -17.7 16.3 4.6 3.5 -14.2 7.3 -100.0 63.5 -33.9 3.4
Mischiefnumber 583 134 1,143 857 2,486 6,669 1,532 2,711 3,911 3,402 141 400 244 24,213rate 1,425 1,099 1,534 1,483 439 671 1,502 2,980 1,421 1,056 4,824 9,261 6,379 950% change in rate* -10.7 -15.3 -5.2 50.9 -22.1 12.7 9.7 9.2 -0.2 -12.5 -5.5 6.6 4.7 -0.1
Other Criminal Codeoffenses - Totalnumber 1,301 267 2,676 1,949 6,697 20,497 4,476 7,426 10,387 9,529 366 913 553 67,037rate 3,180 2,191 3,591 3,373 1,182 2,061 4,389 8,162 3,774 2,958 12,521 21,139 14,458 2,631% change in rate* -11.6 -17.4 -12.8 33.9 -12.7 7.8 7.4 1.5 -3.6 -9.4 17.0 18.2 1.7 -0.9
Criminal Code - Total -(excluding traffic)number 3,328 619 6,637 4,364 23,071 60,829 11,501 17,456 25,488 22,029 676 2,014 1,389 179,401rate 8,135 5,079 8,907 7,553 4,072 6,117 11,278 19,185 9,261 6,838 23,127 46,631 36,314 7,041% change in rate* -6.6 -21.6 -11.2 13.5 -8.8 1.9 3.0 -0.2 -9.3 -12.7 -1.2 22.5 -6.5 -4.1
* In comparison to the previous year rate. Percent change based on unrounded rates.… not applicable0 true zero or a value rounded to zero1. Youths accused equals the total of youths cleared by charge and youths cleared otherwise (e.g. by diversion).2. Rates are calculated on the basis of 100,000 population. The population estimates come from the Annual Demographic Statistics, 2004 report, produced by Statistics Canada,
Demography Division. Populations as of July 1st: preliminary postcensal estimates for 2004.3. Crime data from April to December 2004 for Winnipeg are estimates (except for homicide and motor theft) due to the implementation of a new records management system.Source: Uniform Crime Reporting Survey, CCJS.
Table 7
Youths accused1 of selected Criminal Code incidents, Canada and the provinces/territories, 20042
Statistics Canada – Catalogue no. 85-002, Vol. 25, no. 5 23
Canadian Centre for Justice StatisticsFor further information, please contact the Canadian Centre for Justice Statistics, 19th floor, R.H. Coats Building, Ottawa, OntarioK1A 0T6 at (613) 951-9023 or call toll-free 1 800 387-2231. To order a publication, you may telephone (613) 951-7277 or fax(613) 951-1584 or visit the Internet: [email protected]. You may also call 1 800 267-6677 (Canada and United States) toll-free.If you order by telephone, written confirmation is not required.
Recent Juristat releases
Catalogue no. 85-002-XPE
2003Vol. 23, no. 2 Adult Criminal Court Statistics, 2001/2002
Vol. 23, no. 3 Youth Court Statistics, 2001/02
Vol. 23, no. 4 Canada’s Shelters for Abused Women, 2001/02
Vol. 23, no. 5 Crime Statistics in Canada, 2002
Vol. 23, no. 6 Sexual Offences in Canada
Vol. 23, no. 7 Custodial Remand in Canada, 1986/87 to 2000/01
Vol. 23, no. 8 Homicide in Canada, 2002
Vol. 23, no. 9 Impaired driving and other traffic offences - 2002
Vol. 23, no. 10 Adult criminal court statistics, 2002/03
Vol. 23, no. 11 Adult correctional services in Canada, 2001/02
2004Vol. 24, no. 1 Trends in Drug Offences and the Role of Alcohol and Drugs in Crime
Vol. 24, no. 2 Youth Court Statistics, 2002/03
Vol. 24, no. 3 Youth Custody and Community Services in Canada, 2001/02
Vol. 24, no. 4 Hate Crime in Canada
Vol. 24, no. 5 Breaking and Entering in Canada - 2002
Vol. 24, no. 6 Crime Statistics in Canada, 2003
Vol. 24, no. 7 Private Security and Public Policing in Canada, 2001
Vol. 24, no. 8 Homicide in Canada, 2003
Vol. 24, no. 9 Youth Custody and Community Services in Canada, 2002/03
Vol. 24, no. 10 Adult Correctional Services in Canada, 2002/03
Vol. 24, no. 11 Victim Services in Canada, 2002/03
Vol. 24, no. 12 Adult Criminal Court Statistics, 2003/04
2005Vol. 25, no. 1 Children and Youth as Victims of Violent Crime
Vol. 25, no. 2 Returning to Correctional Services After Release: A profile of Aboriginal and non-Aboriginal adults involved inSaskatchewan Corrections from 1999/00 to 2003/04
Vol. 25, no. 3 Canada’s Shelters for Abused Women, 2003/04
Vol. 25, no. 4 Youth Court Statistics, 2003/04