Embed Size (px)
Citation preview
Critical Appraisal: an introduction Quantitative Research
Ronan Hegarty Newcomb Library & Information Service
Lesson Aims • To introduce to attendees the principles of critical
appraisal
• To enable attendees to be able to critically appraise a piece of published research and judge its reliability
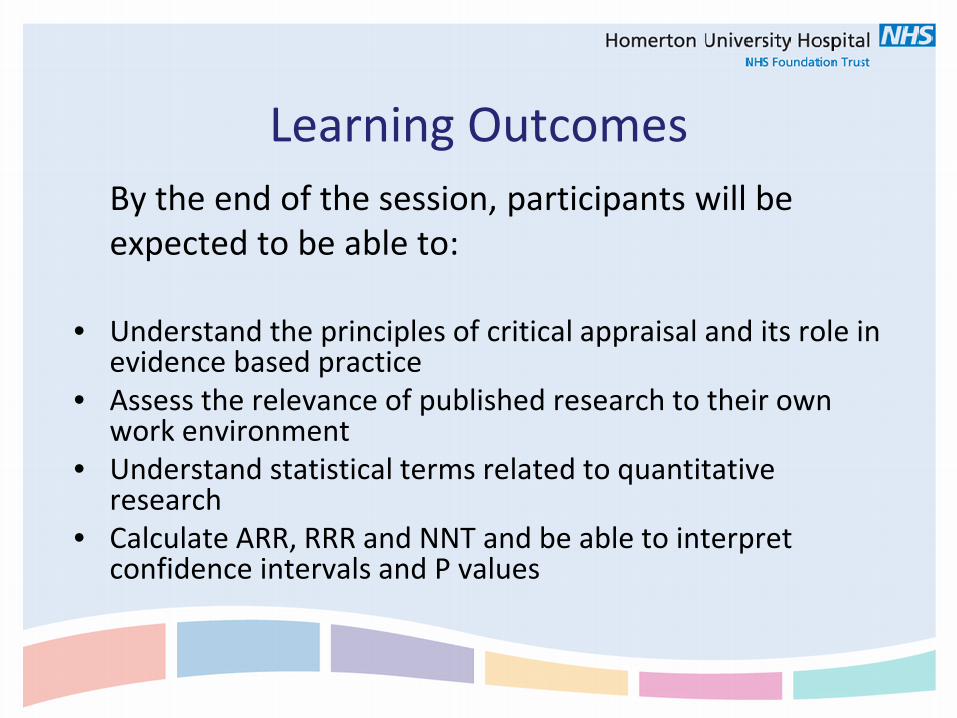
Learning Outcomes By the end of the session, participants will be
expected to be able to:
• Understand the principles of critical appraisal and its role in evidence based practice
• Assess the relevance of published research to their own work environment
• Understand statistical terms related to quantitative research
• Calculate ARR, RRR and NNT and be able to interpret confidence intervals and P values
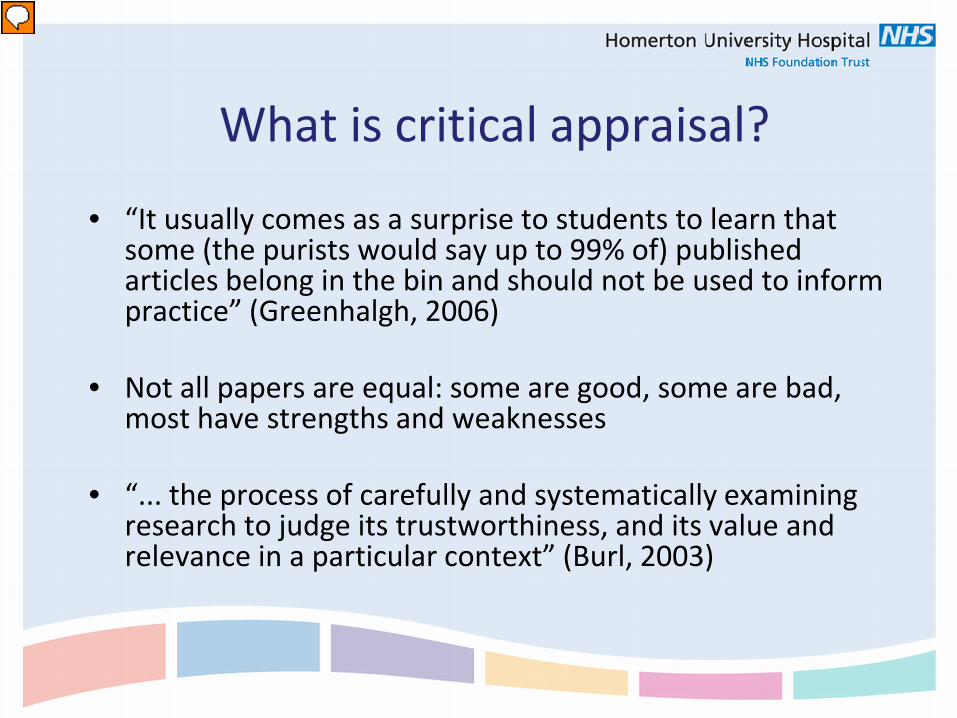
What is critical appraisal?
• “It usually comes as a surprise to students to learn that
some (the purists would say up to 99% of) published articles belong in the bin and should not be used to inform practice” (Greenhalgh, 2006)
• Not all papers are equal: some are good, some are bad, most have strengths and weaknesses
• “... the process of carefully and systematically examining research to judge its trustworthiness, and its value and relevance in a particular context” (Burl, 2003)
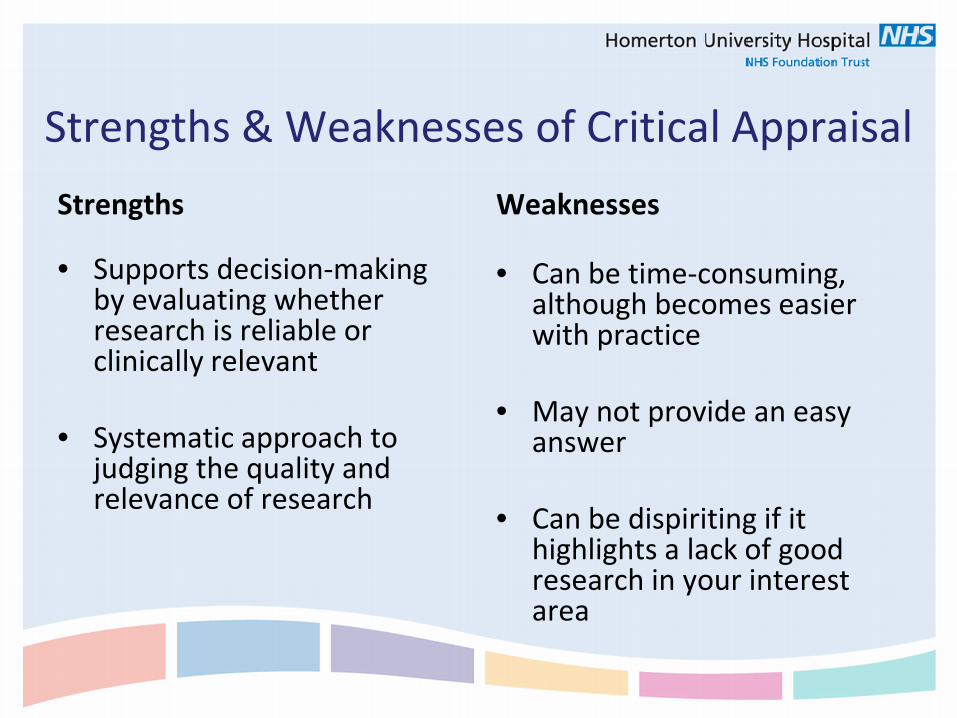
Strengths & Weaknesses of Critical Appraisal Strengths
• Supports decision-making by evaluating whether research is reliable or clinically relevant
• Systematic approach to judging the quality and relevance of research
Weaknesses
• Can be time-consuming, although becomes easier with practice
• May not provide an easy answer
• Can be dispiriting if it highlights a lack of good research in your interest area
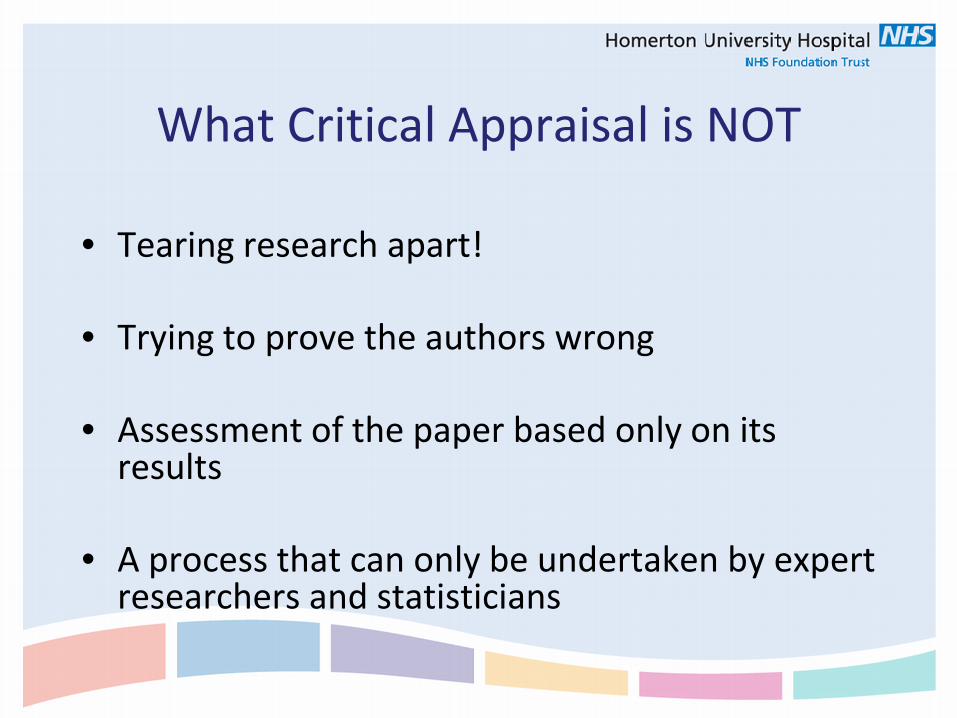
What Critical Appraisal is NOT
• Tearing research apart!
• Trying to prove the authors wrong
• Assessment of the paper based only on its results
• A process that can only be undertaken by expert researchers and statisticians
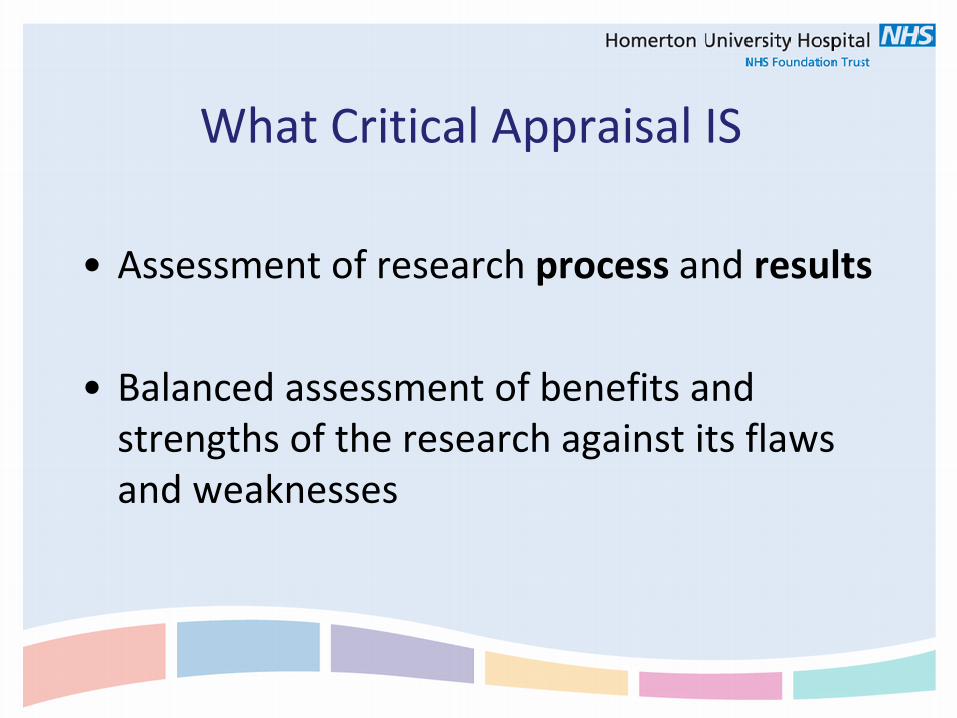
What Critical Appraisal IS
• Assessment of research process and results
• Balanced assessment of benefits and strengths of the research against its flaws and weaknesses
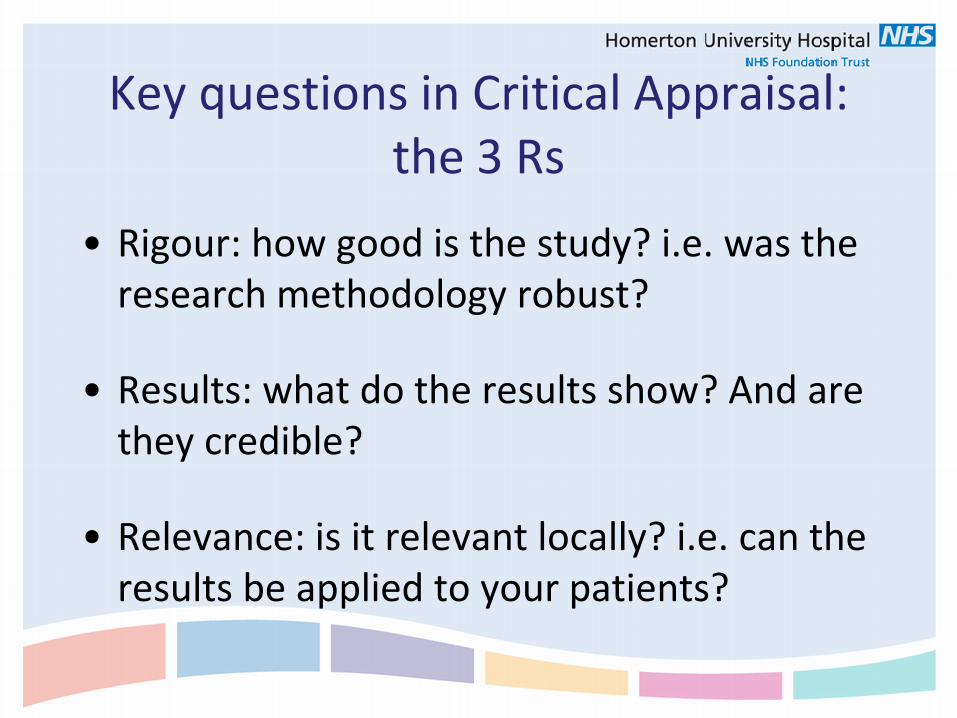
Key questions in Critical Appraisal: the 3 Rs
• Rigour: how good is the study? i.e. was the research methodology robust?
• Results: what do the results show? And are they credible?
• Relevance: is it relevant locally? i.e. can the results be applied to your patients?
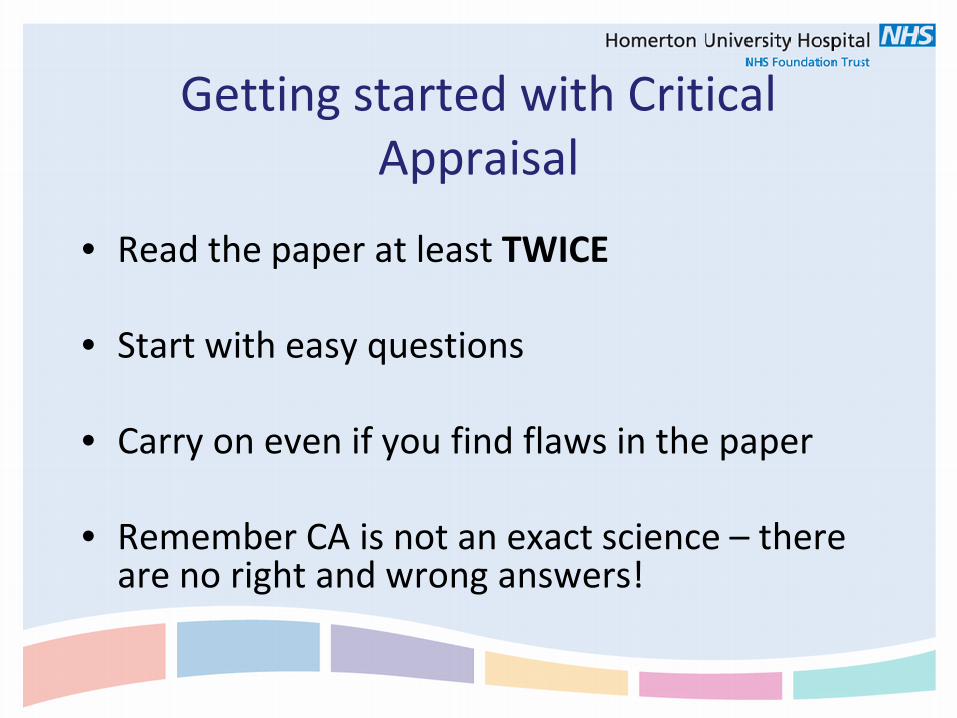
Getting started with Critical Appraisal
• Read the paper at least TWICE
• Start with easy questions
• Carry on even if you find flaws in the paper
• Remember CA is not an exact science – there are no right and wrong answers!
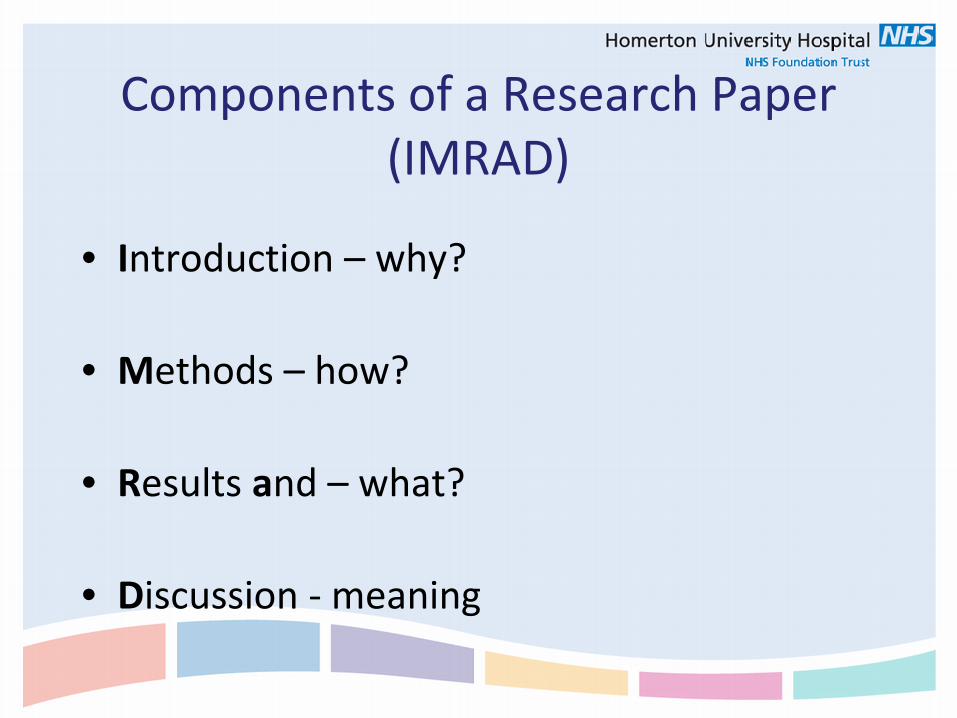
Components of a Research Paper (IMRAD)
• Introduction – why?
• Methods – how?
• Results and – what?
• Discussion - meaning
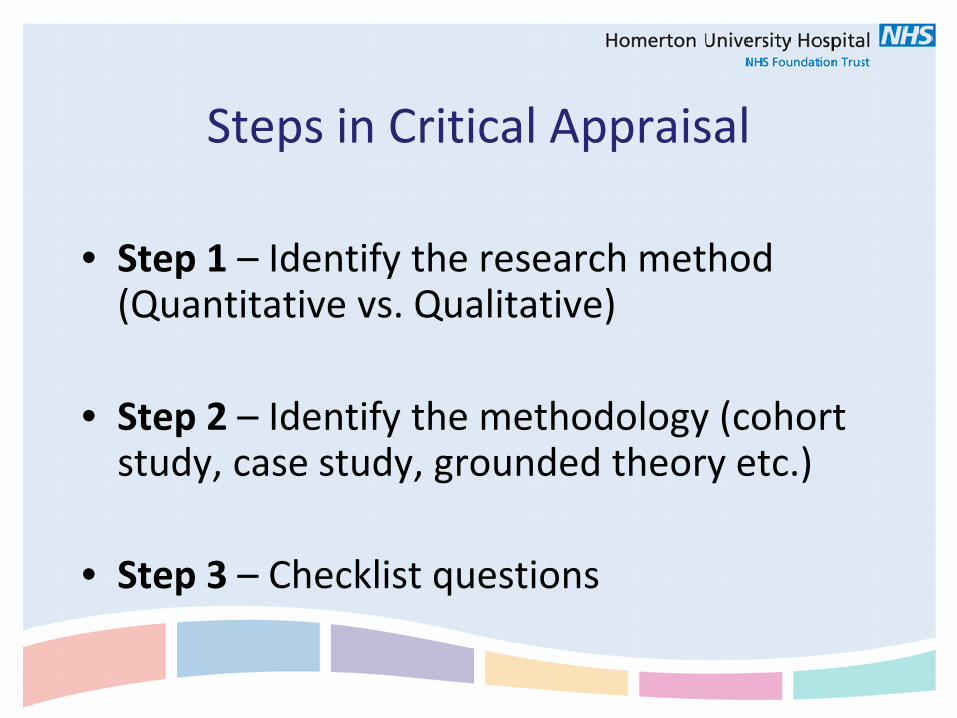
Steps in Critical Appraisal
• Step 1 – Identify the research method (Quantitative vs. Qualitative)
• Step 2 – Identify the methodology (cohort study, case study, grounded theory etc.)
• Step 3 – Checklist questions
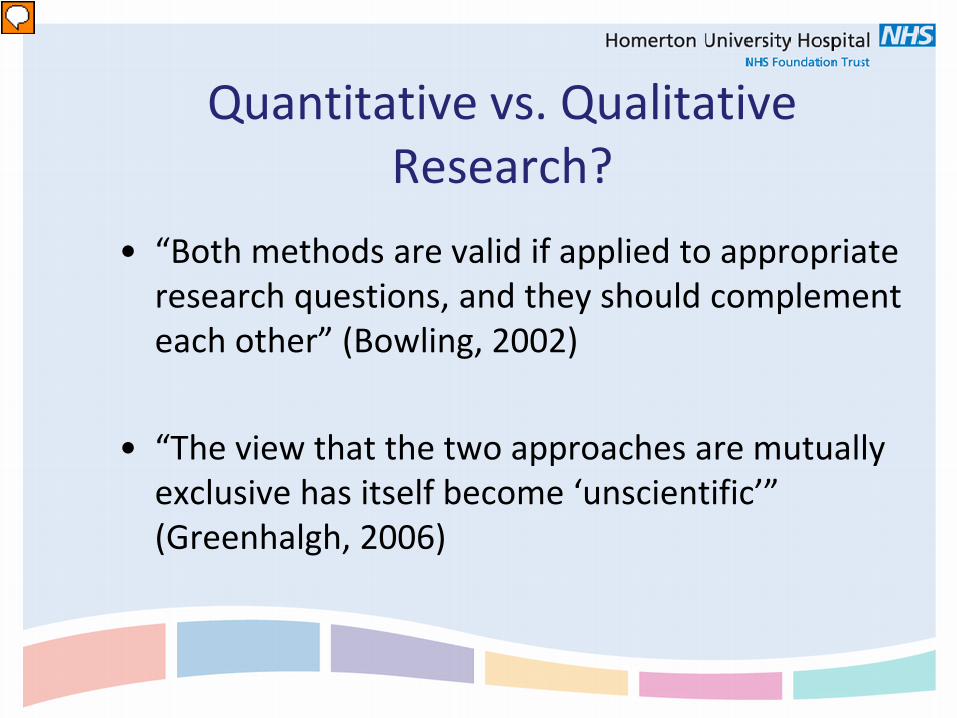
Quantitative vs. Qualitative Research?
• “Both methods are valid if applied to appropriate research questions, and they should complement each other” (Bowling, 2002)
• “The view that the two approaches are mutually exclusive has itself become ‘unscientific’” (Greenhalgh, 2006)
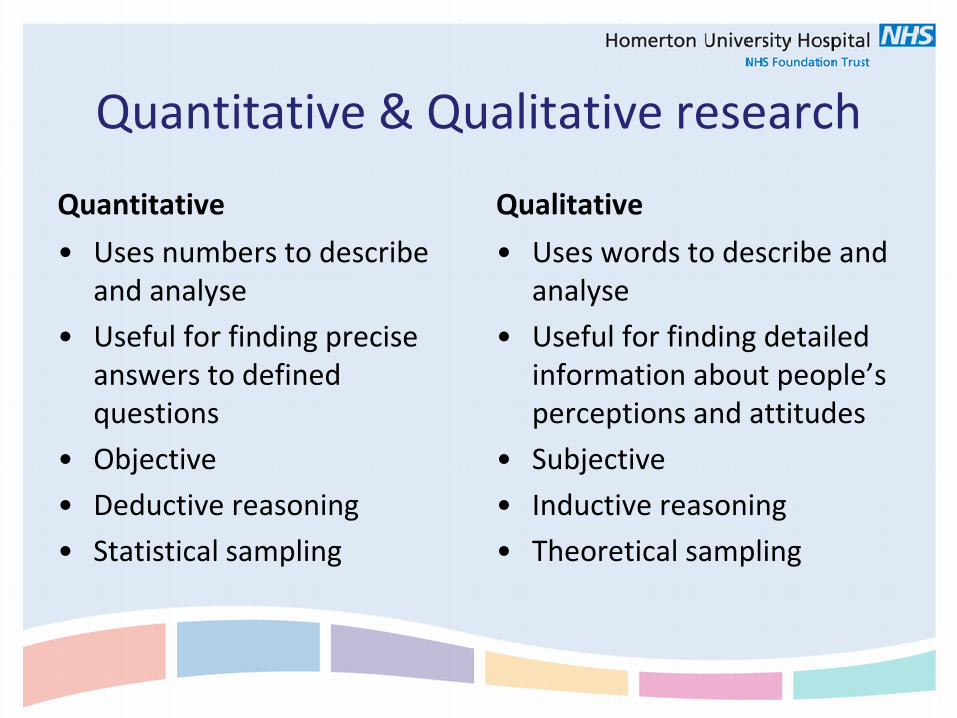
Quantitative & Qualitative research
Quantitative • Uses numbers to describe
and analyse • Useful for finding precise
answers to defined questions
• Objective • Deductive reasoning • Statistical sampling
Qualitative • Uses words to describe and
analyse • Useful for finding detailed
information about people’s perceptions and attitudes
• Subjective • Inductive reasoning • Theoretical sampling
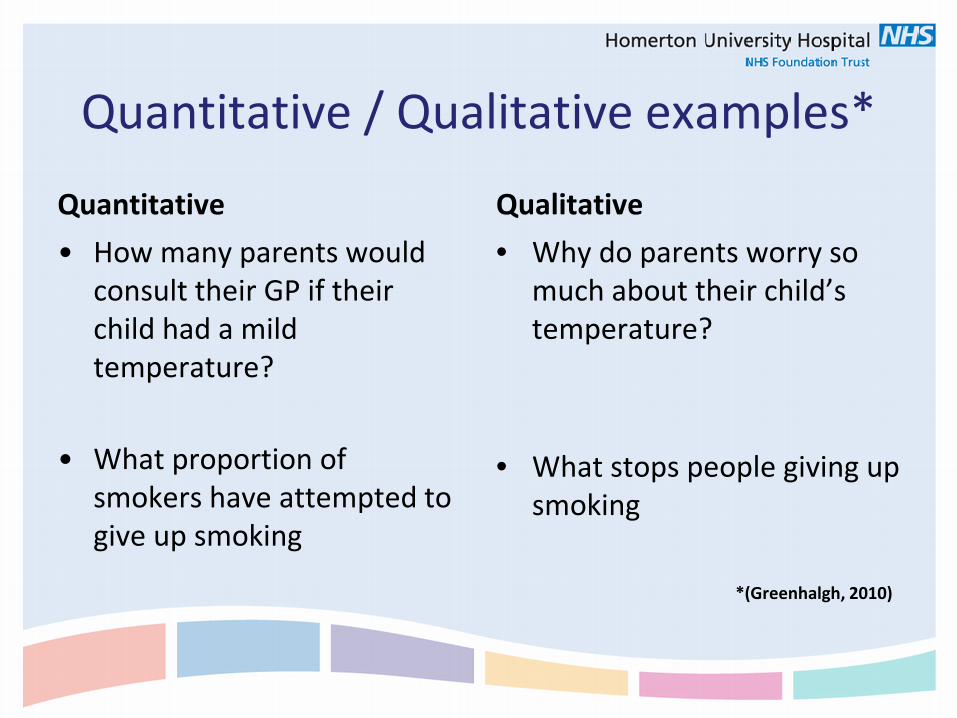
Quantitative / Qualitative examples*
Quantitative • How many parents would
consult their GP if their child had a mild temperature?
• What proportion of smokers have attempted to give up smoking
Qualitative • Why do parents worry so
much about their child’s temperature?
• What stops people giving up smoking
*(Greenhalgh, 2010)
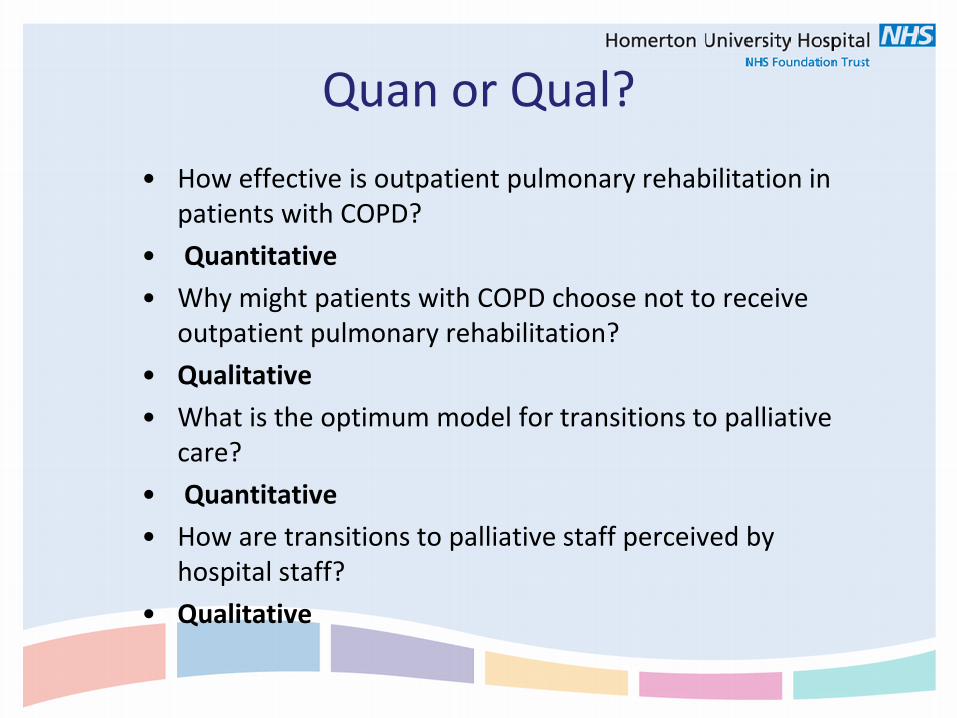
Quan or Qual? • How effective is outpatient pulmonary rehabilitation in
patients with COPD? • Quantitative • Why might patients with COPD choose not to receive
outpatient pulmonary rehabilitation? • Qualitative • What is the optimum model for transitions to palliative
care? • Quantitative • How are transitions to palliative staff perceived by
hospital staff? • Qualitative
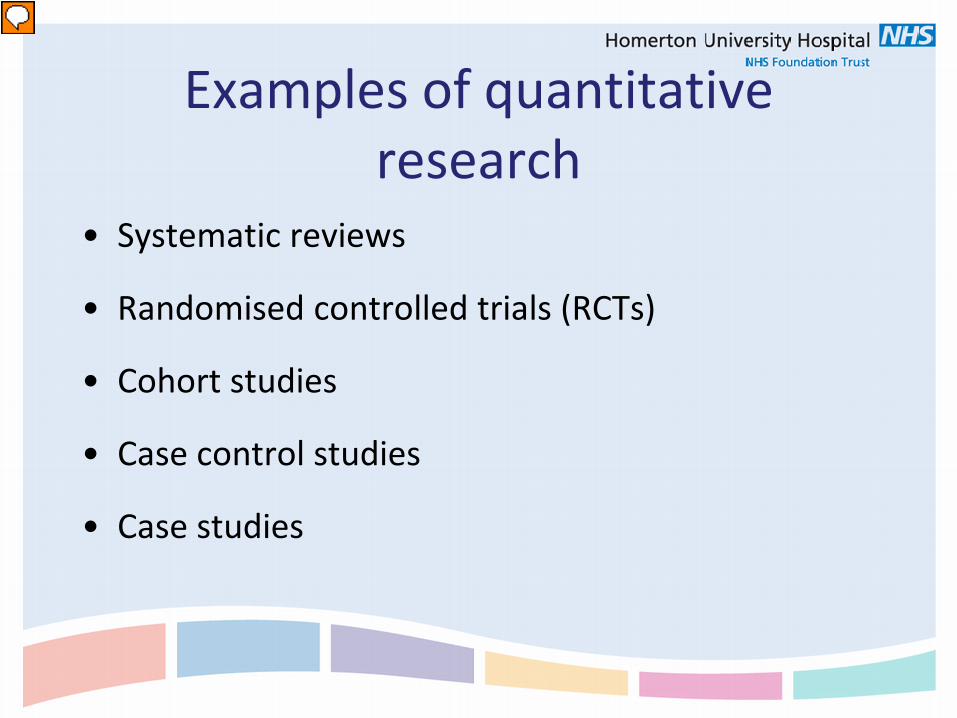
Examples of quantitative research
• Systematic reviews
• Randomised controlled trials (RCTs)
• Cohort studies
• Case control studies
• Case studies
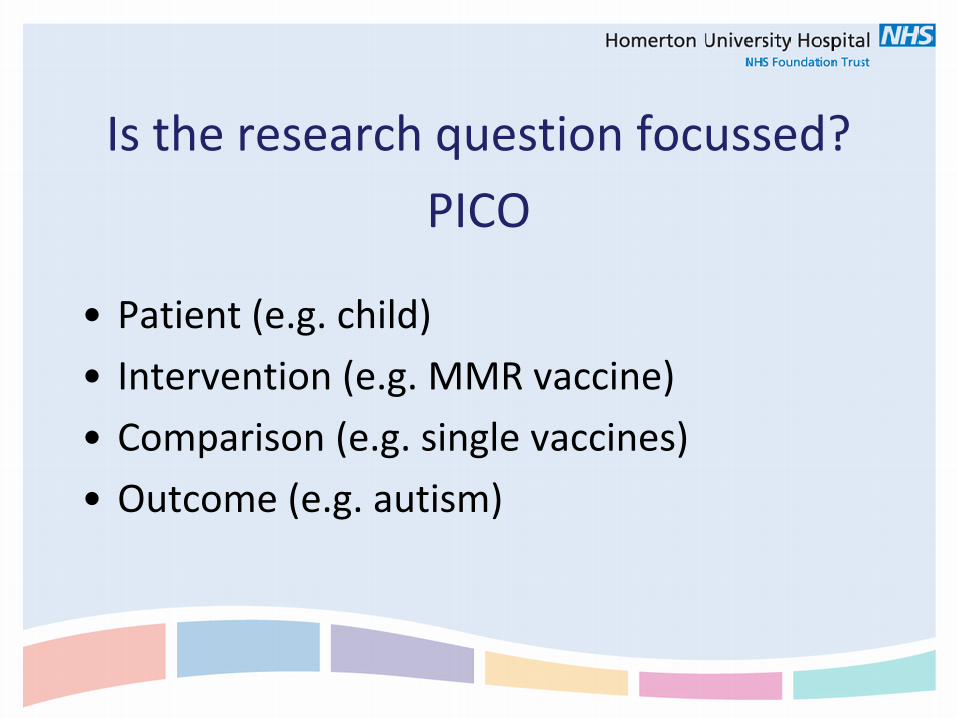
Is the research question focussed?
PICO
• Patient (e.g. child) • Intervention (e.g. MMR vaccine) • Comparison (e.g. single vaccines) • Outcome (e.g. autism)
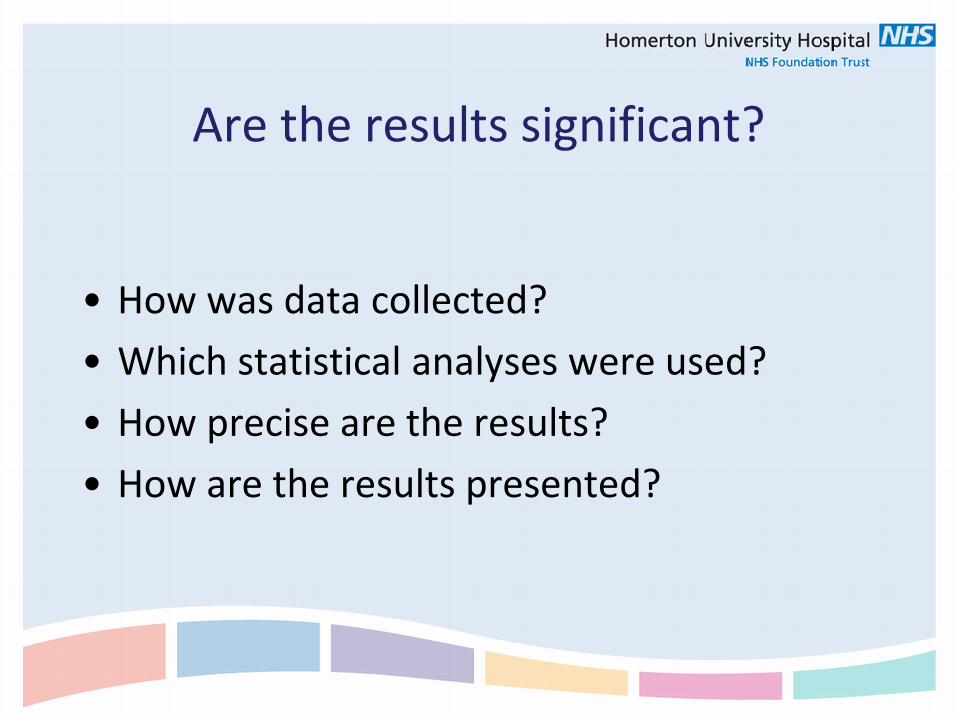
Are the results significant?
• How was data collected? • Which statistical analyses were used? • How precise are the results? • How are the results presented?
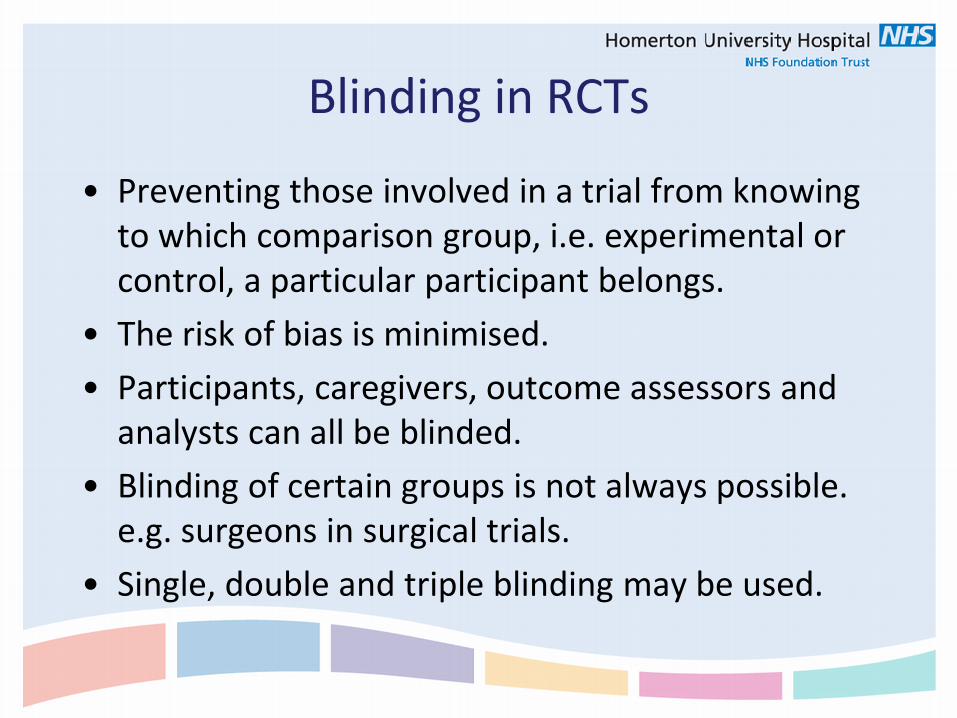
Blinding in RCTs
• Preventing those involved in a trial from knowing to which comparison group, i.e. experimental or control, a particular participant belongs.
• The risk of bias is minimised. • Participants, caregivers, outcome assessors and
analysts can all be blinded. • Blinding of certain groups is not always possible.
e.g. surgeons in surgical trials. • Single, double and triple blinding may be used.
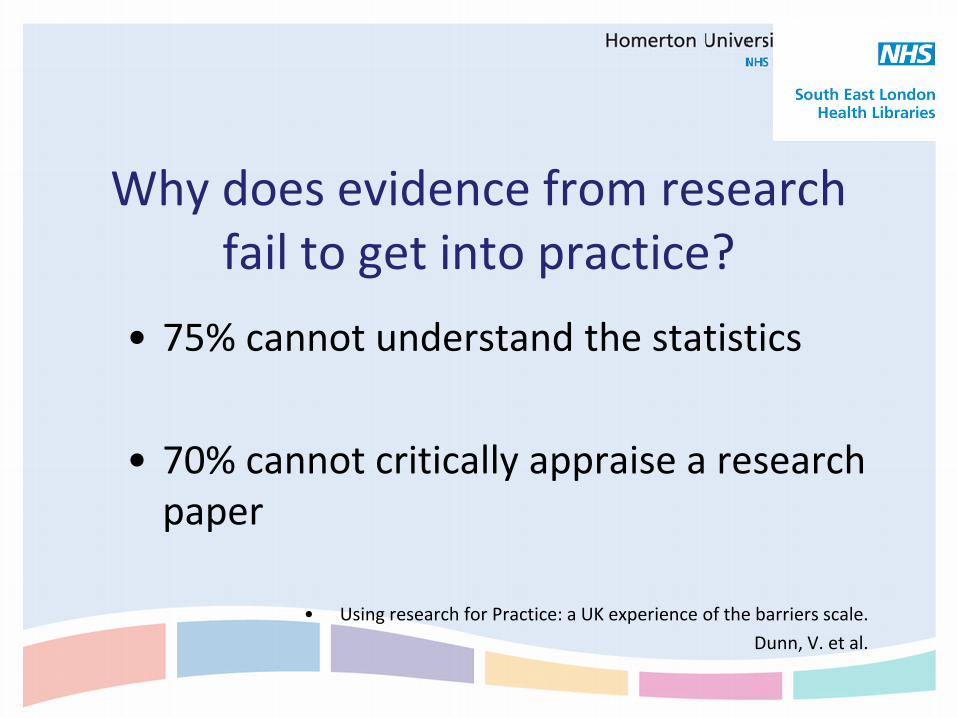
Why does evidence from research fail to get into practice?
• 75% cannot understand the statistics
• 70% cannot critically appraise a research paper
• Using research for Practice: a UK experience of the barriers scale. Dunn, V. et al.
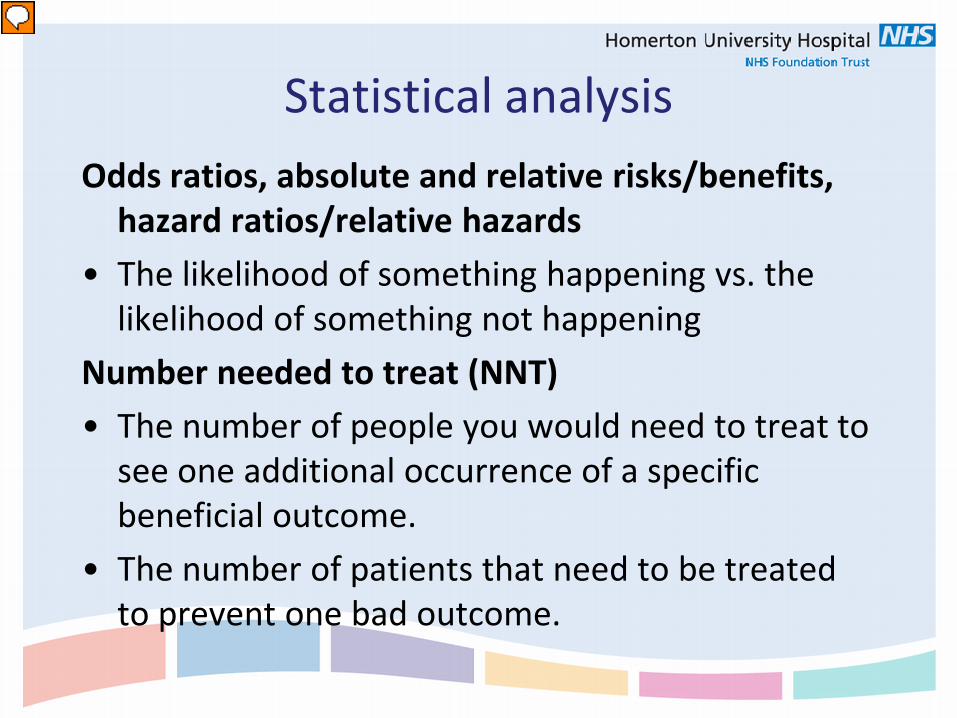
Statistical analysis Odds ratios, absolute and relative risks/benefits,
hazard ratios/relative hazards • The likelihood of something happening vs. the
likelihood of something not happening Number needed to treat (NNT) • The number of people you would need to treat to
see one additional occurrence of a specific beneficial outcome.
• The number of patients that need to be treated to prevent one bad outcome.
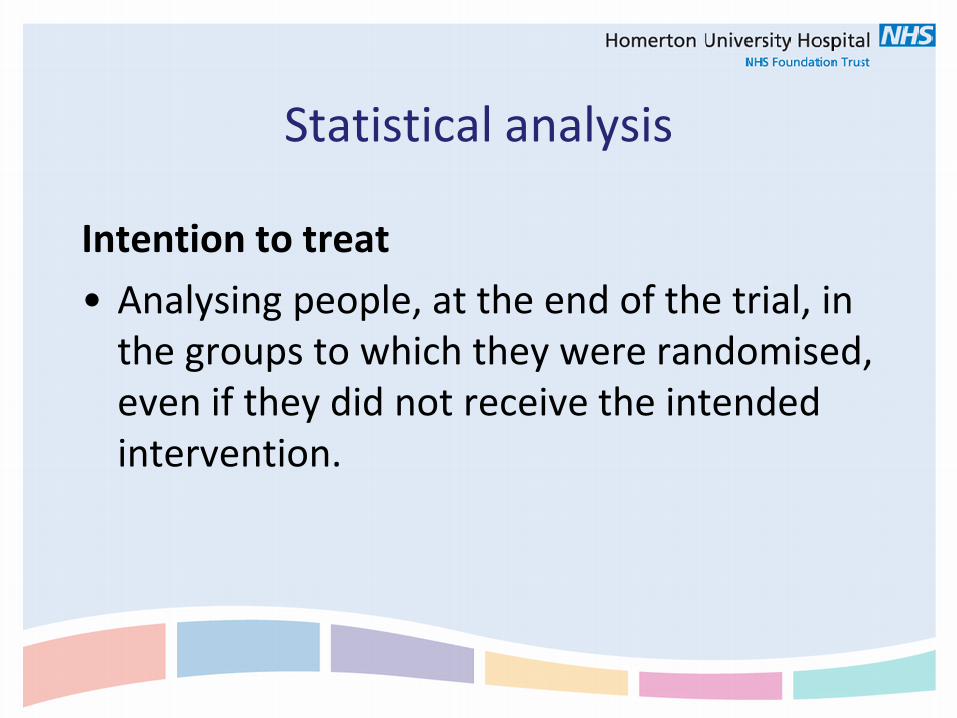
Statistical analysis
Intention to treat • Analysing people, at the end of the trial, in
the groups to which they were randomised, even if they did not receive the intended intervention.
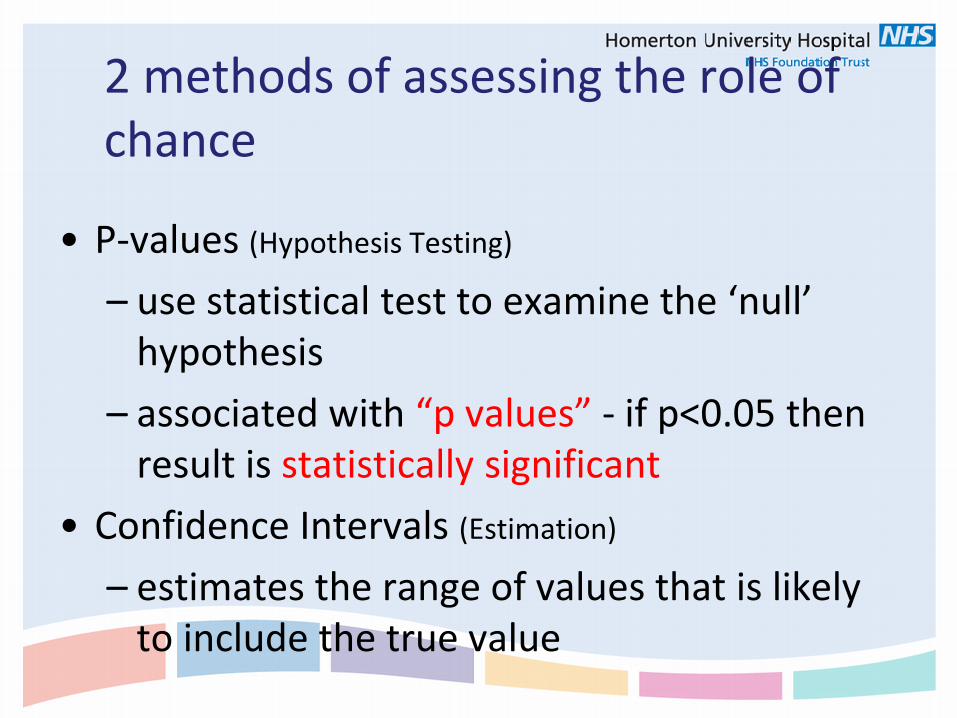
2 methods of assessing the role of chance
• P-values (Hypothesis Testing)
– use statistical test to examine the ‘null’ hypothesis
– associated with “p values” - if p<0.05 then result is statistically significant
• Confidence Intervals (Estimation)
– estimates the range of values that is likely to include the true value
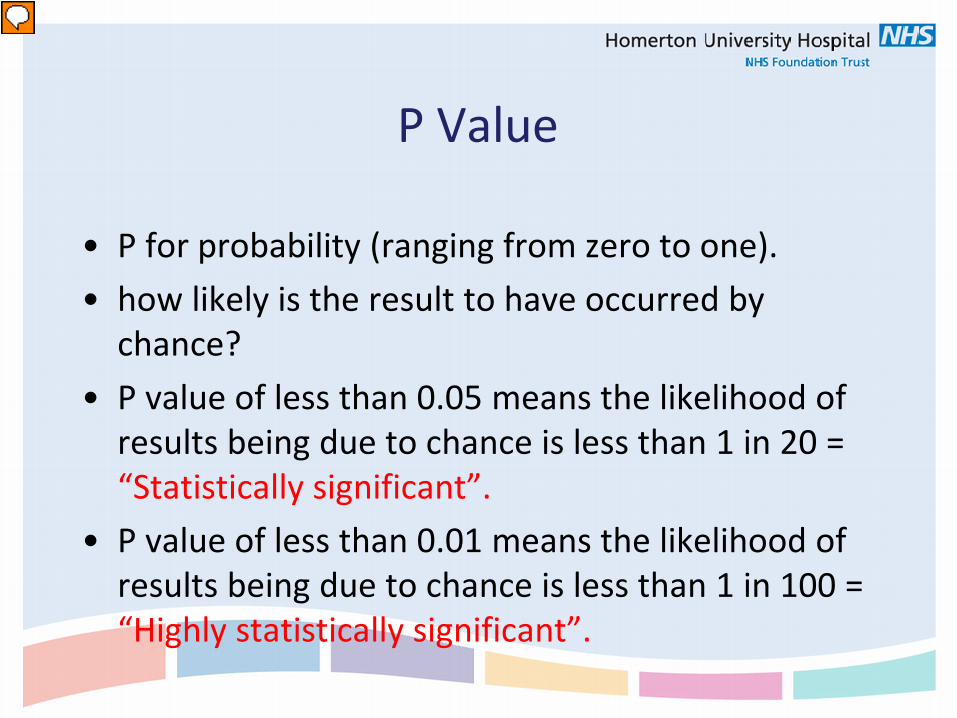
P Value
• P for probability (ranging from zero to one). • how likely is the result to have occurred by
chance? • P value of less than 0.05 means the likelihood of
results being due to chance is less than 1 in 20 = “Statistically significant”.
• P value of less than 0.01 means the likelihood of results being due to chance is less than 1 in 100 = “Highly statistically significant”.
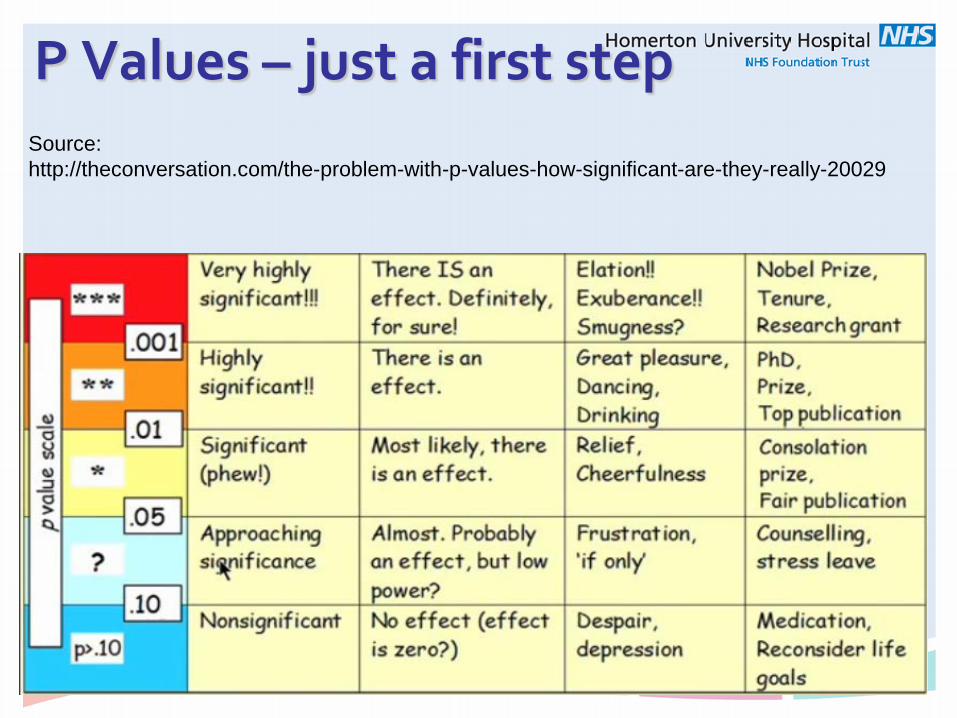
P Values – just a first step
Source: http://theconversation.com/the-problem-with-p-values-how-significant-are-they-really-20029
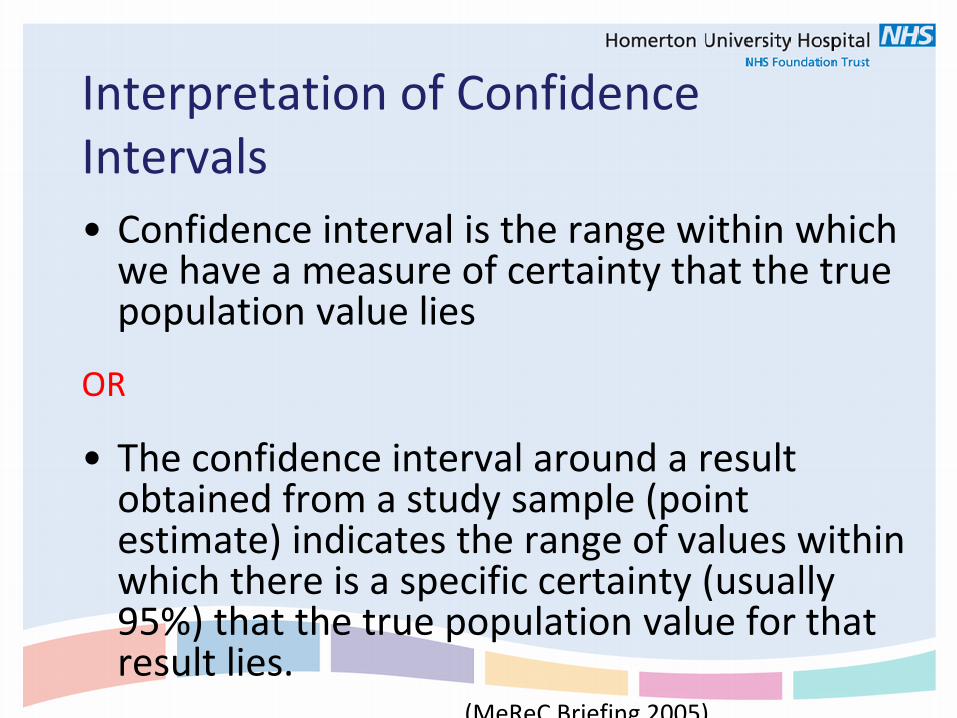
Interpretation of Confidence Intervals • Confidence interval is the range within which
we have a measure of certainty that the true population value lies
OR
• The confidence interval around a result obtained from a study sample (point estimate) indicates the range of values within which there is a specific certainty (usually 95%) that the true population value for that result lies.
(MeReC Briefing 2005)
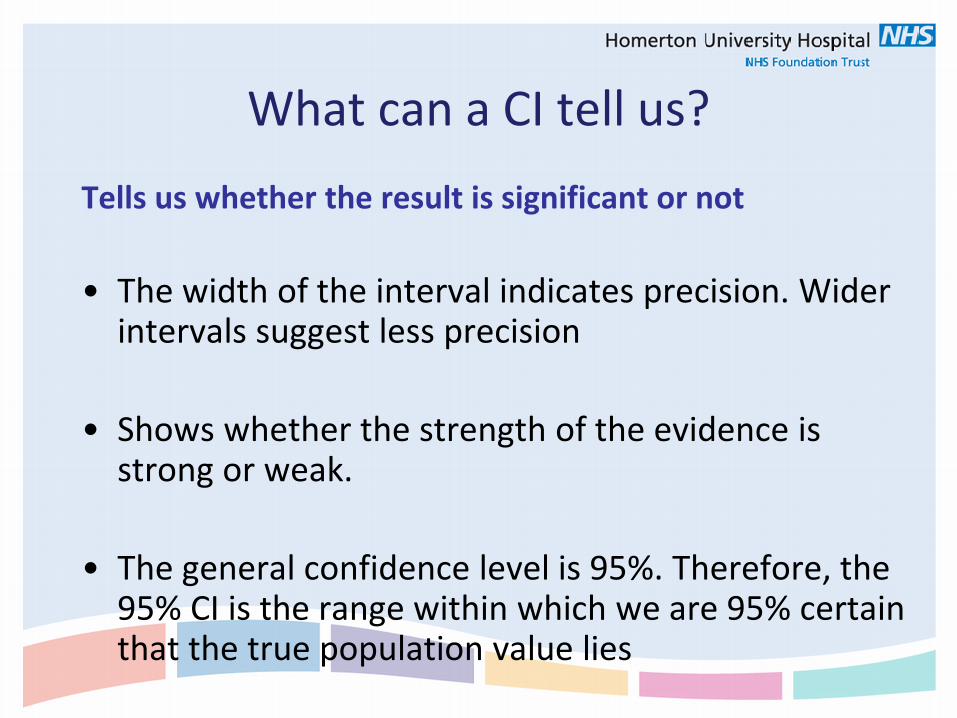
What can a CI tell us? Tells us whether the result is significant or not
• The width of the interval indicates precision. Wider
intervals suggest less precision • Shows whether the strength of the evidence is
strong or weak.
• The general confidence level is 95%. Therefore, the 95% CI is the range within which we are 95% certain that the true population value lies
Confidence Intervals
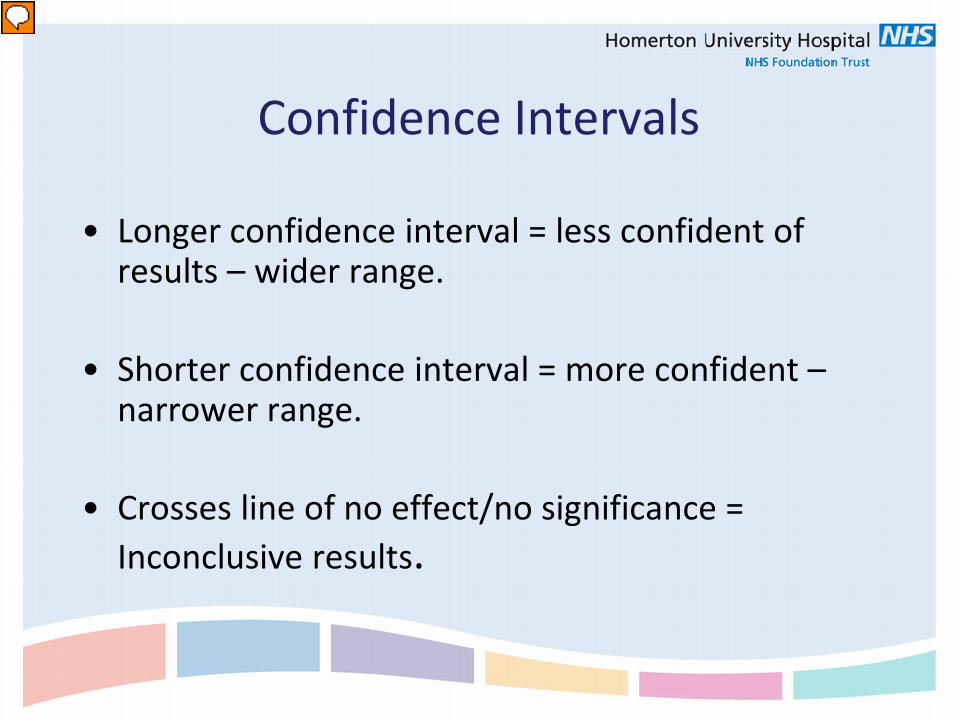
• Longer confidence interval = less confident of results – wider range.
• Shorter confidence interval = more confident – narrower range.
• Crosses line of no effect/no significance = Inconclusive results.
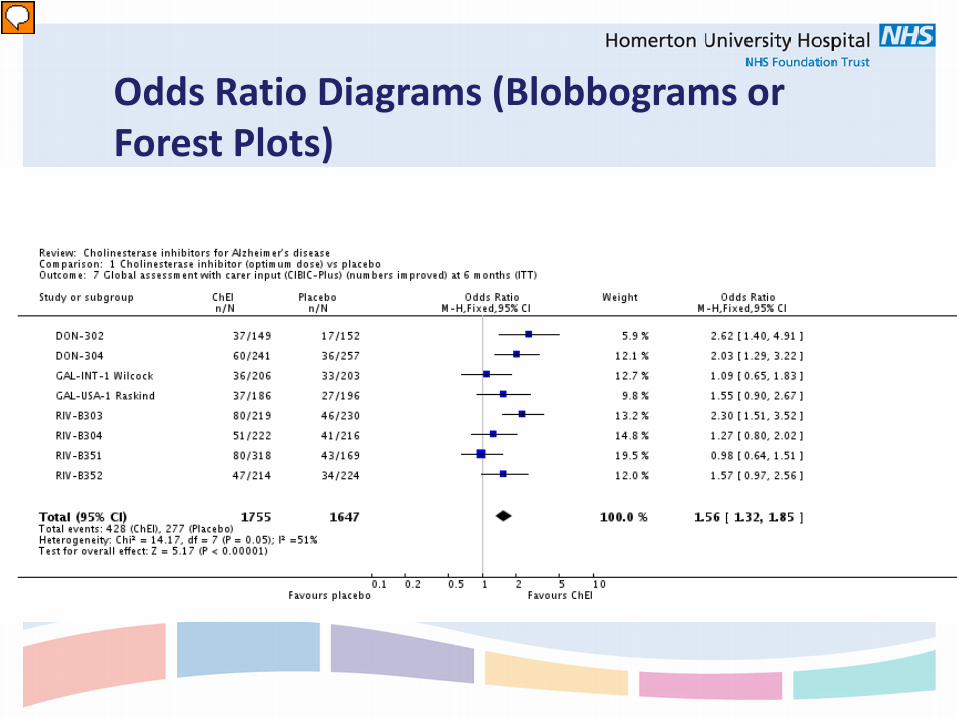
Odds Ratio Diagrams (Blobbograms or Forest Plots)
Odds Ratio Diagrams • Line of no effect – no difference between
treatment and control group • Result (blob) to the Left of the line of no
effect = Less of the outcome in the treatment group.
• Result to the Right of the line = More of the outcome.
• BUT - Is the outcome good or bad?
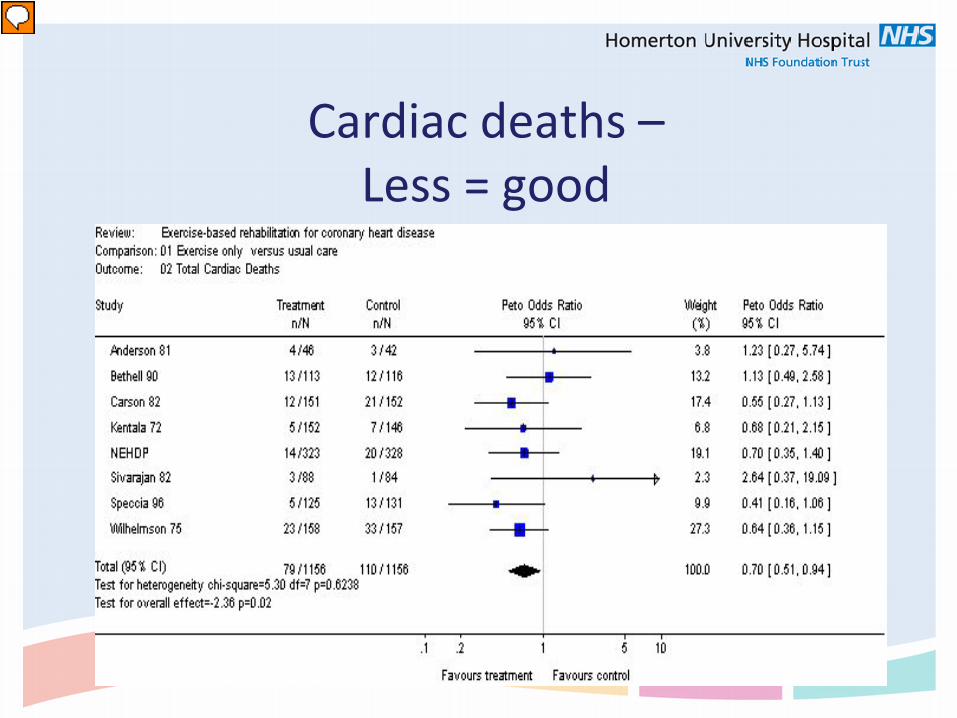
Cardiac deaths –
Less = good
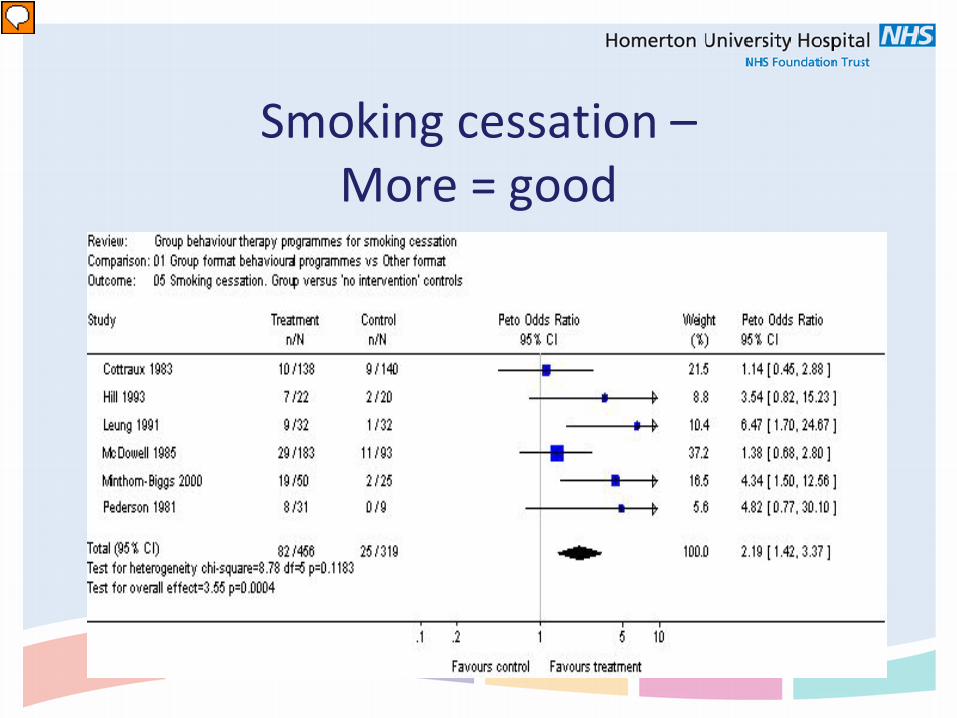
Smoking cessation –
More = good
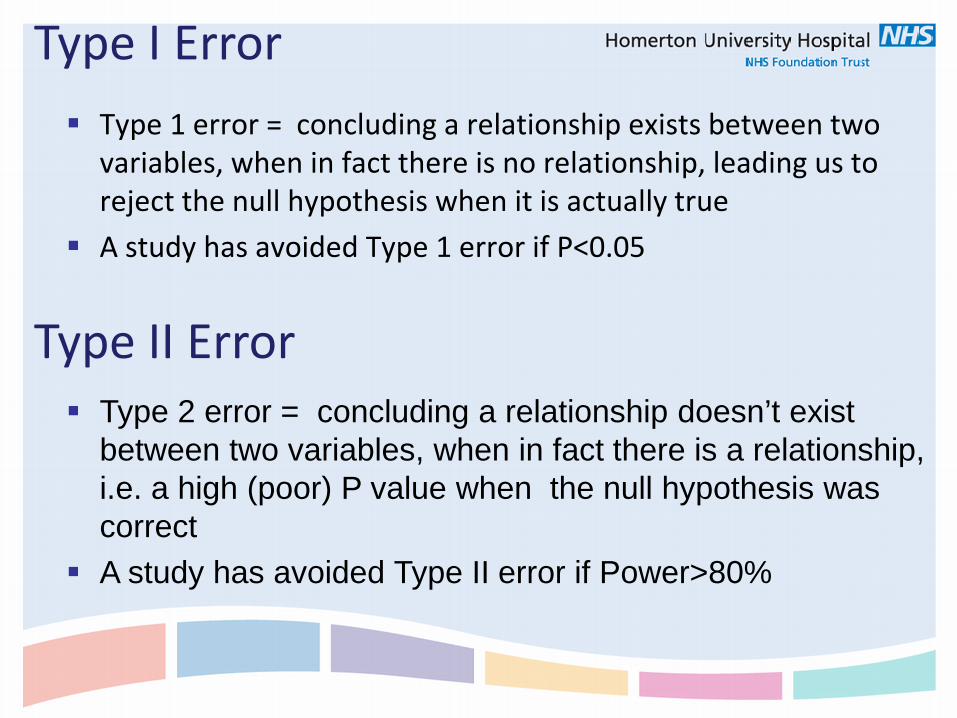
Type 1 error = concluding a relationship exists between two variables, when in fact there is no relationship, leading us to reject the null hypothesis when it is actually true
A study has avoided Type 1 error if P<0.05
Type I Error
Type II Error Type 2 error = concluding a relationship doesn’t exist
between two variables, when in fact there is a relationship, i.e. a high (poor) P value when the null hypothesis was correct
A study has avoided Type II error if Power>80%
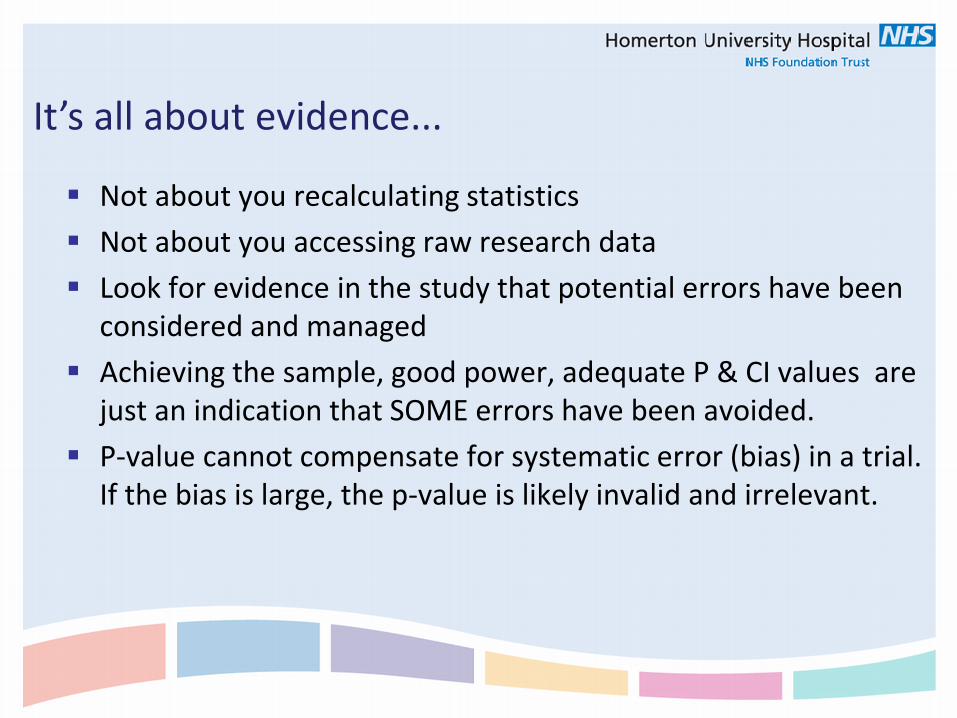
Not about you recalculating statistics Not about you accessing raw research data Look for evidence in the study that potential errors have been
considered and managed Achieving the sample, good power, adequate P & CI values are
just an indication that SOME errors have been avoided. P-value cannot compensate for systematic error (bias) in a trial.
If the bias is large, the p-value is likely invalid and irrelevant.
It’s all about evidence...
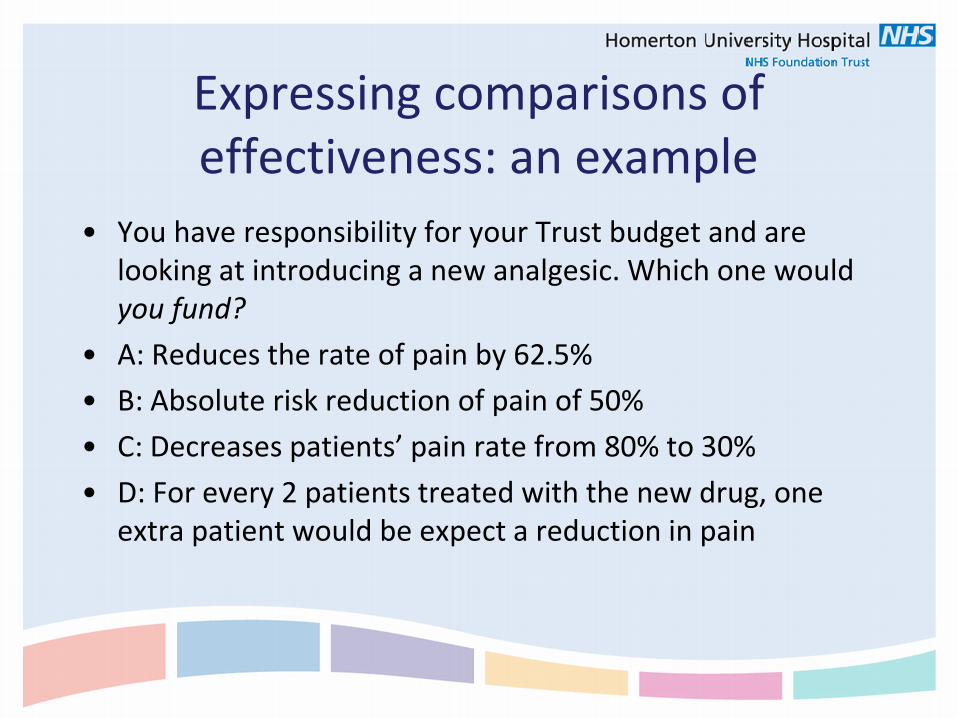
Expressing comparisons of effectiveness: an example
• You have responsibility for your Trust budget and are looking at introducing a new analgesic. Which one would you fund?
• A: Reduces the rate of pain by 62.5% • B: Absolute risk reduction of pain of 50% • C: Decreases patients’ pain rate from 80% to 30% • D: For every 2 patients treated with the new drug, one
extra patient would be expect a reduction in pain
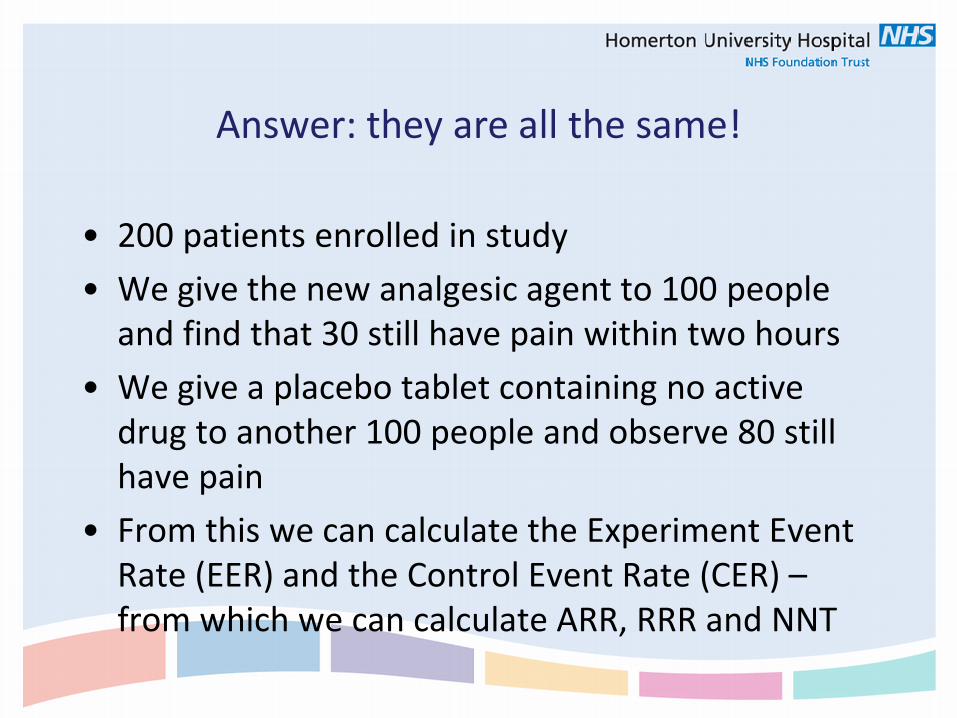
Answer: they are all the same!
• 200 patients enrolled in study • We give the new analgesic agent to 100 people
and find that 30 still have pain within two hours • We give a placebo tablet containing no active
drug to another 100 people and observe 80 still have pain
• From this we can calculate the Experiment Event Rate (EER) and the Control Event Rate (CER) –from which we can calculate ARR, RRR and NNT
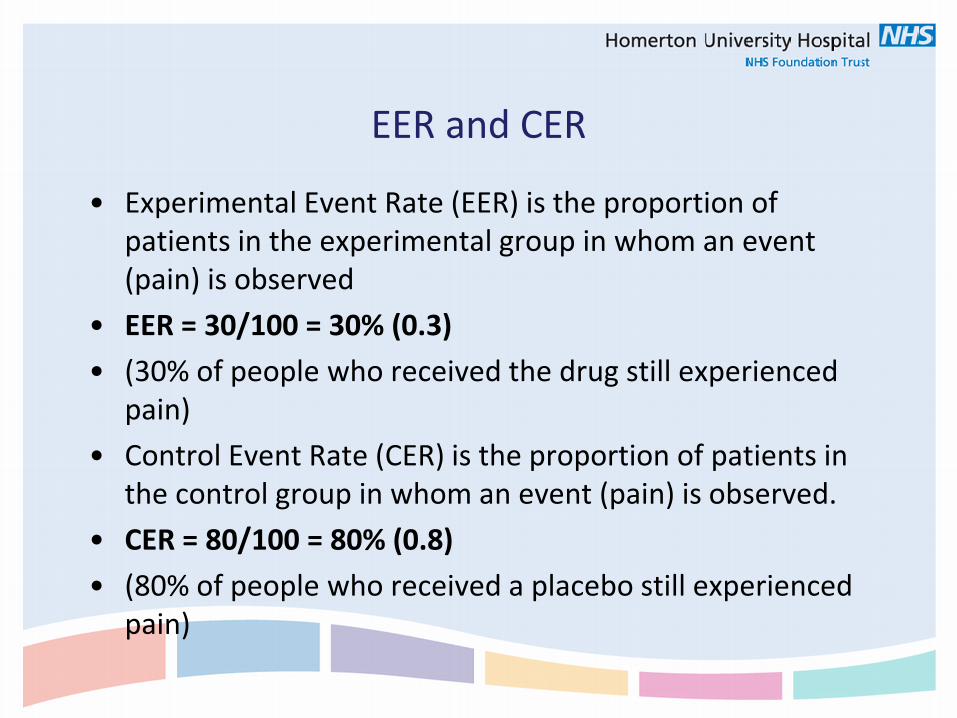
EER and CER
• Experimental Event Rate (EER) is the proportion of patients in the experimental group in whom an event (pain) is observed
• EER = 30/100 = 30% (0.3) • (30% of people who received the drug still experienced
pain) • Control Event Rate (CER) is the proportion of patients in
the control group in whom an event (pain) is observed. • CER = 80/100 = 80% (0.8) • (80% of people who received a placebo still experienced
pain)
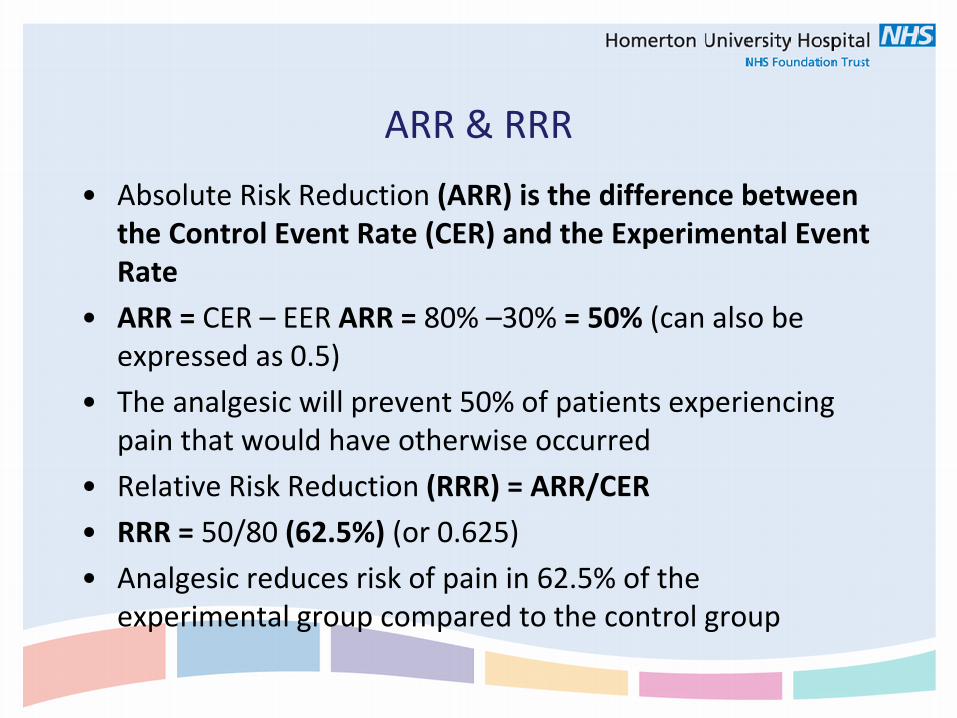
ARR & RRR • Absolute Risk Reduction (ARR) is the difference between
the Control Event Rate (CER) and the Experimental Event Rate
• ARR = CER – EER ARR = 80% –30% = 50% (can also be expressed as 0.5)
• The analgesic will prevent 50% of patients experiencing pain that would have otherwise occurred
• Relative Risk Reduction (RRR) = ARR/CER • RRR = 50/80 (62.5%) (or 0.625) • Analgesic reduces risk of pain in 62.5% of the
experimental group compared to the control group
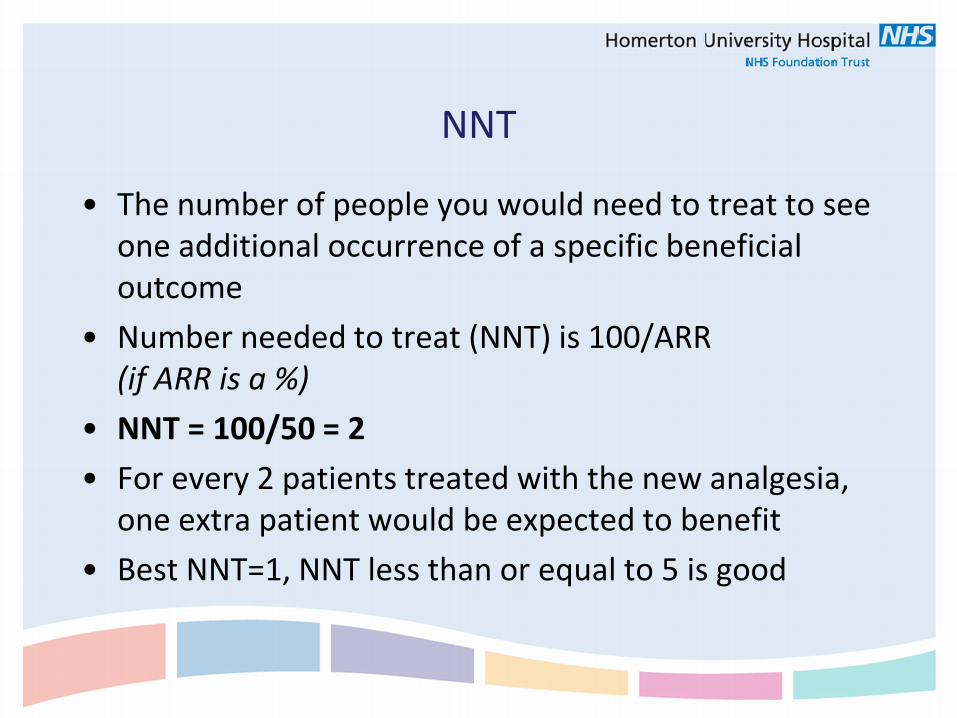
NNT
• The number of people you would need to treat to see one additional occurrence of a specific beneficial outcome
• Number needed to treat (NNT) is 100/ARR (if ARR is a %)
• NNT = 100/50 = 2 • For every 2 patients treated with the new analgesia,
one extra patient would be expected to benefit • Best NNT=1, NNT less than or equal to 5 is good
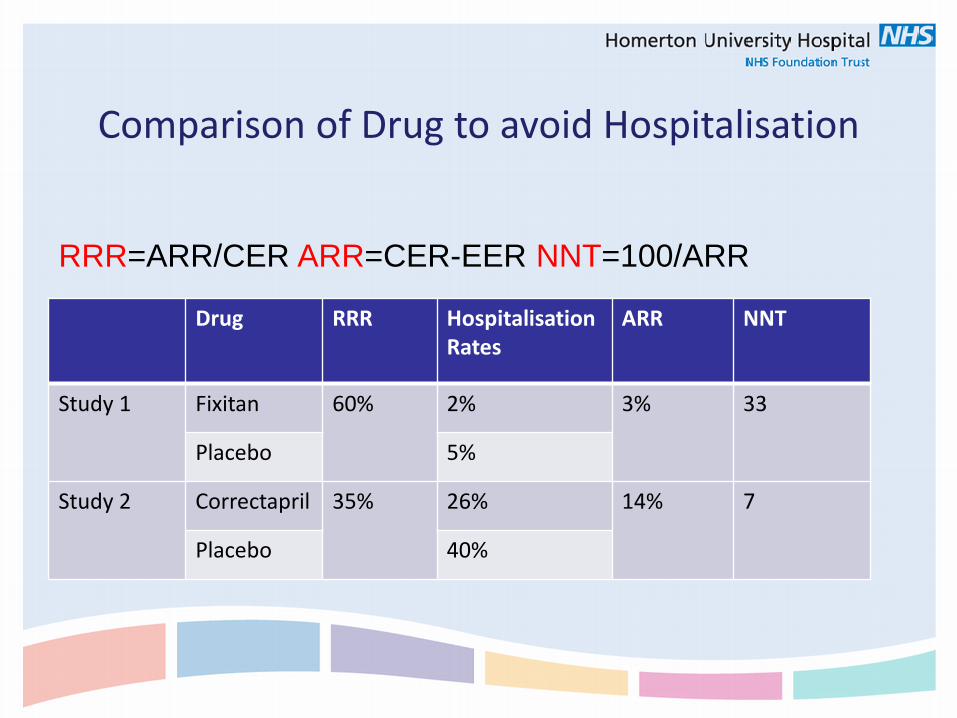
Comparison of Drug to avoid Hospitalisation
Drug RRR Hospitalisation Rates
ARR NNT
Study 1 Fixitan 60% 2% 3% 33
Placebo 5%
Study 2 Correctapril 35% 26% 14% 7
Placebo 40%
RRR=ARR/CER ARR=CER-EER NNT=100/ARR
Useful resources • Glossary from Bandolier http://www.medicine.ox.ac.uk/bandolier/glossary.html
• Other useful documents from Bandolier http://www.medicine.ox.ac.uk/bandolier/booth/booths/ebmstor.html http://www.medicine.ox.ac.uk/bandolier/learnzone.html
• What is Critical Appraisal is part of a series http://www.whatisseries.co.uk/whatis/
• Checklists SIGN: http://www.sign.ac.uk/methodology/checklists.html CASP: http://www.caspinternational.org/?o=1012 CEBM: http://www.cebm.net/index.aspx?o=1913
Feedback
Thank you for attending Questions? Please complete an evaluation questionnaire
http://www.surveymonkey.com/s/newcomb2015-2016

For more information or assistance, please contact us at the Newcomb Library: Tel: 020 8510 7751 E-mail: [email protected]