Embed Size (px)
Citation preview
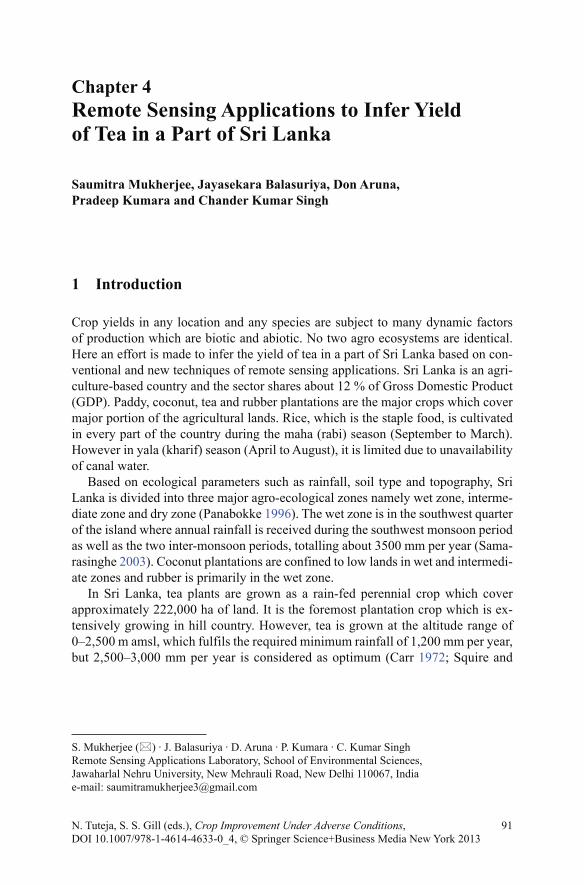
91
1 Introduction
Crop yields in any location and any species are subject to many dynamic factors of production which are biotic and abiotic. No two agro ecosystems are identical. Here an effort is made to infer the yield of tea in a part of Sri Lanka based on con-ventional and new techniques of remote sensing applications. Sri Lanka is an agri-culture-based country and the sector shares about 12 % of Gross Domestic Product (GDP). Paddy, coconut, tea and rubber plantations are the major crops which cover major portion of the agricultural lands. Rice, which is the staple food, is cultivated in every part of the country during the maha (rabi) season (September to March). However in yala (kharif) season (April to August), it is limited due to unavailability of canal water.
Based on ecological parameters such as rainfall, soil type and topography, Sri Lanka is divided into three major agro-ecological zones namely wet zone, interme-diate zone and dry zone (Panabokke 1996). The wet zone is in the southwest quarter of the island where annual rainfall is received during the southwest monsoon period as well as the two inter-monsoon periods, totalling about 3500 mm per year (Sama-rasinghe 2003). Coconut plantations are confined to low lands in wet and intermedi-ate zones and rubber is primarily in the wet zone.
In Sri Lanka, tea plants are grown as a rain-fed perennial crop which cover approximately 222,000 ha of land. It is the foremost plantation crop which is ex-tensively growing in hill country. However, tea is grown at the altitude range of 0–2,500 m amsl, which fulfils the required minimum rainfall of 1,200 mm per year, but 2,500–3,000 mm per year is considered as optimum (Carr 1972; Squire and
N. Tuteja, S. S. Gill (eds.), Crop Improvement Under Adverse Conditions, DOI 10.1007/978-1-4614-4633-0_4, © Springer Science+Business Media New York 2013
Chapter 4Remote Sensing Applications to Infer Yield of Tea in a Part of Sri Lanka
Saumitra Mukherjee, Jayasekara Balasuriya, Don Aruna, Pradeep Kumara and Chander Kumar Singh
S. Mukherjee () · J. Balasuriya · D. Aruna · P. Kumara · C. Kumar SinghRemote Sensing Applications Laboratory, School of Environmental Sciences, Jawaharlal Nehru University, New Mehrauli Road, New Delhi 110067, Indiae-mail: [email protected]

92
Callander 1981; Watson 1986). Therefore, tea plantations are distributed in up, mid and low-country regions, belonging to wet and intermediate zones.
Tea production is classified based on its growing regions, such as high, medium and low-grown tea. However, the quality or flavour of each category is unique. Most distinguishable up country tea is characterized by its flavour and aroma while low-grown tea is identical for its strength and colour. In terms of production, low-grown tea dominated over others (173.2 million kg in 2009) followed by high (72.3 mil-lion kg) and medium (44.3 million kg) grown tea. Economically, the tea sector is important and contributes about 1 % to the GDP. However, the present average yield of 1,550 kg per hectare is much lower than the average yield of other tea-growing countries like India (1,800 kg/ha), Kenya (2,400 kg/ha) (Annual report 2009).
According to the central bank report (2009) in Sri Lanka, the major reason for the lower productivity is due to senility of the tea bushes. Furthermore, in high-grown areas, around 90 % of tea bushes are more than 100 years old and in low-grown areas, the majority of tea bushes of vegetatively propagated (VP) varieties are older than 30 years. Therefore, main emphasis was laid on replanting programmes to achieve minimum of 3 % replanting per year. However, identification of low-pro-ductive fields and suitable land unit for such programme is not straight forward. Therefore, it is vital to have proper scientific basis for the rational decision-making at management level. GIS and remote sensing has proved to be a handy tool to infer land productivity and the suitability.
Remote sensing and GIS technology has advanced over the last few decades and one of the most important applications of it is the database management, to store information for quick access and analysis. GIS data have specific location in space;In other words, those spatial data have been referenced to a co-ordinate system. It is called geographically referenced. It was also possible to store non-spatial or attributes data in such databases. Therefore, GIS is able to store large amounts of different types of data for easy access. Furthermore, the spatial data can be combined with attribute data to generate new information in the decision-making process. Hence, tea plantations where the spatial distribution is massive, use of GIS enhances the ability of rational decision-making process. Turner and Jayakody (1994) emphasised the usefulness of computer-based technology as a tool for planning and managing tea plantations. Because, computer technology is capable of generating required information at its earliest to the higher management levels. However, the success of such a system heavily depends on accuracy of raw data, hence it is essential to have remote sensing with intensive ground-level truth to validate the acquired data. Since 70s, remote sensing technology has proved to be a useful application for evaluating biological activity of vegetation cover. In recent past, spectral data have been widely utilized for crop yield models. Further, it has been recognized as an inexpensive and rapid method for crop monitoring and early warning.
Therefore, this study was designed in a way to investigate the probability of us-ing remote sensing and GIS as management tools for extensive tea plantations in Sri Lanka. However, considering the limitations, the study was limited to Ratnapura
S. Mukherjee et al.
93
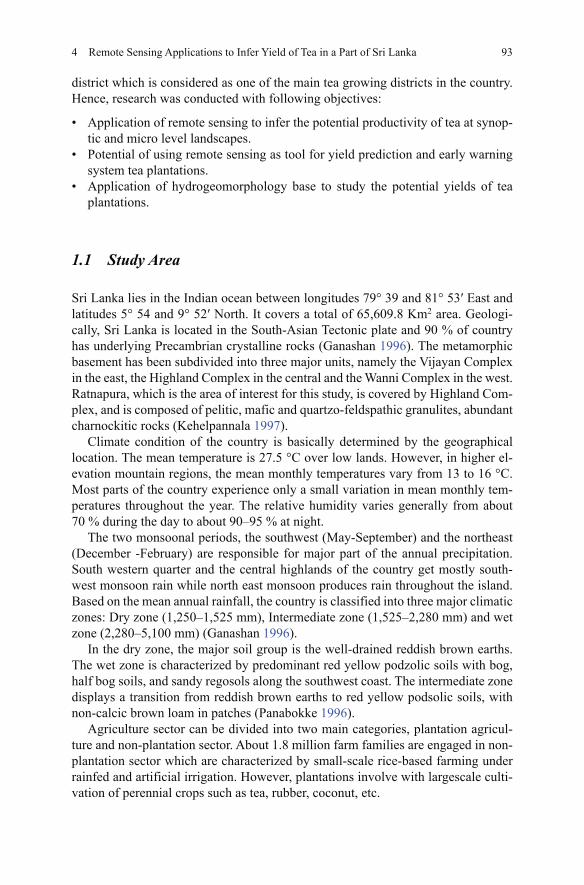
district which is considered as one of the main tea growing districts in the country. Hence, research was conducted with following objectives:
• Application of remote sensing to infer the potential productivity of tea at synop-tic and micro level landscapes.
• Potential of using remote sensing as tool for yield prediction and early warning system tea plantations.
• Application of hydrogeomorphology base to study the potential yields of tea plantations.
1.1 Study Area
Sri Lanka lies in the Indian ocean between longitudes 79° 39 and 81° 53′ East and latitudes 5° 54 and 9° 52′ North. It covers a total of 65,609.8 Km2 area. Geologi-cally, Sri Lanka is located in the South-Asian Tectonic plate and 90 % of country has underlying Precambrian crystalline rocks (Ganashan 1996). The metamorphic basement has been subdivided into three major units, namely the Vijayan Complex in the east, the Highland Complex in the central and the Wanni Complex in the west. Ratnapura, which is the area of interest for this study, is covered by Highland Com-plex, and is composed of pelitic, mafic and quartzo-feldspathic granulites, abundant charnockitic rocks (Kehelpannala 1997).
Climate condition of the country is basically determined by the geographical location. The mean temperature is 27.5 °C over low lands. However, in higher el-evation mountain regions, the mean monthly temperatures vary from 13 to 16 °C. Most parts of the country experience only a small variation in mean monthly tem-peratures throughout the year. The relative humidity varies generally from about 70 % during the day to about 90–95 % at night.
The two monsoonal periods, the southwest (May-September) and the northeast (December -February) are responsible for major part of the annual precipitation. South western quarter and the central highlands of the country get mostly south-west monsoon rain while north east monsoon produces rain throughout the island. Based on the mean annual rainfall, the country is classified into three major climatic zones: Dry zone (1,250–1,525 mm), Intermediate zone (1,525–2,280 mm) and wet zone (2,280–5,100 mm) (Ganashan 1996).
In the dry zone, the major soil group is the well-drained reddish brown earths. The wet zone is characterized by predominant red yellow podzolic soils with bog, half bog soils, and sandy regosols along the southwest coast. The intermediate zone displays a transition from reddish brown earths to red yellow podsolic soils, with non-calcic brown loam in patches (Panabokke 1996).
Agriculture sector can be divided into two main categories, plantation agricul-ture and non-plantation sector. About 1.8 million farm families are engaged in non-plantation sector which are characterized by small-scale rice-based farming under rainfed and artificial irrigation. However, plantations involve with largescale culti-vation of perennial crops such as tea, rubber, coconut, etc.
4 Remote Sensing Applications to Infer Yield of Tea in a Part of Sri Lanka

94
1.2 Ceylon Tea
The tea plants ( Camellia sinensis (L.) O. Kuntze) which belong to the genus ca-mellia probably originated in China. First record of tea dates back to 350 BC in a Chinese dictionary, however, according to Cha Pu, tea drinking started only in the 6th century. The habit of tea drinking later spread to Japan, Portugal, Holland and Europe. In 1834, the British started the cultivation of tea in their colonies. As a sub-stitute crop for the dreaded coffee in Sri Lanka, tea was introduced in 1867 by James Taylor. However, tea was first planted in Royal Botanical garden in Peradeniya way back in 1839. After the experimental plantings, first tea plantation Loolecandera Estate was established in Kandy district (Nathaniel 2008).
One of the oldest tea producing country, Sri Lanka produces predominantly black tea (about 95 %) and is well known as “Ceylon tea”. It is ranked among the best tea in the international market. In recent past, Ceylon tea was categorized as world’s cleanest tea considering its low pesticide residues, therefore the brand name of Cey-lon, guaranteed the quality. According to Ziyad and Zoysa (2008), tea production in the country grew at an average annual rate of about 10 % during last decade and at present the production is 315 million kg. Low-country (0–600 m amsl) tea production is significant and it contributes about 60 % to the total tea production of the country. The rest two regions, mid-country (600–1,200 m amsl) and upcountry ( > 1,200 m amsl) contribute about 16 and 24 %, respectively. However, 53 % of the estate lands are under old seedling tea and rest 47 % under VP tea. About 90 % of the seedling tea was older than 60 years. Hence, overall productivity of the country remains less compared to other tea producing countries (Anon 2003).
The yield of tea is from the tender young shoots comprising either two or three leaves with a terminal bud. Tea crop is determined by the shoot population density, size of the shoots and the rate of shoot extension. Hence, these factors are widely studied by many scientists to determine the yield (Wjeratne 1996; Odhiambo et al. 1993; Tanton 1992, 1981). However, the number of harvestable shoots per unit area and mean dry weight of single shoot is largely responsible for the tea yield.
Studies have been carried out by several scientists to demonstrate effects of differ-ent environmental components on yield. Balasuriya (1999) showed the effect of mean air temperature on shoot development, Wijeratne (1996) exposed the effect of satura-tion vapour pressure deficit, temperature and soil moisture deficit on shoot popula-tion. Apart from environmental factors, crop management practices and environment stresses (biotic and abiotic) affect the agronomic yield or total weight of harvested crop. Thus, yield is a multivariate function and hence, estimation of yield is a puzzling task. However, it is essential for the decision-making process at different levels.
1.3 Primary Production and Yield
Primary production is the process which converts light energy or solar radiation into chemical energy. Basically, green plants are called primary producers because they
S. Mukherjee et al.
95
are capable of producing primary energy through the process of photosynthesis. However, a fraction of the total production or Gross Primary Production (GPP) is utilized by the primary producer to meet their respiratory demand and balance is Net primary production (NPP), which accumulates as plant biomass (Odum 1960; Whittaker and Likens 1975). NPP is one of the most significant characteristics of ecosystems. However, estimation of NPP in an ecosystem is one of most confusing assignment because it depends on multiple variables such as light, temperature, soil moisture, plant nutrients, plant characteristics, etc. However, in agriculture not only NPP but mostly the agronomic yield, the fraction of NPP which assimilates in harvestable components such as seeds, tubers, leaves, is important.
Though it is simple in concept, in terrestrial ecosystems accurate estimation of NPP is difficult. Measurement based on gas exchange, sampling biomass or carbon flux methods have been devised to measure NPP (Milner and Hughe 1968). How-ever, remote sensing of vegetation indices, such as normalized difference vegetation index (NDVI), promises to provide a means for frequent, non-destructive measure-ment of NPP at a landscape scale (Tucker and Sellers 1986; Wang 2004).
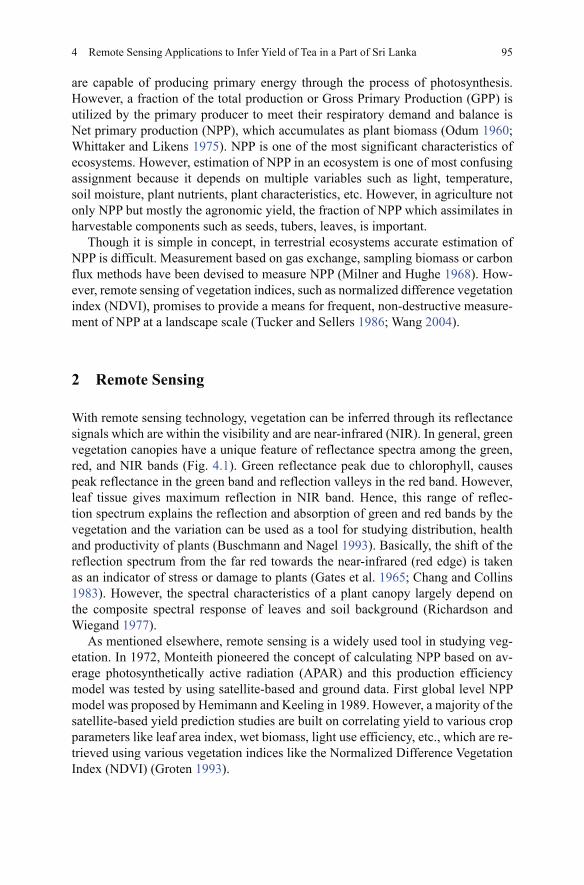
2 Remote Sensing
With remote sensing technology, vegetation can be inferred through its reflectance signals which are within the visibility and are near-infrared (NIR). In general, green vegetation canopies have a unique feature of reflectance spectra among the green, red, and NIR bands (Fig. 4.1). Green reflectance peak due to chlorophyll, causes peak reflectance in the green band and reflection valleys in the red band. However, leaf tissue gives maximum reflection in NIR band. Hence, this range of reflec-tion spectrum explains the reflection and absorption of green and red bands by the vegetation and the variation can be used as a tool for studying distribution, health and productivity of plants (Buschmann and Nagel 1993). Basically, the shift of the reflection spectrum from the far red towards the near-infrared (red edge) is taken as an indicator of stress or damage to plants (Gates et al. 1965; Chang and Collins 1983). However, the spectral characteristics of a plant canopy largely depend on the composite spectral response of leaves and soil background (Richardson and Wiegand 1977).
As mentioned elsewhere, remote sensing is a widely used tool in studying veg-etation. In 1972, Monteith pioneered the concept of calculating NPP based on av-erage photosynthetically active radiation (APAR) and this production efficiency model was tested by using satellite-based and ground data. First global level NPP model was proposed by Hemimann and Keeling in 1989. However, a majority of the satellite-based yield prediction studies are built on correlating yield to various crop parameters like leaf area index, wet biomass, light use efficiency, etc., which are re-trieved using various vegetation indices like the Normalized Difference Vegetation Index (NDVI) (Groten 1993).
4 Remote Sensing Applications to Infer Yield of Tea in a Part of Sri Lanka
96
2.1 Vegetation Indices (VI)
As already mentioned, remote sensing methods provide valuable tools for crop canopy assessment and these tools will provide improved information for agricul-ture applications. The main advantage of remote sensing is the ability of repeated measurements over the time without damaging the vegetation. Therefore, in remote sensing methods, various VIs are used to generate important information to enhance assessment of different agronomic parameters. However, the purpose of vegetation indices is to enhance the vegetation signal while minimizing the solar irradiance and soil background effects.
The ratio of the near-infrared (NIR)/Red was the first VI which was proposed by Jordan in 1969. He relates this index to Leaf Area Index (LAI) of plants. As mentioned earlier, NDVI is the most commonly used VI which is calculated as the difference between near infrared and red reflection normalized by the sum of the two
Basically, the wavelength region from 750 to 850 nm is considered as near-infrared (NIR) and 625–675 nm range is considered as red(R) (Sellers 1985; Tucker and Sellers 1986). However, major problem in vegetation studies is reflectance from soil; hence Soil-Adjusted Vegetative Index (SAVI) was described by AR Huete in 1988.
Adjusted parameter L is typically 0.5. However, this index was further advanced to derive an Enhanced Vegetative Index (EVI).
Enhanced vegetative index uses reflectance in blue region of the spectrum. Accord-ing to Hatfield et al. (2008), this is important to differentiate soil from vegetation at low amount of ground cover. Among the various VIs, assessment of the chlorophyll content of crop canopies has included the Normalized Pigment Chlorophyll Ratio Index described in Merzlyak et al. in 1999 and it was defined as (Red 660 – Blue 460)/(Red 660 + Blue 460). Apart from those indices, Plant Senescence Reflectance Index was proposed as being sensitive to the senescence phase of plant develop-ment. Renormalized Difference Vegetative Index (RDVI), Modified Triangular Vegetation Index (MTVI) and Optimized Soil-Adjusted Vegetation Index (OSAVI) are also use to study crop yield.
As mentioned earlier, yield is a multivariate function; factors like different soil types, agricultural inputs and adoption of improved technology affect it, since the spectral reflectance is a manifestation of all important factors affecting the crop. Therefore, stratification of crop area on the basis of crop vigour as reflected
[NDVI = (IR − R)/(IR + R)].
SAVI = (RNIR − Rred) (1 + L)/(RNIR + Rred + L)
EVI = 2.5(RNIR − Rred)/(RNIR + 6Rred − 7.5Rblue + 1)
S. Mukherjee et al.

97
by the spectral data are expected to result in greater efficiency in the crop yield estimation.
2.2 Application of GIS and Remote Sensing in Tea Plantations
Even though remote sensing has been widely used for forecasting the yield of dif-ferent types of crops, understanding of the spectral characteristics of tea plantations is very important for monitoring the growth of plants and estimating harvested leaf yield. Spectral characteristic of tea estates varies depending on age of tea canopy, type of tea ‘jat’, and health of tea plantation.
To facilitate convenient height for harvesting, stimulate vegetative growth, main-tain healthy frames andoptimize resource utilization. Tea bushes are required to be pruned at regular intervals. The time period between two consecutive prunings is known as pruning cycle. However, the length of the pruning cycle varies according to the location of the estate and type of tea. The pruning cycle of seedling tea can be two, three or four years corresponding to low-country, mid-country and upcountry. Pruning cycle of vegetatively propagated tea is three, four and five years for low-country, mid-country and upcountry, respectively. Generally, most tea plantations show relatively similar spectral characteristics such as higher absorption in red and large reflectance in NIR bands. However, spectral characteristic of tea also depends on its canopy structure, size of the leaves, greenness and maturity of leaves, hence tea plants with different pruning cycles give different spectral signatures (Rajapakse et al. 2002).
According to Rajapakse et al. (2002), the reflectance of clonal and seedling tea depends on tea canopy structure, size of the leaves, greenness and maturity of leaves. However, in general most of clonal and seedling tea types display relatively similar spectral trend. One important factor is canopy age which is calculated from its last pruning and according to Rajapakse (2002) younger plants absorb light be-tween 600 and 625 nm whereas older plants with matured leaves absorb more light at 650 nm. However, the variation depends on tea clones but both younger clonal and seedling tea have low reflectance in NIR (800–1,050 nm) than mature canopy. Therefore, tea plants show different reflectance spectra according to their canopy age and tea clone.
Computer technology has advanced over the last few decades and one of the most important applications of it is the database management, where computers are used to store information for quick access and analysis. GIS data have specific location in space; In other words, those spatial data have been referenced to a co-ordinate system. It is called geographically referenced. It is also possible to store non-spatial or attribute data in such databases. Therefore, GIS is able to store large amounts of different types of data for easy access. Furthermore, the spatial data can be combined with attribute data to generate new information in the decision-making process. Hence, tea plantations where the spatial distribution is massive, use
4 Remote Sensing Applications to Infer Yield of Tea in a Part of Sri Lanka

98
of GIS-based information system enhances the ability of rational decision making process. Turner (1994) explained the application and benefits of GIS in tea planta-tions as a management tool.
3 Study Area
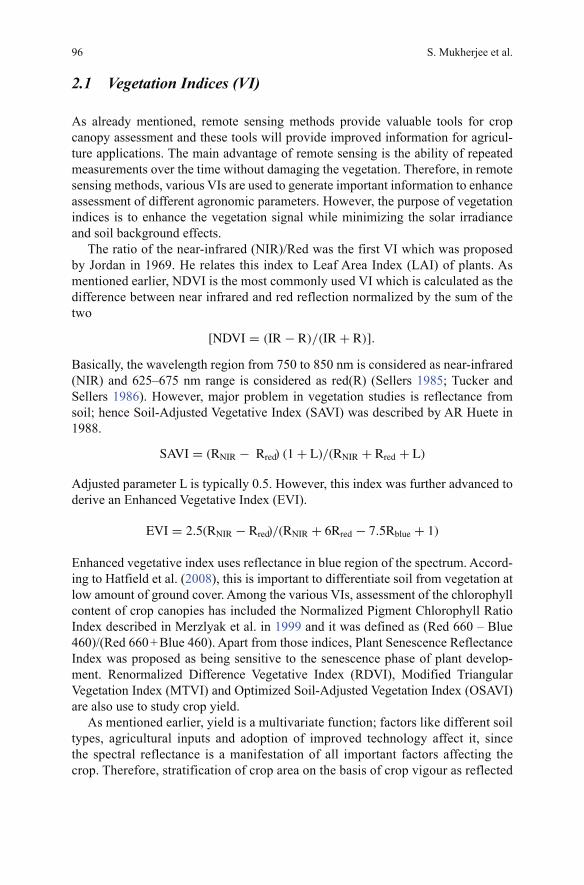
This study was conducted in Ratnapura district of Sri Lanka, which lies between 6040′51.02″ N 80023′42.27″ E and 6 43′ 23.83″ N,80022′10.61″ E latitude and longitude of the upper left and lower right corners respectively. The area primarily belongs to two major agro ecological zones, namely wet and intermediate zones. However, based on rainfall, elevation and soil factors, it is further divided into sev-en agro ecological sub-zones belonging to low-country and mid-country. On an average, it records 200 wet days and receives more than 3,000 mm of annual rainfall (Annual report 2009). Geologically, area is covered by Precambrian metamorphic rock named as highland complex which is dominated by charnokites and quartzite which supports the tea production (Fig. 4.1).
With respect to total tea area, Ratnapura district has the maximum area under tea cultivation, about 31,116 ha. However, about 75 % of the tea lands in the area belong to small holders (Panabokke et al. 2008). Further, Ratnapura records higher annual tea productivity, 2,159 kg/ha of tea, after Kalutara and Gall districts (Anon, 2003). Basically, tea plantations in the area are of two types, commonly named as seedling and vegetatively propagated tea or clonal tea. Both tea types are harvested throughout the year, however irrespective of the regions, vegetatively propagated tea gives significantly higher yield than seedling tea in the country. Hence, in the recent past many of the seedling tea gardens were diversified to clonal tea and as a result seedling tea cultivation is now confined to only a few estates in the region.
Tea plantations in Ratnapura area are further classified into mono-cropping, and mixed cropping with rubber, coconut and other perennial crops. However, use of coconut and minor export crops dominates over other intercropping types. Even though tea is stated to be a mono-crop, planting of low and high shade trees is a common practice (Fig. 4.2).
Panabokke et al. (2008) classified the tea-growing area into four main produc-tivity zones, based on corporate estate sector tea yield. However, small-scale tea productivity studies, which are essential for the appropriate land use planning are limited. Basically, such information is important when making a decision on new planting, replanting, infilling and crop diversification. Furthermore, it plays a sig-nificant role in optimizing resource use efficiency and sustainable tea production. Therefore, formulation and accessibility to productivity information in both macro and micro levels is significant in various levels of decision making. As mentioned elsewhere, remote sensing and GIS are handy in this scenario and this study basi-cally focuses on generating information in micro scale.
The data used in this study were derived from a range of sources, including satel-lite images, and field collected data and secondary data such as rainfall data, yield
S. Mukherjee et al.
994 Remote Sensing Applications to Infer Yield of Tea in a Part of Sri Lanka
Fig. 4.1 L
ocat
ion
of T
ea p
rodu
ctiv
ity a
rea
the
stud
y ar
ea
100
data and cartographic maps. The satellite data set used in this study consists of six images of Landsat TM with the spatial resolution of 30 m. Field data and geo-ref-erenced tea plantation maps which were prepared by Panabokke et al. (2008), were used to identify the existing tea fields in satellite images. Spectral signatures of tea plantations were studied in detail to identify their spatial and temporal variation.
3.1 Sampling and Analysis
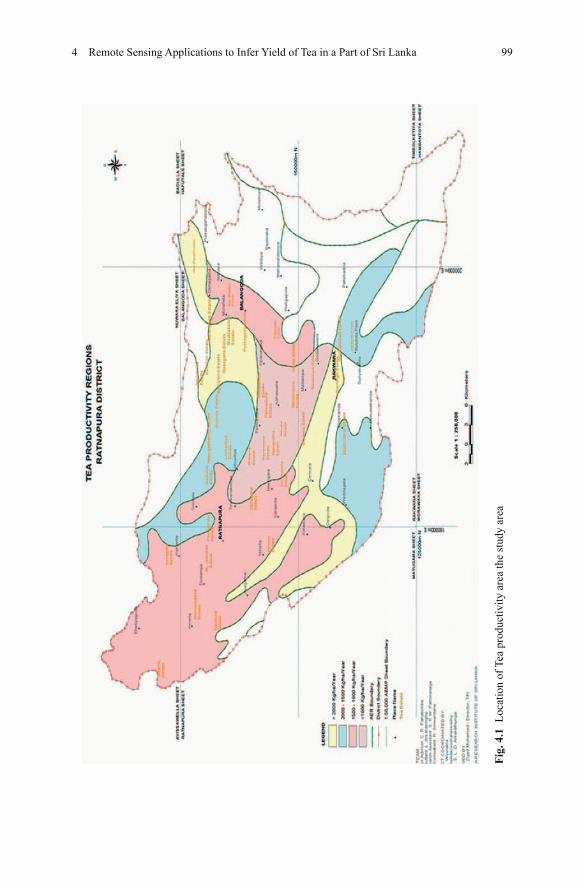
Approximately 50 km2 area was selected as area of interest (AOI) which includes two tea estates, namely St. Joachim and Palm garden. The area was demarcated by including those two estates with small holder’s tea gardens. Yield data were obtained from the two estates for a period of past 10 years for the analysis. Soil and groundwater samples were collected from non-agricultural lands within the same area. Soil samples, up to 45 cm depth were taken by excluding top soil and groundwater samples were taken from dug wells. Polypropylene bottles were used to keep acidified (few drops of 2 % HNO3 was added to water samples while sam-pling process and those samples were used to metal analysis) and non-acidified water samples, other than soil and groundwater samples, water samples were col-lected separately from the River “Kaluganga”. Properly labelled samples were then brought into the laboratory for further analysis (Fig. 4.3).
3.2 Image Analysis
The imageries for different years were downloaded from www.glovis.usgs.org, WIST (Warehouse Inventory Search Tool) and GLCF (Global Land Cover Facility).
S. Mukherjee et al.
Fig. 4.2 Location of sam-pling points in the study area
101
The google earth image provided a good ready reference for the work. Various analyses like NDVI analysis, supervised classification analysis was done on the image using following softwares:
• ArcView GIS 3.2a• ArcGIS 9.3• ERDAS IMAGINE 8.5
Statistical analysis of the data for grain size was done using SIGMAPLOT software as an extension of MS EXCEL. Besides all this softwares, handheld Garmin GPS was used to locate the sampling location by acquiring latitudes and longitudes of that place.
4 Result and Discussion
Red yellow podzolic (Rhodudults/ Tropudults) is the major soil group found in Rat-napura area which is characterized by the loam to sandy loam texture at surface and sandy loam clay in subsoil. Furthermore, soil shows higher level of gravel and lat-erite formation. Generally, all collected soil samples show more than 97 % of sand fraction and none of the sample yielded more than 1.5 % clay or silt. Therefore, soil of study area is classified as sandy soil (Fig. 4.4).
Soil organic matter content in the study area is ranging from 0.5 to 3.7 %. How-ever most part of the study area shows less than 2 % of organic matter. Bringing a virgin soil into agricultural use tends to destroy much of soil organic matter (Tol-hurst 1961), hence actual organic matter content in tea fields is expected to be low.
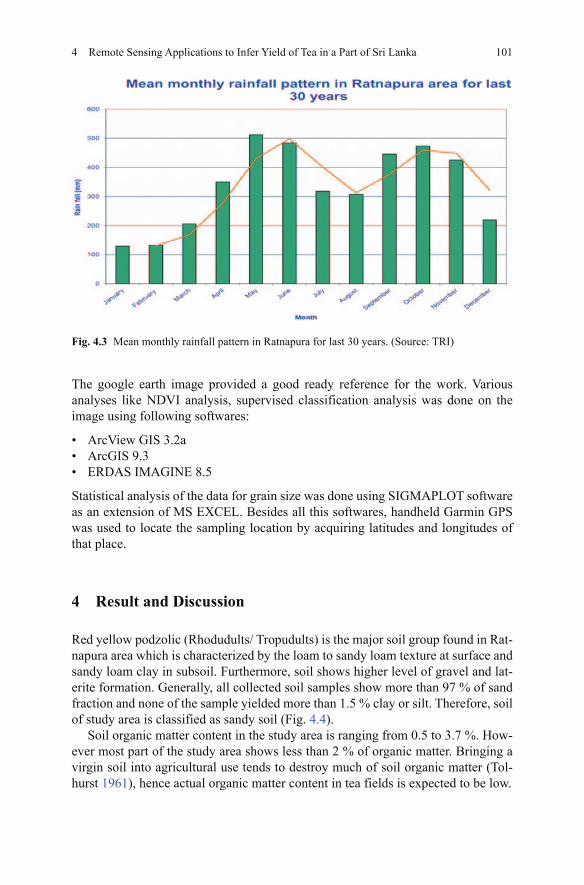
Fig. 4.3 Mean monthly rainfall pattern in Ratnapura for last 30 years. (Source: TRI)
4 Remote Sensing Applications to Infer Yield of Tea in a Part of Sri Lanka

102
The bedrock is characterized by metamorphic rock belonging to highland series which is dominated by charnokites, quartzites, marbles, garnetiferous gneisses and granulites mixed with igneous intrusions (Cooray 1994; Chandrajith 1999). Soil of the study area is dominated by Quartz (SiO2), Hematite (Fe2O3), Calcite (CaCO3), with trace amounts of uranium oxide (UO2), Bornite (Cu5FeS4), Praseodymium ox-ide (PrOIB3) and Green Cinnabar (Cr2O3) minerals (Fig. 4.5).
Fig. 4.4 Ternary plot of soil texture and interpolation of soil organic carbon
Fig. 4.5 Analysis of soil minerals composition by XRD
S. Mukherjee et al.

103
Basically, Ratnapura belongs to low-country wet zone which receives more than 3,000 mm annual rainfall. It causes extensive leaching of basic cations from the top soil to make it acidic. However, groundwater and soil are slightly acidic in the area where the pH is ranging from 5.7 to 6.8 and 5.1 to 6.5, respectively (Fig. 4.6).
Tea is better grown in slightly acidic soils where growth is optimum at 4.5–5.5 pH range. Considering the fact (optimum pH), major part of the study area which shows soil pH less than 5.7 is therefore suitable for tea plantations. Interpolation of water and soil electric conductivity is given in Fig. 4.6.
Calcium and magnesium are macronutrients which are required in large quanti-ties for better plant growth and productivity, hence, tea yield shows positive cor-relation to dolomite and kieserite application (Krishnapillai 1991). Sivapalan and Krishnapillai (1988) reported that tea growing soils contain lower Mg concentra-tions. Furthermore, this is claimed as a possible limiting factor for better yield. Therefore, general recommendation was to add Mg-enriched fertilizer mixtures, particularly when soil pH is 4.2 or low. Mg in the study area is found in the inter-polation plate 14. According to this, Mg concentration is less than 4.1 ppm in major part of the study area. Compared to upcountry tea, Mg concentration is higher in low-country tea (Hasselo 1965). Soil Ca concentration in the study area ranges from 8.4 to 28.8 ppm. Typically, Ca concentration in fresh water falls below 10 ppm (Ra-mesh 1996). The groundwater Ca concentration in the study area is at its lower side, where major part of the area shows less than 4 ppm. However, it was in the range from 0.3 to 11.9 ppm. So, it can be inferred that carbonate rocks like limestone, dolomite, etc., are present in SE part of the study area, precisely in the Palm Garden Estate. Also, anomalies of soil Mg and Ca concentration account for high fertilizer input in those regions.
Soil pH and texture play a significant role in Zinc (Zn) availability. Alkaline and coarse textural soils with low organic matter content are marginal in Zn. The Zn deficiency is basically observed all over the country and the affected plants exhibit
4 Remote Sensing Applications to Infer Yield of Tea in a Part of Sri Lanka
Fig. 4.6 Interpolation of groundwater and soil pH
104
chlorosis, small sickle-shape leaves, clustered at the tips of shoots, etc. However, Tolhurst (1961) reported that deficiency is prominent in low-country. Tolhurst’s ob-servation can be justified with Hasselo’s (1965) one, according to which Zn concen-tration in upcountry flush is almost double compared to low-grown tea.
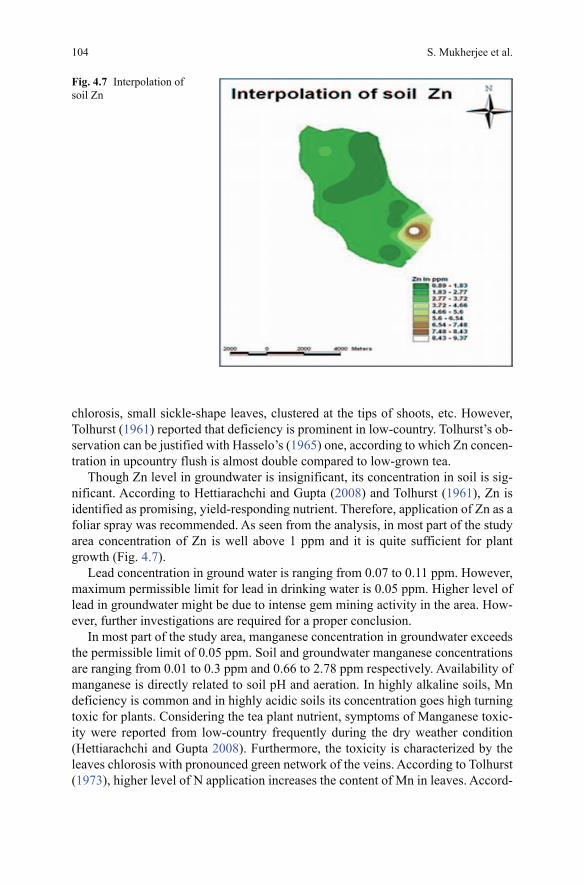
Though Zn level in groundwater is insignificant, its concentration in soil is sig-nificant. According to Hettiarachchi and Gupta (2008) and Tolhurst (1961), Zn is identified as promising, yield-responding nutrient. Therefore, application of Zn as a foliar spray was recommended. As seen from the analysis, in most part of the study area concentration of Zn is well above 1 ppm and it is quite sufficient for plant growth (Fig. 4.7).
Lead concentration in ground water is ranging from 0.07 to 0.11 ppm. However, maximum permissible limit for lead in drinking water is 0.05 ppm. Higher level of lead in groundwater might be due to intense gem mining activity in the area. How-ever, further investigations are required for a proper conclusion.
In most part of the study area, manganese concentration in groundwater exceeds the permissible limit of 0.05 ppm. Soil and groundwater manganese concentrations are ranging from 0.01 to 0.3 ppm and 0.66 to 2.78 ppm respectively. Availability of manganese is directly related to soil pH and aeration. In highly alkaline soils, Mn deficiency is common and in highly acidic soils its concentration goes high turning toxic for plants. Considering the tea plant nutrient, symptoms of Manganese toxic-ity were reported from low-country frequently during the dry weather condition (Hettiarachchi and Gupta 2008). Furthermore, the toxicity is characterized by the leaves chlorosis with pronounced green network of the veins. According to Tolhurst (1973), higher level of N application increases the content of Mn in leaves. Accord-
Fig. 4.7 Interpolation of soil Zn
S. Mukherjee et al.
105
ing to Hasselo (1965), low-country tea plants contain, on an average, higher amount of Mn as compared to tea plants in upcountry. Therefore, Mn in soil and groundwa-ter is a significant factor which can influence tea productivity.
Nitrogen and phosphorus are the major nutrients absorbed by plants. A signifi-cant part of the study area shows soil nitrate concentration above 18 ppm. Nitrate content in groundwater is ranging from 0.7 to 40 ppm in the area. Hence, water is safe for all domestic uses. Concentration of soil nitrate is ranging from 6.03 to 54.24 ppm, however, mostly it is over 18 ppm, and hence it is a favourable factor for plant growth.
Most part of the study area shows less than 119 ppb of soil phosphate. Similarly, it is less abundant in water where it ranges between 0.02 and 873 ppb. However, according to Hasselo (1965) both nitrate and phosphate concentration in low-grown tea is higher than upcountry. Therefore, there is no inherent limitation of those two elements in the area. However, proper nutrient management is required to ensure sustainable yield. Concentration of dissolved silica in groundwater was reported as an indicator to understand the weathering characteristic of basement rock. There-fore, it has been used in various geochemical studies to evaluate the factors af-fecting chemical weathering rates in a natural environment. However, groundwater mostly shows less than 6.5 ppm dissolved silica. Hence, it indicates the weathering resistance of metamorphic basement rocks. Bicarbonate is a significant anion in groundwater chemistry predominantly present at slightly acidic pH. Bicarbonate ion distribution in the study area is highly correlated with water pH and higher bicarbonate concentration was recorded in areas where groundwater pH is greater than 6.5.
No result was observed for Cu, Ni, Fe and Zn in groundwater at the concentra-tion range of mg/L or ppm. However, soil analysis shows satisfactory result at same concentration ranges. All elements show positive trend toward southward direction where Ratnapura town is located. However, Cu is showing inverse trend of which low concentration was observed in Southern part of the study area. Therefore, high-er concentration of elements might be due to anthropogenic influences like mining, which is prominent in SW part near to Kaluganga River.
4.1 Supervised Land Use Classification
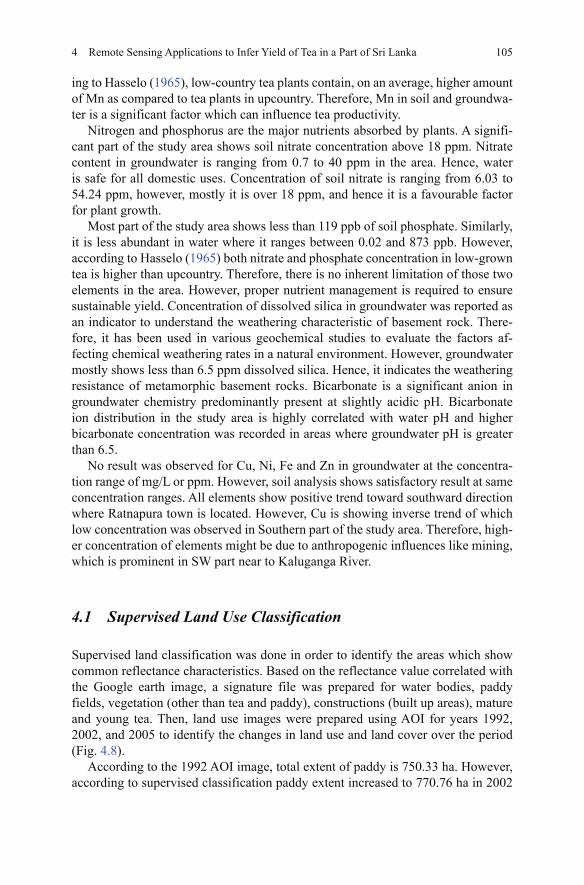
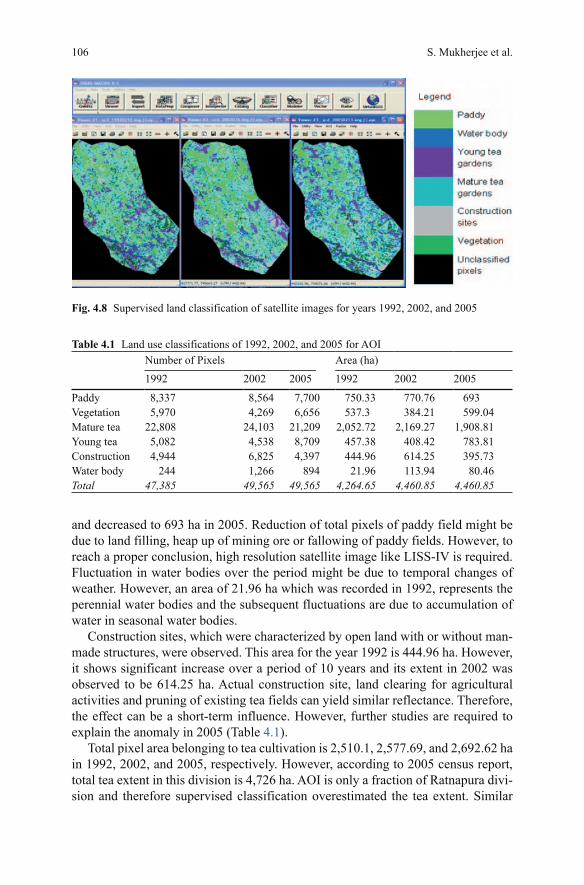
Supervised land classification was done in order to identify the areas which show common reflectance characteristics. Based on the reflectance value correlated with the Google earth image, a signature file was prepared for water bodies, paddy fields, vegetation (other than tea and paddy), constructions (built up areas), mature and young tea. Then, land use images were prepared using AOI for years 1992, 2002, and 2005 to identify the changes in land use and land cover over the period (Fig. 4.8).
According to the 1992 AOI image, total extent of paddy is 750.33 ha. However, according to supervised classification paddy extent increased to 770.76 ha in 2002
4 Remote Sensing Applications to Infer Yield of Tea in a Part of Sri Lanka
106
and decreased to 693 ha in 2005. Reduction of total pixels of paddy field might be due to land filling, heap up of mining ore or fallowing of paddy fields. However, to reach a proper conclusion, high resolution satellite image like LISS-IV is required. Fluctuation in water bodies over the period might be due to temporal changes of weather. However, an area of 21.96 ha which was recorded in 1992, represents the perennial water bodies and the subsequent fluctuations are due to accumulation of water in seasonal water bodies.
Construction sites, which were characterized by open land with or without man-made structures, were observed. This area for the year 1992 is 444.96 ha. However, it shows significant increase over a period of 10 years and its extent in 2002 was observed to be 614.25 ha. Actual construction site, land clearing for agricultural activities and pruning of existing tea fields can yield similar reflectance. Therefore, the effect can be a short-term influence. However, further studies are required to explain the anomaly in 2005 (Table 4.1).
Total pixel area belonging to tea cultivation is 2,510.1, 2,577.69, and 2,692.62 ha in 1992, 2002, and 2005, respectively. However, according to 2005 census report, total tea extent in this division is 4,726 ha. AOI is only a fraction of Ratnapura divi-sion and therefore supervised classification overestimated the tea extent. Similar
Fig. 4.8 Supervised land classification of satellite images for years 1992, 2002, and 2005
Table 4.1 Land use classifications of 1992, 2002, and 2005 for AOINumber of Pixels Area (ha)
1992 2002 2005 1992 2002 2005
Paddy 8,337 8,564 7,700 750.33 770.76 693Vegetation 5,970 4,269 6,656 537.3 384.21 599.04Mature tea 22,808 24,103 21,209 2,052.72 2,169.27 1,908.81Young tea 5,082 4,538 8,709 457.38 408.42 783.81Construction 4,944 6,825 4,397 444.96 614.25 395.73Water body 244 1,266 894 21.96 113.94 80.46Total 47,385 49,565 49,565 4,264.65 4,460.85 4,460.85
S. Mukherjee et al.
107
type of pixel misclassification was observed by Samarasinghe (2003). Therefore, pixel values of rubber, coconut or home gardens also need to be studied intensively in order to classify actual tea estates in synoptic scale.
4.2 NDVI analysis
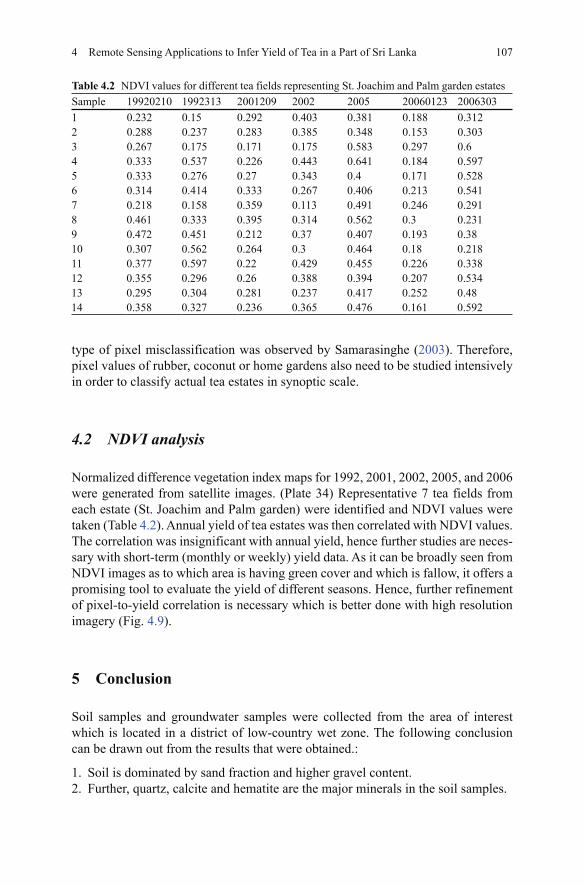
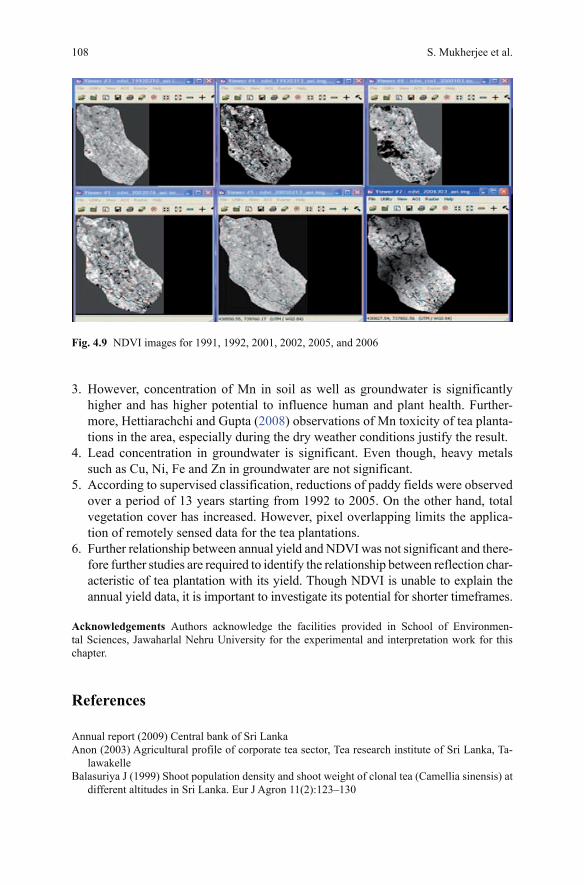
Normalized difference vegetation index maps for 1992, 2001, 2002, 2005, and 2006 were generated from satellite images. (Plate 34) Representative 7 tea fields from each estate (St. Joachim and Palm garden) were identified and NDVI values were taken (Table 4.2). Annual yield of tea estates was then correlated with NDVI values. The correlation was insignificant with annual yield, hence further studies are neces-sary with short-term (monthly or weekly) yield data. As it can be broadly seen from NDVI images as to which area is having green cover and which is fallow, it offers a promising tool to evaluate the yield of different seasons. Hence, further refinement of pixel-to-yield correlation is necessary which is better done with high resolution imagery (Fig. 4.9).
5 Conclusion
Soil samples and groundwater samples were collected from the area of interest which is located in a district of low-country wet zone. The following conclusion can be drawn out from the results that were obtained.:
1. Soil is dominated by sand fraction and higher gravel content.2. Further, quartz, calcite and hematite are the major minerals in the soil samples.
4 Remote Sensing Applications to Infer Yield of Tea in a Part of Sri Lanka
Table 4.2 NDVI values for different tea fields representing St. Joachim and Palm garden estatesSample 19920210 1992313 2001209 2002 2005 20060123 20063031 0.232 0.15 0.292 0.403 0.381 0.188 0.3122 0.288 0.237 0.283 0.385 0.348 0.153 0.3033 0.267 0.175 0.171 0.175 0.583 0.297 0.64 0.333 0.537 0.226 0.443 0.641 0.184 0.5975 0.333 0.276 0.27 0.343 0.4 0.171 0.5286 0.314 0.414 0.333 0.267 0.406 0.213 0.5417 0.218 0.158 0.359 0.113 0.491 0.246 0.2918 0.461 0.333 0.395 0.314 0.562 0.3 0.2319 0.472 0.451 0.212 0.37 0.407 0.193 0.3810 0.307 0.562 0.264 0.3 0.464 0.18 0.21811 0.377 0.597 0.22 0.429 0.455 0.226 0.33812 0.355 0.296 0.26 0.388 0.394 0.207 0.53413 0.295 0.304 0.281 0.237 0.417 0.252 0.4814 0.358 0.327 0.236 0.365 0.476 0.161 0.592
108
3. However, concentration of Mn in soil as well as groundwater is significantly higher and has higher potential to influence human and plant health. Further-more, Hettiarachchi and Gupta (2008) observations of Mn toxicity of tea planta-tions in the area, especially during the dry weather conditions justify the result.
4. Lead concentration in groundwater is significant. Even though, heavy metals such as Cu, Ni, Fe and Zn in groundwater are not significant.
5. According to supervised classification, reductions of paddy fields were observed over a period of 13 years starting from 1992 to 2005. On the other hand, total vegetation cover has increased. However, pixel overlapping limits the applica-tion of remotely sensed data for the tea plantations.
6. Further relationship between annual yield and NDVI was not significant and there-fore further studies are required to identify the relationship between reflection char-acteristic of tea plantation with its yield. Though NDVI is unable to explain the annual yield data, it is important to investigate its potential for shorter timeframes.
Acknowledgements Authors acknowledge the facilities provided in School of Environmen-tal Sciences, Jawaharlal Nehru University for the experimental and interpretation work for this chapter.
References
Annual report (2009) Central bank of Sri LankaAnon (2003) Agricultural profile of corporate tea sector, Tea research institute of Sri Lanka, Ta-
lawakelleBalasuriya J (1999) Shoot population density and shoot weight of clonal tea (Camellia sinensis) at
different altitudes in Sri Lanka. Eur J Agron 11(2):123–130
Fig. 4.9 NDVI images for 1991, 1992, 2001, 2002, 2005, and 2006
S. Mukherjee et al.
109
Bozzini C, Maselli F (2002) Analysis of multitemporal NDVI data for crop yield forecasting in the Sahel. Geocarto Int 17(1):53–60
Buschmann C, Nagel E (1993) In vivo spectroscopy and internal optics of leaves as basis for remote sensing of vegetation. Int J Remote Sens 14:711–722
Carr MVK (1972) The climatic requirements of the tea plant: A review Exp Agric 8:1–14Chandrajith R, Dissanayake CB, Tobschall HJ (1999) Vertical variation of selected trace ele-
ments in gem deposits from Ratnapura and Buttala gem fields in Sri Lanka. Chemie der Erde 59:135–150
Chadrajith R, Dissanayaka CB, Tobschall HJ (2001) Enrichment of high field strength elements in stream sediments of a granulite terrain in Sri Lanka- evidence for a mineralized belt. Chem Geol 175:259–271
Chang SH, Collins W (1983) Confirmation of the airborne biophysical mineral exploration tech-nique using laboratory methods. Econ Geogr 78:723–736
Cooray PG (1994) The precambrian of Sri Lanka: A historical review, Precambrian res 66:3–18Diatloff E, Rengel Z (2001) Compilation of simple spectrophotometric techniques for the determi-
nation of elements in nutrient solutions. J Plant Nutr 24(1):75–86Duchemin B, Goubier J, Courrier G (1999) Monitoring phenological key stages and cycle duration
of temperate deciduous forest ecosystems with NOAA/AVHRR data. Remote sens Environ 67:68–82
Field CB, Randerson JT, MalmstrÖm (1995) Global net primary production combining ecology and remote sensing. Remote Sens Environ 5:74–88
Ganashan P, Balendira S, Dassanayake MD (1996) Sri Lanka: Country report to the FAO interna-tional technical conference on plant genetic resource
Gates DM, Keegan HJ, Schleter JC, Weidner VR (1965) Spectral qualities of plants. Appl Opt 4:11–20
Groten SME (1993) NDVI—crop monitoring and early yield assessment of Burkina Faso. Int J Remote Sens 14(8):1495–1515
Hasselo HN (1965) the nitrogen, potassium, phosphorus, calcium, magnesium, sodium, manga-nese, iron, copper, boron, zinc, molybdenum and aluminium contents of tea leaves of increas-ing age. Tea Quartile 36:122–136
Hatfield JL, Prueger JH (2010) Value of using different vegetative indices to quantify agricultural crop characteristics at different growth stages under varying management practices. Remote Sens 2:562–578
Hatfield JL, Gitelson AA, Schepers JS, Walthall C (2008) Application of spectral remote sensing for agronomic decisions. Agron J 100:117–131
Hettiarachchi GM, Gupta UC (2008) Boron, molybdenum, and selenium. In: Carter MR, Gre-gorich EG (eds) Soil sampling and methods of analysis, 2nd edn. Canadian Society of Soil Science, Oxford
Jackson ML (1967) Soil chemical analysis. Prentice-Hall of India Pvt. Ltd., New Delhi, p 498Kehelpannala KVW (1997) Deformation of a high-grade Gondwana fragment, Sri Lanka. Gond-
wana Res 1:47–68Krishnapillai S (1991) Response to magnesium fertilizer in young and mature tea. Agro Chem
News Brief 14(4):30–35 Lawrence RL, Ripple WJ (1998) Comparison among vegetation indices and band wise regression
in a highly disturbed, heterogeneous landscape: Mount St. Helens, Washington. Remote Sens Environ 64:91–102
Lüdeke M, Janecek A, Kohlmaier GH (1991) Modelling the seasonal CO2 uptake by land vegeta-tion using the global vegetation index: TeUus 43B:188–196
Masters GM, Ela WP (2008) Environmental engineering and science, ISBN 978–81-203-3691-9. Pearson education inc, upper saddle river 3rd edn. New Jersey, USA 07458
Merzlyak MN, Gitelson AA, Chivkunova OB, Rakitin VY (1999) Non-destructive optical detec-tion of leaf senescence and fruit ripening. Physiol Plant 106;135–141
Milner C, Hughes RE (1968) Methods for the measurement of the primary production of grass-land. IBP Handbook No. 6. Blackwell, Oxford
4 Remote Sensing Applications to Infer Yield of Tea in a Part of Sri Lanka
110
Mukherjee S (1993) Application of remote sensing technique in evaluation of groundwater pollu-tion. In: Rashid SM (ed) Remote sens Geogr ISBN: 81-85544554-0
Mukherjee S (1998) Change in groundwater environment with land-use pattern in a part of south Delhi: A remote sensing approach. J Asia-Pacific Remote Sens and GIS J 9(2):9–14
Mukherjee S (2004) Text book of environmental remote sensing, ISBN: 1403922357, Macmillan India Limited, New Delhi
Mukherjee S (2007) New trends in groundwater research, ISBN: 1-90608303-7 Cooperjal publica-tions, London, UK
Nathaniel RK (2008) Introduction. In: Zoysa AKN (ed) Handbook on tea ISBN-955-9023-06-3. Tea Research Institute of Sri Lanka, pp 1–3
Odhiambo HO, Nyabundi JO, Chweya J (1993) Effects of soil moisture and vapour pressure deficits on shoot growth and the yield of tea in the kenya highlands. Exp Agricu 29:341–350 doi:10.1017/S0014479700020901
Odum EP (1960) Organic production and turnover in old field succession. Ecology 41:34–48Osanai Y, Sajeev K, Owada M, Kehelpannala KVW, Prame WKB, Nakano N, Jayatileke S (2006)
Metamorphic evolution of high-pressure and ultrahigh-temperature granulites from the high-land complex, Sri Lanka. J Asian Earth Sci 28:20–37
Panabokke CR (1996) Soils and agro-ecological environments of Sri Lanka. Natural Resources, Energy and Science Authority of Sri Lanka, Colombo
Panabokke CR, Kannangara R (1975) The identification and demarcation of the agro-ecological regions of Sri Lanka. Proc Sec B Ann Sessions Assoc Advmt Sci 31(3):49
Panabokke CR, Amarasinghe L, Pathiranage SR, Wijeratne MA, Amarathunga SLD, Ananda-coomaraswamy A (2008) Land suitability classification and mapping of tea lands in district, Sri Lanka. J Tea Sci 73(1):1–10
Rajapakse RMSS, Tripathi NK, Honda K (2002) Spectral characterization and LAI modelling for the tea (Chamellia sinensis (L) O Kuntze) canopy. Int J Remote Sens 23(18):3569–3577
Ramesh R, Anbu M (1996) Chemical methods for environment analysis ISBN 033392-281-6. VN Rao at Macmillan India press, Madras
Richardson AJ, Wiegand CL (1977) Distinguishing vegetation from soil background information. Photogr Eng Remote Sens 43:1541–1552
Samarasinghe GB (2003) Growth and yield of Sri Lanka’s major crops interpreted from public domain satellites. Agric Water Manage 58:145–157
Sellers PJ (1985) Canopy reflectance, photosynthesis and transpiration. Int J Remote Sens 6:1335–1372
Singh R, Semwal DP, Rai A, Chhikara RS (2002) Small area estimation of crop yield using remote sensing satellite data. Int J Remote Sens 23(1):49–56
Sivapalan P, Krishnapillai S (1988) Supply of magnesium for mature tea in Sri Lanka, Sri Lanka. J tea sci 57:34–39
Squire GR, Callander BA (1981) Tea plantations. In: Kozlowski TT (ed) Water deficits and plant growth VI. Academic Press, New York, pp 471–510
Tanton TW (1981) Growth and yield of tea bush. Exp Agri 17:323–331Tanton TW (1992) Tea crop physiology. In: Willson KC, Clifford MN (eds) Tea: Cultivation to
consumption, Chapman and Hall, London, pp 173–179Tolhurst JAH (1961) Report of the agricultural chemistry, TRI annual report, pp 50–57Trivedy PK, Goel PK (1984) Chemical and biological methods for water pollution studies, Laxmi-
Narayan press, KaradTucker CJ, Sellers PJ (1986) Satellite remote sensing of primary production. Int J Remote Sens
7:1395–1416Turner STD, Jayakody JAAM (1994) Application of geographical information system to the tea
industry, Sri Lanka. J tea sci 63(1):10–18Tolhurst JAH (1973) Zinc deficiencies in tea. Tea Research Institute of East Africa Pamphlet no
21/73 Wang J, Rich PM, Price KP, Kettle WD (2004) Relations between NDVI and tree productivity in
the central Great Plains. Int J Remote Sens 25(16):3127–3138
S. Mukherjee et al.

111
Watson M (1986) Soil and climatic requirements. In: Sivapalan P, Kulasegaram S, Kathiravetpillai A (eds) Handbook on Tea. Tea Research Institute, Sri Lanka, pp 3–5
Whittaker RH, Likens GE (1975) Primary production: The biosphere and man. In: Lieth H, Whit-taker RH (eds) Primary productivity of the biosphere (.), Springer- Verlag, Berlin, pp 305–328
Wijeratne MA (1996) Vulnerability of Sri Lanka tea production to global climate change. In: Erda L, Bolhofer W, S Huq, Lenhart S, Mukherjee SK, Smith JB, Wisniewski J (eds) Climate change variability and adaptation in Asia and the Pacific. Kluwer Academic Publishers, Dordrecht, pp 249
Wijeratne MA, Fordham R (1996) Effect of environment factors on growth and yield of tea (Ca-mellia sinensis L.) in the low-country wet zone of Sri Lanka, Sri Lanka. J Tea Sci 64(1/2):21–34
Ziyad MMT, Zoysa AKN (2008) An overview of tea industry in Sri Lanka. In: Zoysa AKN (ed) Handbook on tea ISBN-955-9023-06-3. Tea Research Institute of Sri Lanka, pp 1–3
4 Remote Sensing Applications to Infer Yield of Tea in a Part of Sri Lanka