Embed Size (px)
Citation preview
POUR L'OBTENTION DU GRADE DE DOCTEUR ÈS SCIENCES
acceptée sur proposition du jury:
Dr A.-S. Chauvin, présidente du juryProf. T. Rizzo, directeur de thèse
Prof. P. Barran, rapporteuseProf. Ph. Dugourd, rapporteurProf. M. Chergui, rapporteur
Cryogenic Ion Spectroscopy of Peptides and Glycans
THÈSE NO 8086 (2017)
ÉCOLE POLYTECHNIQUE FÉDÉRALE DE LAUSANNE
PRÉSENTÉE LE 12 JANVIER 2018 À LA FACULTÉ DES SCIENCES DE BASE
LABORATOIRE DE CHIMIE PHYSIQUE MOLÉCULAIREPROGRAMME DOCTORAL EN CHIMIE ET GÉNIE CHIMIQUE
Suisse2017
PAR
Chiara MASELLIS

To my wonderful family, my sister, my beloved Jörn,
and Prof. Maria Costanza Gallino.
To all the PhD students who will read through this thesis,
hoping it will make their lives a little easier.

Abstract
Understanding the structure of biomolecules, which are directly related to physiological processes that take place in the human body, has always generated a large interest in the scientific community. In this thesis we focus our attention on two of these classes of biomolecules: peptides and glycans.
In the first part of this work we investigate how the structure of helical peptides in the gas-phase is modified when one increases the number of amino acids in the sequence. Moreover, we analyze the role played by a mobile charge in the formation of the helical motif in the gas-phase. To achieve these goals, we make use of a home-built tandem mass spectrometer, and a pump-probe laser spectroscopic scheme. The combination of infrared and ultraviolet light together with cryogenic temperatures allows one to collect high-resolution conformer-specific spectra of gas-phase peptides. By comparing the experimental results obtained with density functional theory calculations, we show that the synergy between theory and experiment is key to provide accurate structural characterization of the investigated peptides. The mobile charge, in fact, induces unconventional backbone conformations, which cannot be predicted a priori by performing experiments alone.
In the second part of this thesis we present a novel technique to identify and characterize glycans in the gas-phase that exploits a database approach. Due to their structural heterogeneity, glycans pose a problem for the currently available mass- and mobility-spectrometry techniques. In the work herein we show that we can easily identify glycan structural isomers, by adding a spectroscopic dimension to mass and mobility measurements. Cryogenic vibrational messenger spectroscopy, in fact, allows us to unambiguously identify disaccharides and pentasaccharides isomers due to the high-resolution provided by this method. Moreover, we can perform our experiments in a broad range of temperatures, going from liquid helium to liquid nitrogen. This shows the potential of our technique in becoming a more accessible analytical tool for glycan identification.
Keywords: cryogenic ion spectroscopy, conformer-selective IR-UV spectroscopy, ion mobility spectrometry, helical peptides, peptide structural characterization, glycan structural isomers, glycan identification.

Riassunto
Determinare la struttura delle molecole alla base dei processi fisiologici che avvengono nel corpo umano ha da sempre suscitato grande interesse nella comunità scientifica. Questa tesi si focalizza principalmente su due classi di molecole biologiche: i peptidi e i glicani.
Nella prima parte di questo lavoro, vengono investigate le modifiche strutturali che si presentano quando si incrementa il numero di amminoacidi nella sequenza di peptidi con struttura ad elica in fase gassosa. Inoltre, si analizza il ruolo di una carica mobile nella formazione degli stessi. Per ottenere questi dati, è stato utilizzato uno spettrometro di massa costruito ad-hoc ed uno schema spettroscopico a eccitazione e verifica. La combinazione di luce infrarossa e ultravioletta abbinata a temperature criogeniche permette di misurare spettri ad alta risoluzione, e ciascun spettro è caratteristico per la particolare conformazione del peptide investigata in fase gassosa. Comparando i dati sperimentali con gli spettri calcolati usando la teoria del funzionale di densità, mostriamo che la sinergia tra teoria ed esperimento è fondamentale per caratterizzare accuratamente la struttura dei peptidi di interesse. La carica mobile infatti induce una modifica nella conformazione della catena principale che non è predicibile a priori, basandosi soltanto sui risultati sperimentali.
Nella seconda parte di questa tesi viene presentata una nuova tecnica per identificare e caratterizzare glicani in fase gassosa che si basa su approccio di tipo database. A causa delle molteplici strutture che i glicani possono assumere, questa classe di molecole rappresenta un problema per le tecniche di spettrometria di massa e mobilità ionica attualmente disponibili. In questo lavoro mostriamo che l’aggiunta della dimensione spettroscopica alle misure di massa e mobilità ionica permette l’identificazione di isomeri strutturali. La spettroscopia vibrazionale condotta a temperature criogeniche, infatti, permette di identificare in maniera univoca isomeri di disaccaridi e pentasaccaridi grazie all’alta risoluzione di questo metodo. Inoltre, i nostri esperimenti possono essere condotti in un ampio intervallo di temperature da quella dell’elio liquido a quella dell’azoto liquido: ciò dimostra il potenziale di questa tecnica nel diventare uno strumento analitico per la caratterizzazione dei glicani accessibile anche al di fuori dei laboratori di ricerca.
Parole chiave: spettroscopia ionica criogenica, spettroscopia IR-UV selettiva sulla conformazione, spettrometria di mobilità ionica, peptidi con struttura ad elica, caratterizzazione strutturale di peptidi, isomeri strutturali di glicani, identificazione di glicani.

Table of Contents
• Abstract (English/Italian) . . . . . . . . . . . . . . . . . . . . . . . . . . . . . . . . . . . . . . . . . . . . . . i
• List of Abbreviations . . . . . . . . . . . . . . . . . . . . . . . . . . . . . . . . . . . . . . . . . . . . . . . . vii
• From proteins to glycans: the challenge of structural characterization . . . . . . . . 1 References. . . . . . . . . . . . . . . . . . . . .. . . . . . . . . . . . . . . . . . . . . . . . . . . . . . .5
• Part 1: Structural characterization of peptides in the gas-phase . . . . . . . . . . . . . 9
1. Introduction . . . . . . . . . . . . . . . . . . . . . . . . . . . . . . . . . . . . . . . . . . . . . . . . . . . .11 1.1 Unraveling protein structure . . . . . . . . . . . . . . . . . . . . . . . . . . . . . . . . . . . .11 1.2 Helical peptides in the gas-phase . . . . . . . . . . . . . . . . . . . . . . . . . . . . . . . .11 1.3 Goals and outline of this work . . . . . . . . . . . . . . . . . . . . . . . . . . . . . . . . . 15 References . . . . . . . . . . . . . . . . . . . . . . . . . . . . . . . . . . . . . . . . . . . . . . . . . 17
2. Experimental and computational methods . . . . . . . . . . . . . . . . . . . . . . . . . . .21 2.1 Cryogenic-tandem mass spectrometer . . . . . . . . . . . . . . . . . . . . . . . . . . . . 21 2.2 IR-UV double resonance spectroscopy . . . . . . . . . . . . . . . . . . . . . . . . . . . 22 2.3 Computational methods . . . . . . . . . . . . . . . . . . . . . . . . . . . . . . . . . . . . . . . 24
References . . . . . . . . . . . . . . . . . . . . . . . . . . . . . . . . . . . . . . . . . . . . . . . . . 25 3. Helical peptides in the gas-phase . . . . . . . . . . . . . . . . . . . . . . . . . . . . . . . . . . .27
References . . . . . . . . . . . . . . . . . . . . . . . . . . . . . . . . . . . . . . . . . . . . . . . . 39 4. Role of a mobile charge in helix formation . . . . . . . . . . . . . . . . . . . . . . . . . . .41
References . . . . . . . . . . . . . . . . . . . . . . . . . . . . . . . . . . . . . . . . . . . . . . . . .53 Conclusions . . . . . . . . . . . . . . . . . . . . . . . . . . . . . . . . . . . . . . . . . . . . . . . . . . . . . . 55
References . . . . . . . . . . . . . . . . . . . . . . . . . . . . . . . . . . . . . . . . . . . . . . . . .56
• Part 2: Identification and characterization of glycans in the gas-phase . . . . . . . .57
5. Introduction . . . . . . . . . . . . . . . . . . . . . . . . . . . . . . . . . . . . . . . . . . . . . . . . . . . .59 5.1 Glycans and their structural heterogeneity . . . . . . . . . . . . . . . . . . . . . . . . 59 5.2 The chemical nature of monosaccharides challenges glycan identification . . . . . . . . . . . . . . . . . . . . . . . . . . . . . . . . . . . . . . . . . .60 5.3 Goals and outline of this work . . . . . . . . . . . . . . . . . . . . . . . . . . . . . . . . . .64 References . . . . . . . . . . . . . . . . . . . . . . . . . . . . . . . . . . . . . . . . . . . . . . . . . 65
6. Available methods for glycan identification . . . . . . . . . . . . . . . . . . . . . . . . . 67 6.1 Nuclear magnetic resonance . . . . . . . . . . . . . . . . . . . . . . . . . . . . . . . . . . . 67 6.2 Mass spectrometry . . . . . . . . . . . . . . . . . . . . . . . . . . . . . . . . . . . . . . . . . . .68
6.3 Chromatographic methods . . . . . . . . . . . . . . . . . . . . . . . . . . . . . . . . . . . . .70 6.4 Ion mobility spectrometry . . . . . . . . . . . . . . . . . . . . . . . . . . . . . . . . . . . . . 71 6.5 Spectroscopy . . . . . . . . . . . . . . . . . . . . . . . . . . . . . . . . . . . . . . . . . . . . . . . 72 6.6 The database approach . . . . . . . . . . . . . . . . . . . . . . . . . . . . . . . . . . . . . . . .73 6.7 Limitations of the currently available methods for glycan analysis . . . . . 75 References . . . . . . . . . . . . . . . . . . . . . . . . . . . . . . . . . . . . . . . . . . . . . . . . . 77
7. Experimental technique . . . . . . . . . . . . . . . . . . . . . . . . . . . . . . . . . . . . . . . . . . 83 7.1 Ion mobility spectrometer coupled to a cryogenic ion trap . . . . . . . . . . . . 83 7.2 Determination of the collisional cross section . . . . . . . . . . . . . . . . . . . . . . 85 7.3 Vibrational tagging spectroscopy. . . . . . . . . . . . . . . . . . . . . . . . . . . . . . . . 87 References . . . . . . . . . . . . . . . . . . . . . . . . . . . . . . . . . . . . . . . . . . . . . . . . . 89
8. A novel technique to identify glycans . . . . . . . . . . . . . . . . . . . . . . . . . . . . . . . 91 8.1 Sample preparation and nomenclature . . . . . . . . . . . . . . . . . . . . . . . . . . . .91 8.2 Identification of anomers . . . . . . . . . . . . . . . . . . . . . . . . . . . . . . . . . . . . . .93 8.3 Identification of regioisomers . . . . . . . . . . . . . . . . . . . . . . . . . . . . . . . . . . 94 8.4 Identification of the monosaccharide content . . . . . . . . . . . . . . . . . . . . . . 95
8.5 Identification of the monosaccharide order of two isomeric disaccharides . . . . . . . . . . . . . . . . . . . . . . . . . . . . . . . . . . 97 8.6 Unambiguous identification of isomeric disaccharides . . . . . . . . . . . . . . .98 References . . . . . . . . . . . . . . . . . . . . . . . . . . . . . . . . . . . . . . . . . . . . . . . . 100
9. Towards the construction of a database . . . . . . . . . . . . . . . . . . . . . . . . . . . .101 9.1 Nitrogen is more efficient as a messenger tag and allows
spectroscopy at higher temperatures . . . . . . . . . . . . . . . . . . . . . . . . .104 9.2 Towards more biologically relevant species:
two examples of pentasaccharides . . . . . . . . . . . . . . . . . . . . . . . . . . . . . 106 9.3 Database protocol . . . . . . . . . . . . . . . . . . . . . . . . . . . . . . . . . . . . . . . . . . 110 9.4 The first step towards a more broadly accessible technique . . . . . . . . . .112 9.5 The next steps towards a more broadly accessible technique . . . . . . . . .114 References . . . . . . . . . . . . . . . . . . . . . . . . . . . . . . . . . . . . . . . . . . . . . . . .116
Conclusions . . . . . . . . . . . . . . . . . . . . . . . . . . . . . . . . . . . . . . . . . . . . . . . . . . . . .119 References . . . . . . . . . . . . . . . . . . . . . . . . . . . . . . . . . . . . . . . . . . . . . . . .121
• Appendix: The role of temperature in the N2 tagging process . . . . . . . . . . . . . .123
• Acknowledgement . . . . . . . . . . . . . . . . . . . . . . . . . . . . . . . . . . . . . . . . . . . . . . . . . .125
• Curriculum Vitae . . . . . . . . . . . . . . . . . . . . . . . . . . . . . . . . . . . . . . . . . . . . . . . . . . 12
List of abbreviations
DNA: deoxyribonucleic acid CCS: collisional cross section IR-UV: infrared-ultraviolet DFT: density functional theory Nano-ESI: nano-electrospray ionization Nd:YAG: neodymium-doped yttrium aluminium garnet OPO/OPA: optical parametric oscillator/optical parametric amplifier CHARMM: Chemistry at Harvard Macromolecular Mechanics OPLS-AA: Optimized Potentials for Liquid Simulations – all atoms FF: force field PBE+vdW: Perdew-Burke-Ernzerhof + van der Wals FHI-aims: Frizt Haber Institut ab initio molecular simulations PBE0+MBD NMR: nuclear magnetic resonance NOE: nuclear Overhauser effect MD: molecular dynamics MS: mass spectrometry MALDI: matrix assisted laser desorption/ionization ECD: electron capture dissociation EDD: electron detachment dissociation CID: collision induced dissociation IRMPD: infrared multi photon dissociation HPLC: high-performance liquid chromatography GCC: graphitized carbon chromatography HILIC: Hydrophilic interaction liquid chromatography GAG: glycosaminoglycan CE: capillary electrophoresis IMS: ion mobility spectrometry m/z: mass-to-charge ratio FAIMS: Field asymmetric ion mobility ETD: electron transfer dissociation TWIM: travelling wave ion mobility DTIM: drift tube ion mobility DIMS: differential ion mobility spectrometry DB: database CCSC: Complex Carbohydrate Structure Database PGC: porous graphitized carbon JCGGDB: Japan Consortium for Glycobiology and Glycotechnology Database CFG: Consortium for Functional Glycomics CAZy: Carbohydrate-Active Enzymes MIRAGE: Minimum Information Required for a Glycomics Experiment PCB: printed circuit board TOF: time-of-flight MTS: messenger tagging spectroscopy UOXF: University of Oxford

From proteins to glycans: the challenge of structural characterization
Throughout years of research it has become well established that the vast majority of pathologies arise from malfunctions that appear at the molecular level in the human body (1-10). This misbehavior at the microscopic level has repercussions at the macroscopic one, eventually leading to cancer, dysfunctions and other serious pathologies, most of which still lack treatment. The molecules responsible for such are the three main classes of biopolymers involved in the vast majority of physiological processes in living organisms: proteins, DNA, and glycans. Studies have shown that there is a specific, direct relationship between the function of a biopolymer and its structure (5, 8, 9). Each structural change implies a functional change. This should not surprise us: if we consider, for example, an ion channel protein, it is clear that the protein has to undergo a structural change to exhibit its function (11, 12). Structural changes do not always imply the emergence of pathologies: proteins, DNA and glycans naturally mutate their structure to perform the function for which they have been designed. Pathologies emerge only in cases when molecular structural changes take place in an uncontrolled fashion and under particular circumstances, most of which are still unknown (1, 2). These unpredictable structural changes destroy the original function of the biopolymer and cause the emergence of the pathology. Hence, in order to control the function of the biopolymer one has to attain control over its structure. In other words, if one knew the structure of the functioning and the malfunctioning biopolymer, it would be theoretically possible to design a drug to selectively bind to it, restore its original structure, and eliminate the pathology.
This thesis focuses on two of these biopolymers: peptides, which are pieces of proteins, and glycans. Both consist of building blocks linked together in a sequence. The building blocks of peptides are amino acids, and the building blocks of glycans are monosaccharides. Because of the close relation between structure and function in proteins and glycans, we aim to structurally characterize them. When talking about biopolymers the word structure has several meanings. For proteins, for example,
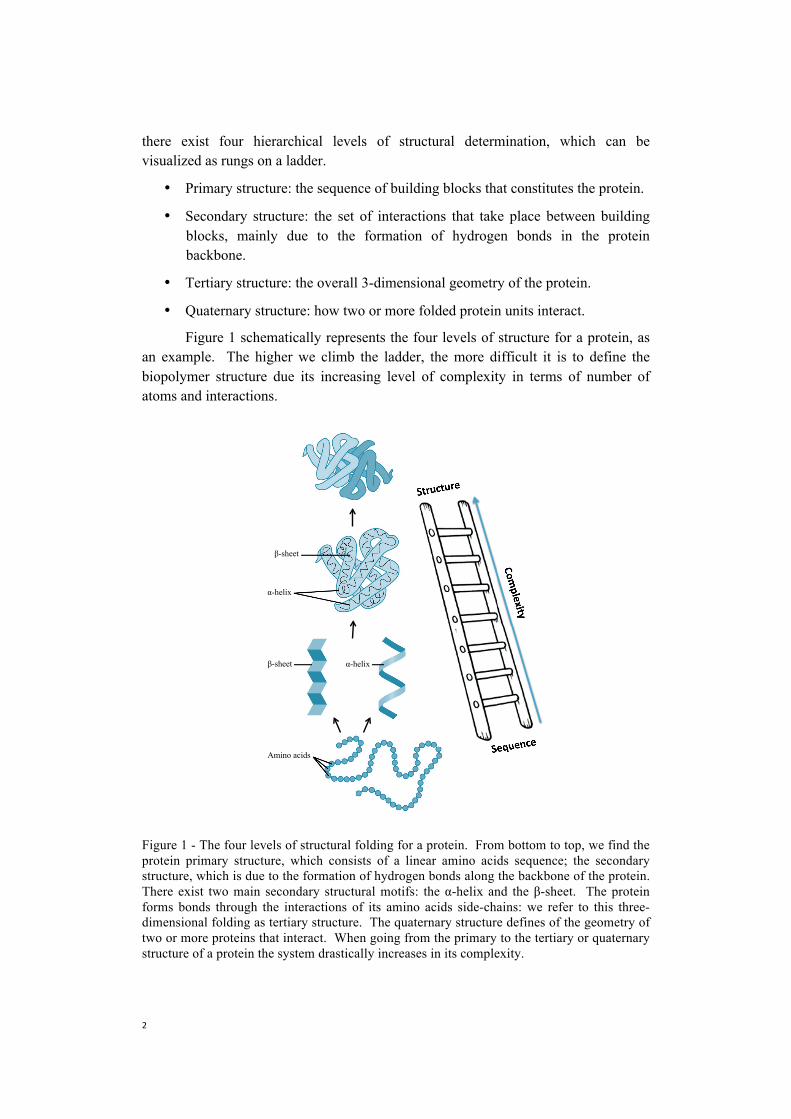
there exist four hierarchical levels of structural determination, which can be visualized as rungs on a ladder.
• Primary structure: the sequence of building blocks that constitutes the protein.
• Secondary structure: the set of interactions that take place between buildingblocks, mainly due to the formation of hydrogen bonds in the proteinbackbone.
• Tertiary structure: the overall 3-dimensional geometry of the protein.
• Quaternary structure: how two or more folded protein units interact.
Figure 1 schematically represents the four levels of structure for a protein, asan example. The higher we climb the ladder, the more difficult it is to define the biopolymer structure due its increasing level of complexity in terms of number of atoms and interactions.
Figure 1 - The four levels of structural folding for a protein. From bottom to top, we find the protein primary structure, which consists of a linear amino acids sequence; the secondary structure, which is due to the formation of hydrogen bonds along the backbone of the protein. There exist two main secondary structural motifs: the α-helix and the β-sheet. The protein forms bonds through the interactions of its amino acids side-chains: we refer to this three-dimensional folding as tertiary structure. The quaternary structure defines of the geometry of two or more proteins that interact. When going from the primary to the tertiary or quaternary structure of a protein the system drastically increases in its complexity.
α-helix β-sheet
α-helix
β-sheet
Amino acids
Primary structural characterization for peptides and proteins is nowadays routine. Due to the characteristic mass that each amino acid has, protein sequences can be easily determined using mass-spectrometric techniques (13-15), which are fast, reliable, and require a small amount of samples. Secondary, tertiary and quaternary structures can be unraveled using a large variety of methods. Liquid chromatography and ion mobility spectrometry (16, 17) provide information about the overall shape of the molecule. When coupled with theoretical calculations, X-ray crystallography (18-20) and nuclear magnetic resonance (21) provide the position of each atom of the peptide or protein, thus, defining the exact three-dimensional geometry of the molecule, while gas-phase spectroscopy (22-25) defines plausible protein or peptides conformers. Despite each experimental technique has its specific limitations, presently it is possible to obtain detailed information on the geometry of peptides routinely. Theoretical calculations are probably the main barrier to structural assignment since reliable structures can only be computed for small. Despite these limitations, the field of proteomics is exploding with information that when combined together allow for structural characterization of peptides and provide deeper understanding of their function.
This increased insight derived from protein studies led scientists to better understand the importance of glycosylation. Glycosylation is a post-translational modification common to proteins and lipids located at the cell surface or in the extracellular matrix (4, 5). Most proteins that are produced from, or present on the cell surface are glycosylated. Glycans are known to influence several properties of the proteins they are attached to, such as protein folding, biological lifetime and protein binding preferences (5, 26). Glycan structural characterization appeared then to be a natural continuation of the work done on proteins. This research led to the improvement of techniques commonly used in structural characterization of proteins for the study of glycans and to the development of new ones due to the variety of their glycoforms.
Mass spectrometry-based techniques, which facilitated the structural characterization of proteins, played a similar role in glycoscience, but they have shown to encounter difficulties in discriminating amongst monosaccharide isomers (27, 28). Contrary to proteins, where each amino acid has a characteristic mass, several of the most recurrent monosaccharides that form glycans have the same atomic composition and are structurally very similar. One is then obliged to couple several experimental techniques in order to define the glycan sequence, since the mass measurements of the glycan or of its constituent monosaccharides alone does not lead to its unambiguous determination (29-48).
Furthermore, glycan analysis presents an additional challenge: to completely define glycan primary structure the branching pattern, linkage, and anomericity of the glycosidic bonds have to be identified in addition to the glycan monosaccharide composition and sequence order. This adds an extra level of complexity that current
techniques cannot easily address, preventing routine primary structure determination of glycans (3, 5, 26).
In the case of proteins, technology and theoretical methods are currently available not only to determine their primary structure, but also their exact geometry; for glycans this knowledge lags far behind due to their chemical complexity.
The work herein focuses on two different aspects of structural characterization of peptides and glycans: in the first part, entitled “Structural characterization of helical peptides in the gas-phase”, we present our studies on helical peptides underlining the importance of the synergy between experiments and theory in solving the exact geometry of peptides (49, 50); in the second part, entitled “Identification and characterization of glycans” we focus on glycans, and show how we developed a method that couples mass and ion mobility spectrometry to cold ion spectroscopy to provide primary structure identification for glycans (51-53).
References 1. S. L. Bernstein et al., Amyloid-beta protein oligomerization and the
importance of tetramers and dodecamers in the aetiology of Alzheimer's disease. Nature Chemistry 1, 326-331 (2009).
2. T. P. Knowles, M. Vendruscolo, C. M. Dobson, The amyloid state and its association with protein misfolding diseases. Nature Review Molecular Cell Biology 15, 384-396 (2014).
3. Transforming Glycoscience: A Roadmap for the Future (2012). 4. A. Varki, Biological roles of glycans. Glycobiology 27, 46 (2017). 5. A. Varki, Cummings, R.D., Esko, J.D. et al., Essentials of Glycobiology.
(Cold Spring Harbor Laboratory Press, NY, ed. 2, 2009). 6. R. A. Dwek, Glycobiology: Towards Understanding the Function of Sugars.
Chemical Reviews 96, 37 (1996). 7. C. Tysoe et al., Potent Human alpha-Amylase Inhibition by the beta-Defensin-
like Protein Helianthamide. ACS Central Science 2, 154-161 (2016). 8. H. J. An, T. R. Peavy, J. L. Hedrick, C. B. Lebrilla, Determination of N-
glycosylation sites and site heterogeneity in glycoproteins. Anal Chem 75, 5628-5637 (2003).
9. K. Ohtsubo, J. D. Marth, Glycosylation in cellular mechanisms of health and disease. Cell 126, 855-867 (2006).
10. K. Ohtsubo, S. Takamatsu, J. D. Marth, Dietary and genetic control of pancreatic beta-cell glucose transporter glycosylation promotes insulin secretion in suppressing the pathogenesis of type-2 diabetes. Glycobiology 16, 1116-1116 (2006).
11. L. J. Holsinger, D. Nichani, L. H. Pinto, R. A. Lamb, Influenza-a Virus M(2) Ion-Channel Protein - a Structure-Function Analysis. Journal of Virology 68, 1551-1563 (1994).
12. D. A. Doyle et al., The structure of the potassium channel: Molecular basis of K+ conduction and selectivity. Science 280, 69-77 (1998).
13. S. Mehmood, T. M. Allison, C. V. Robinson, Mass spectrometry of protein complexes: from origins to applications. Annual Review of Physical Chemistry 66, 453-474 (2015).
14. Y. Wang, S. Y. Liu, Y. J. Hu, P. Li, J. B. Wan, Current state of the art of massspectrometry-based metabolomics studies - a review focusing on widecoverage, high throughput and easy identification. Rsc Advances 5, 78728-78737 (2015).
15. J. R. Yates, C. I. Ruse, A. Nakorchevsky, Proteomics by Mass Spectrometry:Approaches, Advances, and Applications. Annual Review of BiomedicalEngineering 11, 49-79 (2009).
16. R. Beveridge et al., Relating gas phase to solution conformations: Lessonsfrom disordered proteins. Proteomics 15, 2872-2883 (2015).
17. N. A. Pierson, L. X. Chen, D. H. Russell, D. E. Clemmer, Cis-TransIsomerizations of Proline Residues Are Key to Bradykinin Conformations.Journal of the American Chemical Society 135, 3186-3192 (2013).
18. J. C. Kendrew et al., Structure of myoglobin: A three-dimensional Fouriersynthesis at 2 A. resolution. Nature 185, 422-427 (1960).
19. M. F. Perutz, The Structure of Crystalline Proteins. Acta Crystallogr 13, 984-984 (1960).
20. M. F. Perutz et al., Structure of Haemoglobin - 3-Dimensional FourierSynthesis at 5.5-a Resolution, Obtained by X-Ray Analysis. Nature 185, 416-422 (1960).
21. G. S. Rule, T. K. Hitchens, Fundamentals of protein NMR spectroscopy;Focus on structural biology. (Springer-Verlag, Berlin/Heidelberg, 2006), vol.5.
22. A. Barth, Infrared spectroscopy of proteins. Biochimica et Biophysica Acta1767, 1073-1101 (2007).
23. J. A. Stearns, O. V. Boyarkin, T. R. Rizzo, Spectroscopic signatures of gas-phase helices: Ac-Phe-(Ala)(5)-Lys-H+ and Ac-Phe-(Ala)(10)-Lys-H+.Journal of the American Chemical Society 129, 13820-+ (2007).
24. A. V. Zabuga, T. R. Rizzo, Capping Motif for Peptide Helix Formation.Journal of Physical Chemistry Letters 6, 1504-1508 (2015).
25. L. Voronina et al., Conformations of Prolyl-Peptide Bonds in the Bradykinin1-5 Fragment in Solution and in the Gas Phase. Journal of the AmericanChemical Society 138, 9224-9233 (2016).
26. A. Varki, Biological roles of oligosaccharides: all of the theories are correct.Glycobiology 3, 97-130 (1993).
27. M. Wuhrer, A. M. Deelder, Y. E. van der Burgt, Mass spectrometric glycanrearrangements. Mass Spectrometry Reviews 30, 664-680 (2011).
28. M. J. Kailemia, L. R. Ruhaak, C. B. Lebrilla, I. J. Amster, OligosaccharideAnalysis by Mass Spectrometry: A Review of Recent Developments.Analytical Chemistry 86, 196-212 (2014).
29. A. J. Creese, H. J. Cooper, Separation and Identification of IsomericGlycopeptides by High Field Asymmetric Waveform Ion MobilitySpectrometry. Analytical Chemistry 84, 2597-2601 (2012).
30. A. Devakumar, Y. Mechref, P. Kang, M. V. Novotny, J. P. Reilly,Identification of isomeric N-glycan structures by mass spectrometry with 157
nm laser-induced photofragmentation. Journal of the American Society for Mass Spectrometry 19, 1027-1040 (2008).
31. L. S. Fenn, J. A. McLean, Structural resolution of carbohydrate positional and structural isomers based on gas-phase ion mobility-mass spectrometry. Physical Chemistry Chemical Physics 13, 2196-2205 (2011).
32. M. M. Gaye, R. Kurulugama, D. E. Clemmer, Investigating carbohydrate isomers by IMS-CID-IMS-MS: precursor and fragment ion cross-sections. Analyst 140, 6922-6932 (2015).
33. L. A. Gennaro, J. Delaney, P. Vouros, D. J. Harvey, B. Domon, Capillary electrophoresis/electrospray ion trap mass spectrometry for the analysis of negatively charged derivatized and underivatized glycans. Rapid Communication Mass Spectrometry 16, 192-200 (2002).
34. O. Hernandez, S. Isenberg, V. Steinmetz, G. L. Glish, P. Maitre, Probing Mobility-Selected Saccharide Isomers: Selective Ion-Molecule Reactions and Wavelength-Specific IR Activation. Journal of Physical Chemistry A 119, 6057-6064 (2015).
35. J. Hofmann et al., Identification of Lewis and Blood Group Carbohydrate Epitopes by Ion Mobility-Tandem-Mass Spectrometry Fingerprinting. Analytical Chemistry 89, 2318-2325 (2017).
36. Y. Mechref, M. V. Novotny, Glycomic analysis by capillary electrophoresis-mass spectrometry. Mass Spectrometry Reviews 28, 207-222 (2009).
37. M. Militsopoulou, F. N. Lamari, A. Hjerpe, N. K. Karamanos, Determination of twelve heparin- and heparan sulfate-derived disaccharides as 2-aminoacridone derivatives by capillary zone electrophoresis using ultraviolet and laser-induced fluorescence detection. Electrophoresis 23, 1104-1109 (2002).
38. K. Pagel, D. J. Harvey, Ion Mobility-Mass Spectrometry of Complex Carbohydrates: Collision Cross Sections of Sodiated N-linked Glycans. Analytical Chemistry 85, 5138-5145 (2013).
39. M. Pikulski, A. Hargrove, S. H. Shabbir, E. V. Anslyn, J. S. Brodbelt, Sequencing and characterization of oligosaccharides using infrared multiphoton dissociation and boronic acid derivatization in a quadrupole ion trap. Journal of the American Society for Mass Spectrometry 18, 2094-2106 (2007).
40. N. C. Polfer et al., Differentiation of isomers by wavelength-tunable infrared multiple-photon dissociation-mass spectrometry: Application to glucose-containing disaccharides. Analytical Chemistry 78, 670-679 (2006).
41. B. Schindler et al., Distinguishing isobaric phosphated and sulfated carbohydrates by coupling of mass spectrometry with gas phase vibrational spectroscopy. Physical Chemistry Chemical Physics 16, 22131-22138 (2014).
42. Y. Seo, A. Andaya, J. A. Leary, Preparation, separation, and conformational analysis of differentially sulfated heparin octasaccharide isomers using ion mobility mass spectrometry. Analytical Chemistry 84, 2416-2423 (2012).
Y. L. Tan, N. C. Polfer, Linkage and Anomeric Differentiation inTrisaccharides by Sequential Fragmentation and Variable-WavelengthInfrared Photodissociation. Journal of the American Society for MassSpectrometry 26, 359-368 (2015).J. P. Williams et al., Characterization of simple isomeric oligosaccharides andthe rapid separation of glycan mixtures by ion mobility mass spectrometry. IntJournal of Mass Spectrometry 298, 119-127 (2010).M. Wuhrer, C. A. M. Koeleman, A. M. Deelder, C. N. Hokke, Normal-phasenanoscale liquid chromatography - Mass spectrometry of underivatizedoligosaccharides at low-femtomole sensitivity. Analytical Chemistry 76, 833-838 (2004).A. Zamfir, D. G. Seidler, E. Schonherr, H. Kresse, J. Peter-Katalinic, On-linesheathless capillary electrophoresis/nanoelectrospray ionization-tandem massspectrometry for the analysis of glycosaminoglycan oligosaccharides.Electrophoresis 25, 2010-2016 (2004).M. Zhu, B. Bendiak, B. Clowers, H. H. Hill, Jr., Ion mobility-massspectrometry analysis of isomeric carbohydrate precursor ions. Analytical andBioanalytical Chemistry 394, 1853-1867 (2009).Z. Zhuang, J. A. Starkey, Y. Mechref, M. V. Novotny, S. C. Jacobson,Electrophoretic analysis of N-glycans on microfluidic devices. AnalyticalChemistry 79, 7170-7175 (2007).M. Schneider, C. Masellis, T. R. Rizzo, C. Baldauf, Kinetically TrappedLiquid-State Conformers of a Sodiated Model Peptide Observed in the GasPhase. Journal of Physical Chemistry A, 121, 6838-6844 (2017).C. Masellis, T. R. Rizzo, (in preparation), Spectroscopic Fingerprint of HelicalPeptides in the Gas-phase.N. Khanal, C. Masellis, M. Z. Kamrath, D. E. Clemmer, T. R. Rizzo,Glycosaminoglycan Analysis by Cryogenic Messenger-Tagging IRSpectroscopy Combined with IMS-MS. Analytical Chemistry 89, 7601-7606(2017).C. Masellis, N. Khanal, M. Z. Kamrath, D. E. Clemmer, T. R. Rizzo,Cryogenic Vibrational Spectroscopy Provides Unique Fingerprints for GlycanIdentification. Journal of the Americal Society for Mass Spectrometry, 28,2217-2222 (2017).N. Khanal, C. Masellis, M. Z. Kamrath, D. E. Clemmer, T. R. Rizzo, (inpreparation), Cryogenic, Messenger-Tagging, IR spectroscopy Combined withIMS-MS for the Analysis of Human Milk Oligosaccharides.
Part 1
Structural Characterization of Helical Peptides in the Gas-Phase

1. Introduction
1.1 Unraveling peptide structure
Quantifying the absolute number of proteins in human cells is an ongoing challenge (1, 2), however studies have shown that proteins constitute around the 15% of the mass of a typical eukaryotic cell (3). Countless are the biological processes in which proteins play an active role: they serve as enzymes, ligands, receptors, building blocks (3), to cite few examples. Proteins are constituted of 20 naturally occurring building blocks that chemically bind together by forming peptide bonds. These building blocks are known as amino acids. Generally, one defines a protein as a chain of amino acids longer than 50-100 monomers; in case of a shorter sequence one refers instead to a peptide. Neurotransmitters, hormones, antibiotics, and cell-penetrating agents present in the human body are mostly peptides (4-12).
While proteins can form tertiary or quaternary structures, this does not occur with peptides due to their limited length. Nevertheless, they adopt certain secondary structures capable of interacting with proteins, DNA, and lipids to trigger biological processes (8, 9, 14-17). The structure and the function of proteins and peptides are strictly linked. In order to understand the mechanisms that govern the interactions between peptides and other biological molecules, one has to unravel their secondary structure, which has a direct impact in medicine (18, 19), drug development (6, 12, 20), and material science (21).
1.2 Helical peptides in the gas-phase
Helices are the most common motifs in protein secondary structure (22). There exist three types of helices that are distinguished by the number of residues that forms one loop: 1) in the α-helix each loop consists of 3.6 residues per turn, 2) in the 310-helix one loop consists of 3 residues per turn, while 3) in the π-helix each loopconsists of 4.1 residues per turn. The first successful attempt to unravel the geometryof a helical peptide was in 1951 by Pauling, Corey and Branson (23). They postulated
the exact structure of the right- and left-handed α-helix based on interatomic distances and bond angles found in their studies on crystal structures of amino acids and small molecules. It took an additional nine years before Kendrew et al. (24) reported the experimental observation of the myoglobin crystal structure.
In solution, helix propensity is determined both by intramolecular interactions, in particular hydrogen bonds, and protein-solvent interactions. The gas-phase is a unique medium in which to study intramolecular interactions without solvent effects, shedding light on intrinsic helix propensities. For this reason, gas phase helices have been extensively investigated using both ion mobility spectrometry (13, 25-28) and spectroscopic techniques (29-36). Pioneering ion mobility experiments performed by Jarrold and coworkers (13, 25, 26, 28) examined the role of the N- and C-terminal residues on gas-phase helix formation for the sequences (Ala)n-H+, Ac-Lys-(Ala)n-H+
and Ac-(Ala)n-Lys-H+. For each peptide, they determined its relative collisional cross section (CCS), which they defined as Ωav-14.50n, where Ωav is the average experimental CCS in Å, and 14.50 Å is the average CCS per residue calculated for an ideal polyalanine α-helix. This relative CCS scale is very efficient to discriminate between helical and globular conformations: helical conformations display a relative CCS independent of the number of residues present in the chain. Contrarily, globular conformations show a non-constant trend of their relative CCS as a function of the number of residues. Based on these trends, shown in Figure 1.1, Jarrold and coworkers affirmed that (Ala)n-H+ and Ac-Lys-(Ala)n-H+ adopt a globular conformation in the gas-phase, while peptides of the form Ac-(Ala)n-Lys-H+ are helical (13, 25). Moreover, they showed that the relative collisional cross section for Ac-(Ala)n-Lys-H+ increases linearly from n=8 to n=19, but below this size the structure seems to be more compact compared to what one would expect for a helical structure. Rossi et al. (29), and Schubert et al. (31) confirmed the helical nature of these species by combining theoretical and experimental vibrational spectroscopy.
By performing molecular dynamics simulations, Jarrold’s group showed that the charged side-chain of the C-terminal lysine plays a key role in stabilizing the helical motif. Lysine interacts with the helix macro-dipole and caps the carbonyls of the preceding three residues (25, 37), increasing the stability of this structural element in the gas-phase. Moreover, the hydrogen-bonding pattern formed by the amino acids located in the interior part of the helix increases the robustness of the motif, shaping the three-dimensional arrangement of the atoms. To strengthen this evidence, Kohtani et al. (28), and Kaleta et al. (26) proved that sequence rearrangements for Lys trigger the formation of globular structures: protonation closer to the N-terminus leads to an unfavorable interaction with the helix dipole (28), which disrupts the helical motif. Furthermore, they proved that acetylation at the N-terminus is sufficient to induce helix formation in the absence of other basic sites, since protonation would then occur on the backbone amide group (26).
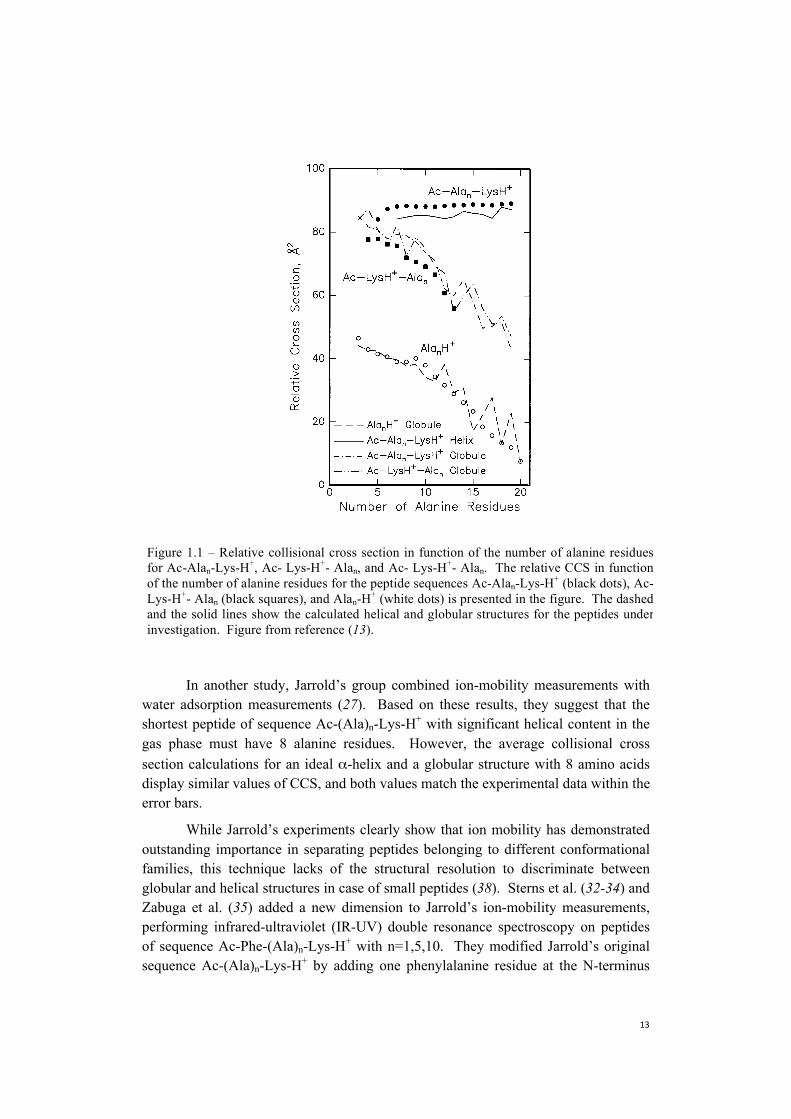
In another study, Jarrold’s group combined ion-mobility measurements with water adsorption measurements (27). Based on these results, they suggest that the shortest peptide of sequence Ac-(Ala)n-Lys-H+ with significant helical content in the gas phase must have 8 alanine residues. However, the average collisional cross section calculations for an ideal α-helix and a globular structure with 8 amino acids display similar values of CCS, and both values match the experimental data within the error bars.
While Jarrold’s experiments clearly show that ion mobility has demonstrated outstanding importance in separating peptides belonging to different conformational families, this technique lacks of the structural resolution to discriminate between globular and helical structures in case of small peptides (38). Sterns et al. (32-34) and Zabuga et al. (35) added a new dimension to Jarrold’s ion-mobility measurements, performing infrared-ultraviolet (IR-UV) double resonance spectroscopy on peptides of sequence Ac-Phe-(Ala)n-Lys-H+ with n=1,5,10. They modified Jarrold’s original sequence Ac-(Ala)n-Lys-H+ by adding one phenylalanine residue at the N-terminus
Figure 1.1 – Relative collisional cross section in function of the number of alanine residuesfor Ac-Alan-Lys-H+, Ac- Lys-H+- Alan, and Ac- Lys-H+- Alan. The relative CCS in functionof the number of alanine residues for the peptide sequences Ac-Alan-Lys-H+ (black dots), Ac-Lys-H+- Alan (black squares), and Alan-H+ (white dots) is presented in the figure. The dashedand the solid lines show the calculated helical and globular structures for the peptides underinvestigation. Figure from reference (13).
as UV chromophore. Their experiments show that a sequence of this type with 7 residues forms a helical structure (32-34), whereas Jarrold’s indicated that at least 9 residues were required.
Another study performed by Zabuga et al. (35) identified the structure of the helix capping motif by comparison with Stearns’ data (33), and suggested that this motif is conserved in larger helical peptides. By performing IR-UV spectroscopy on peptides with a sequence in which the Lysine is moved from the N-terminus to the C-terminus, Stearns et al. (33) confirmed Jarrold’s results spectroscopically: peptideswith Lys at the N-terminus adopt a globular structure (34), and that Lys at theC-terminus is essential for helix stabilization.
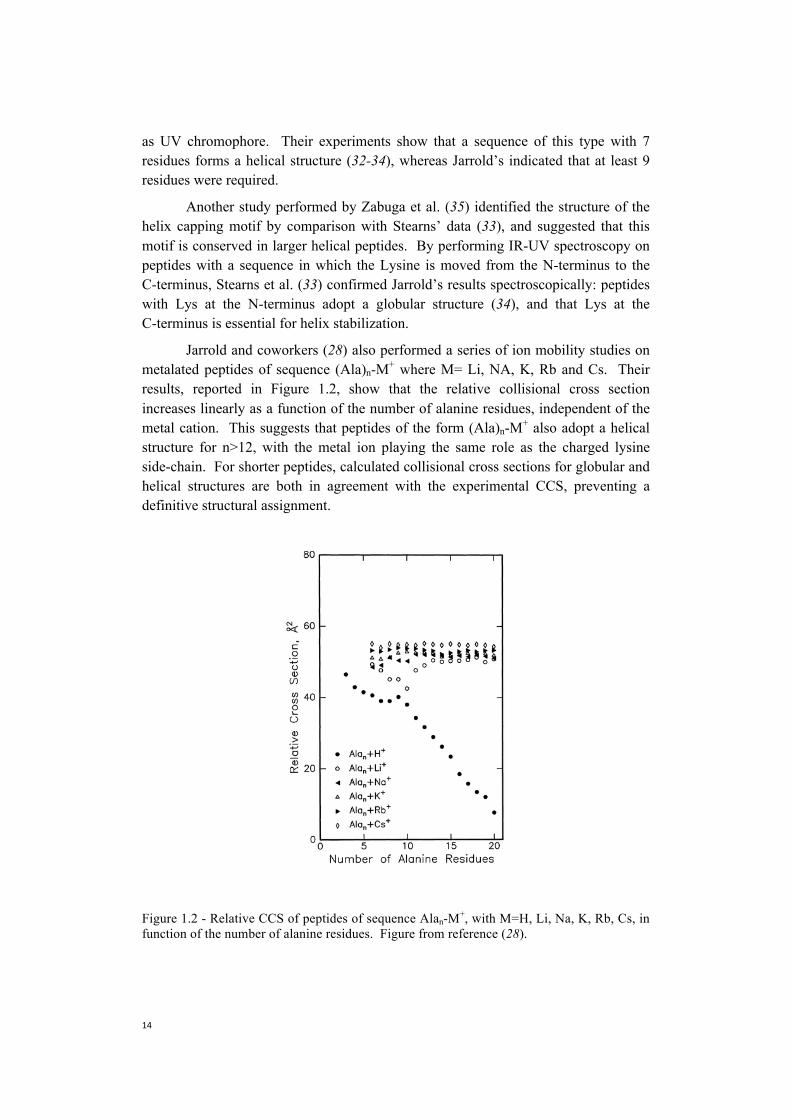
Jarrold and coworkers (28) also performed a series of ion mobility studies on metalated peptides of sequence (Ala)n-M+ where M= Li, NA, K, Rb and Cs. Their results, reported in Figure 1.2, show that the relative collisional cross section increases linearly as a function of the number of alanine residues, independent of the metal cation. This suggests that peptides of the form (Ala)n-M+ also adopt a helical structure for n>12, with the metal ion playing the same role as the charged lysine side-chain. For shorter peptides, calculated collisional cross sections for globular and helical structures are both in agreement with the experimental CCS, preventing a definitive structural assignment.
Figure 1.2 - Relative CCS of peptides of sequence Alan-M+, with M=H, Li, Na, K, Rb, Cs, in function of the number of alanine residues. Figure from reference (28).
1.3 Goals and outline of this work
The work presented in the first part of this thesis focuses on the structural characterization of the peptide helices in the gas-phase. One of our goals is to understand how the helical motif for peptides of sequence Ac-Phe-(Ala)n-Lys-H+ evolves upon increasing of the number of alanine residues. We perform these experiments in a home-built cryogenic tandem mass spectrometer. The spectroscopic technique that we use, IR-UV double resonance spectroscopy, enables measuring a conformer-selective vibrational spectrum of a molecule in the gas-phase. In this thesis, we employ this method to obtain the signature of a helix in the gas-phase.
From Jarrold’s experiments (25) we learn that helix propensity is strongly enhanced in presence of a charged lysine residue located at the C-terminus of the sequence. How important is the presence of the charge and of its location? Could one replace the Lys with a metal cation and still observe helical structures? To address these questions we used IR-UV spectroscopy together with density-functional theory (DFT) calculations to investigate a series of peptides complexed with metal cations. The combination of our experimental technique with molecular simulations based on DFT allows both for structure elucidation, and interpretation of the experimental spectra. Moreover, a rigorous comparison of experiment and theory allows for the assessment of the accuracy and predictive power of simulation approaches (39).
The general outline of this first part of the thesis is the following:
Chapter 2, “Experimental and computational methods”, focuses on the description of our experimental setup and on the computational methods used to determine the structure of Ac-Phe-(Ala)5-Lys-H+ and Ac-Phe-(Ala)6-Na+. To achieve structural characterization of peptides, we employ IR-UV double resonance spectroscopy in a cryogenic tandem mass spectrometer equipped with a cold octopole ion trap.
Chapter 3, “Helical peptides in the gas-phase”, presents our study on helical peptides of form Ac-Phe-(Ala)n-Lys-H+ with n=1-5, 10. In this chapter we show how the vibrational spectrum changes as one increases the number of alanine residues in the sequence, and we analyze the role played by the lysine amino acid at the C-terminus. In addition, we show that we can provide a spectroscopic fingerprint forthe helical motif in the gas-phase.
Chapter 4, “Role of a mobile charge in helix formation”, analyses the role played by the charge at the C-terminus in helix formation. We investigate here metalated species of the sequence Ac-Phe-(Ala)6-M+ with M = Li, Na, K, Zn and Ac-Phe-(Ala)6-M2+ with M = Ca, Ni, Zn using IR-UV double resonance spectroscopy and compare them with Ac-Phe-(Ala)5-Lys-H+. For this project, we established collaboration with the group of Dr. Carsten Baldauf of the Theory Department of the

Fritz Haber Institute in Berlin. Our results demonstrate that the synergy between experiment and theory is fundamental to unravel the structure of metalated species.
In the Part 1 Conclusions section, we summarize our main findings concerning the structural characterization of helical peptides in the gas-phase.
References
1. R. Milo, What is the total number of protein molecules per cell volume? A callto rethink some published values. Bioessays 35, 1050-1055 (2013).
2. C. V. Sapan, R. L. Lundblad, N. C. Price, Colorimetric protein assaytechniques. Biotechnology and Applied Biochemistry 29 ( Pt 2), 99-108(1999).
3. D. Voet, J. G. Voet, Wiley, Ed. (2011).4. J. Axelrod, T. D. Reisine, Stress Hormones - Their Interaction and Regulation.
Science 224, 452-459 (1984).5. K. J. Catt, J. P. Harwood, G. Aguilera, M. L. Dufau, Hormonal-Regulation of
Peptide Receptors and Target-Cell Responses. Nature 280, 109-116 (1979).6. P. D. Cotter, C. Hill, R. P. Ross, Bacteriocins: developing innate immunity for
food. Nature Reviews Microbiology 3, 777-788 (2005).7. S. Duquesne, V. Petit, J. Peduzzi, S. Rebuffat, Structural and functional
diversity of microcins, gene-encoded antibacterial peptides fromenterobacteria. Journal of Molecular Microbiology Biotechnology 13, 200-209(2007).
8. M. Hong, Y. Su, Structure and dynamics of cationic membrane peptides andproteins: insights from solid-state NMR. Protein Science 20, 641-655 (2011).
9. P. Nicolas, Multifunctional host defense peptides: intracellular-targetingantimicrobial peptides. FEBS J 276, 6483-6496 (2009).
10. C. Severini, G. Improta, G. Falconieri-Erspamer, S. Salvadori, V. Erspamer,The tachykinin peptide family. Pharmacological Review 54, 285-322 (2002).
11. M. Tatar, A. Bartke, A. Antebi, The endocrine regulation of aging by insulin-like signals. Science 299, 1346-1351 (2003).
12. J. M. Willey, W. A. van der Donk, Lantibiotics: peptides of diverse structureand function. Annual Review Microbiology 61, 477-501 (2007).
13. R. R. Hudgins, M. F. Jarrold, Helix formation in unsolvated alanine-basedpeptides: Helical monomers and helical dimers. Journal of the AmericanChemical Society 121, 3494-3501 (1999).
14. D. S. Dimitrov, Virus entry: molecular mechanisms and biomedicalapplications. Natural Review Microbiology 2, 109-122 (2004).
15. R. Eckel et al., Identification of binding mechanisms in single molecule-DNAcomplexes. Biophysics J 85, 1968-1973 (2003).
16. N. London, B. Raveh, O. Schueler-Furman, Peptide docking and structure-based characterization of peptide binding: from knowledge to know-how.Current Opinion in Structural Biology 23, 894-902 (2013).
17. L. Yang, A. Schepartz, Relationship between folding and function in asequence-specific miniature DNA-binding protein. Biochemistry 44, 7469-7478 (2005).
18. S. L. Bernstein et al., Amyloid-beta protein oligomerization and theimportance of tetramers and dodecamers in the aetiology of Alzheimer'sdisease. Nature Chemistry 1, 326-331 (2009).
19. T. P. Knowles, M. Vendruscolo, C. M. Dobson, The amyloid state and itsassociation with protein misfolding diseases. Natural Review Molecular CellBiology 15, 384-396 (2014).
20. K. V. Reddy, R. D. Yedery, C. Aranha, Antimicrobial peptides: premises andpromises. International Journal of Antimicrobial Agents 24, 536-547 (2004).
21. S. Li et al., Design of Asymmetric Peptide Bilayer Membranes. Jourmal of theAmerican Chemical Society 138, 3579-3586 (2016).
22. D. J. Barlow, J. M. Thornton, Helix Geometry in Proteins. Journal ofMolecular Biology 201, 601-619 (1988).
23. L. Pauling, R. B. Corey, H. R. Branson, The structure of proteins; twohydrogen-bonded helical configurations of the polypeptide chain. Proceedingsof the National Academny of Sciences U S A 37, 205-211 (1951).
24. J. C. Kendrew et al., Structure of myoglobin: A three-dimensional Fouriersynthesis at 2 A. resolution. Nature 185, 422-427 (1960).
25. R. R. Hudgins, M. A. Ratner, M. F. Jarrold, Design of helices that are stable invacuo. Journal of the American Chemical Society 120, 12974-12975 (1998).
26. D. T. Kaleta, M. F. Jarrold, Disrupting helix formation in unsolvated peptides.Journal of Physical Chemistry B 105, 4436-4440 (2001).
27. M. Kohtani, M. F. Jarrold, Water molecule adsorption on short alaninepeptides: How short is the shortest gas-phase alanine-based helix? Journal ofthe American Chemical Society 126, 8454-8458 (2004).
28. M. Kohtani, B. S. Kinnear, M. F. Jarrold, Metal-ion enhanced helicity in thegas phase. Journal of the American Chemical Society 122, 12377-12378(2000).
29. M. Rossi et al., Secondary Structure of Ac-Ala(n)-LysH(+) PolyalaninePeptides (n=5, 10, 15) in Vacuo: Helical or Not? Journal of PhysicalChemistry Letters 1, 3465-3470 (2010).
30. F. Schubert et al., Native like helices in a specially designed beta peptide inthe gas phase. Physical Chemistry Chemical Physics 17, 5376-5385 (2015).
31. F. Schubert et al., Exploring the conformational preferences of 20-residuepeptides in isolation: Ac-Ala(19)-Lys + H+ vs. Ac-Lys-Ala(19) + H+ and thecurrent reach of DFT. Physical Chemistry Chemical Physics 17, 7373-7385(2015).
32. J. A. Stearns, O. V. Boyarkin, T. R. Rizzo, Spectroscopic signatures of gas-phase helices: Ac-Phe-(Ala)(5)-Lys-H+ and Ac-Phe-(Ala)(10)-Lys-H+.Journal of the American Chemical Society 129, 13820-+ (2007).
33. J. A. Stearns, O. V. Boyarkin, T. R. Rizzo, Effects of N-terminus substitutionon the structure and spectroscopy of gas-phase helices. Chimia 62, 240-243(2008).
34. J. A. Stearns, C. Seaiby, O. V. Boyarkin, T. R. Rizzo, Spectroscopy andconformational preferences of gas-phase helices. Physical ChemistryChemical Physics 11, 125-132 (2009).
35. A. V. Zabuga, T. R. Rizzo, Capping Motif for Peptide Helix Formation.Journal of Physical Chemistry Letters 6, 1504-1508 (2015).
36. W. Chin et al., Gas phase formation of a 3(10)-helix in a three-residue peptidechain: Role of side chain-backbone interactions as evidenced by IR-UVdouble resonance experiments. Journal of the American Chemical Society 127,11900-11901 (2005).
37. A. V. Zabuga, T. R. Rizzo, Capping Motif for Peptide Helix Formation.Journal of Physical Chemistry Letters 6, 1504-1508 (2015).
38. A. Masson et al., Infrared Spectroscopy of Mobility-Selected H+-Gly-Pro-Gly-Gly (GPGG). Journal of the American Society for Mass Spectrometry 26,1444-1454 (2015).
39. C. Baldauf, M. Rossi, Going clean: structure and dynamics of peptides in thegas phase and paths to solvation. Journal of Physics: Condensed Matter 27,493002 (2015).

2. Experimental and computationalmethods
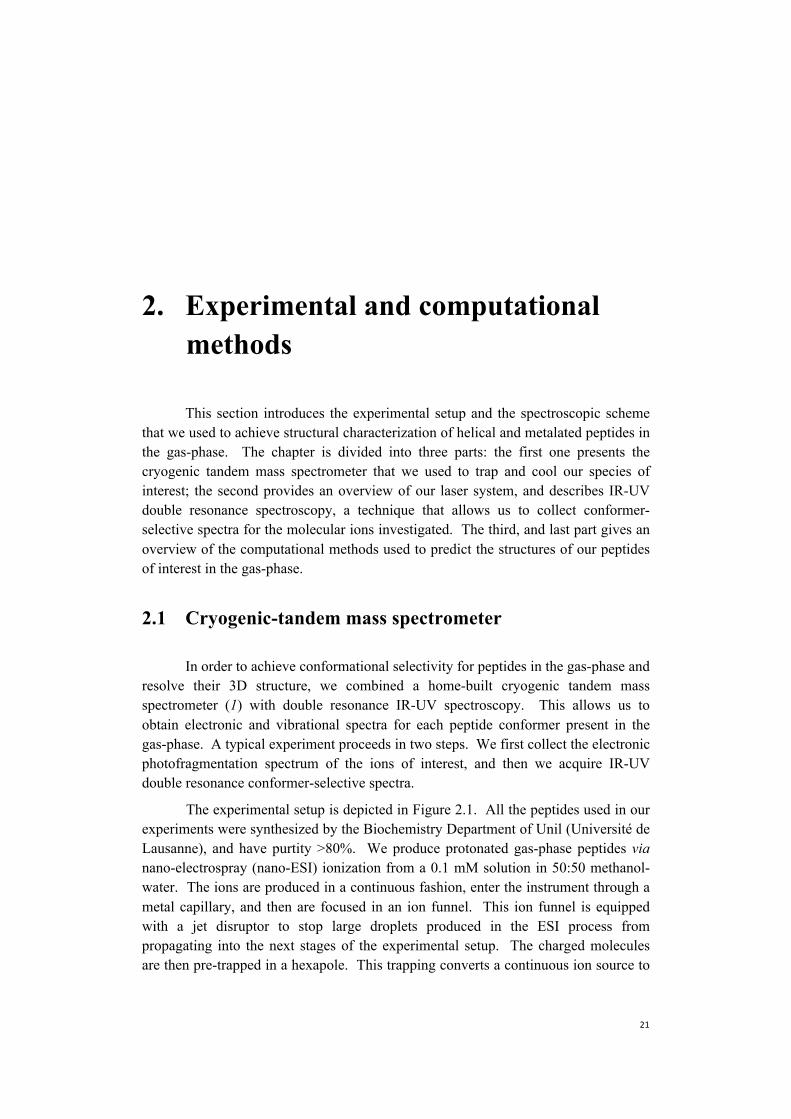
This section introduces the experimental setup and the spectroscopic scheme that we used to achieve structural characterization of helical and metalated peptides in the gas-phase. The chapter is divided into three parts: the first one presents the cryogenic tandem mass spectrometer that we used to trap and cool our species of interest; the second provides an overview of our laser system, and describes IR-UV double resonance spectroscopy, a technique that allows us to collect conformer-selective spectra for the molecular ions investigated. The third, and last part gives an overview of the computational methods used to predict the structures of our peptides of interest in the gas-phase.
2.1 Cryogenic-tandem mass spectrometer
In order to achieve conformational selectivity for peptides in the gas-phase and resolve their 3D structure, we combined a home-built cryogenic tandem mass spectrometer (1) with double resonance IR-UV spectroscopy. This allows us to obtain electronic and vibrational spectra for each peptide conformer present in the gas-phase. A typical experiment proceeds in two steps. We first collect the electronic photofragmentation spectrum of the ions of interest, and then we acquire IR-UV double resonance conformer-selective spectra.
The experimental setup is depicted in Figure 2.1. All the peptides used in our experiments were synthesized by the Biochemistry Department of Unil (Université de Lausanne), and have purtity >80%. We produce protonated gas-phase peptides via nano-electrospray (nano-ESI) ionization from a 0.1 mM solution in 50:50 methanol-water. The ions are produced in a continuous fashion, enter the instrument through a metal capillary, and then are focused in an ion funnel. This ion funnel is equipped with a jet disruptor to stop large droplets produced in the ESI process from propagating into the next stages of the experimental setup. The charged molecules are then pre-trapped in a hexapole. This trapping converts a continuous ion source to
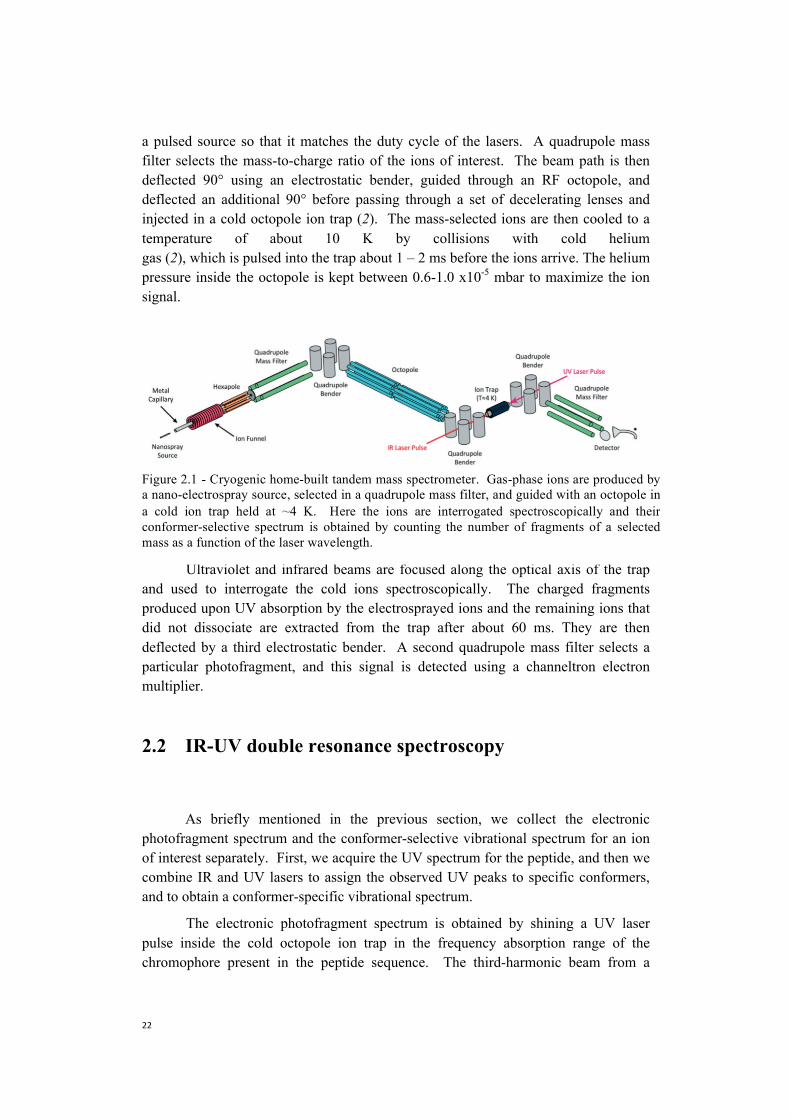
a pulsed source so that it matches the duty cycle of the lasers. A quadrupole mass filter selects the mass-to-charge ratio of the ions of interest. The beam path is then deflected 90° using an electrostatic bender, guided through an RF octopole, and deflected an additional 90° before passing through a set of decelerating lenses and injected in a cold octopole ion trap (2). The mass-selected ions are then cooled to a temperature of about 10 K by collisions with cold helium gas (2), which is pulsed into the trap about 1 – 2 ms before the ions arrive. The helium pressure inside the octopole is kept between 0.6-1.0 x10⁻⁵ mbar to maximize the ion signal.
Ultraviolet and infrared beams are focused along the optical axis of the trap and used to interrogate the cold ions spectroscopically. The charged fragments produced upon UV absorption by the electrosprayed ions and the remaining ions that did not dissociate are extracted from the trap after about 60 ms. They are then deflected by a third electrostatic bender. A second quadrupole mass filter selects a particular photofragment, and this signal is detected using a channeltron electron multiplier.
2.2 IR-UV double resonance spectroscopy
As briefly mentioned in the previous section, we collect the electronic photofragment spectrum and the conformer-selective vibrational spectrum for an ion of interest separately. First, we acquire the UV spectrum for the peptide, and then we combine IR and UV lasers to assign the observed UV peaks to specific conformers, and to obtain a conformer-specific vibrational spectrum.
The electronic photofragment spectrum is obtained by shining a UV laser pulse inside the cold octopole ion trap in the frequency absorption range of the chromophore present in the peptide sequence. The third-harmonic beam from a
Figure 2.1 - Cryogenic home-built tandem mass spectrometer. Gas-phase ions are produced bya nano-electrospray source, selected in a quadrupole mass filter, and guided with an octopole ina cold ion trap held at ~4 K. Here the ions are interrogated spectroscopically and their conformer-selective spectrum is obtained by counting the number of fragments of a selectedmass as a function of the laser wavelength.
pulsed Nd:YAG laser pumps a tunable dye laser (Lumonics HD-500). The visible light produced by this last one is frequency-doubled using an autotracker (Inrad Autotracker III) to produce a tunable UV beam of 1 – 2 mJ/pulse. The length of the UV pulse is ~ 5 ns, and the linewidth of the dye laser is ~ 0.07 cm-1. In the experiments presented in this thesis, the chromophore that we included in the peptide sequence to absorb UV radiation is phenylalanine. We then used Coumarin 540A dye to generate UV radiation in the absorption range of this amino acid. The infrared light in the 3 μm region is, instead, generated using the fundamental of an Continuum Nd:YAG laser that pumps a OPO/OPA (Laser Vision). The pulse length is ~ 10 ns and its linewidth 1.5 cm-1. The UV and IR beams overlap the ion cloud inside the trap.
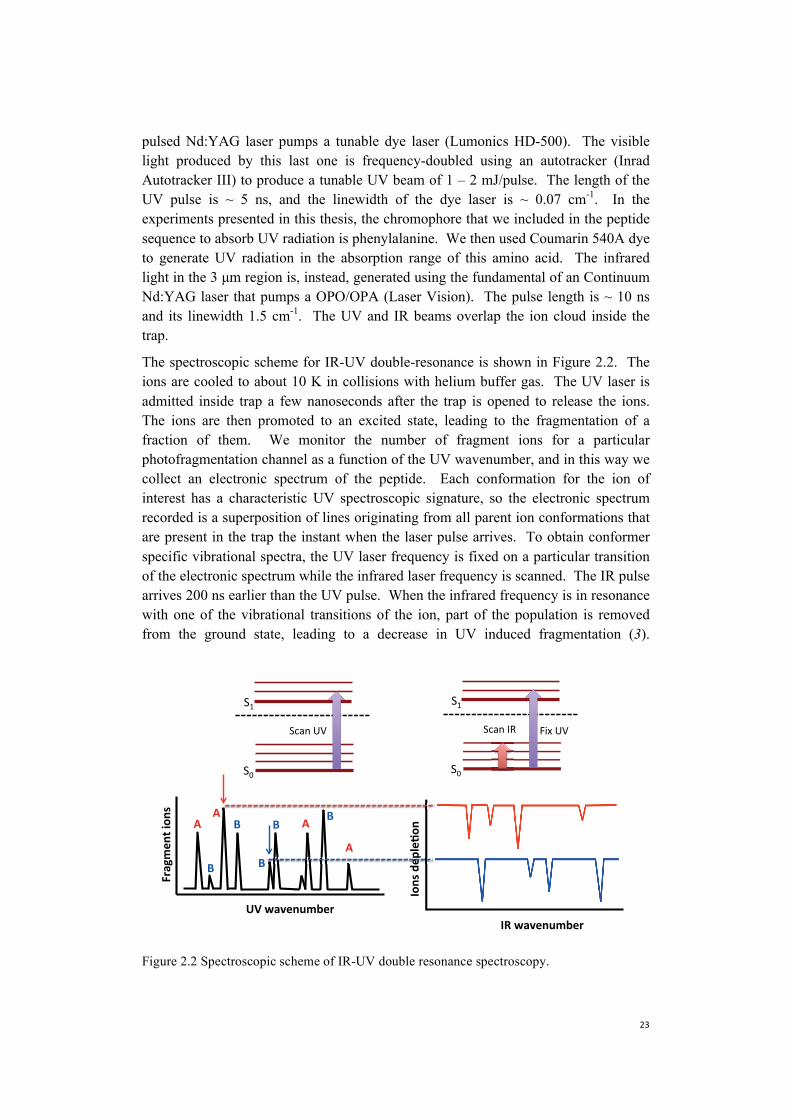
The spectroscopic scheme for IR-UV double-resonance is shown in Figure 2.2. The ions are cooled to about 10 K in collisions with helium buffer gas. The UV laser is admitted inside trap a few nanoseconds after the trap is opened to release the ions. The ions are then promoted to an excited state, leading to the fragmentation of a fraction of them. We monitor the number of fragment ions for a particularphotofragmentation channel as a function of the UV wavenumber, and in this way we collect an electronic spectrum of the peptide. Each conformation for the ion of interest has a characteristic UV spectroscopic signature, so the electronic spectrum recorded is a superposition of lines originating from all parent ion conformations that are present in the trap the instant when the laser pulse arrives. To obtain conformer specific vibrational spectra, the UV laser frequency is fixed on a particular transitionof the electronic spectrum while the infrared laser frequency is scanned. The IR pulse arrives 200 ns earlier than the UV pulse. When the infrared frequency is in resonance with one of the vibrational transitions of the ion, part of the population is removed from the ground state, leading to a decrease in UV induced fragmentation (3).
Figure 2.2 Spectroscopic scheme of IR-UV double resonance spectroscopy.
As the IR laser is scanned we obtain a conformer-specific vibrational spectrum for a chosen ultraviolet transition. Repeating the same experiment on each major spectroscopic feature of the electronic spectrum permits assigning each UV spectral feature to a particular conformer.
Performing double resonance spectroscopy in the cold environment of our trap suppresses the thermal inhomogeneous broadening resulting from the large number of rotational and low-energy vibrational states that are populated at room temperature (4), and this increases the spectral resolution compared to room temperature measurements. The resulting spectra function as benchmarks for those calculated using quantum chemical techniques.
Our laboratory has successfully conducted several studies on peptides using this technique, being the first to measure cryogenic vibrational spectra of amino acids in the gas-phase, such as tryptophan, tyrosine and phenylalanine (4, 5). Moreover, the comparison between our vibrational spectra with theoretical calculations for larger peptide species has showed to provide unambiguous structural assignments (6-8).
2.3 Computational methods
Structural calculations on polyalanine peptides were performed by Markus Schneider under the supervision of Dr. Carsten Baldauf from the Theory Department of the Fritz Haber Institute in Berlin with whom we collaborated. For the structural determination of metalated and non-metalated peptides they used a conformational search algorithm similar to the one used by Rossi et al (9). First they perform a global conformational search by using both CHARMM22 (10) and OPLS-AA (11, 12) force fields (FF). To this end, they employed the TINKER molecular modeling package (13, 14). They calculated the single-point energy at the PBE+vdW level of DFT using tier1 basis sets and light settings for all the conformers generated by the force field. These calculations were performed using the package FHI-aims (15-17). Both for CHARMM22 and OPLS-AA they selected the 500 lowest energy conformers.
They used DFT with tier1 basis set and light settings to geometrically optimize the selected conformers at the PBE+vdW level. They then clustered the resulting conformers in order to avoid duplicates, and performed a second geometrical relaxation using tight settings and tier2 basis sets. A second clustering process followed, and all the conformers within 6 kcal/mol from the global minimum were selected. Schneider then locally refined the structures at the PBE0+MBD level, and retained only the conformers within 3 kcal/mol of the global minimum.
References
1. A. Svendsen, U. J. Lorenz, O. V. Boyarkin, T. R. Rizzo, A new tandem massspectrometer for photofragment spectroscopy of cold, gas-phase molecularions. Review of Scientific Instruments 81, (2010).
2. O. V. Boyarkin, V. Kopysov, Cryogenically cooled octupole ion trap forspectroscopy of biomolecular ions. Review of Scientific Instruments 85,(2014).
3. N. S. Nagornova, Rizzo, T. R., and Boyarkin, O. V., Exploring the mechanismof Ir-UV double-resonance for quantitative spectroscopy of protonatedpolypeptides and proteins. Angewante Chemie International Edition 52, 4(2011).
4. O. V. Boyarkin, S. R. Mercier, A. Kamariotis, T. R. Rizzo, Electronicspectroscopy of cold, protonated tryptophan and tyrosine. Journal of theAmerican Chemical Society 128, 2816-2817 (2006).
5. J. A. Stearns et al., Conformation-specific Spectroscopy and photodissociationof cold, protonated tyrosine and phenylalanine. Journal of the AmericanChemical Society 129, 11814-11820 (2007).
6. O. Aseev, M. A. S. Perez, U. Rothlisberger, T. R. Rizzo, CryogenicSpectroscopy and Quantum Molecular Dynamics Determine the Structure ofCyclic Intermediates Involved in Peptide Sequence Scrambling. Journal ofPhysical Chemistry Letters 6, 2524-2529 (2015).
7. M. Doemer et al., Assessing the performance of computational methods forthe prediction of the ground state structure of a cyclic decapeptide.International Journal of Quantum Chemistry 113, 808-814 (2013).
8. N. S. Nagornova et al., Cold-Ion Spectroscopy Reveals the Intrinsic Structureof a Decapeptide. Angewante Chemie International Edition 50, 5383-5386(2011).
9. M. Rossi, S. Chutia, M. Scheffler, V. Blum, Validation challenge of density-functional theory for peptides-example of Ac-Phe-Ala5-LysH(+). Journal ofPhysical Chemistry A 118, 7349-7359 (2014).
10. A. D. MacKerell et al., All-atom empirical potential for molecular modelingand dynamics studies of proteins. Journal of Physical Chemistry B 102, 3586-3616 (1998).
11. W. L. Jorgensen, D. S. Maxwell, J. TiradoRives, Development and testing ofthe OPLS all-atom force field on conformational energetics and properties oforganic liquids. Journal of the American Chemical Society 118, 11225-11236(1996).
12. G. A. Kaminski, R. A. Friesner, J. Tirado-Rives, W. L. Jorgensen, Evaluationand reparametrization of the OPLS-AA force field for proteins via comparisonwith accurate quantum chemical calculations on peptides. Journal of PhysicalChemistry B 105, 6474-6487 (2001).
13. J. W. Ponder, F. M. Richards, An efficient newton-like method for molecularmechanics energy monimization of large molecules. Journal of ComputationalChemistry. 8, 8 (1987).
14. J. W. Ponder. (Washington University School of Medicine, Saint Louis, MO,1987).
15. T. Auckenthaler et al., Parallel solution of partial symmetric eigenvalueproblems from electronic structure calculations. Parallel Computing 37, 783-794 (2011).
16. V. Blum et al., Ab initio molecular simulations with numeric atom-centeredorbitals. Computer Physics Communications 180, 2175-2196 (2009).
17. X. G. Ren et al., Resolution-of-identity approach to Hartree-Fock, hybriddensity functionals, RPA, MP2 and GW with numeric atom-centered orbitalbasis functions. New Journal of Physics 14, (2012).
3. Helical peptides in the gas phase
IR-UV double resonance spectroscopy is an exquisitely precise method used to characterize peptide structure. In this chapter, we present how this technique can be used to determine the structure of helical and non-helical peptides in the gas-phase. Moreover, we show how the interplay between quantum chemical calculations and experimental data provides a more accurate understanding of the peptide structure. In this section, we report the study of singly protonated peptides of sequence Ac-Phe-Alan-Lys (n=1-5, 10). The aim of this investigation is to understand how the structure of this class of peptides changes when one increases the number of alanines in the sequence.
Figure 3.1 shows the electronic spectra for Ac-Phe-Alan-Lys, with n = 1-5, 10. The spectra of singly protonated Ac-Phe-Ala-Lys were previously measured and published by Zabuga et al. (1, 2), while spectra of Ac-Phe-Ala5-Lys and Ac-Phe-Ala10-Lys by Stearns et al. (3, 4). The electronic spectra reported in Figure 3.1 were obtained by counting the number of UV-induced photofragments monitoring the phenylalanine side-chain loss channel as a function of the laser wavelength. Despite the increase in the number of amino acids in the sequence from 3 to 12, all the electronic spectra look sharp and rather simple. We find no evidence of spectral congestion given by Frank-Condon progressions or wide conformational heterogeneity that might be expected for peptides of this length. By comparing the electronic signatures of Ac-Phe-Alan-Lys with that of singly charged phenylalanine (5) we obtain initial hints about the geometry of our peptides: 1) the lowest UVtransitions for Ac-Phe-Alan-Lys-H+ are close to the band origin of protonatedphenylalanine - located at 37520 cm-1 (5) - and this indicates that the chromophoredoes not strongly interact with the polar groups or the charge, independently from thepeptide length; 2) the lowest energy transitions for the n=1 and n=3 peptides arerespectively 60 and 76 cm-1 red-shifted compared to Phe-H+ band origin. In the firstcase this suggests that the chromophore may partially interact with the charge locatedat the C-terminus due to the limited peptide size. When n=3 the relative orientation ofthe side chain of phenylalanine and lysine may instead favor this effect.
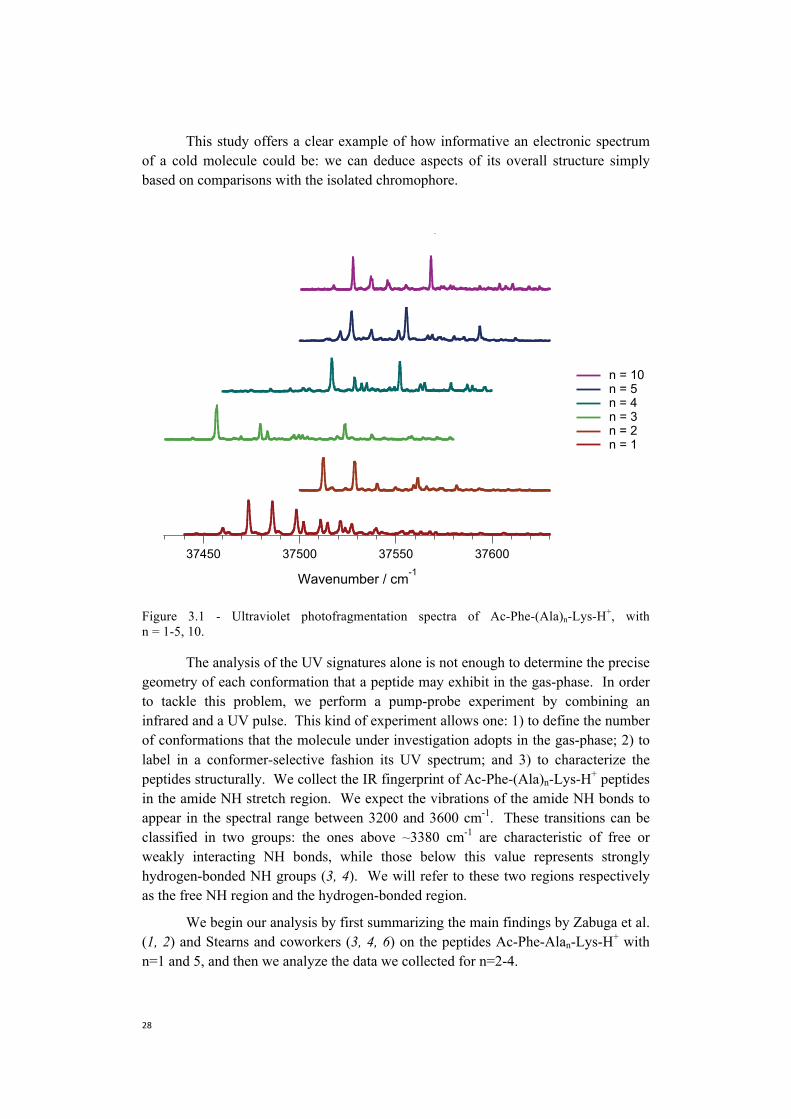
This study offers a clear example of how informative an electronic spectrum of a cold molecule could be: we can deduce aspects of its overall structure simply based on comparisons with the isolated chromophore.
Figure 3.1 - Ultraviolet photofragmentation spectra of Ac-Phe-(Ala)n-Lys-H+, with n = 1-5, 10.
The analysis of the UV signatures alone is not enough to determine the precise geometry of each conformation that a peptide may exhibit in the gas-phase. In order to tackle this problem, we perform a pump-probe experiment by combining an infrared and a UV pulse. This kind of experiment allows one: 1) to define the number of conformations that the molecule under investigation adopts in the gas-phase; 2) to label in a conformer-selective fashion its UV spectrum; and 3) to characterize the peptides structurally. We collect the IR fingerprint of Ac-Phe-(Ala)n-Lys-H+ peptides in the amide NH stretch region. We expect the vibrations of the amide NH bonds to appear in the spectral range between 3200 and 3600 cm-1. These transitions can be classified in two groups: the ones above ~3380 cm-1 are characteristic of free or weakly interacting NH bonds, while those below this value represents strongly hydrogen-bonded NH groups (3, 4). We will refer to these two regions respectively as the free NH region and the hydrogen-bonded region.
We begin our analysis by first summarizing the main findings by Zabuga et al. (1, 2) and Stearns and coworkers (3, 4, 6) on the peptides Ac-Phe-Alan-Lys-H+ with n=1 and 5, and then we analyze the data we collected for n=2-4.
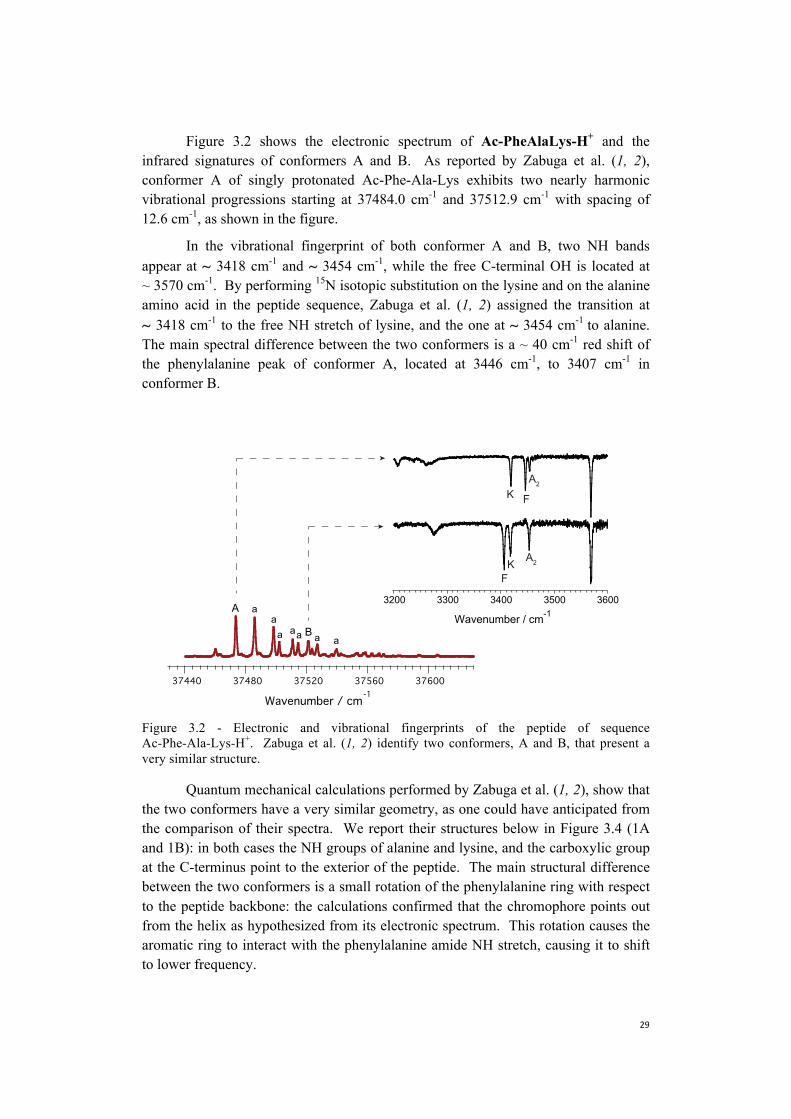
Figure 3.2 shows the electronic spectrum of Ac-PheAlaLys-H+ and the infrared signatures of conformers A and B. As reported by Zabuga et al. (1, 2), conformer A of singly protonated Ac-Phe-Ala-Lys exhibits two nearly harmonic vibrational progressions starting at 37484.0 cm-1 and 37512.9 cm-1 with spacing of 12.6 cm-1, as shown in the figure.
In the vibrational fingerprint of both conformer A and B, two NH bands appear at ~ 3418 cm-1 and ~ 3454 cm-1, while the free C-terminal OH is located at ~ 3570 cm-1. By performing 15N isotopic substitution on the lysine and on the alanine amino acid in the peptide sequence, Zabuga et al. (1, 2) assigned the transition at ~ 3418 cm-1 to the free NH stretch of lysine, and the one at ~ 3454 cm-1 to alanine. The main spectral difference between the two conformers is a ~ 40 cm-1 red shift of the phenylalanine peak of conformer A, located at 3446 cm-1, to 3407 cm-1 in conformer B.
Figure 3.2 - Electronic and vibrational fingerprints of the peptide of sequence Ac-Phe-Ala-Lys-H+. Zabuga et al. (1, 2) identify two conformers, A and B, that present a very similar structure.
Quantum mechanical calculations performed by Zabuga et al. (1, 2), show that the two conformers have a very similar geometry, as one could have anticipated from the comparison of their spectra. We report their structures below in Figure 3.4 (1A and 1B): in both cases the NH groups of alanine and lysine, and the carboxylic group at the C-terminus point to the exterior of the peptide. The main structural difference between the two conformers is a small rotation of the phenylalanine ring with respect to the peptide backbone: the calculations confirmed that the chromophore points out from the helix as hypothesized from its electronic spectrum. This rotation causes the aromatic ring to interact with the phenylalanine amide NH stretch, causing it to shift to lower frequency.
3760037560375203748037440
Wavenumber / cm-1
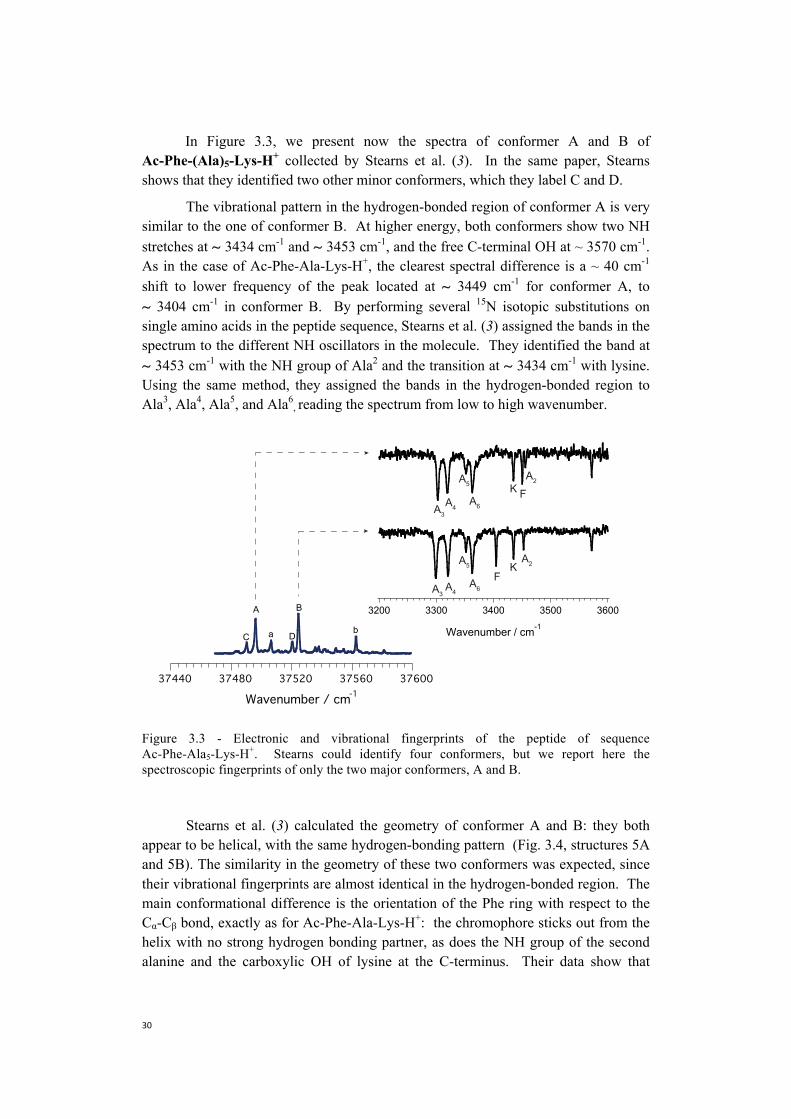
In Figure 3.3, we present now the spectra of conformer A and B of Ac-Phe-(Ala)5-Lys-H+ collected by Stearns et al. (3). In the same paper, Stearns shows that they identified two other minor conformers, which they label C and D.
The vibrational pattern in the hydrogen-bonded region of conformer A is very similar to the one of conformer B. At higher energy, both conformers show two NH stretches at ~ 3434 cm-1 and ~ 3453 cm-1, and the free C-terminal OH at ~ 3570 cm-1. As in the case of Ac-Phe-Ala-Lys-H+, the clearest spectral difference is a ~ 40 cm-1
shift to lower frequency of the peak located at ~ 3449 cm-1 for conformer A, to ~ 3404 cm-1 in conformer B. By performing several 15N isotopic substitutions on single amino acids in the peptide sequence, Stearns et al. (3) assigned the bands in the spectrum to the different NH oscillators in the molecule. They identified the band at ~ 3453 cm-1 with the NH group of Ala2 and the transition at ~ 3434 cm-1 with lysine. Using the same method, they assigned the bands in the hydrogen-bonded region to Ala3, Ala4, Ala5, and Ala6
, reading the spectrum from low to high wavenumber.
Figure 3.3 - Electronic and vibrational fingerprints of the peptide of sequence Ac-Phe-Ala5-Lys-H+. Stearns could identify four conformers, but we report here the spectroscopic fingerprints of only the two major conformers, A and B.
Stearns et al. (3) calculated the geometry of conformer A and B: they both appear to be helical, with the same hydrogen-bonding pattern (Fig. 3.4, structures 5A and 5B). The similarity in the geometry of these two conformers was expected, since their vibrational fingerprints are almost identical in the hydrogen-bonded region. The main conformational difference is the orientation of the Phe ring with respect to the Cα-Cβ bond, exactly as for Ac-Phe-Ala-Lys-H+: the chromophore sticks out from the helix with no strong hydrogen bonding partner, as does the NH group of the second alanine and the carboxylic OH of lysine at the C-terminus. Their data show that
3760037560375203748037440Wavenumber / cm-1
contrary to the predictions of Jarrold and coworkers (7), one can form a helix in peptides with a few as 9 amino acid residues.
The procedure employed by Zabuga and Stearns to obtain Ac-Phe-Ala-Lys-H+
and Ac-Phe-Ala5-Lys-H+ geometries used 15N isotopic substitution to assign the peaks and permit comparison with theoretical calculations. Although this is expensive and time consuming, it has been proven to be fundamental (3, 8, 9) to achieve structural assignment when no information on the peptide structure is available in literature.
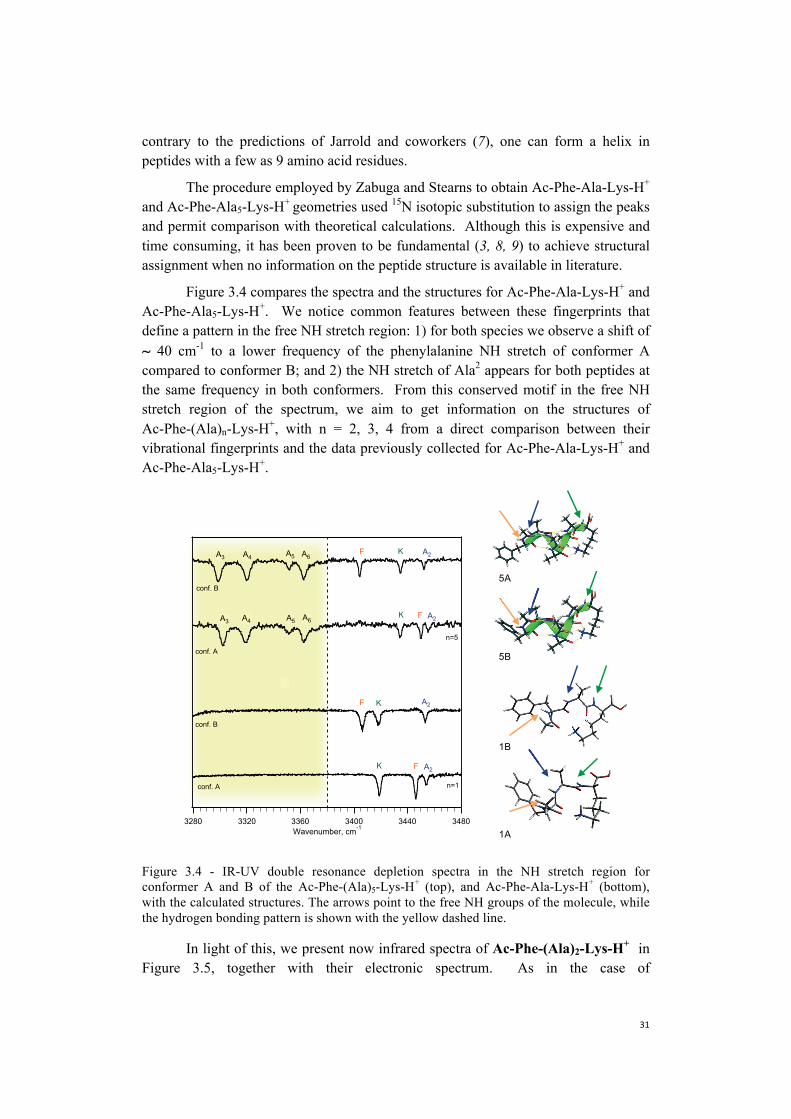
Figure 3.4 compares the spectra and the structures for Ac-Phe-Ala-Lys-H+ and Ac-Phe-Ala5-Lys-H+. We notice common features between these fingerprints that define a pattern in the free NH stretch region: 1) for both species we observe a shift of ~ 40 cm-1 to a lower frequency of the phenylalanine NH stretch of conformer A compared to conformer B; and 2) the NH stretch of Ala2 appears for both peptides at the same frequency in both conformers. From this conserved motif in the free NH stretch region of the spectrum, we aim to get information on the structures of Ac-Phe-(Ala)n-Lys-H+, with n = 2, 3, 4 from a direct comparison between their vibrational fingerprints and the data previously collected for Ac-Phe-Ala-Lys-H+ and Ac-Phe-Ala5-Lys-H+.
Figure 3.4 - IR-UV double resonance depletion spectra in the NH stretch region for conformer A and B of the Ac-Phe-(Ala)5-Lys-H+ (top), and Ac-Phe-Ala-Lys-H+ (bottom), with the calculated structures. The arrows point to the free NH groups of the molecule, while the hydrogen bonding pattern is shown with the yellow dashed line.
In light of this, we present now infrared spectra of Ac-Phe-(Ala)2-Lys-H+ in Figure 3.5, together with their electronic spectrum. As in the case of
348034403400336033203280Wavenumber, cm-1
K
K
K
F
F
F
A2
A2
A2
A3
A3 A4 A5 A6
n=1
n=5
A2F KA6A5A4A3
conf. A
conf. A
conf. B
conf. B
5A
5B
1B
1A
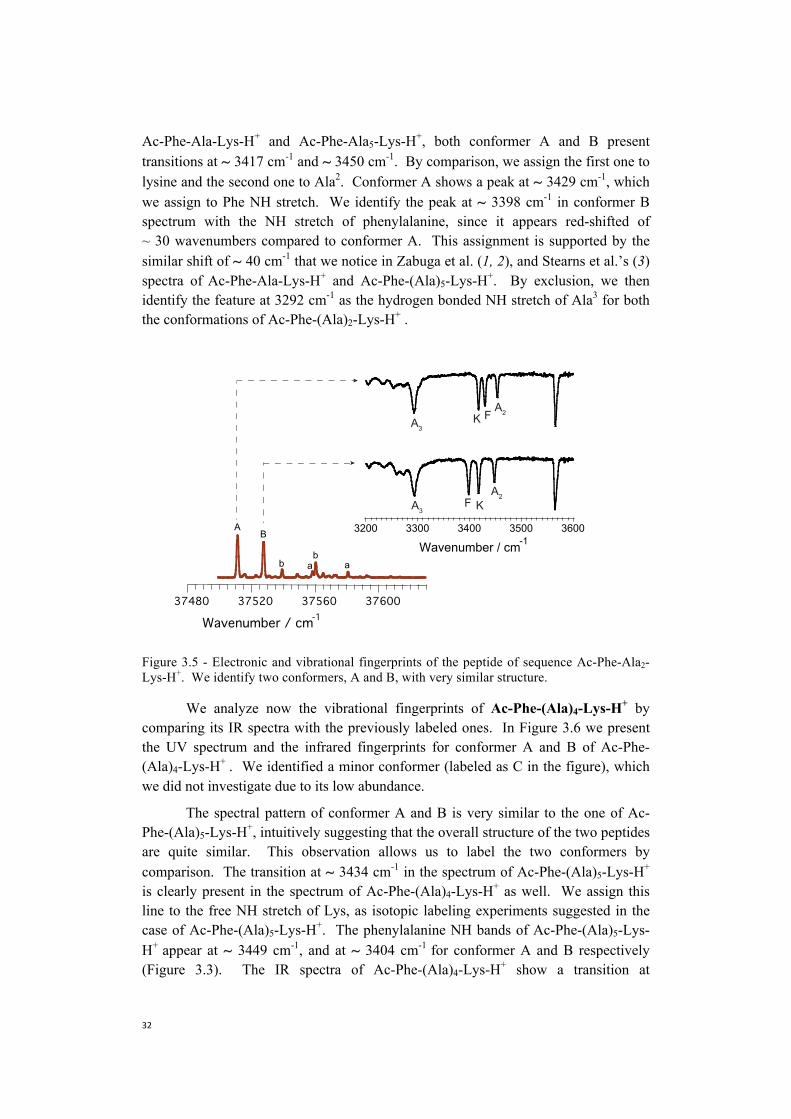
Ac-Phe-Ala-Lys-H+ and Ac-Phe-Ala5-Lys-H+, both conformer A and B present transitions at ~ 3417 cm-1 and ~ 3450 cm-1. By comparison, we assign the first one to lysine and the second one to Ala2. Conformer A shows a peak at ~ 3429 cm-1, which we assign to Phe NH stretch. We identify the peak at ~ 3398 cm-1 in conformer B spectrum with the NH stretch of phenylalanine, since it appears red-shifted of ~ 30 wavenumbers compared to conformer A. This assignment is supported by the similar shift of ~ 40 cm-1 that we notice in Zabuga et al. (1, 2), and Stearns et al.’s (3) spectra of Ac-Phe-Ala-Lys-H+ and Ac-Phe-(Ala)5-Lys-H+. By exclusion, we then identify the feature at 3292 cm-1 as the hydrogen bonded NH stretch of Ala3 for both the conformations of Ac-Phe-(Ala)2-Lys-H+ .
Figure 3.5 - Electronic and vibrational fingerprints of the peptide of sequence Ac-Phe-Ala2-Lys-H+. We identify two conformers, A and B, with very similar structure.
We analyze now the vibrational fingerprints of Ac-Phe-(Ala)4-Lys-H+ by comparing its IR spectra with the previously labeled ones. In Figure 3.6 we present the UV spectrum and the infrared fingerprints for conformer A and B of Ac-Phe-(Ala)4-Lys-H+ . We identified a minor conformer (labeled as C in the figure), which we did not investigate due to its low abundance.
The spectral pattern of conformer A and B is very similar to the one of Ac-Phe-(Ala)5-Lys-H+, intuitively suggesting that the overall structure of the two peptides are quite similar. This observation allows us to label the two conformers by comparison. The transition at ~ 3434 cm-1 in the spectrum of Ac-Phe-(Ala)5-Lys-H+ is clearly present in the spectrum of Ac-Phe-(Ala)4-Lys-H+ as well. We assign this line to the free NH stretch of Lys, as isotopic labeling experiments suggested in the case of Ac-Phe-(Ala)5-Lys-H+. The phenylalanine NH bands of Ac-Phe-(Ala)5-Lys-H+
appear at ~ 3449 cm-1, and at ~ 3404 cm-1 for conformer A and B respectively (Figure 3.3). The IR spectra of Ac-Phe-(Ala)4-Lys-H+ show a transition at
37600375603752037480Wavenumber / cm-1
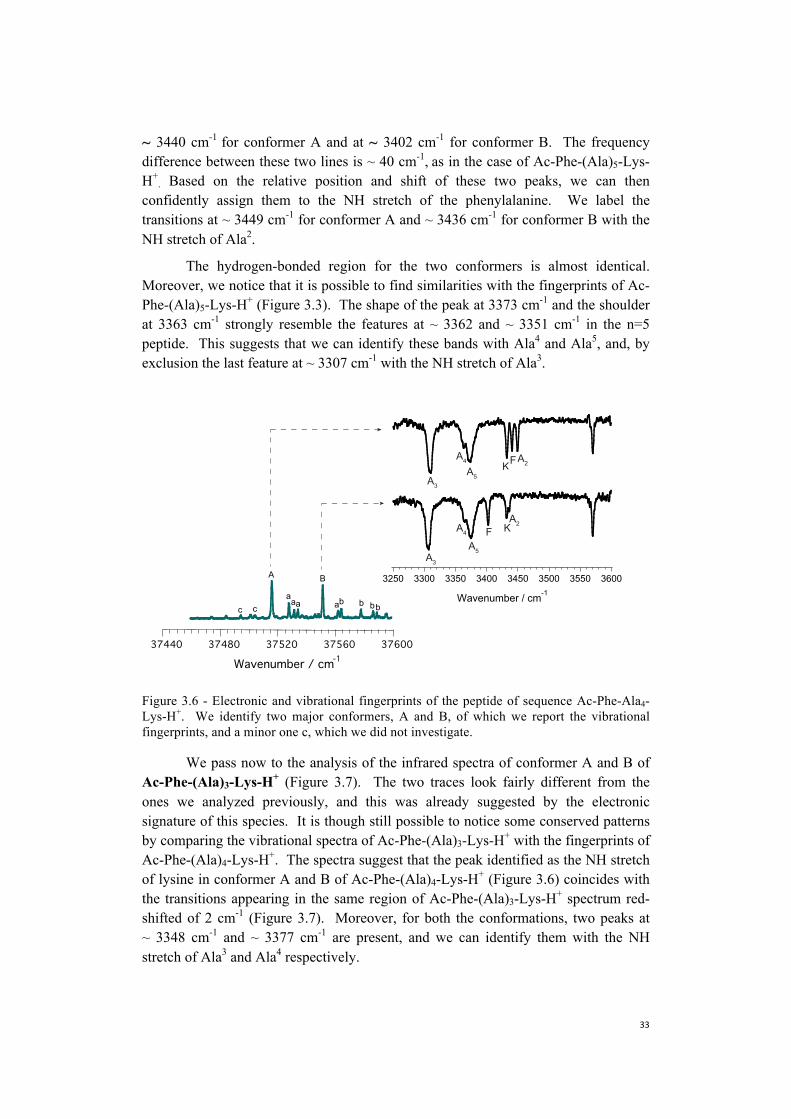
~ 3440 cm-1 for conformer A and at ~ 3402 cm-1 for conformer B. The frequency difference between these two lines is ~ 40 cm-1, as in the case of Ac-Phe-(Ala)5-Lys-H+
. Based on the relative position and shift of these two peaks, we can then confidently assign them to the NH stretch of the phenylalanine. We label the transitions at ~ 3449 cm-1 for conformer A and ~ 3436 cm-1 for conformer B with the NH stretch of Ala2.
The hydrogen-bonded region for the two conformers is almost identical. Moreover, we notice that it is possible to find similarities with the fingerprints of Ac-Phe-(Ala)5-Lys-H+ (Figure 3.3). The shape of the peak at 3373 cm-1 and the shoulder at 3363 cm-1 strongly resemble the features at ~ 3362 and ~ 3351 cm-1 in the n=5 peptide. This suggests that we can identify these bands with Ala4 and Ala5, and, by exclusion the last feature at ~ 3307 cm-1 with the NH stretch of Ala3.
Figure 3.6 - Electronic and vibrational fingerprints of the peptide of sequence Ac-Phe-Ala4-Lys-H+. We identify two major conformers, A and B, of which we report the vibrational fingerprints, and a minor one c, which we did not investigate.
We pass now to the analysis of the infrared spectra of conformer A and B of Ac-Phe-(Ala)3-Lys-H+ (Figure 3.7). The two traces look fairly different from the ones we analyzed previously, and this was already suggested by the electronic signature of this species. It is though still possible to notice some conserved patterns by comparing the vibrational spectra of Ac-Phe-(Ala)3-Lys-H+ with the fingerprints of Ac-Phe-(Ala)4-Lys-H+. The spectra suggest that the peak identified as the NH stretch of lysine in conformer A and B of Ac-Phe-(Ala)4-Lys-H+ (Figure 3.6) coincides with the transitions appearing in the same region of Ac-Phe-(Ala)3-Lys-H+ spectrum red-shifted of 2 cm-1 (Figure 3.7). Moreover, for both the conformations, two peaks at ~ 3348 cm-1 and ~ 3377 cm-1 are present, and we can identify them with the NH stretch of Ala3 and Ala4 respectively.
3760037560375203748037440Wavenumber / cm-1
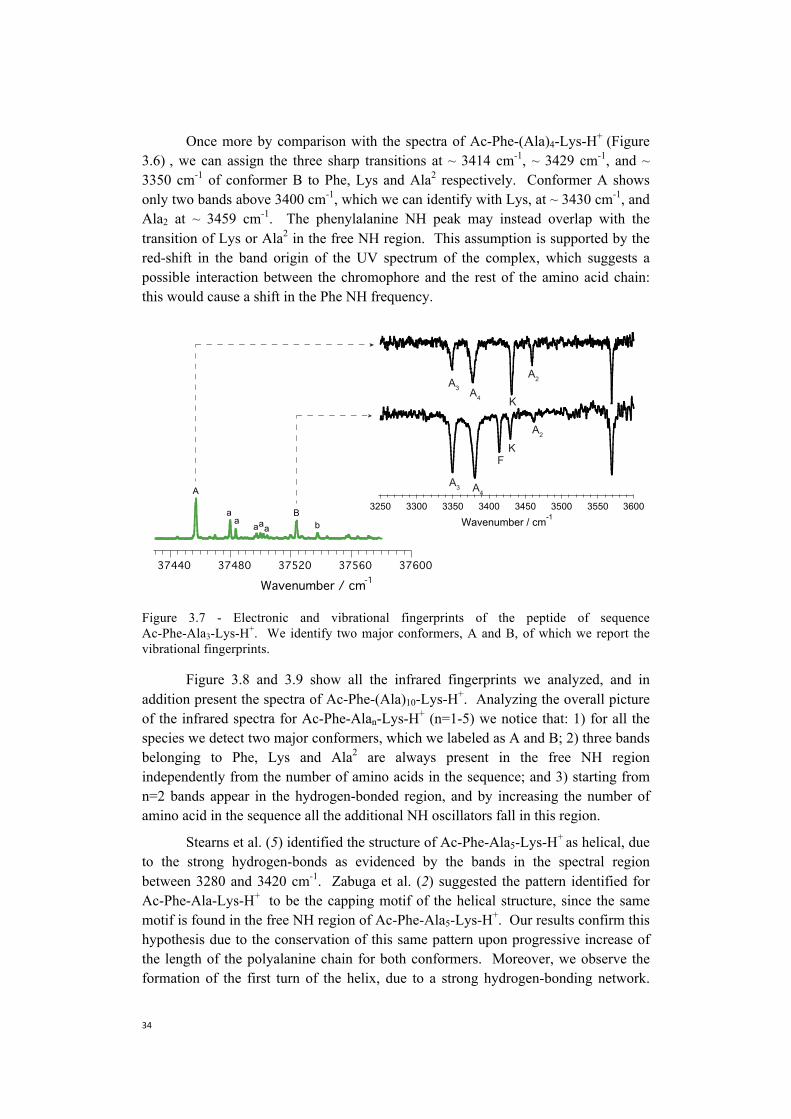
Once more by comparison with the spectra of Ac-Phe-(Ala)4-Lys-H+ (Figure 3.6) , we can assign the three sharp transitions at ~ 3414 cm-1, ~ 3429 cm-1, and ~ 3350 cm-1 of conformer B to Phe, Lys and Ala2 respectively. Conformer A shows only two bands above 3400 cm-1, which we can identify with Lys, at ~ 3430 cm-1, and Ala2 at ~ 3459 cm-1. The phenylalanine NH peak may instead overlap with the transition of Lys or Ala2 in the free NH region. This assumption is supported by the red-shift in the band origin of the UV spectrum of the complex, which suggests a possible interaction between the chromophore and the rest of the amino acid chain: this would cause a shift in the Phe NH frequency.
Figure 3.7 - Electronic and vibrational fingerprints of the peptide of sequence Ac-Phe-Ala3-Lys-H+. We identify two major conformers, A and B, of which we report the vibrational fingerprints.
Figure 3.8 and 3.9 show all the infrared fingerprints we analyzed, and in addition present the spectra of Ac-Phe-(Ala)10-Lys-H+. Analyzing the overall picture of the infrared spectra for Ac-Phe-Alan-Lys-H+ (n=1-5) we notice that: 1) for all the species we detect two major conformers, which we labeled as A and B; 2) three bands belonging to Phe, Lys and Ala2 are always present in the free NH region independently from the number of amino acids in the sequence; and 3) starting from n=2 bands appear in the hydrogen-bonded region, and by increasing the number of amino acid in the sequence all the additional NH oscillators fall in this region.
Stearns et al. (5) identified the structure of Ac-Phe-Ala5-Lys-H+ as helical, due
to the strong hydrogen-bonds as evidenced by the bands in the spectral region between 3280 and 3420 cm-1. Zabuga et al. (2) suggested the pattern identified for Ac-Phe-Ala-Lys-H+ to be the capping motif of the helical structure, since the same motif is found in the free NH region of Ac-Phe-Ala5-Lys-H+. Our results confirm this hypothesis due to the conservation of this same pattern upon progressive increase of the length of the polyalanine chain for both conformers. Moreover, we observe the formation of the first turn of the helix, due to a strong hydrogen-bonding network.
Wavenumber / cm-13760037560375203748037440
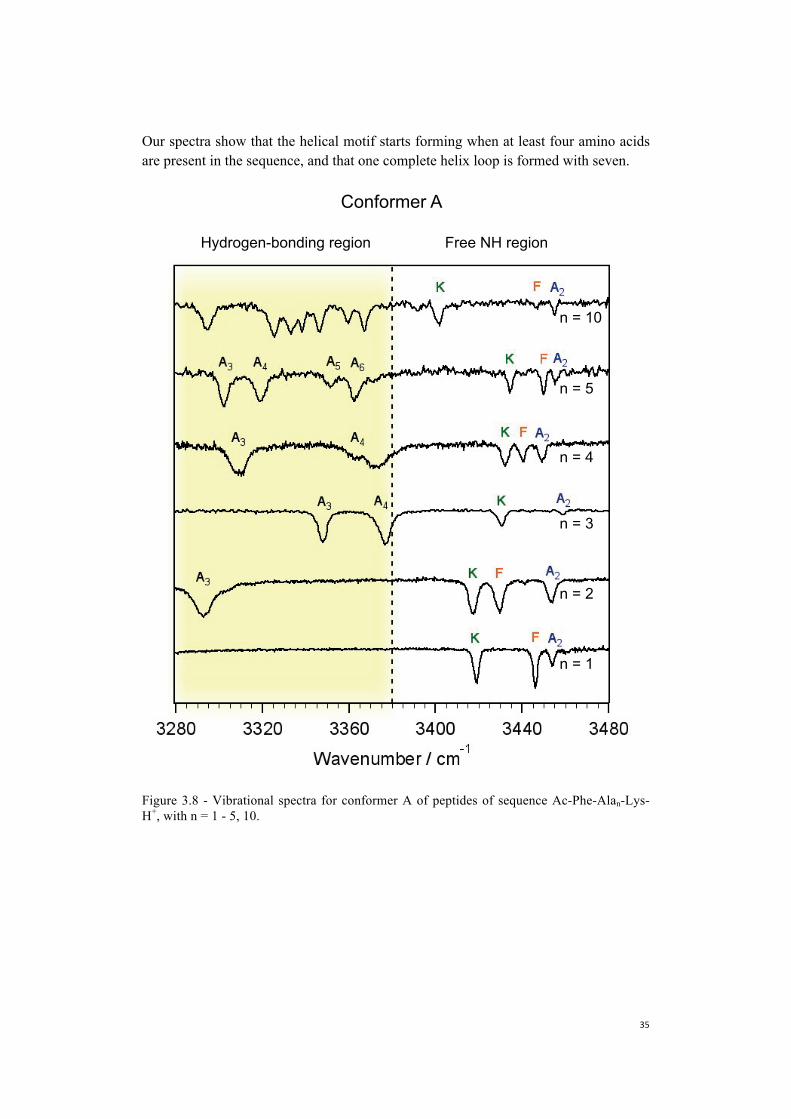
Our spectra show that the helical motif starts forming when at least four amino acids are present in the sequence, and that one complete helix loop is formed with seven.
Figure 3.8 - Vibrational spectra for conformer A of peptides of sequence Ac-Phe-Alan-Lys-H+, with n = 1 - 5, 10.
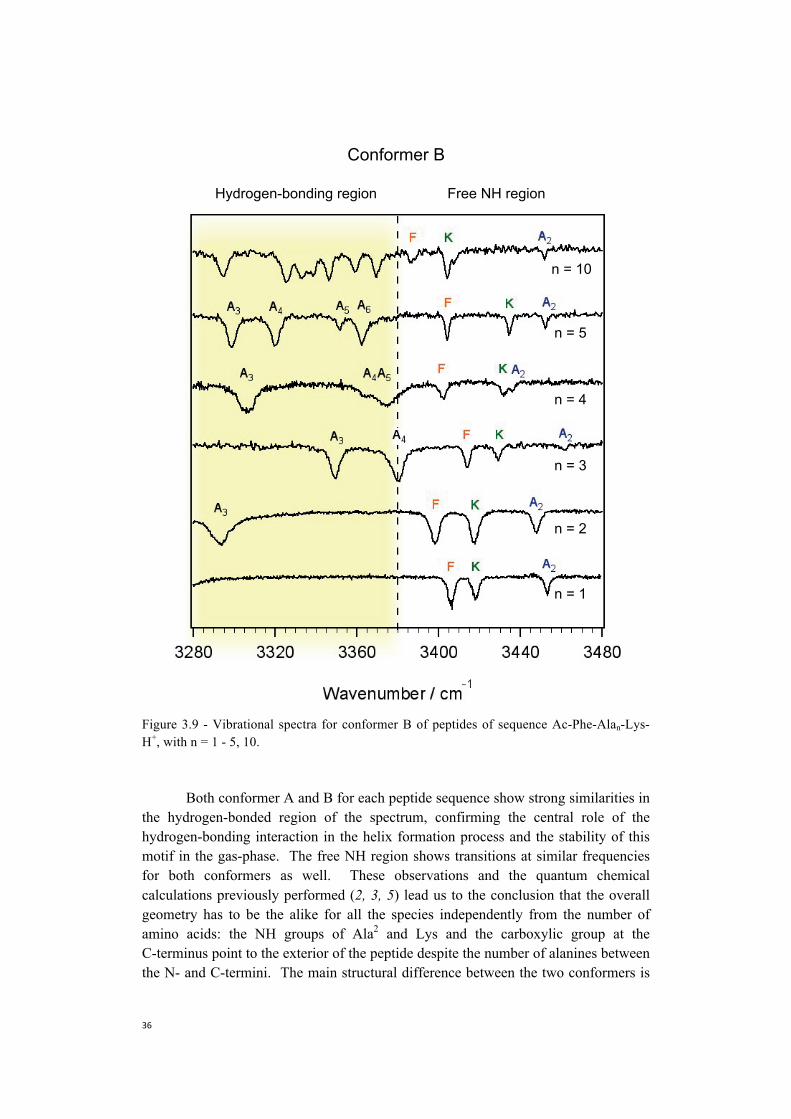
Figure 3.9 - Vibrational spectra for conformer B of peptides of sequence Ac-Phe-Alan-Lys-H+, with n = 1 - 5, 10.
Both conformer A and B for each peptide sequence show strong similarities in the hydrogen-bonded region of the spectrum, confirming the central role of the hydrogen-bonding interaction in the helix formation process and the stability of this motif in the gas-phase. The free NH region shows transitions at similar frequencies for both conformers as well. These observations and the quantum chemical calculations previously performed (2, 3, 5) lead us to the conclusion that the overall geometry has to be the alike for all the species independently from the number of amino acids: the NH groups of Ala2 and Lys and the carboxylic group at the C-terminus point to the exterior of the peptide despite the number of alanines betweenthe N- and C-termini. The main structural difference between the two conformers is
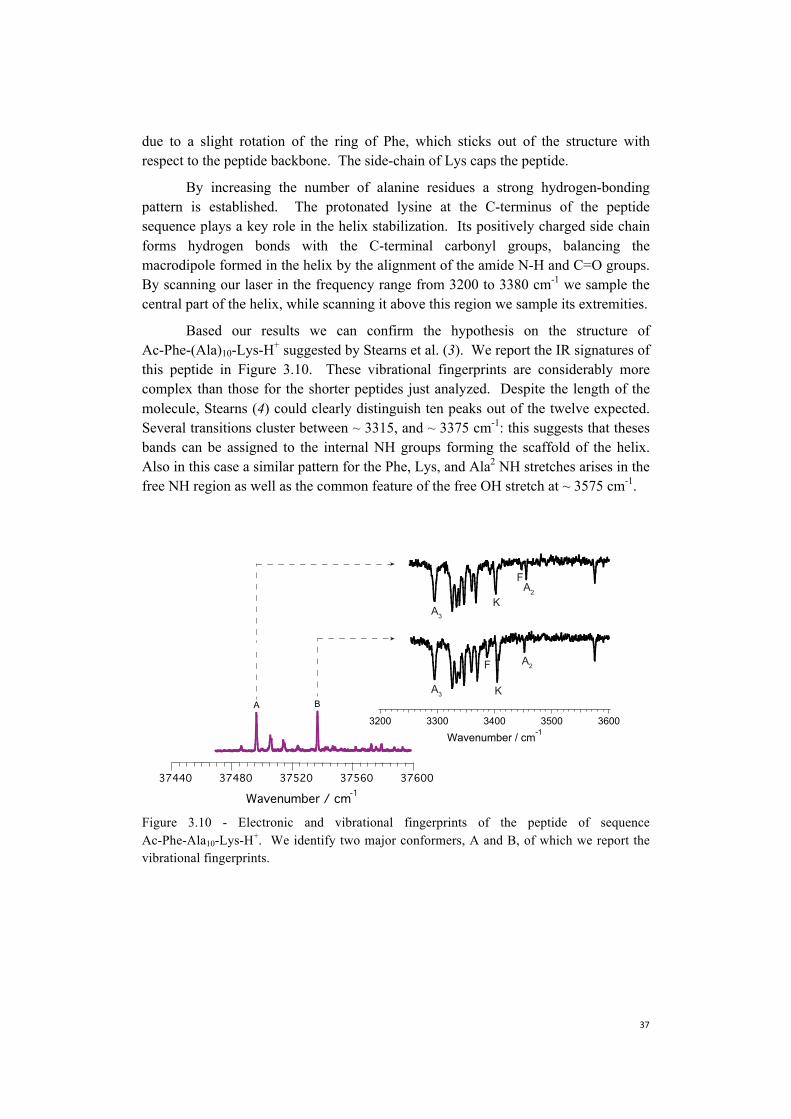
due to a slight rotation of the ring of Phe, which sticks out of the structure with respect to the peptide backbone. The side-chain of Lys caps the peptide.
By increasing the number of alanine residues a strong hydrogen-bonding pattern is established. The protonated lysine at the C-terminus of the peptide sequence plays a key role in the helix stabilization. Its positively charged side chain forms hydrogen bonds with the C-terminal carbonyl groups, balancing the macrodipole formed in the helix by the alignment of the amide N-H and C=O groups. By scanning our laser in the frequency range from 3200 to 3380 cm-1 we sample the central part of the helix, while scanning it above this region we sample its extremities.
Based our results we can confirm the hypothesis on the structure of Ac-Phe-(Ala)10-Lys-H+ suggested by Stearns et al. (3). We report the IR signatures of this peptide in Figure 3.10. These vibrational fingerprints are considerably more complex than those for the shorter peptides just analyzed. Despite the length of the molecule, Stearns (4) could clearly distinguish ten peaks out of the twelve expected. Several transitions cluster between ~ 3315, and ~ 3375 cm-1: this suggests that theses bands can be assigned to the internal NH groups forming the scaffold of the helix. Also in this case a similar pattern for the Phe, Lys, and Ala2 NH stretches arises in the free NH region as well as the common feature of the free OH stretch at ~ 3575 cm-1.
Figure 3.10 - Electronic and vibrational fingerprints of the peptide of sequence Ac-Phe-Ala10-Lys-H+. We identify two major conformers, A and B, of which we report the vibrational fingerprints.
3760037560375203748037440Wavenumber / cm-1
Take-home message
• By using IR-UV we identify two major conformers for the peptides ofsequence Ac-Phe-(Ala)n-Lys-H+ with n = 1-5, 10, and we collect theirconformer-selective vibrational spectra.
• Peptides of sequence Ac-Phe-(Ala)n-Lys-H+ with n = 1-5, 10 present a helicalconformation where the only structural difference between the two conformersis the orientation of the phenylalanine ring to the peptide backbone.
• In the vibrational spectra one can identify two patterns: 1) the capping motifof the helix that is formed in presence of at least 3 amino acids. It appears inthe free NH stretch region, and is conserved upon increasing of the number ofalanine residues in the peptide sequence; 2) the hydrogen-bonding networkthat starts forming in presence of a minimum of 4 amino acids. It appears inthe strongly hydrogen-bonding region of the spectrum and is responsible forthe helix stability.
References
1. A. V. Zabuga, M. Z. Kamrath, T. R. Rizzo, Franck-Condon-like Progressionsin Infrared Spectra of Biological Molecules. Journal of Physical Chemistry A119, 10494-10501 (2015).
2. A. V. Zabuga, T. R. Rizzo, Capping Motif for Peptide Helix Formation.Journal of Physical Chemistry Letters 6, 1504-1508 (2015).
3. J. A. Stearns, C. Seaiby, O. V. Boyarkin, T. R. Rizzo, Spectroscopy andconformational preferences of gas-phase helices. Physical ChemistryChemical Physics 11, 125-132 (2009).
4. J. A. Stearns, O. V. Boyarkin, T. R. Rizzo, Spectroscopic signatures of gas-phase helices: Ac-Phe-(Ala)(5)-Lys-H+ and Ac-Phe-(Ala)(10)-Lys-H+.Journal of the American Chemical Society 129, 13820-+ (2007).
5. J. A. Stearns et al., Conformation-specific Spectroscopy and photodissociationof cold, protonated tyrosine and phenylalanine. Journal of the AmericanChemical Society 129, 11814-11820 (2007).
6. J. A. Stearns, O. V. Boyarkin, T. R. Rizzo, Effects of N-terminus substitutionon the structure and spectroscopy of gas-phase helices. Chimia 62, 240-243(2008).
7. R. R. Hudgins, M. F. Jarrold, Helix formation in unsolvated alanine-basedpeptides: Helical monomers and helical dimers. Journal of the AmericanChemical Society 121, 3494-3501 (1999).
8. O. Aseev, M. A. S. Perez, U. Rothlisberger, T. R. Rizzo, CryogenicSpectroscopy and Quantum Molecular Dynamics Determine the Structure ofCyclic Intermediates Involved in Peptide Sequence Scrambling. Journal ofPhysical Chemistry Letters 6, 2524-2529 (2015).
9. L. Voronina et al., Conformations of Prolyl-Peptide Bonds in the Bradykinin1-5 Fragment in Solution and in the Gas Phase. Journal of the AmericanChemical Society 138, 9224-9233 (2016).

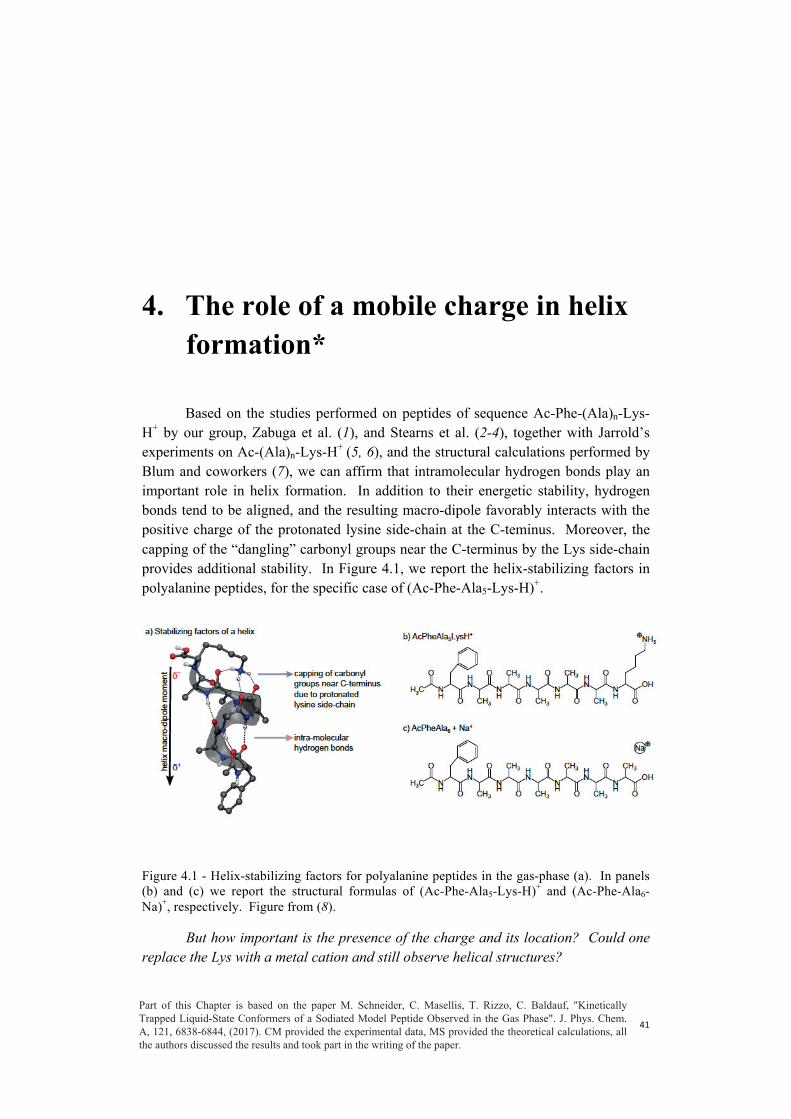
4. The role of a mobile charge in helixformation*
Based on the studies performed on peptides of sequence Ac-Phe-(Ala)n-Lys-H+ by our group, Zabuga et al. (1), and Stearns et al. (2-4), together with Jarrold’s experiments on Ac-(Ala)n-Lys-H+ (5, 6), and the structural calculations performed by Blum and coworkers (7), we can affirm that intramolecular hydrogen bonds play an important role in helix formation. In addition to their energetic stability, hydrogen bonds tend to be aligned, and the resulting macro-dipole favorably interacts with the positive charge of the protonated lysine side-chain at the C-teminus. Moreover, the capping of the “dangling” carbonyl groups near the C-terminus by the Lys side-chain provides additional stability. In Figure 4.1, we report the helix-stabilizing factors in polyalanine peptides, for the specific case of (Ac-Phe-Ala5-Lys-H)+.
Figure 4.1 - Helix-stabilizing factors for polyalanine peptides in the gas-phase (a). In panels (b) and (c) we report the structural formulas of (Ac-Phe-Ala5-Lys-H)+ and (Ac-Phe-Ala6-Na)+, respectively. Figure from (8).
But how important is the presence of the charge and its location? Could one replace the Lys with a metal cation and still observe helical structures?
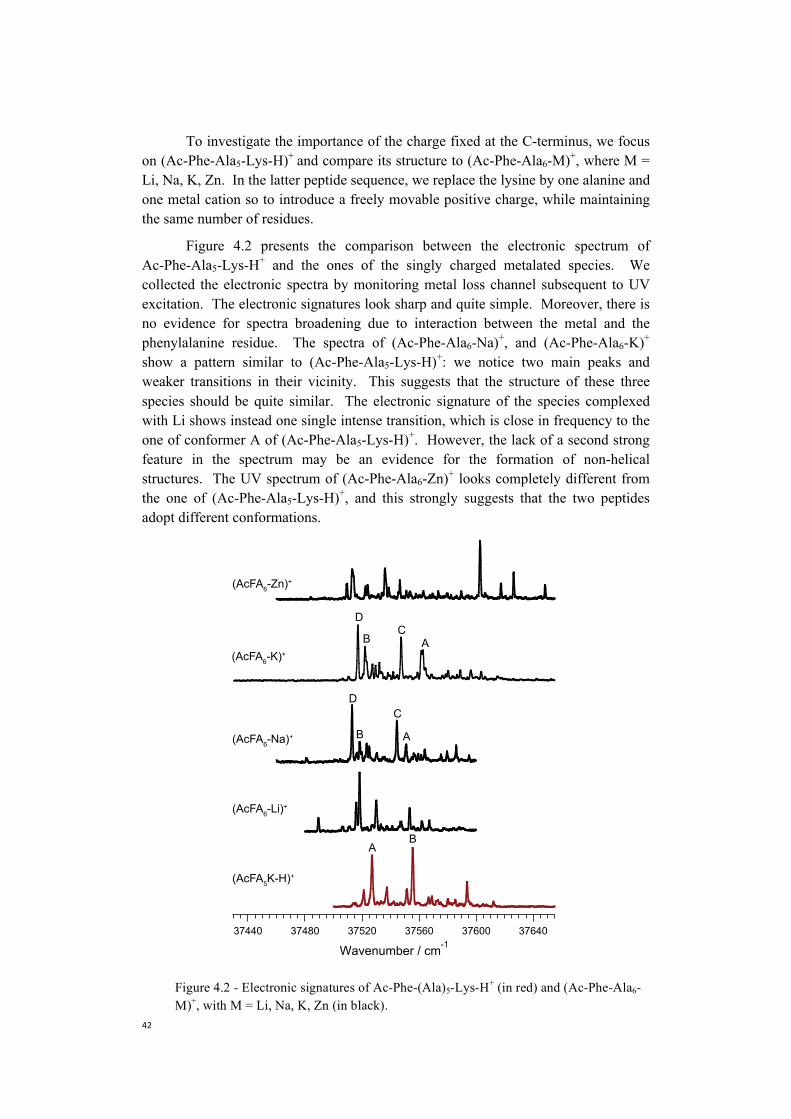
To investigate the importance of the charge fixed at the C-terminus, we focus on (Ac-Phe-Ala5-Lys-H)+ and compare its structure to (Ac-Phe-Ala6-M)+, where M = Li, Na, K, Zn. In the latter peptide sequence, we replace the lysine by one alanine and one metal cation so to introduce a freely movable positive charge, while maintaining the same number of residues.
Figure 4.2 presents the comparison between the electronic spectrum of Ac-Phe-Ala5-Lys-H+ and the ones of the singly charged metalated species. We collected the electronic spectra by monitoring metal loss channel subsequent to UV excitation. The electronic signatures look sharp and quite simple. Moreover, there is no evidence for spectra broadening due to interaction between the metal and the phenylalanine residue. The spectra of (Ac-Phe-Ala6-Na)+, and (Ac-Phe-Ala6-K)+
show a pattern similar to (Ac-Phe-Ala5-Lys-H)+: we notice two main peaks and weaker transitions in their vicinity. This suggests that the structure of these three species should be quite similar. The electronic signature of the species complexed with Li shows instead one single intense transition, which is close in frequency to the one of conformer A of (Ac-Phe-Ala5-Lys-H)+. However, the lack of a second strong feature in the spectrum may be an evidence for the formation of non-helical structures. The UV spectrum of (Ac-Phe-Ala6-Zn)+ looks completely different from the one of (Ac-Phe-Ala5-Lys-H)+, and this strongly suggests that the two peptides adopt different conformations.
Ion fr
agme
nts
Figure 4.2 - Electronic signatures of Ac-Phe-(Ala)5-Lys-H+ (in red) and (Ac-Phe-Ala6-M)+, with M = Li, Na, K, Zn (in black).
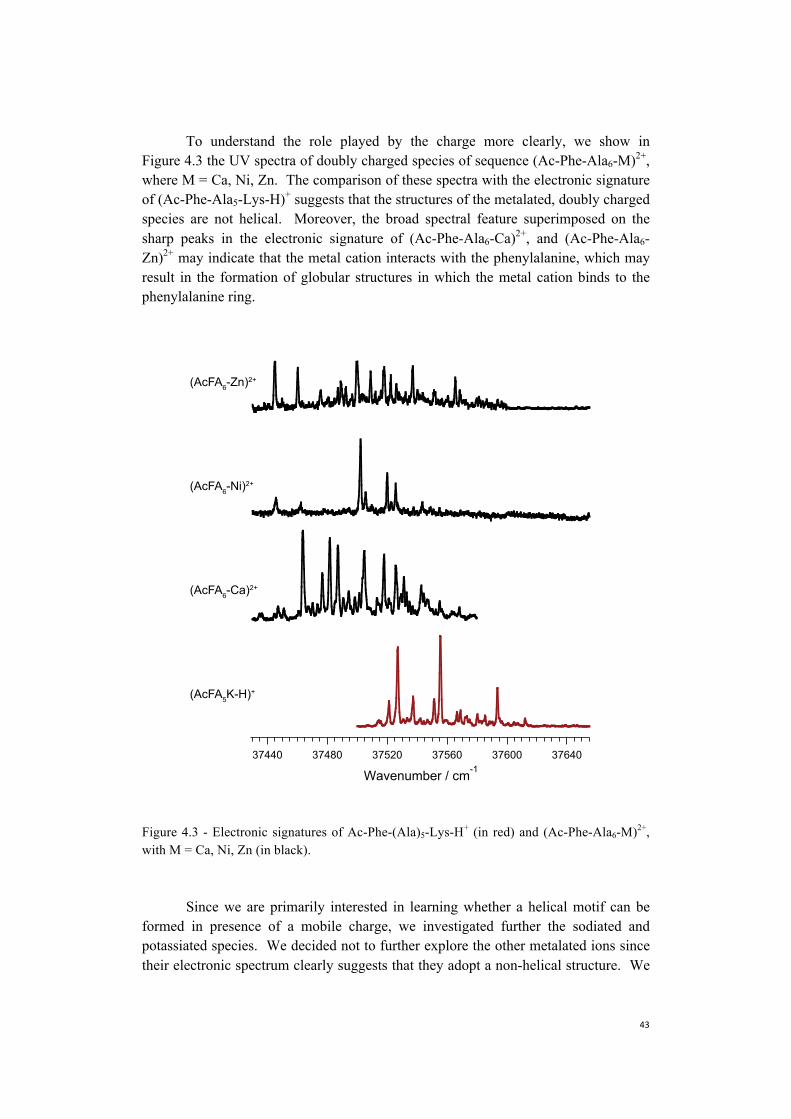
To understand the role played by the charge more clearly, we show in Figure 4.3 the UV spectra of doubly charged species of sequence (Ac-Phe-Ala6-M)2+, where M = Ca, Ni, Zn. The comparison of these spectra with the electronic signature of (Ac-Phe-Ala5-Lys-H)+ suggests that the structures of the metalated, doubly charged species are not helical. Moreover, the broad spectral feature superimposed on the sharp peaks in the electronic signature of (Ac-Phe-Ala6-Ca)2+, and (Ac-Phe-Ala6-Zn)2+ may indicate that the metal cation interacts with the phenylalanine, which may result in the formation of globular structures in which the metal cation binds to the phenylalanine ring.
Figure 4.3 - Electronic signatures of Ac-Phe-(Ala)5-Lys-H+ (in red) and (Ac-Phe-Ala6-M)2+, with M = Ca, Ni, Zn (in black).
Since we are primarily interested in learning whether a helical motif can be formed in presence of a mobile charge, we investigated further the sodiated and potassiated species. We decided not to further explore the other metalated ions since their electronic spectrum clearly suggests that they adopt a non-helical structure. We
Ion fr
agme
nts
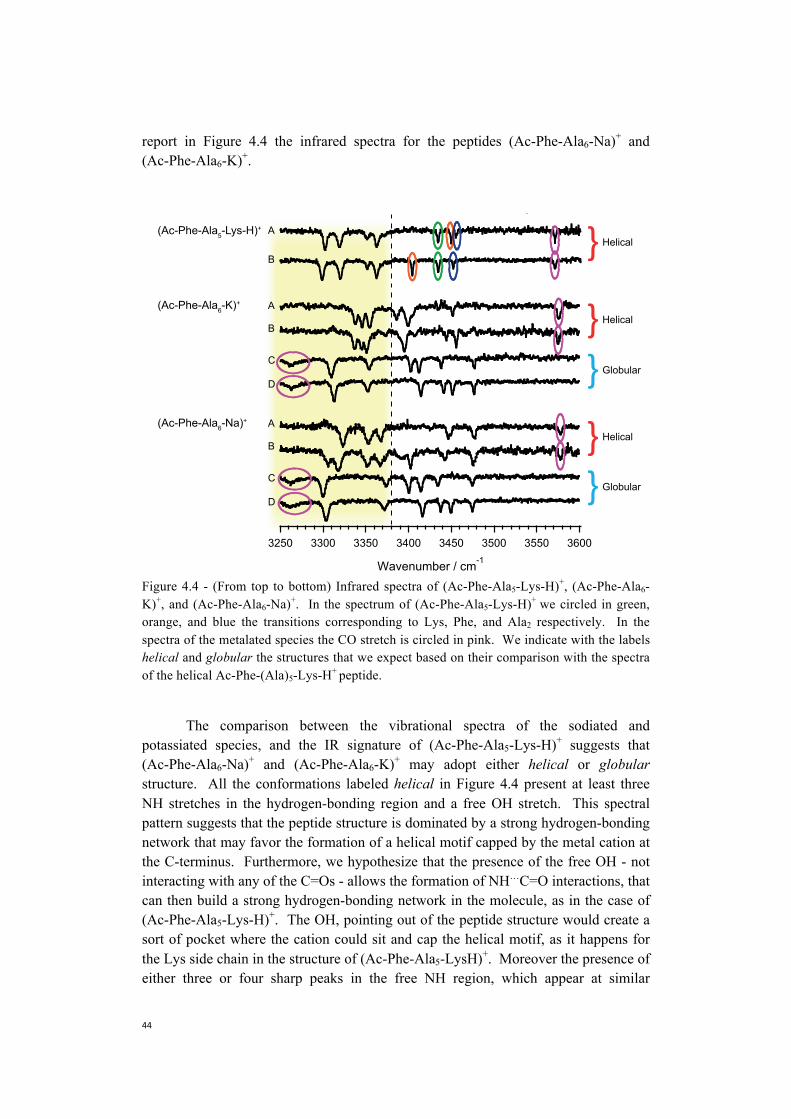
report in Figure 4.4 the infrared spectra for the peptides (Ac-Phe-Ala6-Na)+ and (Ac-Phe-Ala6-K)+.
Figure 4.4 - (From top to bottom) Infrared spectra of (Ac-Phe-Ala5-Lys-H)+, (Ac-Phe-Ala6-K)+, and (Ac-Phe-Ala6-Na)+. In the spectrum of (Ac-Phe-Ala5-Lys-H)+ we circled in green, orange, and blue the transitions corresponding to Lys, Phe, and Ala2 respectively. In the spectra of the metalated species the CO stretch is circled in pink. We indicate with the labels helical and globular the structures that we expect based on their comparison with the spectra of the helical Ac-Phe-(Ala)5-Lys-H+ peptide.
The comparison between the vibrational spectra of the sodiated and potassiated species, and the IR signature of (Ac-Phe-Ala5-Lys-H)+ suggests that (Ac-Phe-Ala6-Na)+ and (Ac-Phe-Ala6-K)+ may adopt either helical or globular structure. All the conformations labeled helical in Figure 4.4 present at least three NH stretches in the hydrogen-bonding region and a free OH stretch. This spectral pattern suggests that the peptide structure is dominated by a strong hydrogen-bonding network that may favor the formation of a helical motif capped by the metal cation at the C-terminus. Furthermore, we hypothesize that the presence of the free OH - not interacting with any of the C=Os - allows the formation of NH…C=O interactions, that can then build a strong hydrogen-bonding network in the molecule, as in the case of (Ac-Phe-Ala5-Lys-H)+. The OH, pointing out of the peptide structure would create a sort of pocket where the cation could sit and cap the helical motif, as it happens for the Lys side chain in the structure of (Ac-Phe-Ala5-LysH)+. Moreover the presence of either three or four sharp peaks in the free NH region, which appear at similar
frequencies to the Phe, Lys and Ala2 stretches in (Ac-Phe-Ala5-Lys-H)+, reinforces our structural hypothesis.
In the case of the conformations labeled as globular, the number of sharp NH bands in the hydrogen-bonding region of the species is always two. Moreover, we notice that a broad band appears at ~ 3270 cm-1, while the free OH stretch peak disappears: this may suggest that the peptide backbone wraps around the metal cation, adopting a globular conformation. Under this hypothesis the broad band at ~ 3270 cm-1 may coincide with the C-terminal OH stretch, which in this case interacts with the metal cation, red-shifting its frequency. An interesting evidence is that conformer C of (Ac-Phe-Ala6-Na)+ and conformer C of (Ac-Phe-Ala6-K)+ show virtually the same spectral pattern. The same happens for the D conformer - this suggests a high degree of similarity in their structures that does not appear to depend on the size and kind of metal cation that the peptide binds.
In order to validate our structural assignment, we established collaboration with Markus Schneider, a PhD student of Dr. Carsten Baldauf of the Theory Department of the Fritz Haber Institute in Berlin. We decided to focus this theoretical study on the structure of the metalated peptide of sequence (Ac-Phe-Ala6-Na)+. As a first step of this joint investigation, Schneider re-assessed the calculated structures of (Ac-Phe-Ala5-Lys-H)+ provided by Stearns et al. (4) and Rossi et al. (9) by employing the same method that we aim to use for the metalated species. In this way we are confident that using a different level of theory and/or method does not bias the calculation of our structures. We decide to follow the search strategy proposed by Rossi, Blum, and coworkers (9), which was explained in more detail in Section 2.3 of this thesis. Schneider obtains 603280 conformers after the force-field search and selects 1000 of those to perform a geometrical optimization. We cluster these structures to remove duplicates, and obtain 324 different conformers within 6 kcal/mol from the global minimum. We locally refine all of them and select the 52 of energy within 3 kcal/mol from the global minimum.
By comparing our search with the results obtained by Stearns and Rossi, we find two additional conformers within 1 kcal/mol from the lowest-energy conformer: this gives us confidence in the completeness of our conformational search. Figure 4.5 shows the comparison between Rossi’s and our search of the energy hierarchies on the PBE0+MBD level.
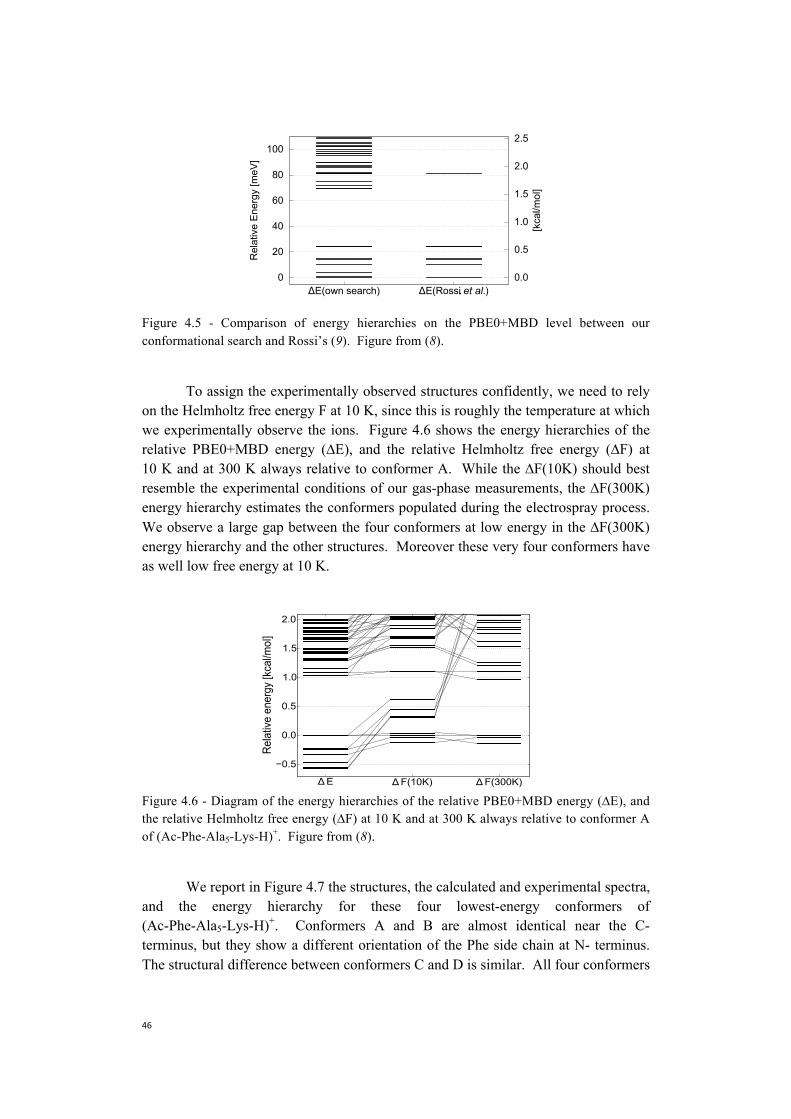
Figure 4.5 - Comparison of energy hierarchies on the PBE0+MBD level between our conformational search and Rossi’s (9). Figure from (8).
To assign the experimentally observed structures confidently, we need to rely on the Helmholtz free energy F at 10 K, since this is roughly the temperature at which we experimentally observe the ions. Figure 4.6 shows the energy hierarchies of the relative PBE0+MBD energy (∆E), and the relative Helmholtz free energy (∆F) at 10 K and at 300 K always relative to conformer A. While the ∆F(10K) should best resemble the experimental conditions of our gas-phase measurements, the ∆F(300K) energy hierarchy estimates the conformers populated during the electrospray process. We observe a large gap between the four conformers at low energy in the ∆F(300K) energy hierarchy and the other structures. Moreover these very four conformers have as well low free energy at 10 K.
Figure 4.6 - Diagram of the energy hierarchies of the relative PBE0+MBD energy (∆E), and the relative Helmholtz free energy (∆F) at 10 K and at 300 K always relative to conformer A of (Ac-Phe-Ala5-Lys-H)+. Figure from (8).
We report in Figure 4.7 the structures, the calculated and experimental spectra, and the energy hierarchy for these four lowest-energy conformers of (Ac-Phe-Ala5-Lys-H)+. Conformers A and B are almost identical near the C-terminus, but they show a different orientation of the Phe side chain at N- terminus. The structural difference between conformers C and D is similar. All four conformers
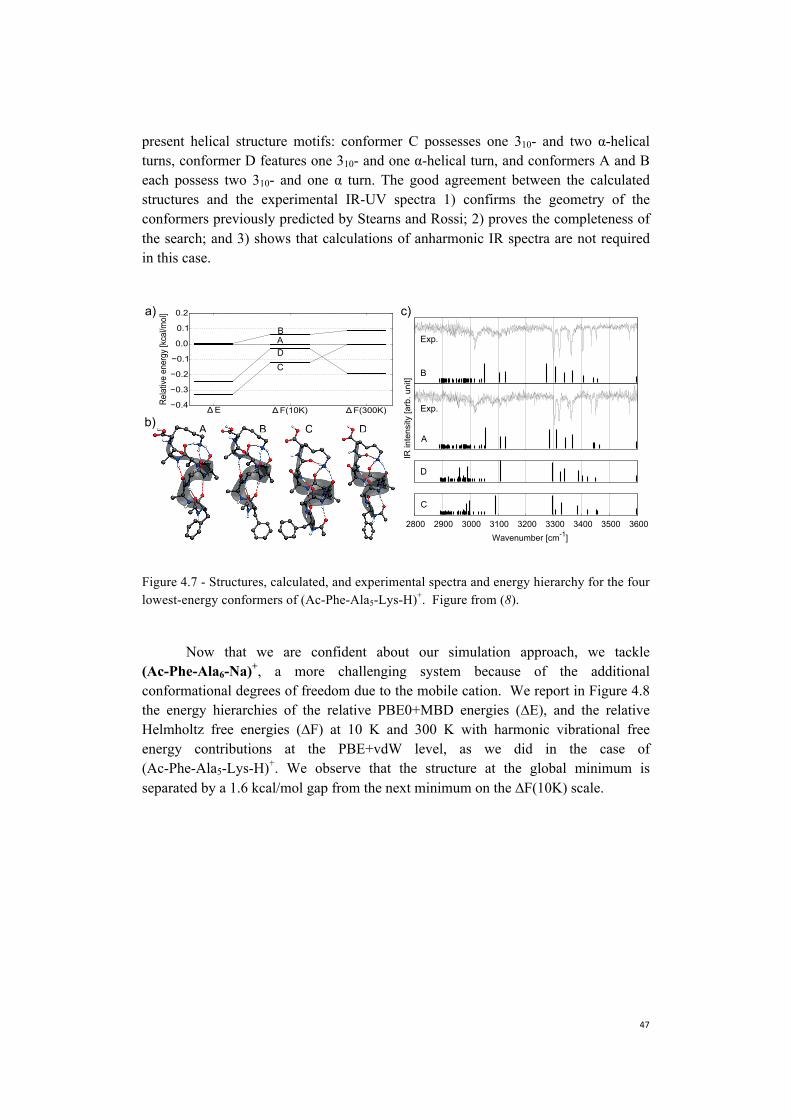
present helical structure motifs: conformer C possesses one 310- and two α-helical turns, conformer D features one 310- and one α-helical turn, and conformers A and B each possess two 310- and one α turn. The good agreement between the calculated structures and the experimental IR-UV spectra 1) confirms the geometry of the conformers previously predicted by Stearns and Rossi; 2) proves the completeness of the search; and 3) shows that calculations of anharmonic IR spectra are not required in this case.
Figure 4.7 - Structures, calculated, and experimental spectra and energy hierarchy for the four lowest-energy conformers of (Ac-Phe-Ala5-Lys-H)+. Figure from (8).
Now that we are confident about our simulation approach, we tackle (Ac-Phe-Ala6-Na)+, a more challenging system because of the additional conformational degrees of freedom due to the mobile cation. We report in Figure 4.8 the energy hierarchies of the relative PBE0+MBD energies (∆E), and the relative Helmholtz free energies (∆F) at 10 K and 300 K with harmonic vibrational free energy contributions at the PBE+vdW level, as we did in the case of (Ac-Phe-Ala5-Lys-H)+. We observe that the structure at the global minimum is separated by a 1.6 kcal/mol gap from the next minimum on the ∆F(10K) scale.
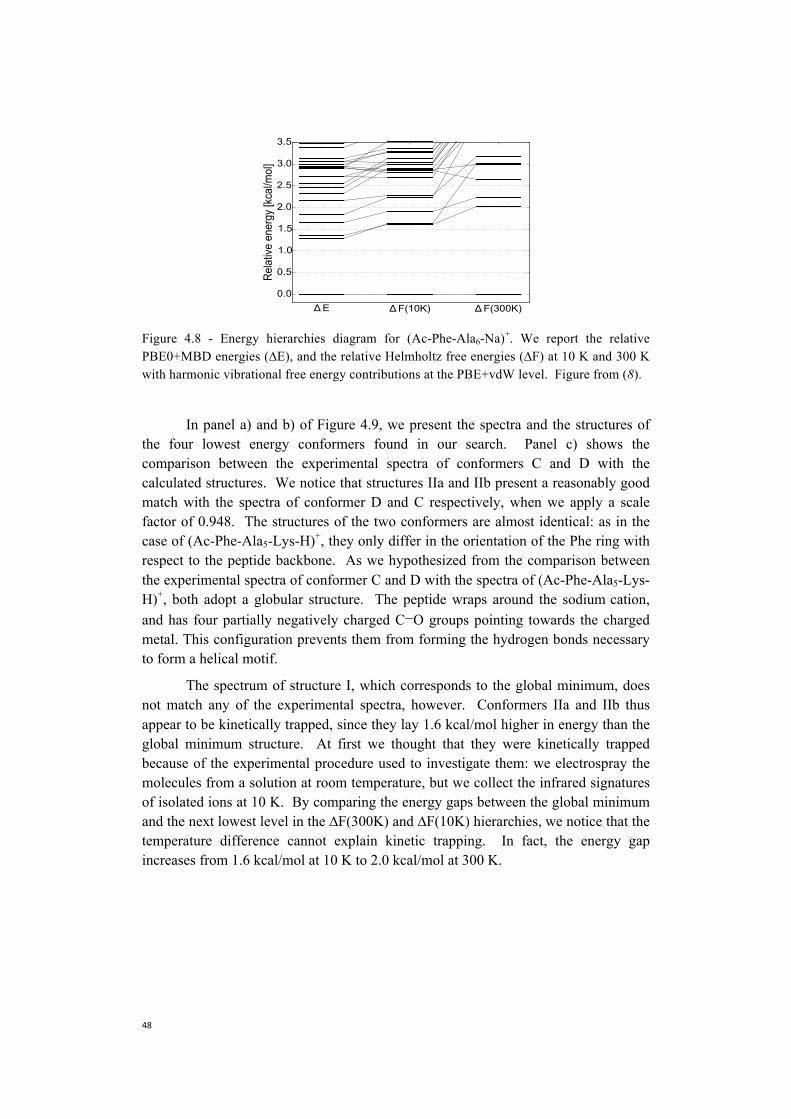
Figure 4.8 - Energy hierarchies diagram for (Ac-Phe-Ala6-Na)+. We report the relative PBE0+MBD energies (∆E), and the relative Helmholtz free energies (∆F) at 10 K and 300 K with harmonic vibrational free energy contributions at the PBE+vdW level. Figure from (8).
In panel a) and b) of Figure 4.9, we present the spectra and the structures of the four lowest energy conformers found in our search. Panel c) shows the comparison between the experimental spectra of conformers C and D with the calculated structures. We notice that structures IIa and IIb present a reasonably good match with the spectra of conformer D and C respectively, when we apply a scale factor of 0.948. The structures of the two conformers are almost identical: as in the case of (Ac-Phe-Ala5-Lys-H)+, they only differ in the orientation of the Phe ring with respect to the peptide backbone. As we hypothesized from the comparison between the experimental spectra of conformer C and D with the spectra of (Ac-Phe-Ala5-Lys-H)+, both adopt a globular structure. The peptide wraps around the sodium cation, and has four partially negatively charged C−O groups pointing towards the charged metal. This configuration prevents them from forming the hydrogen bonds necessary to form a helical motif.
The spectrum of structure I, which corresponds to the global minimum, does not match any of the experimental spectra, however. Conformers IIa and IIb thus appear to be kinetically trapped, since they lay 1.6 kcal/mol higher in energy than the global minimum structure. At first we thought that they were kinetically trapped because of the experimental procedure used to investigate them: we electrospray the molecules from a solution at room temperature, but we collect the infrared signatures of isolated ions at 10 K. By comparing the energy gaps between the global minimum and the next lowest level in the ∆F(300K) and ∆F(10K) hierarchies, we notice that the temperature difference cannot explain kinetic trapping. In fact, the energy gap increases from 1.6 kcal/mol at 10 K to 2.0 kcal/mol at 300 K.
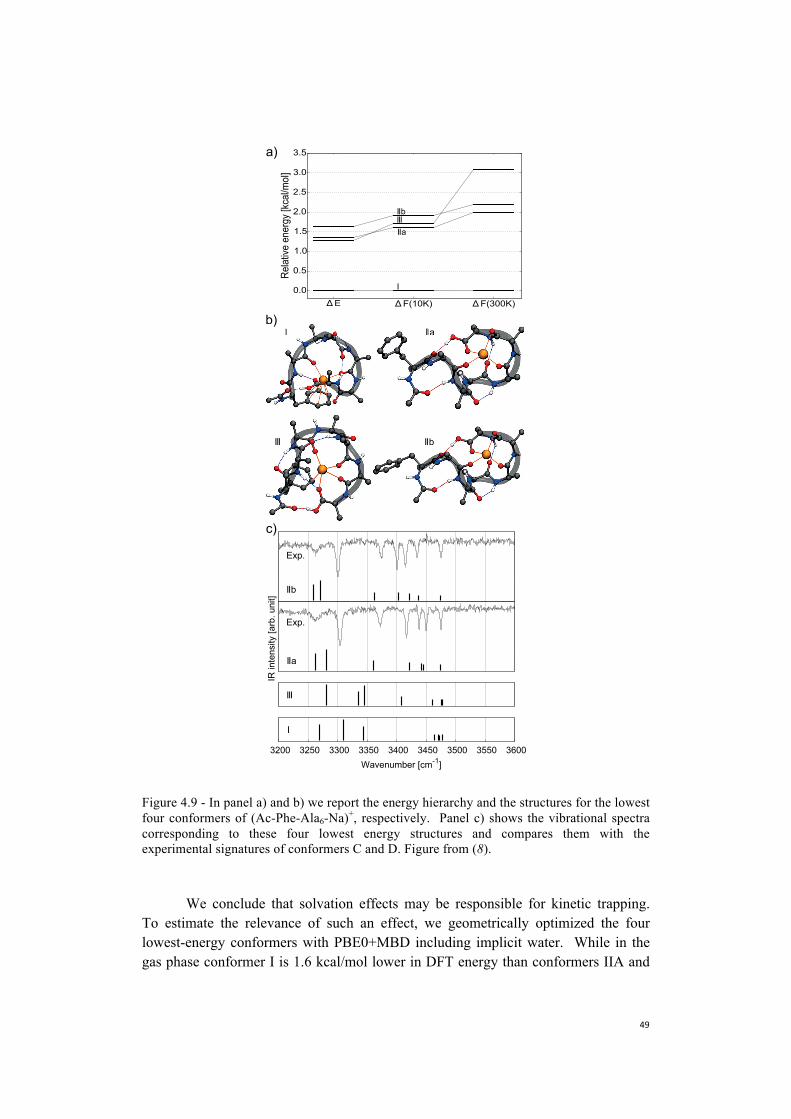
Figure 4.9 - In panel a) and b) we report the energy hierarchy and the structures for the lowest four conformers of (Ac-Phe-Ala6-Na)+, respectively. Panel c) shows the vibrational spectra corresponding to these four lowest energy structures and compares them with the experimental signatures of conformers C and D. Figure from (8).
We conclude that solvation effects may be responsible for kinetic trapping. To estimate the relevance of such an effect, we geometrically optimized the four lowest-energy conformers with PBE0+MBD including implicit water. While in the gas phase conformer I is 1.6 kcal/mol lower in DFT energy than conformers IIA and
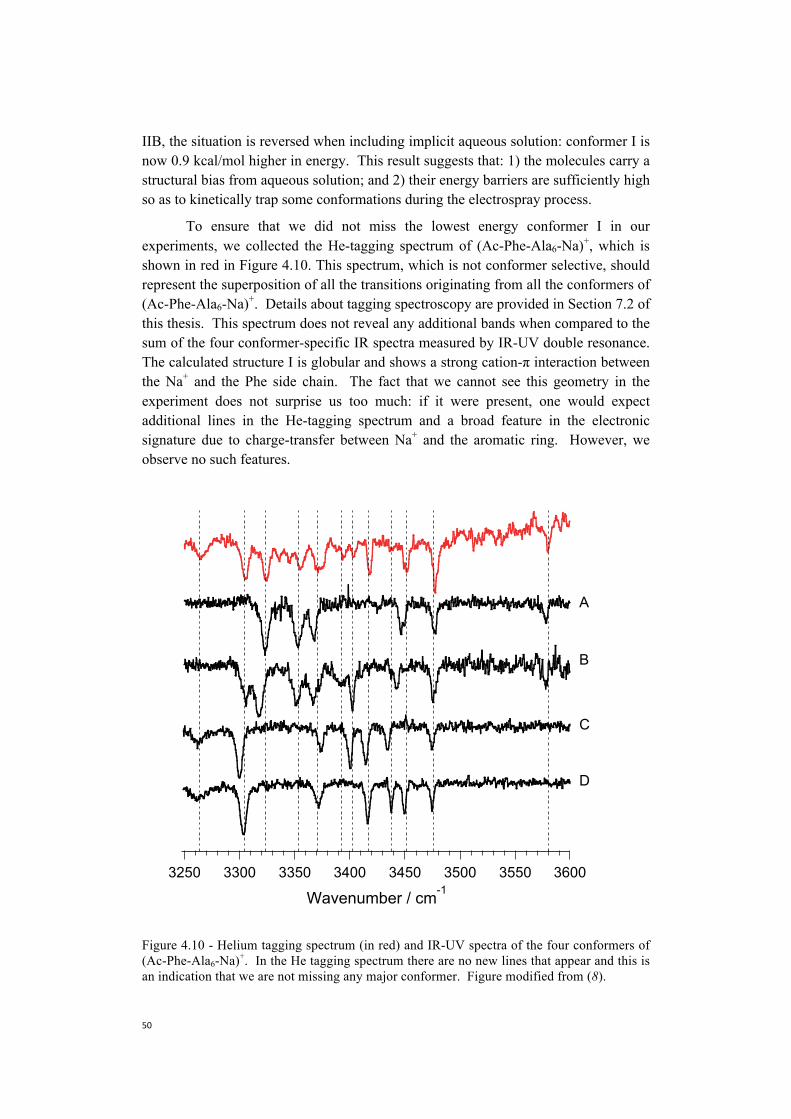
IIB, the situation is reversed when including implicit aqueous solution: conformer I is now 0.9 kcal/mol higher in energy. This result suggests that: 1) the molecules carry a structural bias from aqueous solution; and 2) their energy barriers are sufficiently high so as to kinetically trap some conformations during the electrospray process.
To ensure that we did not miss the lowest energy conformer I in our experiments, we collected the He-tagging spectrum of (Ac-Phe-Ala6-Na)+, which is shown in red in Figure 4.10. This spectrum, which is not conformer selective, should represent the superposition of all the transitions originating from all the conformers of (Ac-Phe-Ala6-Na)+. Details about tagging spectroscopy are provided in Section 7.2 of this thesis. This spectrum does not reveal any additional bands when compared to the sum of the four conformer-specific IR spectra measured by IR-UV double resonance. The calculated structure I is globular and shows a strong cation-π interaction between the Na+ and the Phe side chain. The fact that we cannot see this geometry in the experiment does not surprise us too much: if it were present, one would expect additional lines in the He-tagging spectrum and a broad feature in the electronic signature due to charge-transfer between Na+ and the aromatic ring. However, we observe no such features.
Figure 4.10 - Helium tagging spectrum (in red) and IR-UV spectra of the four conformers of (Ac-Phe-Ala6-Na)+. In the He tagging spectrum there are no new lines that appear and this is an indication that we are not missing any major conformer. Figure modified from (8).
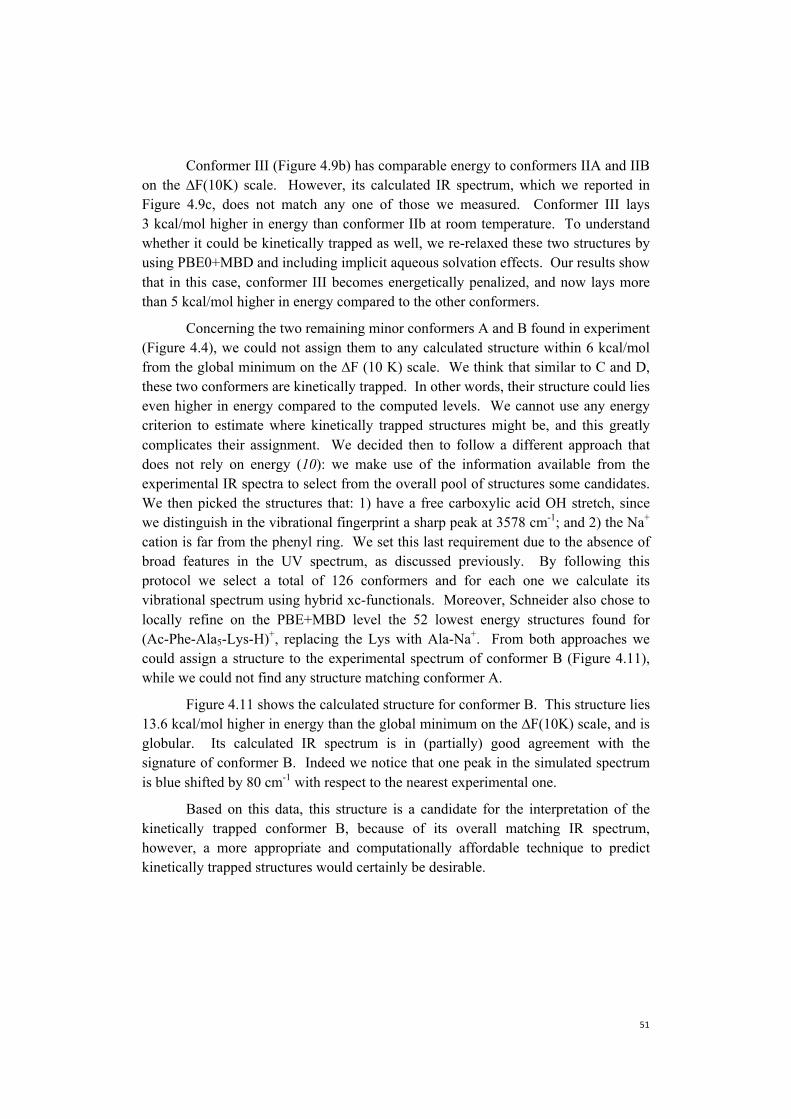
Conformer III (Figure 4.9b) has comparable energy to conformers IIA and IIB on the ∆F(10K) scale. However, its calculated IR spectrum, which we reported in Figure 4.9c, does not match any one of those we measured. Conformer III lays 3 kcal/mol higher in energy than conformer IIb at room temperature. To understand whether it could be kinetically trapped as well, we re-relaxed these two structures by using PBE0+MBD and including implicit aqueous solvation effects. Our results show that in this case, conformer III becomes energetically penalized, and now lays more than 5 kcal/mol higher in energy compared to the other conformers.
Concerning the two remaining minor conformers A and B found in experiment (Figure 4.4), we could not assign them to any calculated structure within 6 kcal/mol from the global minimum on the ∆F (10 K) scale. We think that similar to C and D, these two conformers are kinetically trapped. In other words, their structure could lies even higher in energy compared to the computed levels. We cannot use any energy criterion to estimate where kinetically trapped structures might be, and this greatly complicates their assignment. We decided then to follow a different approach that does not rely on energy (10): we make use of the information available from the experimental IR spectra to select from the overall pool of structures some candidates. We then picked the structures that: 1) have a free carboxylic acid OH stretch, since we distinguish in the vibrational fingerprint a sharp peak at 3578 cm-1; and 2) the Na+ cation is far from the phenyl ring. We set this last requirement due to the absence of broad features in the UV spectrum, as discussed previously. By following this protocol we select a total of 126 conformers and for each one we calculate its vibrational spectrum using hybrid xc-functionals. Moreover, Schneider also chose to locally refine on the PBE+MBD level the 52 lowest energy structures found for (Ac-Phe-Ala5-Lys-H)+, replacing the Lys with Ala-Na+. From both approaches we could assign a structure to the experimental spectrum of conformer B (Figure 4.11), while we could not find any structure matching conformer A.
Figure 4.11 shows the calculated structure for conformer B. This structure lies 13.6 kcal/mol higher in energy than the global minimum on the ∆F(10K) scale, and is globular. Its calculated IR spectrum is in (partially) good agreement with the signature of conformer B. Indeed we notice that one peak in the simulated spectrum is blue shifted by 80 cm-1 with respect to the nearest experimental one.
Based on this data, this structure is a candidate for the interpretation of the kinetically trapped conformer B, because of its overall matching IR spectrum, however, a more appropriate and computationally affordable technique to predict kinetically trapped structures would certainly be desirable.
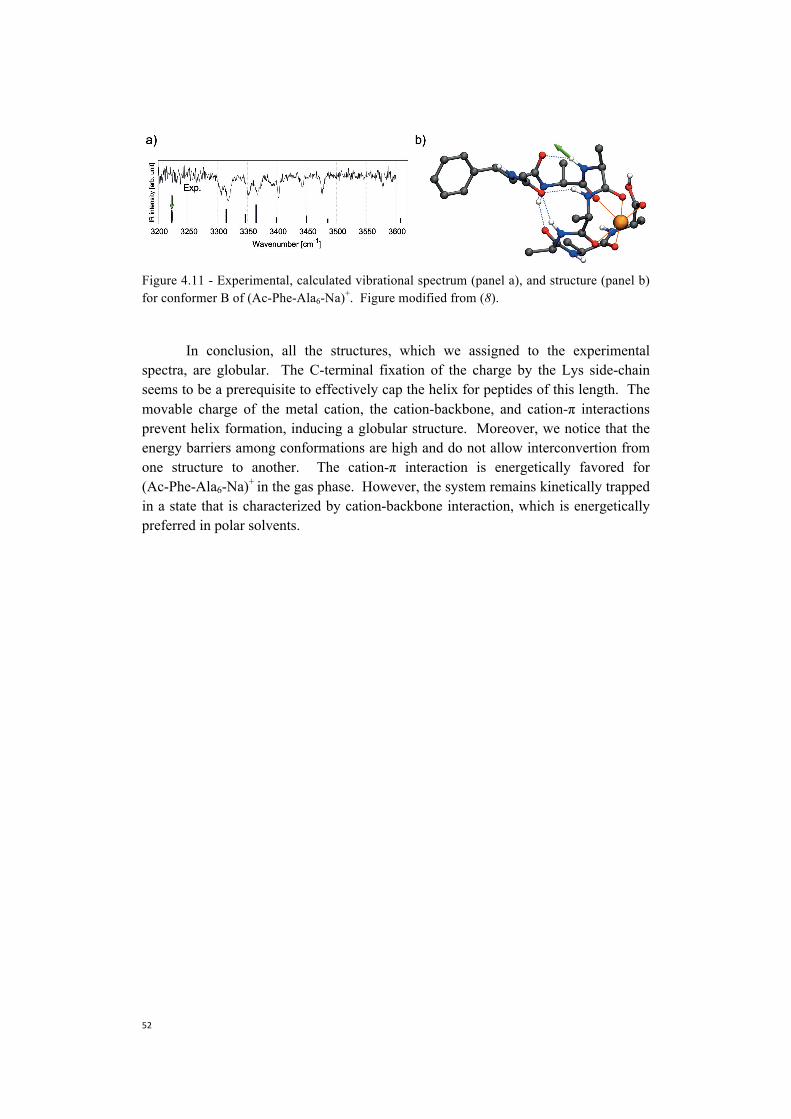
Figure 4.11 - Experimental, calculated vibrational spectrum (panel a), and structure (panel b) for conformer B of (Ac-Phe-Ala6-Na)+. Figure modified from (8).
In conclusion, all the structures, which we assigned to the experimental spectra, are globular. The C-terminal fixation of the charge by the Lys side-chain seems to be a prerequisite to effectively cap the helix for peptides of this length. The movable charge of the metal cation, the cation-backbone, and cation-π interactions prevent helix formation, inducing a globular structure. Moreover, we notice that the energy barriers among conformations are high and do not allow interconvertion from one structure to another. The cation-π interaction is energetically favored for (Ac-Phe-Ala6-Na)+ in the gas phase. However, the system remains kinetically trapped in a state that is characterized by cation-backbone interaction, which is energetically preferred in polar solvents.
References
1. A. V. Zabuga, T. R. Rizzo, Capping Motif for Peptide Helix Formation.Journal of Physical Chemistry Letters 6, 1504-1508 (2015).
2. J. A. Stearns, O. V. Boyarkin, T. R. Rizzo, Spectroscopic signatures of gas-phase helices: Ac-Phe-(Ala)(5)-Lys-H+ and Ac-Phe-(Ala)(10)-Lys-H+.Journal of the American Chemical Society 129, 13820-+ (2007).
3. J. A. Stearns, O. V. Boyarkin, T. R. Rizzo, Effects of N-terminus substitutionon the structure and spectroscopy of gas-phase helices. Chimia 62, 240-243(2008).
4. J. A. Stearns, C. Seaiby, O. V. Boyarkin, T. R. Rizzo, Spectroscopy andconformational preferences of gas-phase helices. Physical ChemistryChemical Physics 11, 125-132 (2009).
5. R. R. Hudgins, M. A. Ratner, M. F. Jarrold, Design of helices that are stable invacuo. Journal of the American Chemical Society 120, 12974-12975 (1998).
6. D. T. Kaleta, M. F. Jarrold, Disrupting helix formation in unsolvated peptides.Journal of Physical Chemistry B 105, 4436-4440 (2001).
7. M. Rossi et al., Secondary Structure of Ac-Ala(n)-LysH(+) PolyalaninePeptides (n=5, 10, 15) in Vacuo: Helical or Not? Journal of PhysicalChemistry Letters 1, 3465-3470 (2010).
8. M. Schneider, C. Masellis, T. R. Rizzo, C. Baldauf, Kinetically TrappedLiquid-State Conformers of a Sodiated Model Peptide Observed in the GasPhase. Journal of Physical Chemistry A, 121, 6838-6844 (2017).
9. M. Rossi, S. Chutia, M. Scheffler, V. Blum, Validation challenge of density-functional theory for peptides-example of Ac-Phe-Ala5-LysH(+).Journal ofPhysical Chemistry A 118, 7349-7359 (2014).
10. L. Voronina et al., Conformations of Prolyl-Peptide Bonds in the Bradykinin1-5 Fragment in Solution and in the Gas Phase. Journal of the AmericanChemical Society 138, 9224-9233 (2016).

Conclusions
To understand the mechanisms that govern the interactions between peptides and other biological molecules, one has to unravel their secondary structure. The helix is one of the most common secondary structure motifs, so in this thesis we focus on its investigation. We performed two sets of experiments on singly protonated peptides and metalated species.
With our contribution on the analysis of peptides of sequence Ac-Phe-(Ala)n-Lys-H+ with n=1-5, 10, we provide the spectroscopic fingerprint of a helix in the gas-phase. The helix-capping motif forms in presence of one alanine, and it is conserved upon increasing in the number of amino acid residues. The hydrogen-bonding pattern responsible for the construction of the helical structure starts forming in the presence of 4 residues. By increasing the number of amino acids in the sequence, a larger network of hydrogen bonds is established. This has the effect of stabilizing the helical motif, leading to the formation of a first complete loop in presence of 7 residues. Our study confirms and extends the previous results obtained by Zabuga (1) and Stearns (2-4). Moreover the IR-UV spectroscopic dimension expands the ion-mobility work done by Jarrold (5). Due to the patterns in the hydrogen-bonding and free NH regions of the spectra of Ac-Phe-Alan-Lys-H+ that we identified, we could structurally characterize the ions by comparing together the infrared spectra of longer and shorter sequences, without performing additional structural calculations.
The second aspect that we tackled in this thesis is the role played by a mobile charge in the helix formation. To achieve this goal, we investigated metalated species of the sequence (Ac-Phe-Ala6-M)+ with M = Li, Na, K, Zn, and (Ac-Phe-Ala6-M)2+, where M = Ca, Ni, Zn. By comparing the UV spectrum of these metalated species with the one of (Ac-Phe-Ala5-Lys-H)+, we determined that only the sodiated and potassiated species could adopt helical conformations in the gas-phase. By employing IR-UV double resonance spectroscopy we measured the conformer-selective spectra of these two species, from which we hypothesized the presence of two helical and two globular conformers. To verify these assumptions confidently, we established a collaboration with the group of Prof. Carsten Baldauf at the Fritz Harber Institute in Berlin to obtain calculated structures of the sodiated species. We could successfully assign the spectra of the two major conformers of
(Ac-Phe-Ala6-Na)+ that we measured to two of the calculated structures. These conformers appear to be kinetically trapped and globular, as expected from the analysis of their vibrational spectra alone. Moreover, we could (partially) assign the structure to the spectrum of a minor conformer of the same species, which we thought were helical. This structure appeared to be globular also in this case, however.
Our results demonstrate that the synergy between experiment and theory is fundamental to obtain a clear understanding of peptide structure. In this case, in fact, the rich possibilities for electrostatic interaction due to the presence of the metal locally disrupt the helical hydrogen-bonding network and induce unconventional backbone conformations, which are not a priori obvious.
References
1. A. V. Zabuga, T. R. Rizzo, Capping Motif for Peptide Helix Formation.Journal of Physical Chemistry Letters 6, 1504-1508 (2015).
2. J. A. Stearns, O. V. Boyarkin, T. R. Rizzo, Spectroscopic signatures of gas-phase helices: Ac-Phe-(Ala)(5)-Lys-H+ and Ac-Phe-(Ala)(10)-Lys-H+.Journal of the American Chemical Society 129, 13820-+ (2007).
3. J. A. Stearns, O. V. Boyarkin, T. R. Rizzo, Effects of N-terminus substitutionon the structure and spectroscopy of gas-phase helices. Chimia 62, 240-243(2008).
4. J. A. Stearns, C. Seaiby, O. V. Boyarkin, T. R. Rizzo, Spectroscopy andconformational preferences of gas-phase helices. Physical ChemistryChemical Physics 11, 125-132 (2009).
5. R. R. Hudgins, M. A. Ratner, M. F. Jarrold, Design of helices that are stable invacuo. Journal of the American Chemical Society 120, 12974-12975 (1998).
Part 2
Identification and Characterization of Glycans in the Gas-Phase

5. Introduction
5.1 Glycans and their structural heterogeneity
Glycans, also called polysaccharides or oligosaccharides, are biopolymers composed of individual building blocks called monosaccharides linked together via glycosidic bonds. The surface of nearly every cell of living organisms is decorated by a layer of glycans, and for this reason they are involved in virtually all the cell-to-cell and cell-to-host signaling, recognition, and communication processes (1-5). Glycans are responsible for triggering cellular immune response, and inflammatory processes to protect cells from viruses and bacteria (6, 7). Moreover, glycans determine one’s ability to receive blood transfusion, organ transplants, and are involved in all major human pathologies (1, 2, 5, 8).
In living organisms, glycans are mostly linked to a protein or a lipid forming a glycoprotein or a glycolipid; these complexes are more generally defined as glycoconjugates. Three main classes of glycoconjugates exist: 1) N-linked glycans, which are polysaccharides that are attached to a protein through a nitrogen atom, 2) O-linked glycans, which are polysaccharides that are attached to a protein throughan oxygen atom, and 3) polysaccharides simply attached to lipids in any manner (4).In a glycoconjugate the glycan can influence the function of the whole complex innumerous ways, for example changing the glycoconjugate’s solubility, acting as aprotective site against hydrolysis, reducing or preventing protein aggregation, alteringthe orientation of the protein or the lipid on the cell surface (2, 9). In this pictureproteins and lipids represent a scaffold on which the oligosaccharide chemically bindsto, modifying the task that the entire glycoconjugate performs (1-3). The function ofthe glycoconjugate is directly related to its structure, and this is the reason whyglycobiology is an exponentially growing field - structural characterization is key tounravel the biological function that the glycoconjugate performs in its nativeenvironment. Studies, in fact, have shown that glycoconjugates modify their structuredepending on the health status of the cell (10, 11), in case of cancer (2, 12, 13), andother pathologies (2). For this reason they are often used as biomarkers.
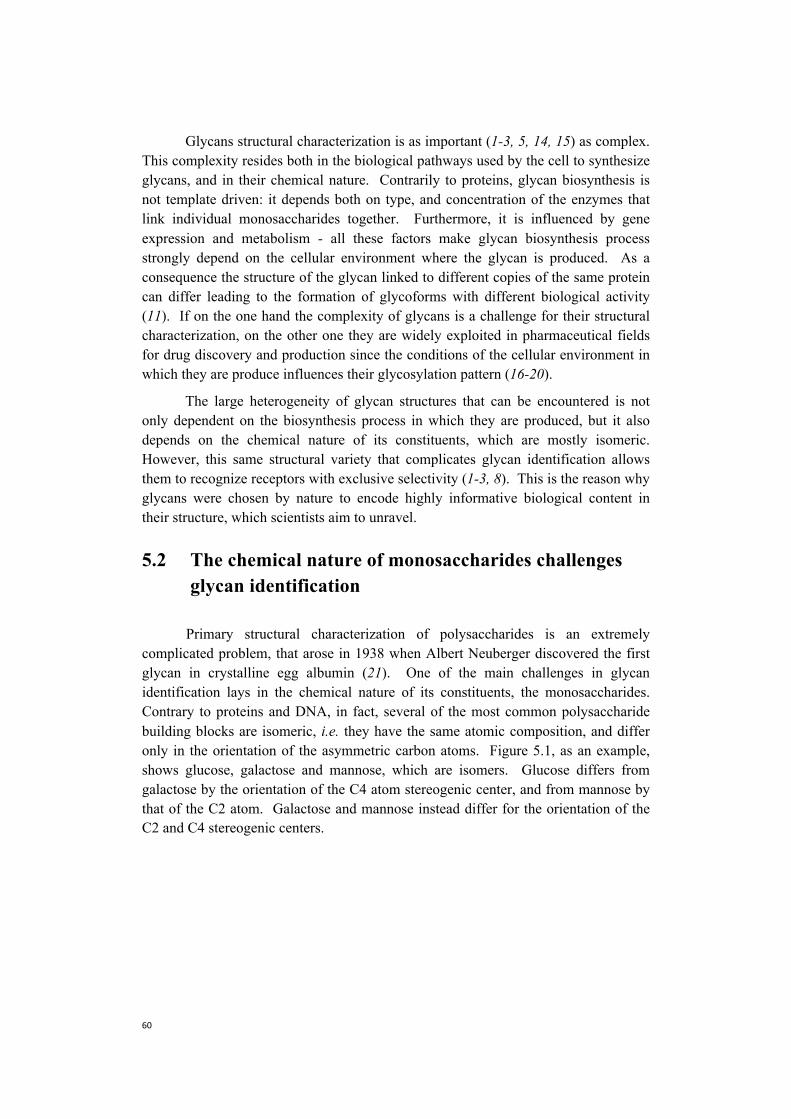
Glycans structural characterization is as important (1-3, 5, 14, 15) as complex. This complexity resides both in the biological pathways used by the cell to synthesize glycans, and in their chemical nature. Contrarily to proteins, glycan biosynthesis is not template driven: it depends both on type, and concentration of the enzymes that link individual monosaccharides together. Furthermore, it is influenced by gene expression and metabolism - all these factors make glycan biosynthesis process strongly depend on the cellular environment where the glycan is produced. As a consequence the structure of the glycan linked to different copies of the same protein can differ leading to the formation of glycoforms with different biological activity (11). If on the one hand the complexity of glycans is a challenge for their structural characterization, on the other one they are widely exploited in pharmaceutical fields for drug discovery and production since the conditions of the cellular environment in which they are produce influences their glycosylation pattern (16-20).
The large heterogeneity of glycan structures that can be encountered is not only dependent on the biosynthesis process in which they are produced, but it also depends on the chemical nature of its constituents, which are mostly isomeric. However, this same structural variety that complicates glycan identification allows them to recognize receptors with exclusive selectivity (1-3, 8). This is the reason why glycans were chosen by nature to encode highly informative biological content in their structure, which scientists aim to unravel.
5.2 The chemical nature of monosaccharides challenges glycan identification
Primary structural characterization of polysaccharides is an extremely complicated problem, that arose in 1938 when Albert Neuberger discovered the first glycan in crystalline egg albumin (21). One of the main challenges in glycan identification lays in the chemical nature of its constituents, the monosaccharides. Contrary to proteins and DNA, in fact, several of the most common polysaccharide building blocks are isomeric, i.e. they have the same atomic composition, and differ only in the orientation of the asymmetric carbon atoms. Figure 5.1, as an example, shows glucose, galactose and mannose, which are isomers. Glucose differs from galactose by the orientation of the C4 atom stereogenic center, and from mannose by that of the C2 atom. Galactose and mannose instead differ for the orientation of the C2 and C4 stereogenic centers.
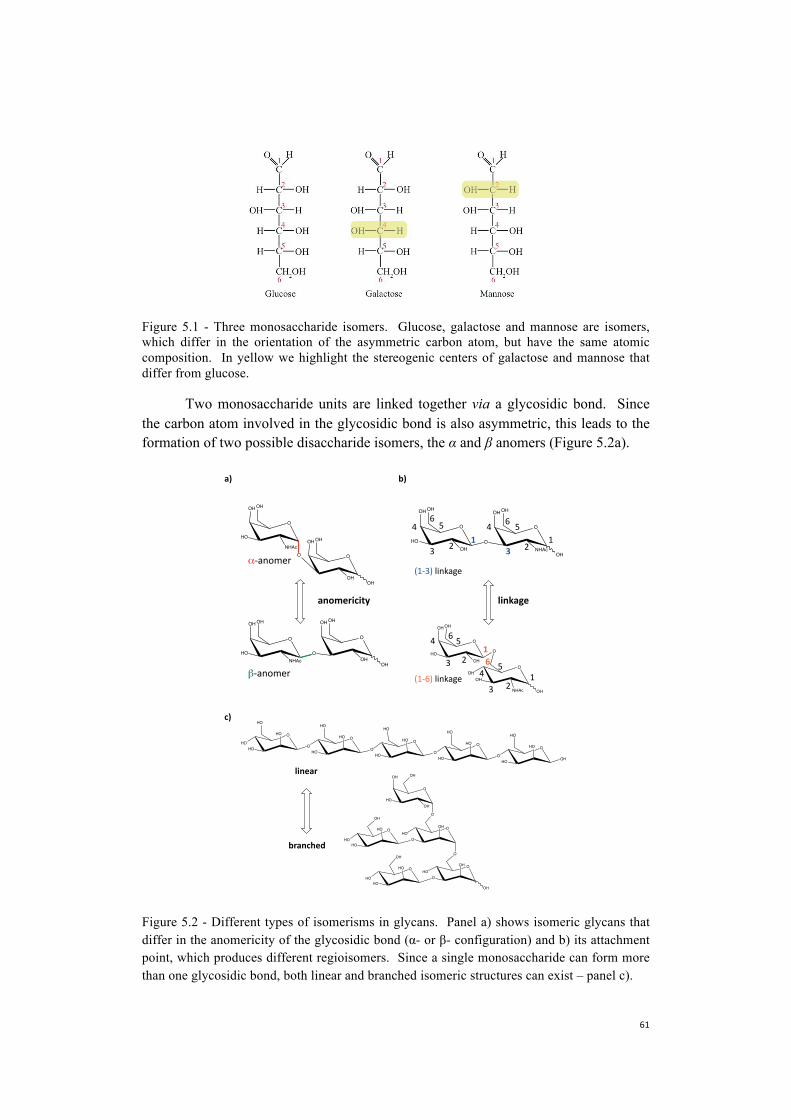
Figure 5.1 - Three monosaccharide isomers. Glucose, galactose and mannose are isomers, which differ in the orientation of the asymmetric carbon atom, but have the same atomic composition. In yellow we highlight the stereogenic centers of galactose and mannose that differ from glucose.
Two monosaccharide units are linked together via a glycosidic bond. Since the carbon atom involved in the glycosidic bond is also asymmetric, this leads to the formation of two possible disaccharide isomers, the α and β anomers (Figure 5.2a).
Figure 5.2 - Different types of isomerisms in glycans. Panel a) shows isomeric glycans that differ in the anomericity of the glycosidic bond (α- or β- configuration) and b) its attachment point, which produces different regioisomers. Since a single monosaccharide can form more than one glycosidic bond, both linear and branched isomeric structures can exist – panel c).
O
OH
HO
OH
O
OH
OH
OH
OH
O
NHAc
O
OH
HO
NHAc
OH
O
O
OH
OH
OH
OH
O
OH
HO
OH
OH
O
OHNHAc
O
OH
OH
O
OH
HO
OH
O
OH
O
OH
NHAc
OH
OH
O
OH
HO
O
OH
OHO
O
OH
O
OHO
O
OH
O
HOHO
HO
O
HOHO
HO
OH
OH
OH
OH
O
HO
HO
HO
HO
O
O
HO
HO
HO
O
O
HO
HO
HO
O
O
HO
HO
HO
O
O
HO
HO
OH
HO
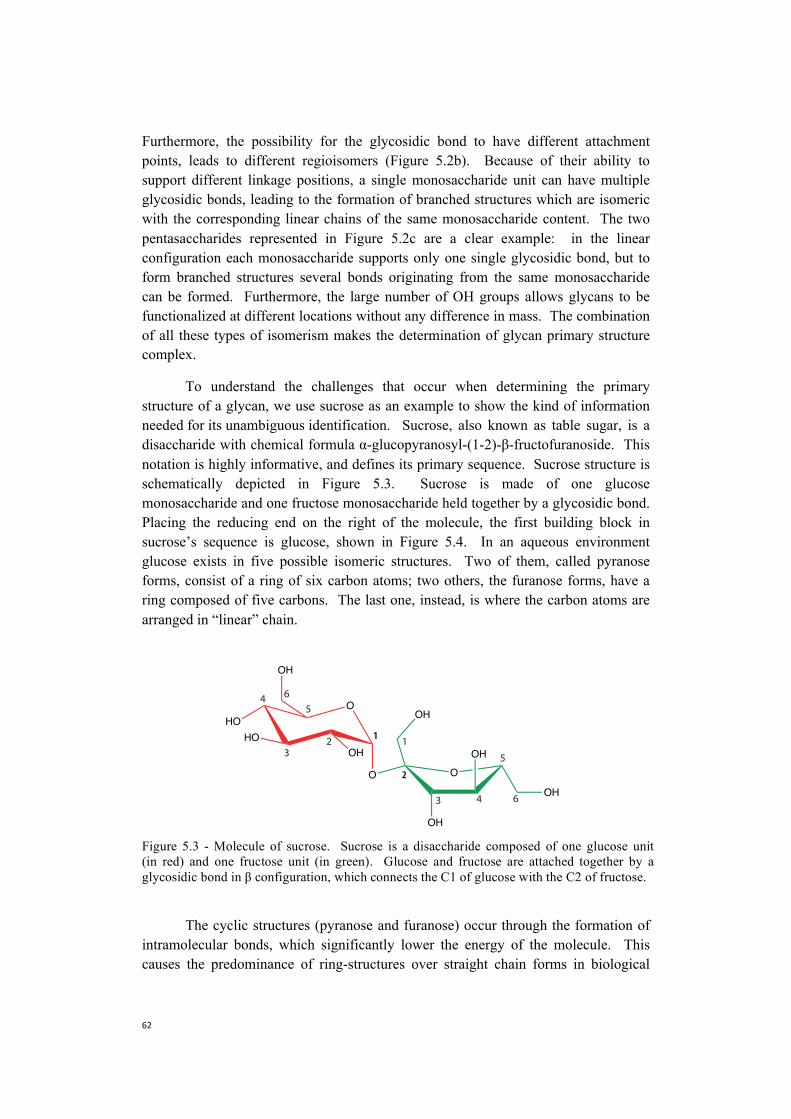
Furthermore, the possibility for the glycosidic bond to have different attachment points, leads to different regioisomers (Figure 5.2b). Because of their ability to support different linkage positions, a single monosaccharide unit can have multiple glycosidic bonds, leading to the formation of branched structures which are isomeric with the corresponding linear chains of the same monosaccharide content. The two pentasaccharides represented in Figure 5.2c are a clear example: in the linear configuration each monosaccharide supports only one single glycosidic bond, but to form branched structures several bonds originating from the same monosaccharide can be formed. Furthermore, the large number of OH groups allows glycans to be functionalized at different locations without any difference in mass. The combination of all these types of isomerism makes the determination of glycan primary structure complex.
To understand the challenges that occur when determining the primary structure of a glycan, we use sucrose as an example to show the kind of information needed for its unambiguous identification. Sucrose, also known as table sugar, is a disaccharide with chemical formula α-glucopyranosyl-(1-2)-β-fructofuranoside. This notation is highly informative, and defines its primary sequence. Sucrose structure is schematically depicted in Figure 5.3. Sucrose is made of one glucose monosaccharide and one fructose monosaccharide held together by a glycosidic bond. Placing the reducing end on the right of the molecule, the first building block in sucrose’s sequence is glucose, shown in Figure 5.4. In an aqueous environment glucose exists in five possible isomeric structures. Two of them, called pyranose forms, consist of a ring of six carbon atoms; two others, the furanose forms, have a ring composed of five carbons. The last one, instead, is where the carbon atoms are arranged in “linear” chain.
The cyclic structures (pyranose and furanose) occur through the formation of intramolecular bonds, which significantly lower the energy of the molecule. This causes the predominance of ring-structures over straight chain forms in biological
O
HO
HO
O
OH
OH
O
OH
OH
OH
OH
23
45
6
1 1
5
63 4
2
Figure 5.3 - Molecule of sucrose. Sucrose is a disaccharide composed of one glucose unit(in red) and one fructose unit (in green). Glucose and fructose are attached together by aglycosidic bond in β configuration, which connects the C1 of glucose with the C2 of fructose.
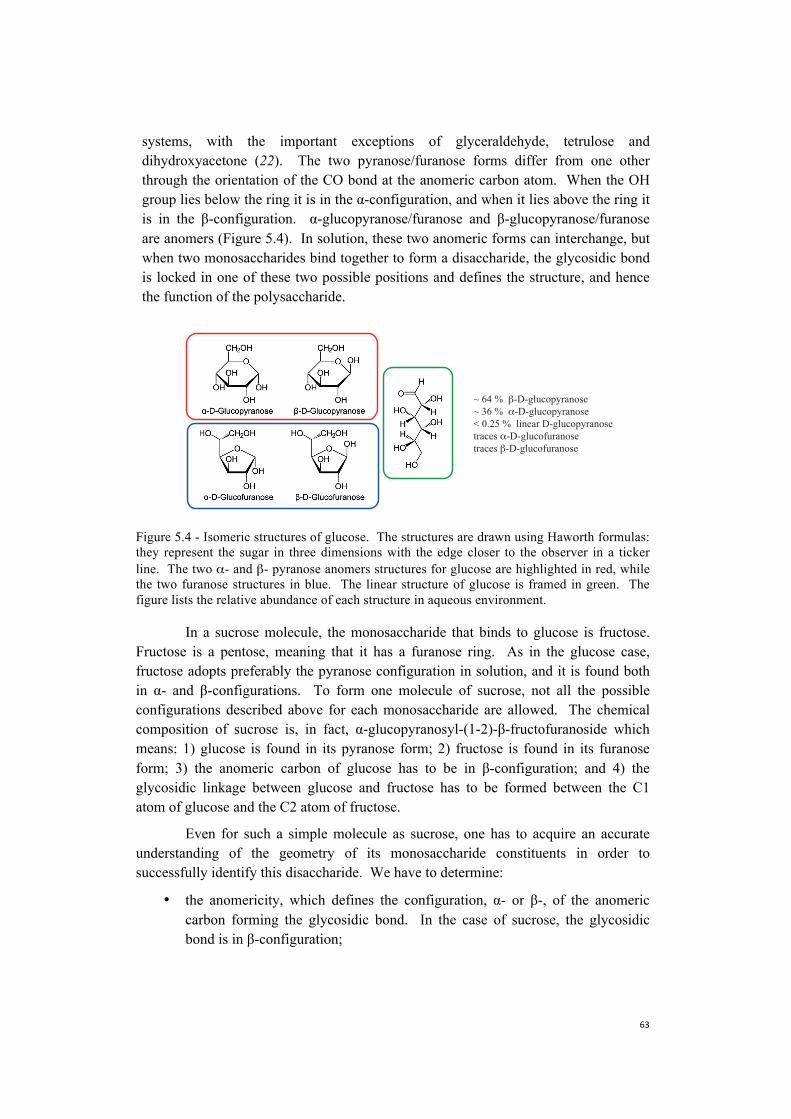
systems, with the important exceptions of glyceraldehyde, tetrulose and dihydroxyacetone (22). The two pyranose/furanose forms differ from one other through the orientation of the CO bond at the anomeric carbon atom. When the OH group lies below the ring it is in the α-configuration, and when it lies above the ring it is in the β-configuration. α-glucopyranose/furanose and β-glucopyranose/furanose are anomers (Figure 5.4). In solution, these two anomeric forms can interchange, but when two monosaccharides bind together to form a disaccharide, the glycosidic bond is locked in one of these two possible positions and defines the structure, and hence the function of the polysaccharide.
Figure 5.4 - Isomeric structures of glucose. The structures are drawn using Haworth formulas: they represent the sugar in three dimensions with the edge closer to the observer in a ticker line. The two α- and β- pyranose anomers structures for glucose are highlighted in red, while the two furanose structures in blue. The linear structure of glucose is framed in green. The figure lists the relative abundance of each structure in aqueous environment.
In a sucrose molecule, the monosaccharide that binds to glucose is fructose. Fructose is a pentose, meaning that it has a furanose ring. As in the glucose case, fructose adopts preferably the pyranose configuration in solution, and it is found both in α- and β-configurations. To form one molecule of sucrose, not all the possible configurations described above for each monosaccharide are allowed. The chemical composition of sucrose is, in fact, α-glucopyranosyl-(1-2)-β-fructofuranoside which means: 1) glucose is found in its pyranose form; 2) fructose is found in its furanose form; 3) the anomeric carbon of glucose has to be in β-configuration; and 4) the glycosidic linkage between glucose and fructose has to be formed between the C1 atom of glucose and the C2 atom of fructose.
Even for such a simple molecule as sucrose, one has to acquire an accurate understanding of the geometry of its monosaccharide constituents in order to successfully identify this disaccharide. We have to determine:
• the anomericity, which defines the configuration, α- or β-, of the anomericcarbon forming the glycosidic bond. In the case of sucrose, the glycosidicbond is in β-configuration;
• the linkage, defining which two carbon atoms are involved in the glycosidicbond formation. In the case of sucrose it is C1 and C2;
• the monosaccharide composition - in the case of sucrose, one glucose unit andone fructose unit;
• the order in which monosaccharides appear in the sequence. In the case ofsucrose, glucose is in the first position, and fructose is in the second positionwhen considering the reducing end on the right.
5.3 Goals and outline of this work
The work presented in the second part of this thesis focuses on the identification and characterization of glycans. In the following chapters, we show that we have implemented a novel technique for glycan identification. This technique is based on the measurement of the glycan mass, collisional cross-section and vibrational spectra under cryogenic conditions. To perform these measurements, we use a drift-tube coupled with a cryogenic ion trap and a time-of-flight mass spectrometer. We collect the vibrational fingerprints of glycans by employing messenger tagging spectroscopy. Our approach is based on the construction of a database where we store all this information collected on standard oligosaccharides to expedite the identification of unknown species.
The general outline of this second part of the thesis is the following:
Chapter 6, “Available methods for glycan identification”, presents the currently available methods for glycan structural characterization, together with their limitations.
Chapter 7, “Experimental technique”, focuses on the description of our experimental setup. Section 7.1 provides an overview of our ion-mobility spectrometer coupled to a cryogenic ion trap of our own design; Section 7.2 describes how we determine the collisional cross section of our ion, while we explain the principles of messenger tagging spectroscopy in Section 7.3.
Chapter 8, “A novel technique to identify glycans”, provides the proof of principle of our method. Here we analyze six isomeric disaccharides and we show that the addition of the spectroscopic dimension to mass and mobility spectrometry allows one to unambiguously identify glycan isomers.
Chapter 9, “Towards the construction of a database”, explains the efficacy of a database approach in glycan identification. Moreover, we discuss the necessary improvements which are needed for this technique to become an analytical and more broadly accessible tool.
In Part 2 Conclusion section, we summarize our main results concerning the identification and characterization of glycans.
References
1. A. Varki, Biological roles of oligosaccharides: all of the theories are correct.Glycobiology 3, 97-130 (1993).
2. A. Varki, Cummings, R.D., Esko, J.D. et al., Essentials of Glycobiology.(Cold Spring Harbor (NY), ed. 2nd, 2009).
3. A. Varki, Biological roles of glycans. Glycobiology 27, 46 (2017).4. M. E. T. Drickamer, Introduction to Glycobiology. (Oxford University Press,
ed. 3, 2011).5. Transforming Glycoscience: A Roadmap for the Future (2012).6. P. M. Rudd, M. Butler, I. A. Wilson, J. Jaeken, R. A. Dwek, Roles for
glycosylation in the immune system. Glycobiology 11, 865-865 (2001).7. P. M. Rudd, T. Elliott, P. Cresswell, I. A. Wilson, R. A. Dwek, Glycosylation
and the immune system. Science 291, 2370-2376 (2001).8. A. C. M. Alvaro Berbis, Javier Sastre-Martinez, Luca Unione, M. C.
Fernandez-Alonso, Pilar Blasco, F. Javier Canada and Jesus Jimenez-Barbero,in Carbohydrate Chemistry: State of the Art and Challenges for DrugDevelopment. chap. 121, pp. 25.
9. X. L. a. X. C. Yanhong Li, in Carbohydrate Chemistry: State of the Arte andChallenges for Drug Development.
10. K. Ohtsubo, J. D. Marth, Glycosylation in cellular mechanisms of health anddisease. Cell 126, 855-867 (2006).
11. J. Zaia, Mass Spectrometry and Glycomics. Omics 14, 401-418 (2010).12. H. J. An, S. R. Kronewitter, M. L. A. de Leoz, C. B. Lebrilla, Glycomics and
disease markers. Current Opinions in Chemical Biology 13, 601-607 (2009).13. B. Adamczyk, T. Tharmalingam, P. M. Rudd, Glycans as cancer biomarkers.
Bba-General Subjects 1820, 1347-1353 (2012).14. J. W. Dennis, M. Granovsky, C. E. Warren, Protein glycosylation in
development and disease. Bioessays 21, 412-421 (1999).15. E. F. Hounsell, M. J. Davies, D. V. Renouf, O-linked protein glycosylation
structure and function. Glycoconjugate Journal 13, 19-26 (1996).16. B. Lepenies, Carbohydrate-based vaccines. (Springer 2015).17. R. Jefferis, Glycosylation as a strategy to improve antibody-based
therapeutics. Natural Review Drug Discovery 8, 226-234 (2009).
18. R. Jefferis, J. Lund, Y. Mimura, M. Goodall, S. Church, The influence ofglycosylation on antibody structure and function. Abstracts of Paper AmericalChemical Society 223, U114-U114 (2002).
19. H. C. Liu, G. G. Bulseco, J. A. Sun, Effect of posttranslational modificationson the thermal stability of a recombinant monoclonal antibody. ImmunologyLetters 106, 144-153 (2006).
20. A. M. Sinclair, S. Elliott, Glycoengineering: The effect of glycosylation on theproperties of therapeutic proteins. Jorunal of Pharmaceutical Sciences-Us 94,1626-1635 (2005).
21. A. Neuberger, Carbohydrates in proteins I. The carbohydrate component ofcrystalline egg albumin. Biochemical Journal 32, 1435-1451 (1938).
22. M. V. D. a. U. S. S.A. Brooks, Functional & Molecular Glycobiology.(Advanced Text, 2002).
6. Available methods for glycanidentification
One of the major challenges in the field of glycomics is providing analytical identification and sequencing tools for glycans. In contrast to a protein, where sequencing means determining its amino acid sequence, the primary structure of a glycan is determined not only by the order of its building blocks, but also by anomericity and linkage positions of its glycosidic bonds. Oligosaccharide sequencing is, in a way, a higher-dimensional problem. To further complicate this task, several of the most common monosaccharide building blocks which constitute glycans have the same mass, and their structure differs in just the orientation of a single stereogenic center. A number of different techniques have been developed and coupled over the years to obtain a complete picture of the primary structure of glycans. We describe in the following sections the current methods used to tackle this challenging problem.
6.1 Nuclear magnetic resonance
Nuclear magnetic resonance (NMR) is considered the gold-standard in glycan structural characterization. By using this technique one obtains accurate information about glycan sequence, anomericity and linkage of the glycosidic bond (1, 2). Furthermore, NMR is a non-destructive technique that allows one to work in conditions similar to the physiological environment of glycans, but necessitates of large amount of sample. Several studies have shown that this method is able to determine oligosaccharide conformation, provide information about protein-oligosaccharide complexes, and understand the dynamics behind glycan-host interactions (3).
Nuclear Overhauser effect (NOE) spectroscopy and J coupling constants in addition to molecular dynamics (MD) protocols can provide the three-dimensional structure of a glycan (4), and determine the anomericity of its glycosidic bonds (5). NOE spectroscopy is very powerful because it provides local information (nuclei have to be within 5 Å close in space) about the glycan geometry, but it has difficulties in
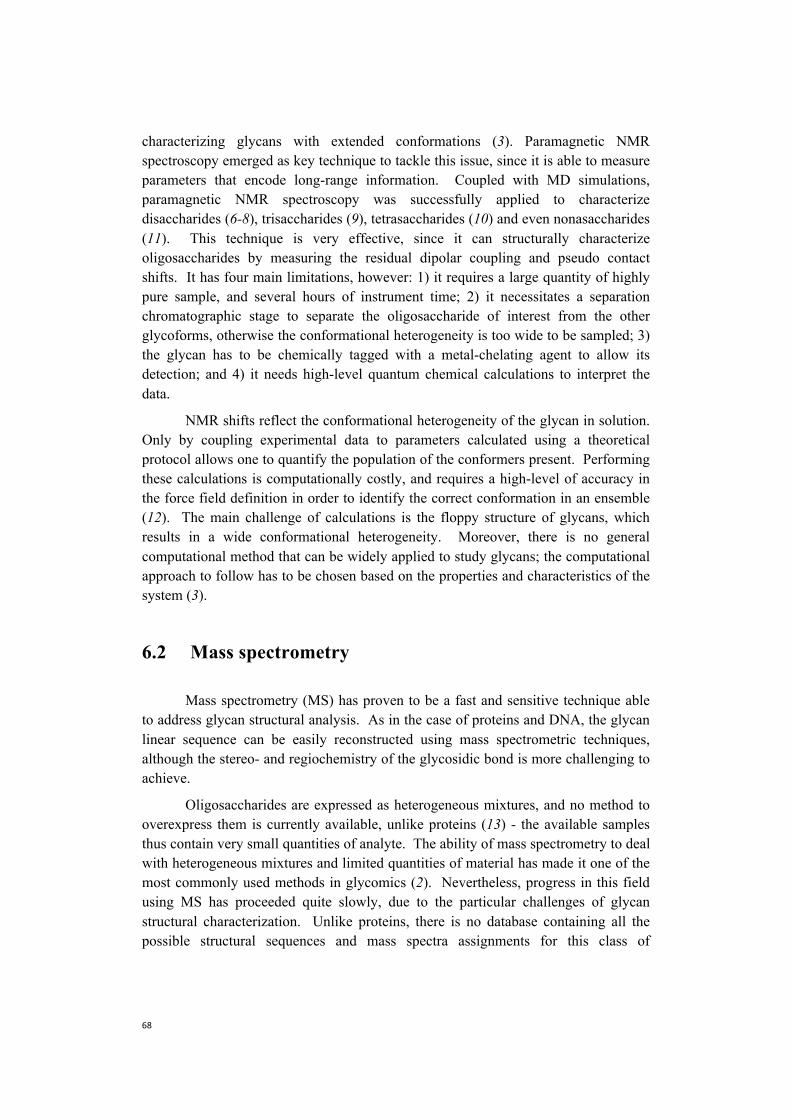
characterizing glycans with extended conformations (3). Paramagnetic NMR spectroscopy emerged as key technique to tackle this issue, since it is able to measure parameters that encode long-range information. Coupled with MD simulations, paramagnetic NMR spectroscopy was successfully applied to characterize disaccharides (6-8), trisaccharides (9), tetrasaccharides (10) and even nonasaccharides (11). This technique is very effective, since it can structurally characterize oligosaccharides by measuring the residual dipolar coupling and pseudo contact shifts. It has four main limitations, however: 1) it requires a large quantity of highly pure sample, and several hours of instrument time; 2) it necessitates a separation chromatographic stage to separate the oligosaccharide of interest from the other glycoforms, otherwise the conformational heterogeneity is too wide to be sampled; 3) the glycan has to be chemically tagged with a metal-chelating agent to allow its detection; and 4) it needs high-level quantum chemical calculations to interpret the data.
NMR shifts reflect the conformational heterogeneity of the glycan in solution. Only by coupling experimental data to parameters calculated using a theoretical protocol allows one to quantify the population of the conformers present. Performing these calculations is computationally costly, and requires a high-level of accuracy in the force field definition in order to identify the correct conformation in an ensemble (12). The main challenge of calculations is the floppy structure of glycans, which results in a wide conformational heterogeneity. Moreover, there is no general computational method that can be widely applied to study glycans; the computational approach to follow has to be chosen based on the properties and characteristics of the system (3).
6.2 Mass spectrometry
Mass spectrometry (MS) has proven to be a fast and sensitive technique able to address glycan structural analysis. As in the case of proteins and DNA, the glycan linear sequence can be easily reconstructed using mass spectrometric techniques, although the stereo- and regiochemistry of the glycosidic bond is more challenging to achieve.
Oligosaccharides are expressed as heterogeneous mixtures, and no method to overexpress them is currently available, unlike proteins (13) - the available samples thus contain very small quantities of analyte. The ability of mass spectrometry to deal with heterogeneous mixtures and limited quantities of material has made it one of the most commonly used methods in glycomics (2). Nevertheless, progress in this field using MS has proceeded quite slowly, due to the particular challenges of glycan structural characterization. Unlike proteins, there is no database containing all the possible structural sequences and mass spectra assignments for this class of
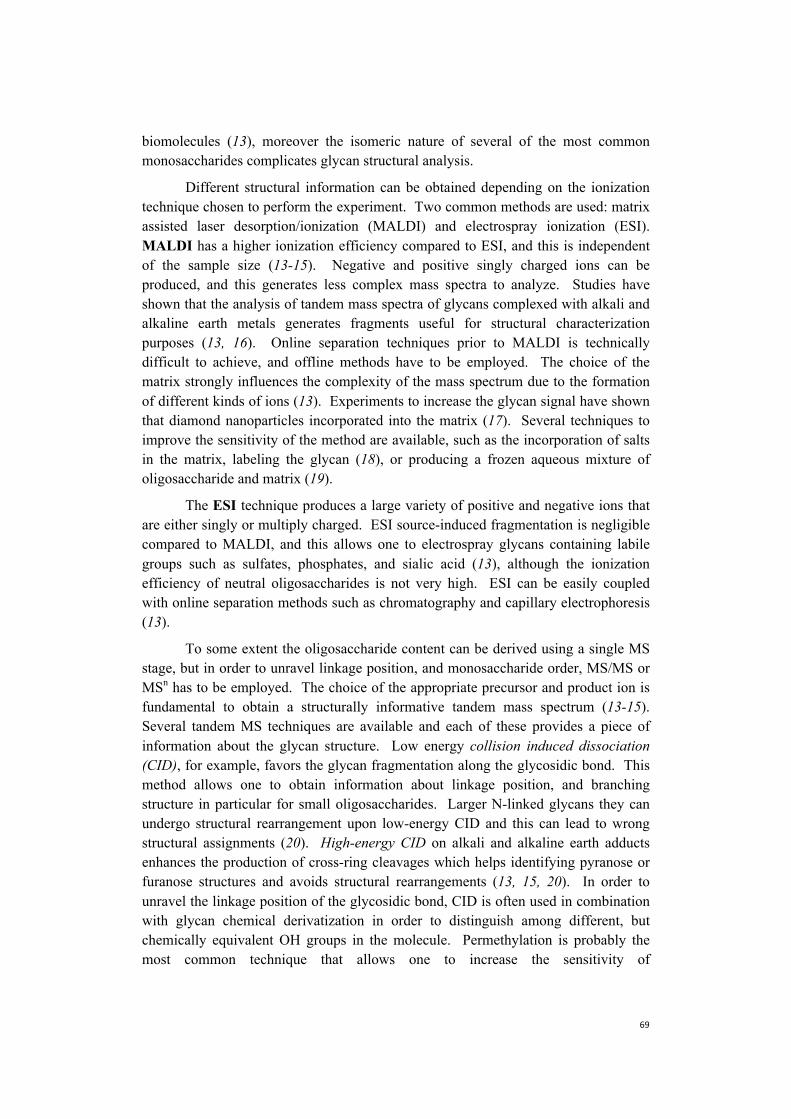
biomolecules (13), moreover the isomeric nature of several of the most common monosaccharides complicates glycan structural analysis.
Different structural information can be obtained depending on the ionization technique chosen to perform the experiment. Two common methods are used: matrix assisted laser desorption/ionization (MALDI) and electrospray ionization (ESI). MALDI has a higher ionization efficiency compared to ESI, and this is independent of the sample size (13-15). Negative and positive singly charged ions can be produced, and this generates less complex mass spectra to analyze. Studies have shown that the analysis of tandem mass spectra of glycans complexed with alkali and alkaline earth metals generates fragments useful for structural characterization purposes (13, 16). Online separation techniques prior to MALDI is technically difficult to achieve, and offline methods have to be employed. The choice of the matrix strongly influences the complexity of the mass spectrum due to the formation of different kinds of ions (13). Experiments to increase the glycan signal have shown that diamond nanoparticles incorporated into the matrix (17). Several techniques to improve the sensitivity of the method are available, such as the incorporation of salts in the matrix, labeling the glycan (18), or producing a frozen aqueous mixture of oligosaccharide and matrix (19).
The ESI technique produces a large variety of positive and negative ions that are either singly or multiply charged. ESI source-induced fragmentation is negligible compared to MALDI, and this allows one to electrospray glycans containing labile groups such as sulfates, phosphates, and sialic acid (13), although the ionization efficiency of neutral oligosaccharides is not very high. ESI can be easily coupled with online separation methods such as chromatography and capillary electrophoresis (13).
To some extent the oligosaccharide content can be derived using a single MS stage, but in order to unravel linkage position, and monosaccharide order, MS/MS or MSn has to be employed. The choice of the appropriate precursor and product ion is fundamental to obtain a structurally informative tandem mass spectrum (13-15). Several tandem MS techniques are available and each of these provides a piece of information about the glycan structure. Low energy collision induced dissociation (CID), for example, favors the glycan fragmentation along the glycosidic bond. This method allows one to obtain information about linkage position, and branching structure in particular for small oligosaccharides. Larger N-linked glycans they can undergo structural rearrangement upon low-energy CID and this can lead to wrong structural assignments (20). High-energy CID on alkali and alkaline earth adducts enhances the production of cross-ring cleavages which helps identifying pyranose or furanose structures and avoids structural rearrangements (13, 15, 20). In order to unravel the linkage position of the glycosidic bond, CID is often used in combination with glycan chemical derivatization in order to distinguish among different, but chemically equivalent OH groups in the molecule. Permethylation is probably the most common technique that allows one to increase the sensitivity of
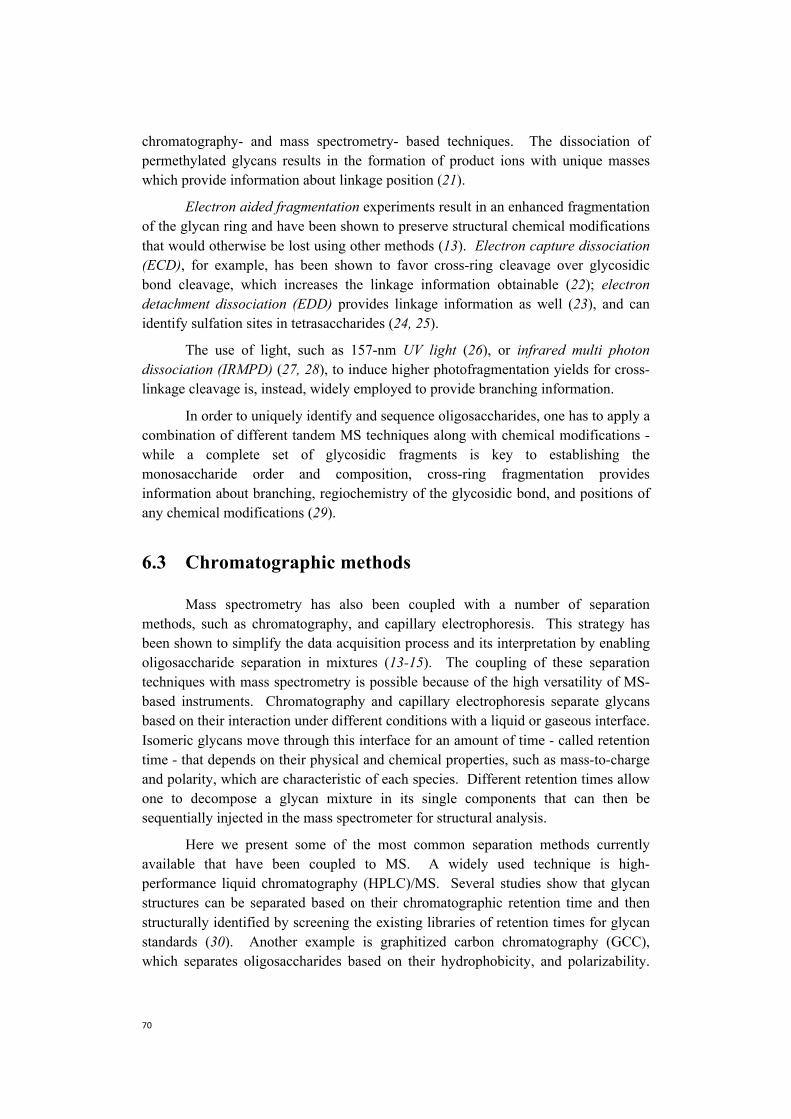
chromatography- and mass spectrometry- based techniques. The dissociation of permethylated glycans results in the formation of product ions with unique masses which provide information about linkage position (21).
Electron aided fragmentation experiments result in an enhanced fragmentation of the glycan ring and have been shown to preserve structural chemical modifications that would otherwise be lost using other methods (13). Electron capture dissociation (ECD), for example, has been shown to favor cross-ring cleavage over glycosidic bond cleavage, which increases the linkage information obtainable (22); electron detachment dissociation (EDD) provides linkage information as well (23), and can identify sulfation sites in tetrasaccharides (24, 25).
The use of light, such as 157-nm UV light (26), or infrared multi photon dissociation (IRMPD) (27, 28), to induce higher photofragmentation yields for cross-linkage cleavage is, instead, widely employed to provide branching information.
In order to uniquely identify and sequence oligosaccharides, one has to apply a combination of different tandem MS techniques along with chemical modifications - while a complete set of glycosidic fragments is key to establishing the monosaccharide order and composition, cross-ring fragmentation provides information about branching, regiochemistry of the glycosidic bond, and positions of any chemical modifications (29).
6.3 Chromatographic methods
Mass spectrometry has also been coupled with a number of separation methods, such as chromatography, and capillary electrophoresis. This strategy has been shown to simplify the data acquisition process and its interpretation by enabling oligosaccharide separation in mixtures (13-15). The coupling of these separation techniques with mass spectrometry is possible because of the high versatility of MS-based instruments. Chromatography and capillary electrophoresis separate glycans based on their interaction under different conditions with a liquid or gaseous interface. Isomeric glycans move through this interface for an amount of time - called retention time - that depends on their physical and chemical properties, such as mass-to-charge and polarity, which are characteristic of each species. Different retention times allow one to decompose a glycan mixture in its single components that can then be sequentially injected in the mass spectrometer for structural analysis.
Here we present some of the most common separation methods currently available that have been coupled to MS. A widely used technique is high-performance liquid chromatography (HPLC)/MS. Several studies show that glycan structures can be separated based on their chromatographic retention time and then structurally identified by screening the existing libraries of retention times for glycan standards (30). Another example is graphitized carbon chromatography (GCC), which separates oligosaccharides based on their hydrophobicity, and polarizability.
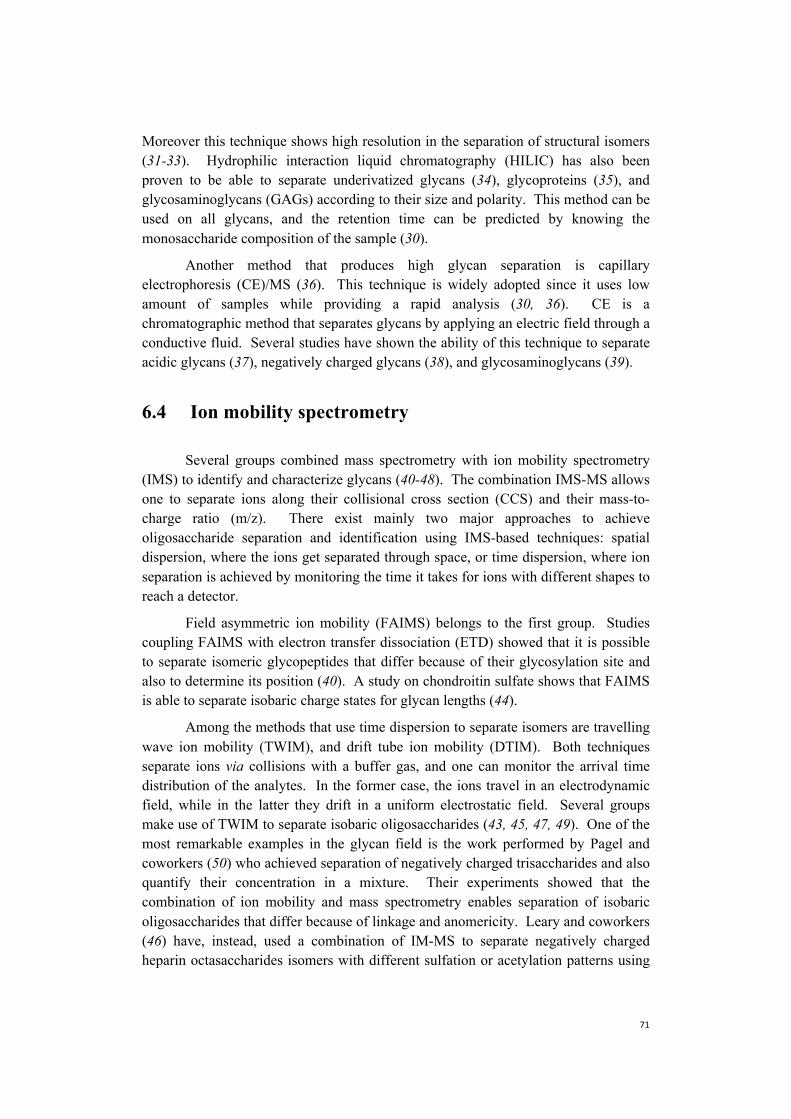
Moreover this technique shows high resolution in the separation of structural isomers (31-33). Hydrophilic interaction liquid chromatography (HILIC) has also been proven to be able to separate underivatized glycans (34), glycoproteins (35), and glycosaminoglycans (GAGs) according to their size and polarity. This method can be used on all glycans, and the retention time can be predicted by knowing the monosaccharide composition of the sample (30).
Another method that produces high glycan separation is capillary electrophoresis (CE)/MS (36). This technique is widely adopted since it uses low amount of samples while providing a rapid analysis (30, 36). CE is a chromatographic method that separates glycans by applying an electric field through a conductive fluid. Several studies have shown the ability of this technique to separate acidic glycans (37), negatively charged glycans (38), and glycosaminoglycans (39).
6.4 Ion mobility spectrometry
Several groups combined mass spectrometry with ion mobility spectrometry (IMS) to identify and characterize glycans (40-48). The combination IMS-MS allows one to separate ions along their collisional cross section (CCS) and their mass-to-charge ratio (m/z). There exist mainly two major approaches to achieve oligosaccharide separation and identification using IMS-based techniques: spatial dispersion, where the ions get separated through space, or time dispersion, where ion separation is achieved by monitoring the time it takes for ions with different shapes to reach a detector.
Field asymmetric ion mobility (FAIMS) belongs to the first group. Studies coupling FAIMS with electron transfer dissociation (ETD) showed that it is possible to separate isomeric glycopeptides that differ because of their glycosylation site and also to determine its position (40). A study on chondroitin sulfate shows that FAIMS is able to separate isobaric charge states for glycan lengths (44).
Among the methods that use time dispersion to separate isomers are travelling wave ion mobility (TWIM), and drift tube ion mobility (DTIM). Both techniques separate ions via collisions with a buffer gas, and one can monitor the arrival time distribution of the analytes. In the former case, the ions travel in an electrodynamic field, while in the latter they drift in a uniform electrostatic field. Several groups make use of TWIM to separate isobaric oligosaccharides (43, 45, 47, 49). One of the most remarkable examples in the glycan field is the work performed by Pagel and coworkers (50) who achieved separation of negatively charged trisaccharides and also quantify their concentration in a mixture. Their experiments showed that the combination of ion mobility and mass spectrometry enables separation of isobaric oligosaccharides that differ because of linkage and anomericity. Leary and coworkers (46) have, instead, used a combination of IM-MS to separate negatively chargedheparin octasaccharides isomers with different sulfation or acetylation patterns using
a Synapt G2 HDMS system. They noticed that the addition of a sodium cation for anionic species of same charge state but different sulfation pattern increases the difference in arrival time, allowing for identification.
Experiments show that ion mobility spectrometry in negative mode can be used to identify the majority of isomeric glycans based on their collisional cross section (43, 45, 50). This ionization technique has a down side, however: producing anionic species can be technically difficult considering their tendency to cluster with sodium normally present in solution. On the other hand, ion mobility on sodiated isobaric oligosaccharides or performed in positive ion mode has been shown to distinguish isobaric oligosaccharides less efficiently than the negative ion mode (50).
One advantage of using DTIM techniques over TWIM is that average collisional cross section measurements (which provide structural information on the ions of study) can be immediately extracted by the drift time distribution of the species of interest. TWIM, instead, requires the use of calibrants, for which the CCS is known from previous experiments, to provide the same information (43, 47). There are innumerable studies of glycans using DTIM for the analysis of oligosaccharides in complex mixtures, with and without previous purification of the samples (41, 42, 47, 48, 51-53). DTIM was used in the study of glycans related to important pathologies, such as cancer and cirrhosis, and it demonstrated predictive power to define the physiological state of cells (54, 55).
One limitation of combining IM and MS is that the separation of glycan isomers is not always possible, particularly for small oligosaccharides (42). Moreover this technique is not sensitive enough to determine glycan composition: exchanging one monosaccharide in the glycan sequence with one of its isomers does not result in a detectable shift in the glycan CCS (50).
6.5 Spectroscopy
One of the pioneers in the spectroscopic studies of glycans is Simons’s group. They used cryogenic IR-UV double resonance spectroscopy to investigate the conformational preferences of neutral oligosaccharides labeled with an aromatic chromophore. Jockusch et al. (56), for example, probed the structure of benzyl lactoside. Due to the relative small size of the molecule, DFT calculations were able to provide a good agreement with the experimental data, so to retrieve the oligosaccharide structure. The simplification introduced by the cryogenic temperatures makes vibrational spectra a stringent constraint for the calculations. They also investigated the role played by water on several monosaccharides during the hydration process (57).
More recently, several laboratories have added a spectroscopic dimension to IMS-MS measurements to achieve glycan isomer discrimination. Along these lines, Hernandez et al. (58) combined differential IMS (DIMS) with infrared multi-photon
dissociation (IRMPD) spectroscopy to study mono-hydrated, methylated monosaccharides. While they demonstrated small differences in the IR spectrum of α and β anomers, the low resolution of DIMS is unlikely to be able to separate larger species. Polfer and coworkers (59, 60) successfully combined IRMPD with high-resolution MS for the identification of disaccharides, but the room temperature IRMPD spectra were too broad to uniquely identify isomeric disaccharides in a mixture. Compagnon and coworkers (61) applied MS-IRMPD to resolve positional isomers of sulfated carbohydrates. They could collect fingerprints in the near and mid-infrared regions for sulfated monosaccharides, although the identification of these saccharides from the room temperature spectra seems challenging. Perhaps Mucha et al. (62) illustrated the most successful use of spectroscopy related to oligosaccharide analysis. In their recent paper, they embed oligosaccharides composed of up to four monomers in helium droplets to obtain their spectroscopic fingerprints. The spectra represent unambiguous signatures for each glycan, and this study clearly shows the importance of low temperatures for structural identification. Unfortunately, the complexity of their experimental setup, does not make their approach easy to develop into a more broadly accessible technique.
One important aspect of spectroscopic studies is the need of comparing the experimental spectra with computed spectra to obtain the glycan structure. One of the major challenges for vibrational spectroscopy calculations is the description of anharmonic effects (63, 64). Harmonic spectra calculations are feasible, but their agreement with experimental data is limited, due to the important role played by anharmonic effects for this class of biomolecules (65). Moreover, empirical force fields and semiempirical approaches are shown not to reproduce the reference energy hierarchies accurately (63, 66). DFT approximations proved to better grasp energy hierarchies, but are computationally costly due to the rich conformational diversity that glycans possess (66). This drastically limits the feasibility of calculations for large oligosaccharides.
6.6 The database approach
Considering the importance of glycans in biological systems, one needs a way to store and read the data available for glycan analysis in an easily accessible fashion for scientists worldwide (67). In fact, just a few years ago, only a limited amount of information on this class of biomolecules was available. Over the last few years the concerted effort of scientists around the world has produced a large amount of data that requires powerful and sophisticated database (DB) software.
The first database for glycans, Complex Carbohydrate Structure Database (CCSC) (68) was born in the eighties as a resource for identifying glycan structures. After its funding ceased, its information was incorporated in EuroCarb-DB (69), GlycomeDB (70) and UniCarbKB (71). Nowadays, there exist several databases that we can separate in two main classes: 1) those that provide experimental data to
identify and characterize glycans; and 2) those that contain biochemical information including measurements on glycan-binding proteins, enzymes involved in glycan metabolism, glycotransferases, and so on.
In the first group we find GlycoBase (72), developed by the Université de Lille 1. This DB contains nuclear magnetic resonance data for glycans isolated from different animal species. Originally part of the EuroCarbDB (69) project, GlycoBase (73) (National Institute for Bioprocessing Research and Training) is a databasecontaining data acquired using chromatographic techniques and their correspondingglycan structures. This DB evolved to match the needs of the chromatographycommunity, and contains more than 300 retention datasets for predicting N-linkedglycan structures. Another broadly exploited database is UniCarb-DB (74) whichprovides glycan structures with LC-MS data. Moreover, it also contains data fromporous graphitized carbon PGC-LC-MS/MS collected using an ion trap to performCID measurements. UniCarbKB (71) instead is an open-access data repository,which was built to allow users to navigate through UniCarb-DB, GlycoBase, andGlycoSuiteDB (75), which is a database of glycan structures collated from theliterature between 1990 and 2005. GlycoMob (76) contains ion mobility-massspectrometry data to identify glycans based on their CCS and mass - it contains alarge variety of data in positive and negative ion mode.
In the second group of DBs - those which contain biochemical information about glycans - we find the Japan Consortium for Glycobiology and Glycotechnology Database (JCGGDB) (77), which contains a collection of glycan-related DBs referring to glycan functions, glycogens, and glycol-related diseases. Another database containing glycan array screening data for identifying glycan structures, glycan-binding proteins and glycosyltransferases is the Consortium for Functional Glycomics (CFG) (78), while information about enzymes and their role in carbohydrate degradation and modification can be found in the Carbohydrate-Active Enzymes (CAZy) (79) DB.
In November 2012, the Minimum Information Required for a Glycomics Experiment (MIRAGE) (80) initiative was born. The aim of this project is to standardize data storage methods, and exchange formats for glycan experiments. The committee responsible for this project provides guidelines to produce DBs and data that can easily be accessed and re-interpreted. Guidelines for MS, LC and glycan arrays experiments became available in June 2016. Moreover, an increasing number of resources to visualize, build and analyze glycan structures are now available (67). From the number of DBs currently available, it appears clearly that the need for collecting information to identify and characterize glycans is paramount, along with the need for a user-friendly and open-access platform to share and obtain data. The diffusion and abundance of these sorts of databases underline as well the direction taken from the glycomics analytical community to face the problem of glycan identification.
6.7 Limitations of the currently available methods for glycan analysis
All the techniques presented in the previous sections present limitations that undermine glycan identification, in particular when analyzing mixtures of isomeric oligosaccharides. Despite NMR was for long time the gold-standard to structurally characterize glycans, the large amount of highly pure sample that it requires, together with the high-level quantum chemical calculations (12) that are needed to interpret the data, led towards the development of new techniques. Mass spectrometry is one of those, and it proved to be an extremely efficient technique to identify linear glycan sequence (13), and linkage positions (21-23). However, it still presents difficulties in characterizing the anomericity of the glycosidic bond, and the sequence order in glycan isomers (20).
The analysis and identification of glycans in mixtures can be expedited by using a combination of chromatographic methods before performing tandem MS (13, 15, 30). However, despite the retention time is a property characteristic of each glycan-interface couple, glycans can have retention times of the order of hours, and this heavily limits high-throughput techniques. Moreover, the retention times of different glycans can overlap decreasing the effectiveness of this technique when analyzing a mixture. Furthermore, both NMR and MS necessitate a prior chemical labeling or derivatization, in addition to a chromatographic stage to structurally characterize the oligosaccharide of interest. The complexity of the procedures required to sequentially chemically modify the analytes, in particular for tandem MS, open questions about the conservation of anomericity and linkage in glycan fragments (20). Moreover, the time required for derivatization and chromatography significantly slow down the experimental procedures.
The addition of ion mobility to mass spectrometry permits the identification of glycan isomers, in particular when glycans are produced as anionic species. However, this technique presents limitations in determining the monosaccharide content in isomeric oligosaccharides (50), and examples show that it is not sensitive enough to distinguish glycans having very close structure (42).
IR-UV and IRMPD spectroscopy can be applied, as well, to the study of oligosaccharides in the gas-phase. These techniques provide fingerprints of isomeric glycans, but the high temperatures at which the experiments are performed undermine oligosaccharide identification in mixtures, due to the low spectra resolution (59, 60). Cold ion spectroscopy, however, overcomes this problem and provides cleaner and simpler fingerprints that allow for glycan structural identification (62). Unfortunately, structural calculations to interpret glycan vibrational spectra limit the effectiveness of this experimental method, due to the difficulties of theory in performing a complete structural search (63, 64). Moreover, vibrational spectra

calculations are computationally costly. Both these factors arise from the intrinsic structural complexity and heterogeneity of oligosaccharide conformations.
In order to overcome the limitations that the previous methods present, we have developed a new technique to identify glycans. By coupling mass spectrometry, ion mobility, and cryogenic vibrational spectroscopy, we show that we are able to provide unambiguous identification of glycan isomers. Moreover, our approach does not require sample derivatization, or quantum chemical calculations, and it is able to identify all glycan isomerisms. We present this method, and its prove of principle in the following chapters of this thesis.
References
1. M. F. Chaplin, Kennedy, J.F., Carbohydrate Analysis: A Practical Approach.(Oxford University Press, New York, ed. 2nd, 1994).
2. G. Smith, J. A. Leary, Differentiation of stereochemistry of glycosidic bondconfiguration: Tandem mass spectrometry of diastereomeric cobalt-glucosyl-glucose disaccharide complexes. Journal of the American Society for MassSpectrometry 7, 953-957 (1996).
3. A. C. M. Alvaro Berbis, Javier Sastre-Martinez, Luca Unione, M. C.Fernandez-Alonso, Pilar Blasco, F. Javier Canada and Jesus Jimenez-Barbero,in Carbohydrate Chemistry: State of the Art and Challenges for DrugDevelopment. chap. 121, pp. 25.
4. G. Widmalm, A perspective on the primary and three-dimensional structuresof carbohydrates. Carbohyd Res 378, 123-132 (2013).
5. M. E. T. a. K. Drickamer, Introduction to Glycobiology - Third Edition.(Oxford University Press, 2011).
6. M. Erdelyi, E. d'Auvergne, A. Navarro-Vazquez, A. Leonov, C. Griesinger,Dynamics of the Glycosidic Bond: Conformational Space of Lactose.Chemistry - A European Journal 17, 9368-9376 (2011).
7. A. Mallagaray, A. Canales, G. Dominguez, J. Jimenez-Barbero, J. Perez-Castells, A rigid lanthanide binding tag for NMR structural analysis ofcarbohydrates. Chemical Communications 47, 7179-7181 (2011).
8. M. Martin-Pastor, A. Canales, F. Corzana, J. L. Asensio, J. Jimenez-Barbero,Limited flexibility of lactose detected from residual dipolar couplings usingmolecular dynamics simulations and steric alignment methods. Journal of theAmerican Chemical Society 127, 3589-3595 (2005).
9. S. Yamamoto, Y. Zhang, T. Yamaguchi, T. Kameda, K. Kato, Lanthanide-assisted NMR evaluation of a dynamic ensemble of oligosaccharideconformations. Chemical Communications 48, 4752-4754 (2012).
10. Y. Zhang, S. Yamamoto, T. Yamaguchi, K. Kato, Application ofParamagnetic NMR-Validated Molecular Dynamics Simulation to the
Analysis of a Conformational Ensemble of a Branched Oligosaccharide. Molecules 17, 6658-6671 (2012).
11. A. Canales et al., Breaking Pseudo-Symmetry in Multiantennary Complex N-Glycans Using Lanthanide-Binding Tags and NMR Pseudo-Contact Shifts.Angewante Chemie International Edition 52, 13789-13793 (2013).
12. E. Fadda, R. J. Woods, Molecular simulations of carbohydrates and protein-carbohydrate interactions: motivation, issues and prospects. Drug DiscoveryToday 15, 596-609 (2010).
13. M. J. Kailemia, L. R. Ruhaak, C. B. Lebrilla, I. J. Amster, OligosaccharideAnalysis by Mass Spectrometry: A Review of Recent Developments.Analytical Chemistry 86, 196-212 (2014).
14. E. a. S. de Hoffman, V., in Mass Spectrometry Principle and ApplicationsWiley, Ed. (2009), pp. 357-371.
15. J. Zaia, Mass spectrometry of oligosaccharides. Mass Spectrometry Review 23,161-227 (2004).
16. W. Zhou, K. Hakansson, Structural Characterization of Carbohydrates byFourier Transform Tandem Mass Spectrometry. Current Proteomics 8, 297-308 (2011).
17. C. L. Wu et al., Selective Enhancement of Carbohydrate Ion Abundances byDiamond Nanoparticles for Mass Spectrometric Analysis. AnalyticalChemistry 85, 3836-3841 (2013).
18. K. Kaneshiro, Y. Fukuyama, S. Iwamoto, S. Sekiya, K. Tanaka, HighlySensitive MALDI Analyses of Glycans by a New Aminoquinoline-LabelingMethod Using 3-Aminoquinoline/alpha-Cyano-4-hydroxycinnamic AcidLiquid Matrix. Analytical Chemistry 83, 3663-3667 (2011).
19. C. W. Liang, P. J. Chang, Y. J. Lin, Y. T. Lee, C. K. Ni, High Ion Yields ofCarbohydrates from Frozen Solution by UV-MALDI. Analytical Chemistry84, 3493-3499 (2012).
20. M. Wuhrer, A. M. Deelder, Y. E. van der Burgt, Mass spectrometric glycanrearrangements. Mass Spectrometry Review 30, 664-680 (2011).
21. W. Morelle, V. Faid, J. C. Michalski, Structural analysis of permethylatedoligosaccharides using electrospray ionization quadrupole time-of-flighttandem mass spectrometry and deutero-reduction. Rapid Communication inMass Spectrometry 18, 2451-2464 (2004).
22. J. T. Adamson, K. Hakansson, Electron capture dissociation ofoligosaccharides ionized with alkali, alkaline earth, and transition metals.Analytical Chemistry 79, 2901-2910 (2007).
23. J. T. Adamson, K. Hakansson, Electron detachment dissociation of neutral andsialylated oligosaccharides. Journal of the American Society for MassSpectrometry 18, 2162-2172 (2007).
24. J. J. Wolff, I. J. Amster, L. L. Chi, R. J. Linhardt, Electron detachmentdissociation of glycosaminoglycan tetrasaccharides. Journal of the AmericanSociety for Mass Spectrometry 18, 234-244 (2007).
25. J. J. Wolff, L. L. Chi, R. J. Linhardt, I. J. Amster, Distinguishing glucuronicfrom iduronic acid in glycosaminoglycan tetrasaccharides by using electrondetachment dissociation. Analytical Chemistry 79, 2015-2022 (2007).
26. A. Devakumar, Y. Mechref, P. Kang, M. V. Novotny, J. P. Reilly,Identification of isomeric N-glycan structures by mass spectrometry with 157nm laser-induced photofragmentation. Journal of the American Society forMass Spectrometry 19, 1027-1040 (2008).
27. Z. Zhuang, J. A. Starkey, Y. Mechref, M. V. Novotny, S. C. Jacobson,Electrophoretic analysis of N-glycans on microfluidic devices. AnaliticalChemistry 79, 7170-7175 (2007).
28. M. Pikulski, A. Hargrove, S. H. Shabbir, E. V. Anslyn, J. S. Brodbelt,Sequencing and characterization of oligosaccharides using infraredmultiphoton dissociation and boronic acid derivatization in a quadrupole iontrap. Journal of the American Society for Mass Spectrometry 18, 2094-2106(2007).
29. M. J. Kailemia, L. R. Ruhaak, C. B. Lebrilla, I. J. Amster, Oligosaccharideanalysis by mass spectrometry: a review of recent developments. AnaliticalChemistry 86, 196-212 (2014).
30. J. Zaia, Mass Spectrometry and Glycomics. Omics 14, 401-418 (2010).31. S. Itoh et al., Simultaneous microanalysis of N-linked oligosaccharides in a
glycoprotein using microbore graphitized carbon column liquidchromatography-mass spectrometry. Journal of Chromatography A 968, 89-100 (2002).
32. M. Ninonuevo et al., Nanoliquid chromatography-mass spectrometry ofoligosaccharides employing graphitized carbon chromatography on microchipwith a high-accuracy mass analyzer. Electrophoresis 26, 3641-3649 (2005).
33. C. E. Costello, J. M. Contado-Miller, J. F. Cipollo, A glycomics platform forthe analysis of permethylated oligosaccharide alditols. Journal of theAmerican Society for Mass Spectrometry 18, 14 (2017).
34. M. Wuhrer, C. A. M. Koeleman, A. M. Deelder, C. N. Hokke, Normal-phasenanoscale liquid chromatography - Mass spectrometry of underivatizedoligosaccharides at low-femtomole sensitivity. Analytical Chemistry 76, 833-838 (2004).
35. M. Butler et al., Detailed glycan analysis of serum glycoproteins of patientswith congenital disorders of glycosylation indicates the specific defectiveglycan processing step and provides an insight into pathogenesis.Glycobiology 13, 601-622 (2003).
36. Y. Mechref, M. V. Novotny, Glycomic analysis by capillary electrophoresis-mass spectrometry. Mass Spectrometry Review 28, 207-222 (2009).
37. M. Militsopoulou, F. N. Lamari, A. Hjerpe, N. K. Karamanos, Determinationof twelve heparin- and heparan sulfate-derived disaccharides as 2-aminoacridone derivatives by capillary zone electrophoresis using ultravioletand laser-induced fluorescence detection. Electrophoresis 23, 1104-1109(2002).
38. L. A. Gennaro, J. Delaney, P. Vouros, D. J. Harvey, B. Domon, Capillaryelectrophoresis/electrospray ion trap mass spectrometry for the analysis ofnegatively charged derivatized and underivatized glycans. RapidCommunications in Mass Spectrometry 16, 192-200 (2002).
39. A. Zamfir, D. G. Seidler, E. Schonherr, H. Kresse, J. Peter-Katalinic, On-linesheathless capillary electrophoresis/nanoelectrospray ionization-tandem massspectrometry for the analysis of glycosaminoglycan oligosaccharides.Electrophoresis 25, 2010-2016 (2004).
40. A. J. Creese, H. J. Cooper, Separation and Identification of IsomericGlycopeptides by High Field Asymmetric Waveform Ion MobilitySpectrometry. Analytical Chemistry 84, 2597-2601 (2012).
41. L. S. Fenn, J. A. McLean, Structural resolution of carbohydrate positional andstructural isomers based on gas-phase ion mobility-mass spectrometry.Physical Chemistry Chemical Physics 13, 2196-2205 (2011).
42. M. M. Gaye, R. Kurulugama, D. E. Clemmer, Investigating carbohydrateisomers by IMS-CID-IMS-MS: precursor and fragment ion cross-sections.Analyst 140, 6922-6932 (2015).
43. J. Hofmann et al., Identification of Lewis and Blood Group CarbohydrateEpitopes by Ion Mobility-Tandem-Mass Spectrometry Fingerprinting.Analytical Chemistry 89, 2318-2325 (2017).
44. M. J. Kailemia et al., High-Field Asymmetric-Waveform Ion MobilitySpectrometry and Electron Detachment Dissociation of Isobaric Mixtures ofGlycosaminoglycans. Journal of the American Society for Mass Spectrometry25, 258-268 (2014).
45. K. Pagel, D. J. Harvey, Ion Mobility-Mass Spectrometry of ComplexCarbohydrates: Collision Cross Sections of Sodiated N-linked Glycans.Analytical Chemistry 85, 5138-5145 (2013).
46. Y. Seo, A. Andaya, J. A. Leary, Preparation, separation, and conformationalanalysis of differentially sulfated heparin octasaccharide isomers using ionmobility mass spectrometry. Analytical Chemistry 84, 2416-2423 (2012).
47. J. P. Williams et al., Characterization of simple isomeric oligosaccharides andthe rapid separation of glycan mixtures by ion mobility mass spectrometry.International Journal of Mass Spectrometry 298, 119-127 (2010).
48. M. Zhu, B. Bendiak, B. Clowers, H. H. Hill, Jr., Ion mobility-massspectrometry analysis of isomeric carbohydrate precursor ions. Analytical andBioanalytical Chemistry 394, 1853-1867 (2009).
49. P. Both et al., Discrimination of epimeric glycans and glycopeptides usingIM-MS and its potential for carbohydrate sequencing. Nature Chemistry 6, 65-74 (2014).
50. J. Hofmann, H. S. Hahm, P. H. Seeberger, K. Pagel, Identification ofcarbohydrate anomers using ion mobility-mass spectrometry. Nature 526,241-+ (2015).
51. Y. S. Liu, D. E. Clemmer, Characterizing oligosaccharides using injected-ionmobility mass spectrometry. Analytical Chemistry 69, 2504-2509 (1997).
52. F. Zhu, S. Lee, S. J. Valentine, J. P. Reilly, D. E. Clemmer, Mannose7 glycanisomer characterization by IMS-MS/MS analysis. Journal of the AmericanSociety for Mass Spectrometry 23, 2158-2166 (2012).
53. M. M. Gaye, G. Nagy, D. E. Clemmer, N. L. Pohl, Multidimensional Analysisof 16 Glucose Isomers by Ion Mobility Spectrometry. Analytical Chemistry88, 2335-2344 (2016).
54. D. Isailovic, Kurulugama, R.T., Plasencia, M.D., Stokes, S.T., Kyselova, Z.,Goldman, R., Mechref, Y., Novotny, M.V., Clemmer, D.E., Profiling ofhuman serum glycans associated with live cancer and cirrhosis by IMS-MS.Journal of Proteome Research 7, 8 (2008).
55. D. Isailovic et al., Delineating diseases by IMS-MS profiling of serum N-linked glycans. Journal of Proteome Research 11, 576-585 (2012).
56. R. A. Jockusch et al., Probing the glycosidic linkage: UV and IR ion-dipspectroscopy of a lactoside. Journal of the American Chemical Society 126,5709-5714 (2004).
57. J. P. Simons, B. G. Davis, E. J. Cocinero, D. P. Gamblin, E. C. Stanca-Kaposta, Conformational change and selectivity in explicitly hydratedcarbohydrates. Tetrahedron-Asymmetry 20, 718-722 (2009).
58. O. Hernandez, S. Isenberg, V. Steinmetz, G. L. Glish, P. Maitre, ProbingMobility-Selected Saccharide Isomers: Selective Ion-Molecule Reactions andWavelength-Specific IR Activation. Journal of Physical Chemistry. A 119,6057-6064 (2015).
59. N. C. Polfer et al., Differentiation of isomers by wavelength-tunable infraredmultiple-photon dissociation-mass spectrometry: Application to glucose-containing disaccharides. Analytical Chemistry 78, 670-679 (2006).
60. Y. L. Tan, N. C. Polfer, Linkage and Anomeric Differentiation inTrisaccharides by Sequential Fragmentation and Variable-WavelengthInfrared Photodissociation. Journal of the American Society for MassSpectrometry. 26, 359-368 (2015).
61. B. Schindler et al., IRMPD Spectroscopy Sheds New (Infrared) Light on theSulfate Pattern of Carbohydrates. Journal of Physical Chemistry A 121, 2114-2120 (2017).
62. E. Mucha et al., Glycan Fingerprinting using Cold-Ion Infrared Spectroscopy.Angew Chem Int Ed Engl, (2017).
63. B. Brauer et al., Vibrational Spectra of alpha-Glucose, beta-Glucose, andSucrose: Anharmonic Calculations and Experiment. Journal of PhysicalChemistry A 115, 5859-5872 (2011).
64. L. Barnes et al., Anharmonic simulations of the vibrational spectrum ofsulfated compounds: application to the glycosaminoglycan fragmentglucosamine 6-sulfate. Physical Chemistry Chemical Physics 17, 25705-25713(2015).
65. S. K. Gregurick, J. H. Y. Liu, D. A. Brant, R. B. Gerber, Anharmonicvibrational self-consistent field calculations as an approach to improving force
fields for monosaccharides. Journal of Physical Chemistry B 103, 3476-3488 (1999).
66. M. Marianski, A. Supady, T. Ingram, M. Schneider, C. Baldauf, Assessing theAccuracy of Across-the-Scale Methods for Predicting CarbohydrateConformational Energies for the Examples of Glucose and alpha-Maltose.Journal of Chemical Theory and Computation 12, 6157-6168 (2016).
67. C. C. Hayes, G.; Karlsson, N.; Duffy, F. and Rudd P., in Carbohydratechemistry: state of the art and challenges for drug development. pp. 7.
68. S. Doubet, K. Bock, D. Smith, A. Darvill, P. Albersheim, The ComplexCarbohydrate Structure Database. Trends Biochem Sci 14, 475-477 (1989).
69. C. W. von der Lieth et al., EUROCarbDB: An open-access platform forglycoinformatics. Glycobiology 21, 493-502 (2011).
70. R. Ranzinger, S. Herget, C. W. von der Lieth, M. Frank, GlycomeDB--aunified database for carbohydrate structures. Nucleic Acids Research 39,D373-376 (2011).
71. M. P. Campbell et al., UniCarbKB: building a knowledge platform forglycoproteomics. Nucleic Acids Research 42, D215-D221 (2014).
72. U. d. G. S. e. Fonctionelle. (http://glycobase.univ-lille1/base/, 2007).73. M. R. Campbell, L.; Radcliffe, C.; Dwek, R.; Rudd, P;. (Bioinformatics,
http://glycobase.nibrt.ie/glycobase/show_nibrt.action, 2008), vol. 24, pp.1214-1216.
74. C. A. Hayes et al., UniCarb-DB: a database resource for glycomic discovery.Bioinformatics 27, 1343-1344 (2011).
75. C. A. Cooper, H. J. Joshi, M. J. Harrison, M. R. Wilkins, N. H. Packer,GlycoSuiteDB: a curated relational database of glycoprotein glycan structuresand their biological sources. 2003 update. Nucleic Acids Research 31, 511-513(2003).
76. W. B. Struwe, K. Pagel, J. L. Benesch, D. J. Harvey, M. P. Campbell,GlycoMob: an ion mobility-mass spectrometry collision cross section databasefor glycomics. Glycoconjugate Journal 33, 399-404 (2016).
77. J. C. f. G. a. Glycotechnology. (http://jcggdb.jp/database_en.html, 2007).78. C. f. F. Glycomics. (http://www.functionalglycomics.org, 2010).79. B. L. Cantarel et al., The Carbohydrate-Active EnZymes database (CAZy): an
expert resource for Glycogenomics. Nucleic Acids Research 37, D233-D238(2009).
80. D. Kolarich et al., The Minimum Information Required for a GlycomicsExperiment (MIRAGE) Project: Improving the Standards for Reporting Mass-spectrometry-based Glycoanalytic Data. Molecular & Cellular Proteomics 12,991-995 (2013).
7. Experimental technique
This chapter introduces the instrument and the spectroscopic technique that we used to identify glycan primary structure. The chapter is divided in three parts: the first one presents our ion mobility spectrometer, which we used to mass- and mobility-select glycan isomers before isolating them in a cryogenic ion trap; section 7.2 explains how one can determine the collisional cross section of an ion by the measurement of its drift time. Section 7.3 explains the principles of vibrational tagging spectroscopy that we used to obtain unique spectroscopic fingerprints for glycan isomers.
7.1 Ion mobility spectrometer coupled to a cryogenic ion trap
The goal of our research is to determine the covalent structure of glycans including a specification of the monosaccharide content and sequence, the stereochemistry of the glycosidic bond, the specific regioisomer, as well as any branching that may occur. To do this we coupled a home-built linear ion mobility drift tube with a cryogenic ion trap and vibrational messenger tagging spectroscopy.
The experimental apparatus used for these experiments is shown in Figure 7.1. The glycan of interest is produced in the gas-phase via nano-electrospray ionization, and introduced into a 2.5 – 3 mbar pressure region through a metal capillary. The ions are collected in an RF ion funnel, which produces ion packets to match the experiment’s duty cycle. The ion packet is focused and injected into a 2 m linear ion mobility drift tube that is filled with ~ 3 mbar of He gas. The drift tube (DT) was provided by D. Clemmer and coworkers (1), and incorporated in our machine without major modifications. The DT is equipped with three ion funnels placed at its entrance, center, and exit, which function to keep the ion beam focused. The electric field applied along the drift region of the DT is maintained constant at 11.3 V/cm, while in the second and third ion funnels a field strength of 12.6 V/cm is used to ensure the best ion transmission (1).
If the drift time distribution contains multiple peaks, we can sample it by taking a slice using a selection gate in the middle of the drift region, which allows
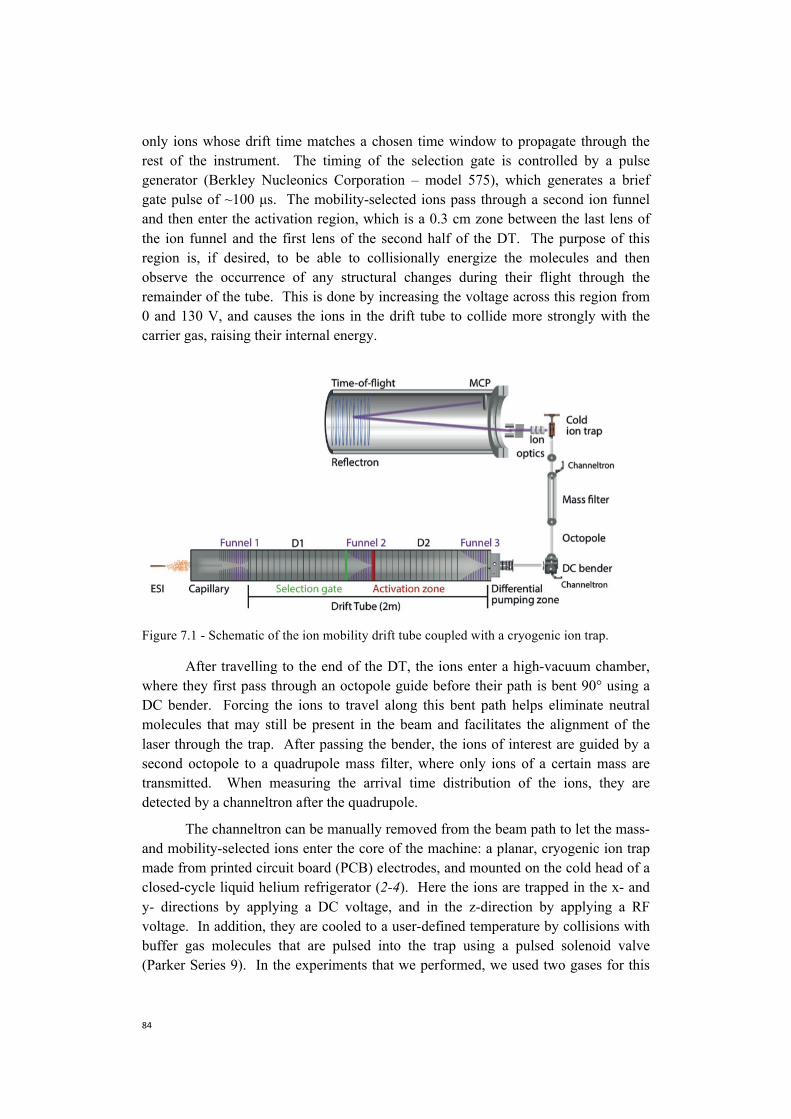
only ions whose drift time matches a chosen time window to propagate through the rest of the instrument. The timing of the selection gate is controlled by a pulse generator (Berkley Nucleonics Corporation – model 575), which generates a brief gate pulse of ~100 μs. The mobility-selected ions pass through a second ion funnel and then enter the activation region, which is a 0.3 cm zone between the last lens of the ion funnel and the first lens of the second half of the DT. The purpose of this region is, if desired, to be able to collisionally energize the molecules and then observe the occurrence of any structural changes during their flight through the remainder of the tube. This is done by increasing the voltage across this region from 0 and 130 V, and causes the ions in the drift tube to collide more strongly with the carrier gas, raising their internal energy.
Figure 7.1 - Schematic of the ion mobility drift tube coupled with a cryogenic ion trap.
After travelling to the end of the DT, the ions enter a high-vacuum chamber, where they first pass through an octopole guide before their path is bent 90° using a DC bender. Forcing the ions to travel along this bent path helps eliminate neutral molecules that may still be present in the beam and facilitates the alignment of the laser through the trap. After passing the bender, the ions of interest are guided by a second octopole to a quadrupole mass filter, where only ions of a certain mass are transmitted. When measuring the arrival time distribution of the ions, they are detected by a channeltron after the quadrupole.
The channeltron can be manually removed from the beam path to let the mass- and mobility-selected ions enter the core of the machine: a planar, cryogenic ion trap made from printed circuit board (PCB) electrodes, and mounted on the cold head of a closed-cycle liquid helium refrigerator (2-4). Here the ions are trapped in the x- and y- directions by applying a DC voltage, and in the z-direction by applying a RFvoltage. In addition, they are cooled to a user-defined temperature by collisions withbuffer gas molecules that are pulsed into the trap using a pulsed solenoid valve(Parker Series 9). In the experiments that we performed, we used two gases for this
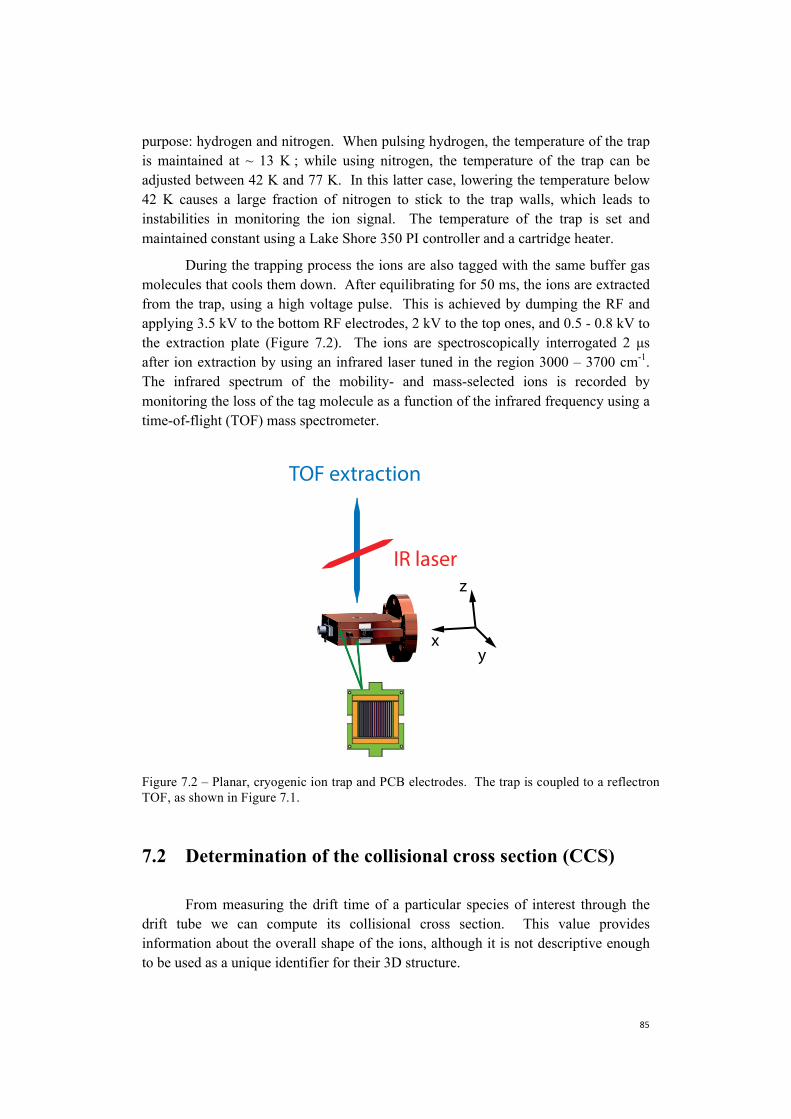
purpose: hydrogen and nitrogen. When pulsing hydrogen, the temperature of the trap is maintained at ~ 13 K ; while using nitrogen, the temperature of the trap can be adjusted between 42 K and 77 K. In this latter case, lowering the temperature below 42 K causes a large fraction of nitrogen to stick to the trap walls, which leads to instabilities in monitoring the ion signal. The temperature of the trap is set and maintained constant using a Lake Shore 350 PI controller and a cartridge heater.
During the trapping process the ions are also tagged with the same buffer gas molecules that cools them down. After equilibrating for 50 ms, the ions are extracted from the trap, using a high voltage pulse. This is achieved by dumping the RF and applying 3.5 kV to the bottom RF electrodes, 2 kV to the top ones, and 0.5 - 0.8 kV to the extraction plate (Figure 7.2). The ions are spectroscopically interrogated 2 μs after ion extraction by using an infrared laser tuned in the region 3000 – 3700 cm-1. The infrared spectrum of the mobility- and mass-selected ions is recorded by monitoring the loss of the tag molecule as a function of the infrared frequency using a time-of-flight (TOF) mass spectrometer.
7.2 Determination of the collisional cross section (CCS)
From measuring the drift time of a particular species of interest through the drift tube we can compute its collisional cross section. This value provides information about the overall shape of the ions, although it is not descriptive enough to be used as a unique identifier for their 3D structure.
Figure 7.2 – Planar, cryogenic ion trap and PCB electrodes. The trap is coupled to a reflectronTOF, as shown in Figure 7.1.
xy
z
TOF extraction
IR laser

Ions travel through the entire length of the drift tube filled with gas at a given pressure (generally on the order of millibars) under the influence of a constant electric field in the axial direction. The observable of the system is the drift time, td. We can then determine the velocity of the drifting species, v, which depends on its drift time and the fixed length of the drift tube, l as:
The drift velocity is proportional to the electric field, E, in the low-field regime through the constant K:
The proportionality constant K is related to the average collisional cross section through the following expression:
where:
• N corresponds to the number of buffer gas molecules
• z is the ion charge
• k is Boltzmann’s constant
• T is the absolute temperature
• m corresponds to the mass of the buffer gas
• M is the mass of the ion
• is the average collisional cross section
We can relate the collisional cross section to parameters that we can experimentally measure using the expression:
Where:
• , potential across the drift tube
• , buffer gas pressure
• , reduced mass.
7.3 Vibrational tagging spectroscopy
The vibrational spectra of glycans that are presented in this thesis are collected using H2 and N2 tagging spectroscopy. Messenger tagging spectroscopy (MTS) was originally proposed by Okumura (5, 6) in 1988. Johnson’s group widely employed and further developed this technique several years later (7, 8). MTS is based on the following principle: the ion of interest is complexed with one or more neutral molecules or atoms (the messengers or tags). Upon excitation of a vibrational band of the ion, the energy is redistributed in the cluster, and this causes the dissociation of the tag molecule. The vibrational action spectrum of the cluster is collected by monitoring the loss of the messenger by photodissociation.
The tag molecule has to be chosen to suit the experiment. Experiments that aim to unravel the three-dimensional structure of a peptide need tags that weakly interact with the ion of interest in order to not to perturb its original structure. Helium is probably the optimal candidate for this task since it is inert and not very polarizable (9). In order to efficiently form enough clusters with helium, the trap temperature has to be kept close to 4 K. Argon, Ne, and N2 condense more easily than He to ions due to their higher polarizability. This allows the production of a higher number of clusters with a concomitant increase in the signal-to-noise ratio. However, studies show that the higher polarizability of Ar, Ne, and N2 can significantly perturb the geometry of the ion of interest (10), preventing their use in 3D structural characterization. Hydrogen or D2 have been widely used due to their relatively low polarizability and higher propensity to form clusters. They represent a good compromise to use for studying the geometry of molecules without drastically perturbing their structure. Masson et al. (4, 11) performed several structural characterization studies of different peptides while coupling this spectroscopic technique with ion mobility spectrometry, where they confirmed that H2 tags do not modify the structure of kinetically trapped peptides. Their results show that when combined with ion mobility, this technique is as least as suitable as IR-UV double resonance spectroscopy in providing structural information of peptides.
Infrared radiation for our spectroscopic experiments is generated by a OPO/OPA (Laser Vision) system pumped by the fundamental of a Nd:YAG (Innolas). The linewidth of the laser is 3 cm-1. The tagged glycan clusters are formed by the condensation of one or more tag molecules on the oligosaccharide sodiated species. These clusters, as well as those that dissociate during the extraction of the ions from the trap or by absorption of IR radiation are monitored using a Jordan TOF. The infrared spectrum is reconstructed by plotting the number of tagged species that dissociate, normalized by the total number of untagged species. This normalization procedure increases the signal-to-noise ratio by cancelling possible fluctuations in the ion current, since the ratio of tagged and untagged molecules is fixed. The data acquisition runs with LabView software. The signal from the MCP is recorded by using a LeCroy oscilloscope that transmits the data to a computer. The LabView
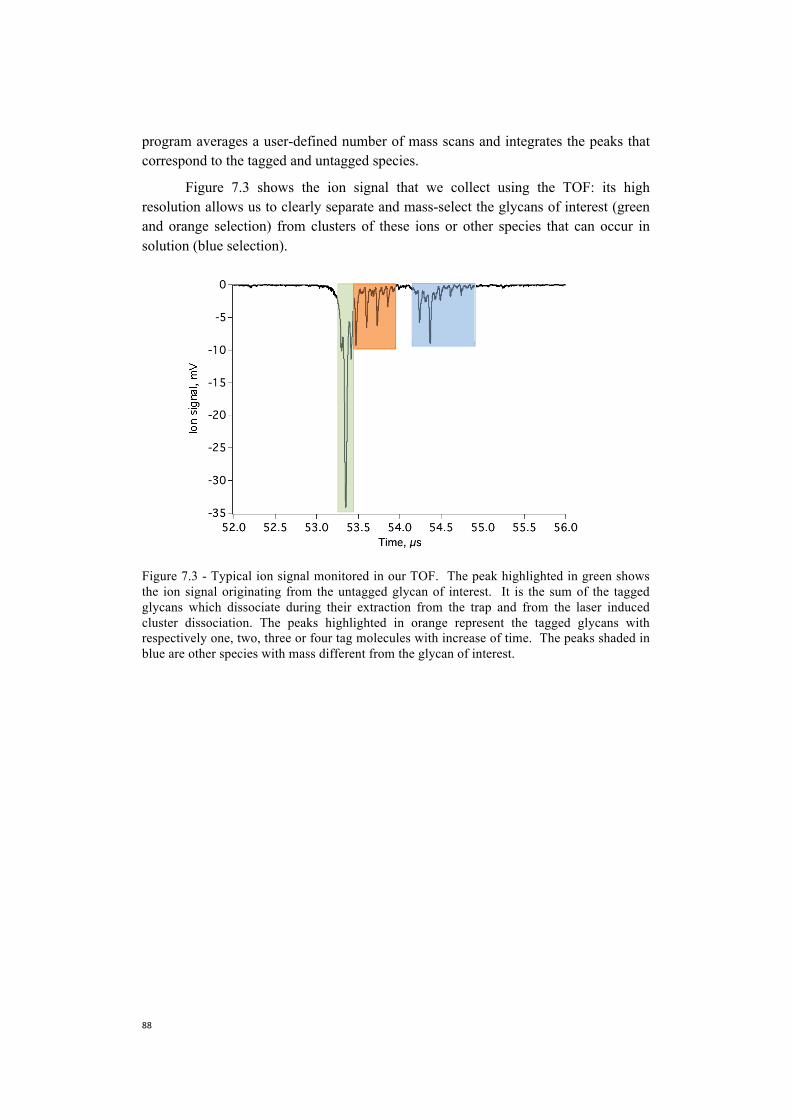
program averages a user-defined number of mass scans and integrates the peaks that correspond to the tagged and untagged species.
Figure 7.3 shows the ion signal that we collect using the TOF: its high resolution allows us to clearly separate and mass-select the glycans of interest (green and orange selection) from clusters of these ions or other species that can occur in solution (blue selection).
Figure 7.3 - Typical ion signal monitored in our TOF. The peak highlighted in green shows the ion signal originating from the untagged glycan of interest. It is the sum of the tagged glycans which dissociate during their extraction from the trap and from the laser induced cluster dissociation. The peaks highlighted in orange represent the tagged glycans with respectively one, two, three or four tag molecules with increase of time. The peaks shaded in blue are other species with mass different from the glycan of interest.
References
1. S. L. Koeniger et al., An IMS-IMS analogue of MS-MS. AnalyticalChemistry. 78, 4161-4174 (2006).
2. U. J. Lorenz, T. R. Rizzo, Planar Multipole Ion Trap/Time-of-Flight MassSpectrometer. Analytical Chemistry. 83, 7895-7901 (2011).
3. U. Lorenz, EPFL, (2011).4. A. Masson et al., Infrared Spectroscopy of Mobility-Selected H+-Gly-Pro-
Gly-Gly (GPGG). Journal of the American Society for Mass Spectrometry 26,1444-1454 (2015).
5. M. Okumura, L. I. Yeh, Y. T. Lee, Infrared-Spectroscopy of the Cluster IonsH3+.(H2)N. Journal of Chemical Physics 88, 79-91 (1988).
6. M. Okumura, L. I. Yeh, J. D. Myers, Y. T. Lee, Infrared-Spectra of theSolvated Hydronium Ion - Vibrational Predissociation Spectroscopy of Mass-Selected H3o+.(H2o)N.(H2)M. Journal of Physical Chemistry. 94, 3416-3427(1990).
7. M. Z. Kamrath et al., Vibrational Characterization of Simple Peptides UsingCryogenic Infrared Photodissociation of H-2-Tagged, Mass-Selected Ions.Journal of the American Society 133, 6440-6448 (2011).
8. M. Z. Kamrath, R. A. Relph, T. L. Guasco, C. M. Leavitt, M. A. Johnson,Vibrational predissociation spectroscopy of the H-2-tagged mono- anddicarboxylate anions of dodecanedioic acid. International Journal of MassSpectrometry 300, 91-98 (2011).
9. A. P. Cismesia, L. S. Bailey, M. R. Bell, L. F. Tesler, N. C. Polfer, MakingMass Spectrometry See the Light: The Promises and Challenges of CryogenicInfrared Ion Spectroscopy as a Bioanalytical Technique. Journal of theAmerican Society for Mass Spectrometry 27, 757-766 (2016).
10. C. J. Johnson et al., Communication: He-tagged vibrational spectra of theSarGlyH(+) and H+(H2O)(2,3) ions: Quantifying tag effects in cryogenic ionvibrational predissociation (CIVP) spectroscopy. Journal of Chemical Physics140, (2014).
11. L. Voronina et al., Conformations of Prolyl-Peptide Bonds in the Bradykinin1-5 Fragment in Solution and in the Gas Phase. Journal of the AmericanChemical Society 138, 9224-9233 (2016).

8. A novel technique to identify glycans
The development of fast and reliable analytical methods to sequence and identify glycan primary structure is an ongoing process. As discussed in Chapter 6, coupling several techniques, such as LC/MS, or IMS/MS allows one to collect only partial information about it. One downside common to most of current experimental approaches is the necessity for preliminary purification steps, and derivatization of the sample (such as permethylation, attachment of a chromophore tag, etc…), which is time consuming.
The technique that we propose uses a database of masses, collisional cross sections, and spectroscopic fingerprints of standards to identify and sequence unknown samples without the need to derivatize. In this chapter, we present a proof of principle of our methodology (described in Chapter 7) by showing that we can easily identify the anomericity, regioisomers, monosaccharide content, and sequence of six isomeric disaccharides. Experiments involving larger glycan species are instead presented in Chapter 9.
8.1 Sample preparation and nomenclature
We performed a series of experiments on disaccharides and pentasaccharides. The samples were purchased from Carbosynth Limited (United Kingdom) and Dextra Laboratories (United Kingdom) and used without further purification. The glycan purity is certified at a minimum of 90%. For each disaccharide and pentasaccharide species, we prepared a solution of 50:50 HPLC methanol from VWR Chemicals (Switzerland) and nuclease-free water from Ambion (Switzerland). We added the oligosaccharide of interest and sodium chloride to obtain a concentration of oligosaccharide salt between 200 μM and 600 μM. The concentration of glycan and NaCl were adjusted in the range mentioned above to maximize the signal of the glycan complexed with Na+ in the drift tube.
The structure of the disaccharides (Carbosynth Limited) that we investigated is depicted in Figure 8.1, with their extended and UOXF (1) nomenclatures shown. The structural difference between each disaccharide pair is due to a single change of either
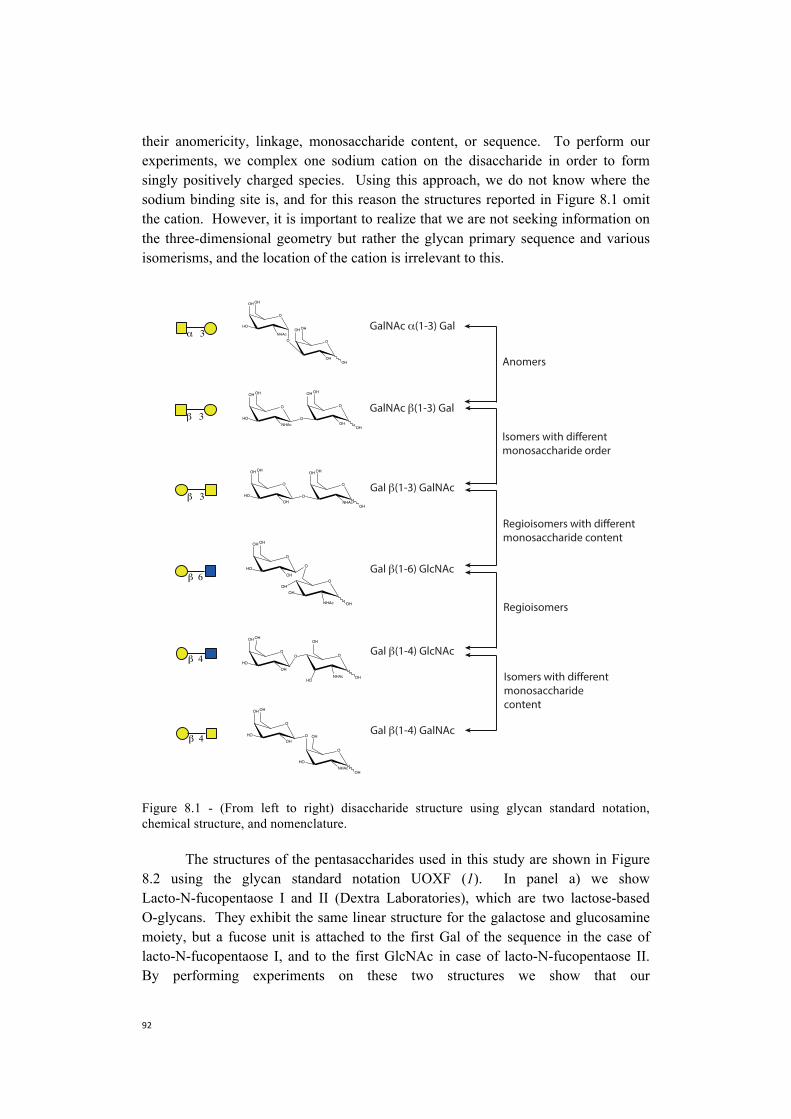
their anomericity, linkage, monosaccharide content, or sequence. To perform our experiments, we complex one sodium cation on the disaccharide in order to form singly positively charged species. Using this approach, we do not know where the sodium binding site is, and for this reason the structures reported in Figure 8.1 omit the cation. However, it is important to realize that we are not seeking information on the three-dimensional geometry but rather the glycan primary sequence and various isomerisms, and the location of the cation is irrelevant to this.
Figure 8.1 - (From left to right) disaccharide structure using glycan standard notation, chemical structure, and nomenclature.
The structures of the pentasaccharides used in this study are shown in Figure 8.2 using the glycan standard notation UOXF (1). In panel a) we show Lacto-N-fucopentaose I and II (Dextra Laboratories), which are two lactose-based O-glycans. They exhibit the same linear structure for the galactose and glucosaminemoiety, but a fucose unit is attached to the first Gal of the sequence in the case oflacto-N-fucopentaose I, and to the first GlcNAc in case of lacto-N-fucopentaose II.By performing experiments on these two structures we show that our
O
OH
HO
OH
O
OH
OH
OH
OH
O
NHAc
GalNAc (1-3) Gal
O
OH
HO
NHAc
OH
O
O
OH
OH
OH
OH
GalNAc (1-3) Gal
O
OH
HO
OH
O
OH
O
OH
NHAc
OH
OH
Gal (1-3) GalNAc
O
OH
HO
OH
OH
O
OHNHAc
O
OH
OH
Gal (1-6) GlcNAc
O
OH
HO
OH
OH
O
OH
OH
O
HONHAc
O
OH
HO
OH
O
OH
O
HO
NHAc
OH
OH
Gal (1-4) GlcNAc
Gal (1-4) GalNAc
Anomers
Isomers with different monosaccharide order
Regioisomers with differentmonosaccharide content
Regioisomers
Isomers with different monosaccharide content
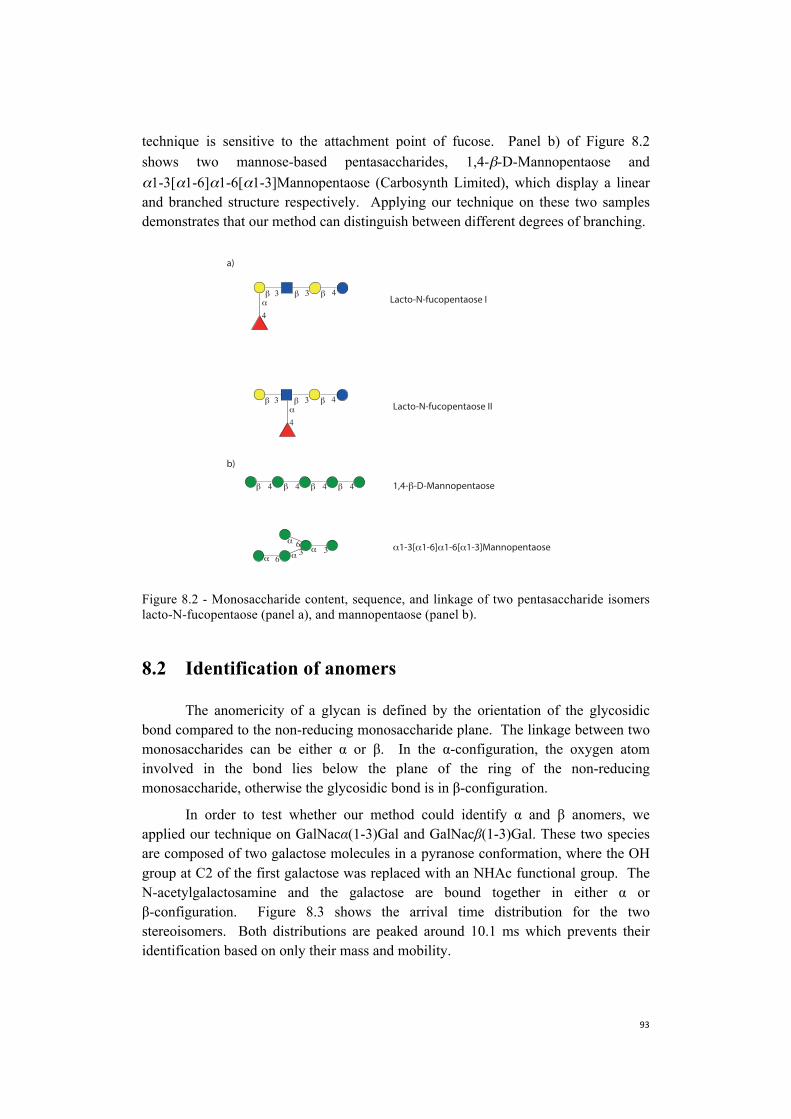
technique is sensitive to the attachment point of fucose. Panel b) of Figure 8.2 shows two mannose-based pentasaccharides, 1,4-β-D-Mannopentaose and α1-3[α1-6]α1-6[α1-3]Mannopentaose (Carbosynth Limited), which display a linear and branched structure respectively. Applying our technique on these two samples demonstrates that our method can distinguish between different degrees of branching.
Figure 8.2 - Monosaccharide content, sequence, and linkage of two pentasaccharide isomers lacto-N-fucopentaose (panel a), and mannopentaose (panel b).
8.2 Identification of anomers
The anomericity of a glycan is defined by the orientation of the glycosidic bond compared to the non-reducing monosaccharide plane. The linkage between two monosaccharides can be either α or β. In the α-configuration, the oxygen atom involved in the bond lies below the plane of the ring of the non-reducing monosaccharide, otherwise the glycosidic bond is in β-configuration.
In order to test whether our method could identify α and β anomers, we applied our technique on GalNacα(1-3)Gal and GalNacβ(1-3)Gal. These two species are composed of two galactose molecules in a pyranose conformation, where the OH group at C2 of the first galactose was replaced with an NHAc functional group. The N-acetylgalactosamine and the galactose are bound together in either α orβ-configuration. Figure 8.3 shows the arrival time distribution for the twostereoisomers. Both distributions are peaked around 10.1 ms which prevents theiridentification based on only their mass and mobility.
Lacto-N-fucopentaose I
Lacto-N-fucopentaose II
1,4- -D-Mannopentaose
1-3[ 1-6] 1-6[ 1-3]Mannopentaose
a)
b)
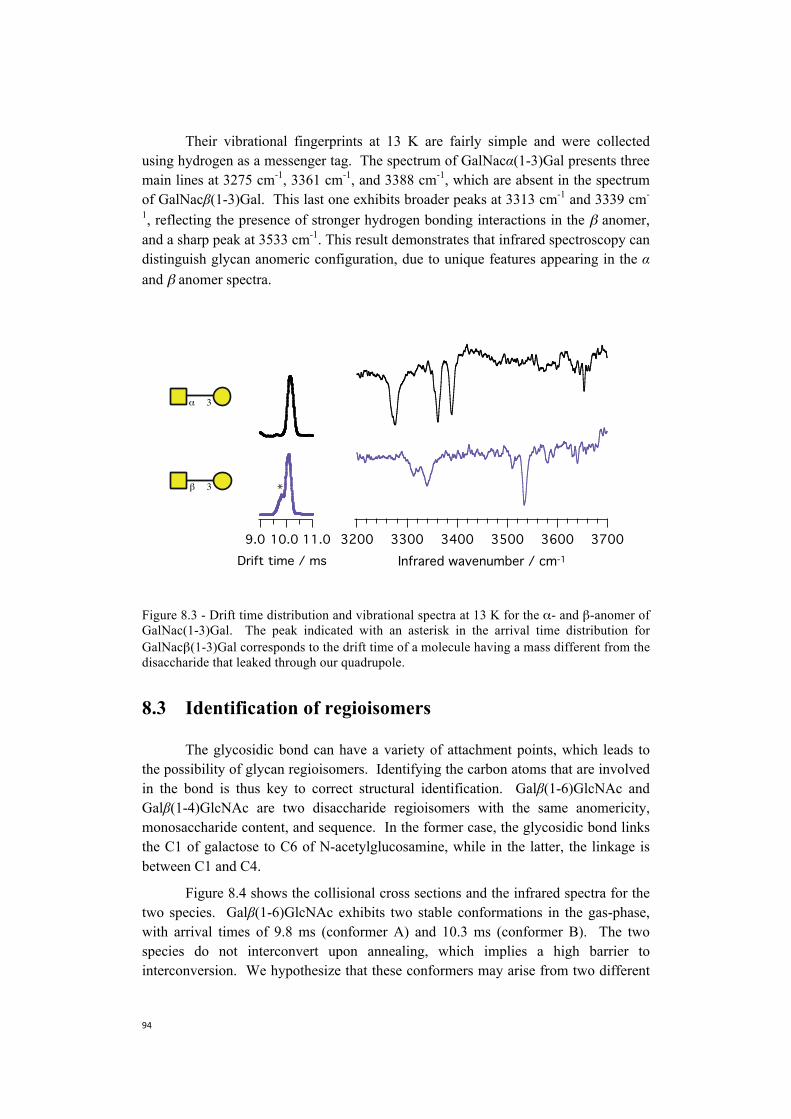
Their vibrational fingerprints at 13 K are fairly simple and were collected using hydrogen as a messenger tag. The spectrum of GalNacα(1-3)Gal presents three main lines at 3275 cm-1, 3361 cm-1, and 3388 cm-1, which are absent in the spectrum of GalNacβ(1-3)Gal. This last one exhibits broader peaks at 3313 cm-1 and 3339 cm-
1, reflecting the presence of stronger hydrogen bonding interactions in the β anomer, and a sharp peak at 3533 cm-1. This result demonstrates that infrared spectroscopy can distinguish glycan anomeric configuration, due to unique features appearing in the α and β anomer spectra.
Figure 8.3 - Drift time distribution and vibrational spectra at 13 K for the α- and β-anomer of GalNac(1-3)Gal. The peak indicated with an asterisk in the arrival time distribution for GalNacβ(1-3)Gal corresponds to the drift time of a molecule having a mass different from the disaccharide that leaked through our quadrupole.
8.3 Identification of regioisomers
The glycosidic bond can have a variety of attachment points, which leads to the possibility of glycan regioisomers. Identifying the carbon atoms that are involved in the bond is thus key to correct structural identification. Galβ(1-6)GlcNAc and Galβ(1-4)GlcNAc are two disaccharide regioisomers with the same anomericity, monosaccharide content, and sequence. In the former case, the glycosidic bond links the C1 of galactose to C6 of N-acetylglucosamine, while in the latter, the linkage is between C1 and C4.
Figure 8.4 shows the collisional cross sections and the infrared spectra for the two species. Galβ(1-6)GlcNAc exhibits two stable conformations in the gas-phase, with arrival times of 9.8 ms (conformer A) and 10.3 ms (conformer B). The two species do not interconvert upon annealing, which implies a high barrier to interconversion. We hypothesize that these conformers may arise from two different
370036003500340033003200Infrared wavenumber / cm-1
11.010.09.0Drift time / ms
*
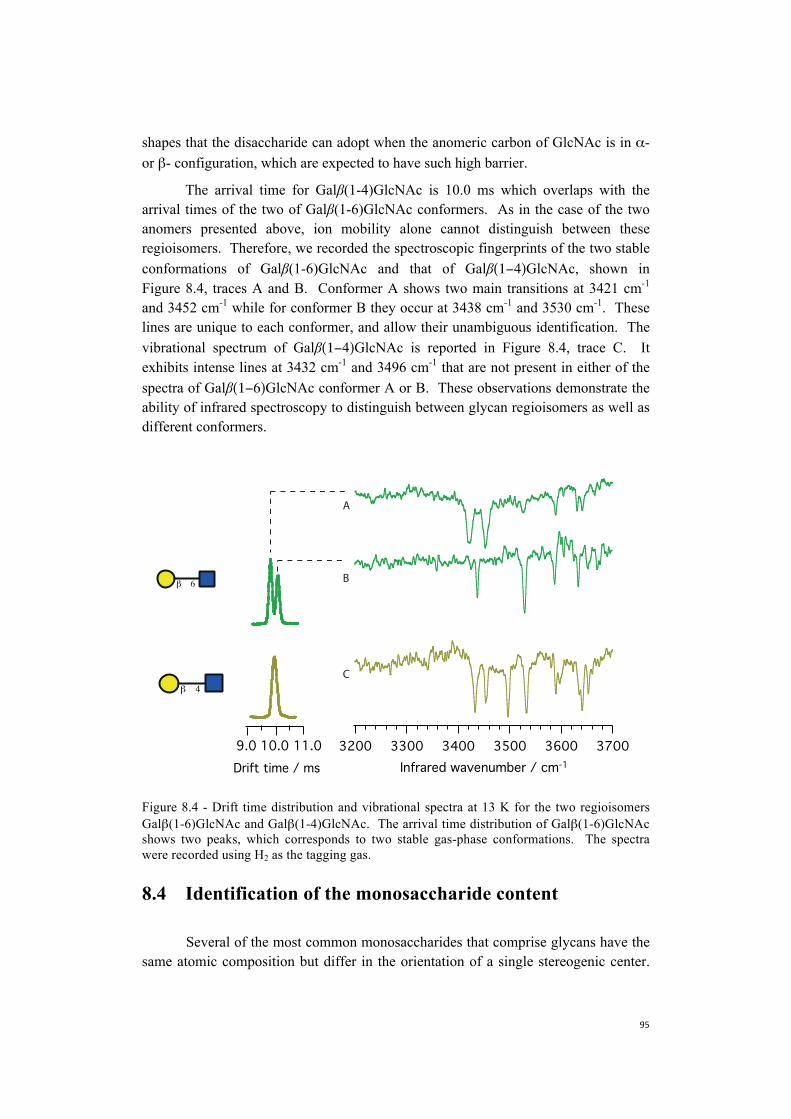
shapes that the disaccharide can adopt when the anomeric carbon of GlcNAc is in α- or β- configuration, which are expected to have such high barrier.
The arrival time for Galβ(1-4)GlcNAc is 10.0 ms which overlaps with the arrival times of the two of Galβ(1-6)GlcNAc conformers. As in the case of the two anomers presented above, ion mobility alone cannot distinguish between these regioisomers. Therefore, we recorded the spectroscopic fingerprints of the two stable conformations of Galβ(1-6)GlcNAc and that of Galβ(1−4)GlcNAc, shown in Figure 8.4, traces A and B. Conformer A shows two main transitions at 3421 cm-1 and 3452 cm-1 while for conformer B they occur at 3438 cm-1 and 3530 cm-1. These lines are unique to each conformer, and allow their unambiguous identification. The vibrational spectrum of Galβ(1−4)GlcNAc is reported in Figure 8.4, trace C. It exhibits intense lines at 3432 cm-1 and 3496 cm-1 that are not present in either of the spectra of Galβ(1−6)GlcNAc conformer A or B. These observations demonstrate the ability of infrared spectroscopy to distinguish between glycan regioisomers as well as different conformers.
Figure 8.4 - Drift time distribution and vibrational spectra at 13 K for the two regioisomers Galβ(1-6)GlcNAc and Galβ(1-4)GlcNAc. The arrival time distribution of Galβ(1-6)GlcNAc shows two peaks, which corresponds to two stable gas-phase conformations. The spectra were recorded using H2 as the tagging gas.
8.4 Identification of the monosaccharide content
Several of the most common monosaccharides that comprise glycans have the same atomic composition but differ in the orientation of a single stereogenic center.
370036003500340033003200Infrared wavenumber / cm-1
11.010.09.0Drift time / ms
A
B
C
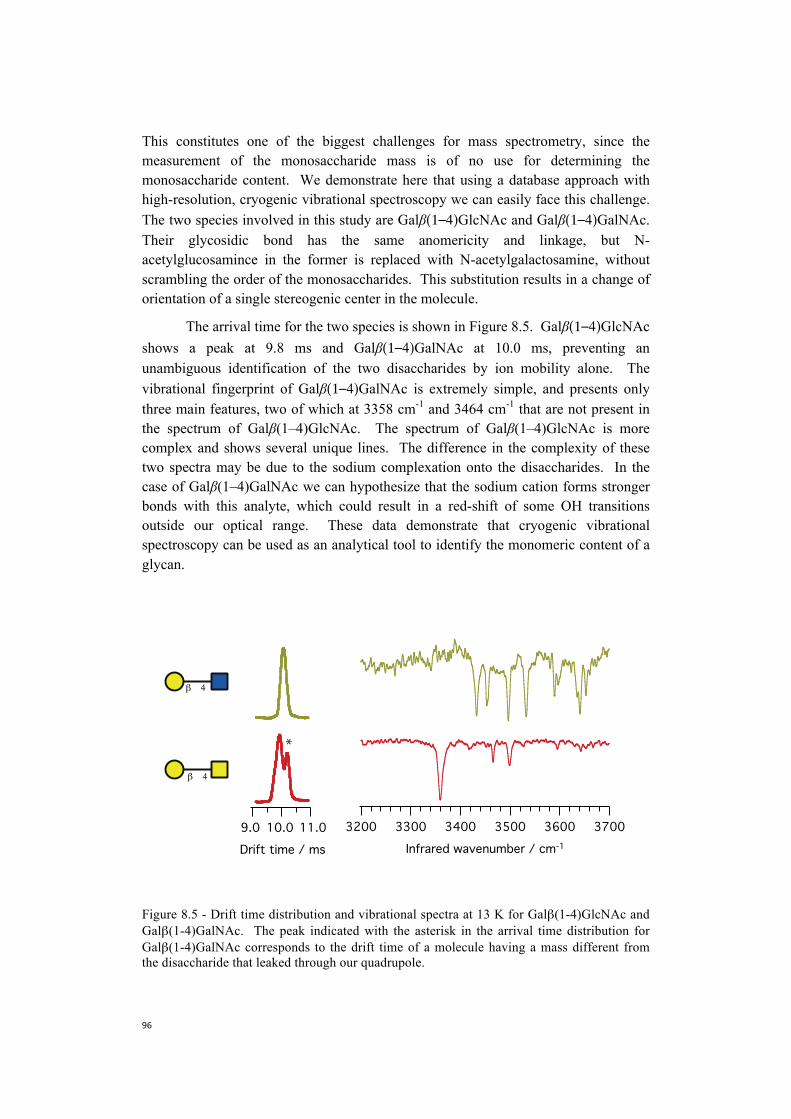
This constitutes one of the biggest challenges for mass spectrometry, since the measurement of the monosaccharide mass is of no use for determining the monosaccharide content. We demonstrate here that using a database approach with high-resolution, cryogenic vibrational spectroscopy we can easily face this challenge. The two species involved in this study are Galβ(1 4)GlcNAc and Galβ(1 4)GalNAc. Their glycosidic bond has the same anomericity and linkage, but N-acetylglucosamince in the former is replaced with N-acetylgalactosamine, without scrambling the order of the monosaccharides. This substitution results in a change of orientation of a single stereogenic center in the molecule.
The arrival time for the two species is shown in Figure 8.5. Galβ(1 4)GlcNAc shows a peak at 9.8 ms and Galβ(1 4)GalNAc at 10.0 ms, preventing an unambiguous identification of the two disaccharides by ion mobility alone. The vibrational fingerprint of Galβ(1 4)GalNAc is extremely simple, and presents only three main features, two of which at 3358 cm-1 and 3464 cm-1 that are not present in the spectrum of Galβ(1–4)GlcNAc. The spectrum of Galβ(1–4)GlcNAc is more complex and shows several unique lines. The difference in the complexity of these two spectra may be due to the sodium complexation onto the disaccharides. In the case of Galβ(1–4)GalNAc we can hypothesize that the sodium cation forms stronger bonds with this analyte, which could result in a red-shift of some OH transitions outside our optical range. These data demonstrate that cryogenic vibrational spectroscopy can be used as an analytical tool to identify the monomeric content of a glycan.
Figure 8.5 - Drift time distribution and vibrational spectra at 13 K for Galβ(1-4)GlcNAc and Galβ(1-4)GalNAc. The peak indicated with the asterisk in the arrival time distribution for Galβ(1-4)GalNAc corresponds to the drift time of a molecule having a mass different from the disaccharide that leaked through our quadrupole.
370036003500340033003200Infrared wavenumber / cm-1
11.010.09.0Drift time / ms
*
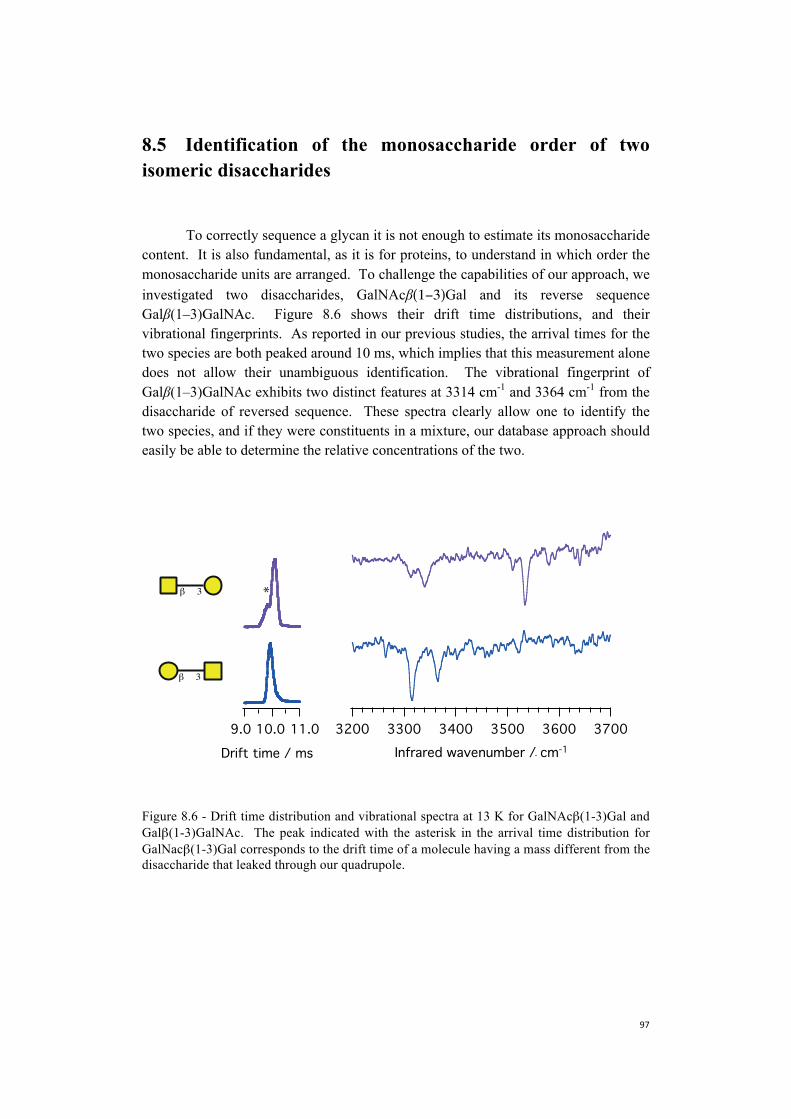
8.5 Identification of the monosaccharide order of two isomeric disaccharides
To correctly sequence a glycan it is not enough to estimate its monosaccharide content. It is also fundamental, as it is for proteins, to understand in which order the monosaccharide units are arranged. To challenge the capabilities of our approach, we investigated two disaccharides, GalNAcβ(1−3)Gal and its reverse sequence Galβ(1–3)GalNAc. Figure 8.6 shows their drift time distributions, and their vibrational fingerprints. As reported in our previous studies, the arrival times for the two species are both peaked around 10 ms, which implies that this measurement alone does not allow their unambiguous identification. The vibrational fingerprint of Galβ(1–3)GalNAc exhibits two distinct features at 3314 cm-1 and 3364 cm-1 from the disaccharide of reversed sequence. These spectra clearly allow one to identify the two species, and if they were constituents in a mixture, our database approach should easily be able to determine the relative concentrations of the two.
Figure 8.6 - Drift time distribution and vibrational spectra at 13 K for GalNAcβ(1-3)Gal and Galβ(1-3)GalNAc. The peak indicated with the asterisk in the arrival time distribution for GalNacβ(1-3)Gal corresponds to the drift time of a molecule having a mass different from the disaccharide that leaked through our quadrupole.
370036003500340033003200Infrared wavenumber / cm-1
11.010.09.0Drift time / ms
*
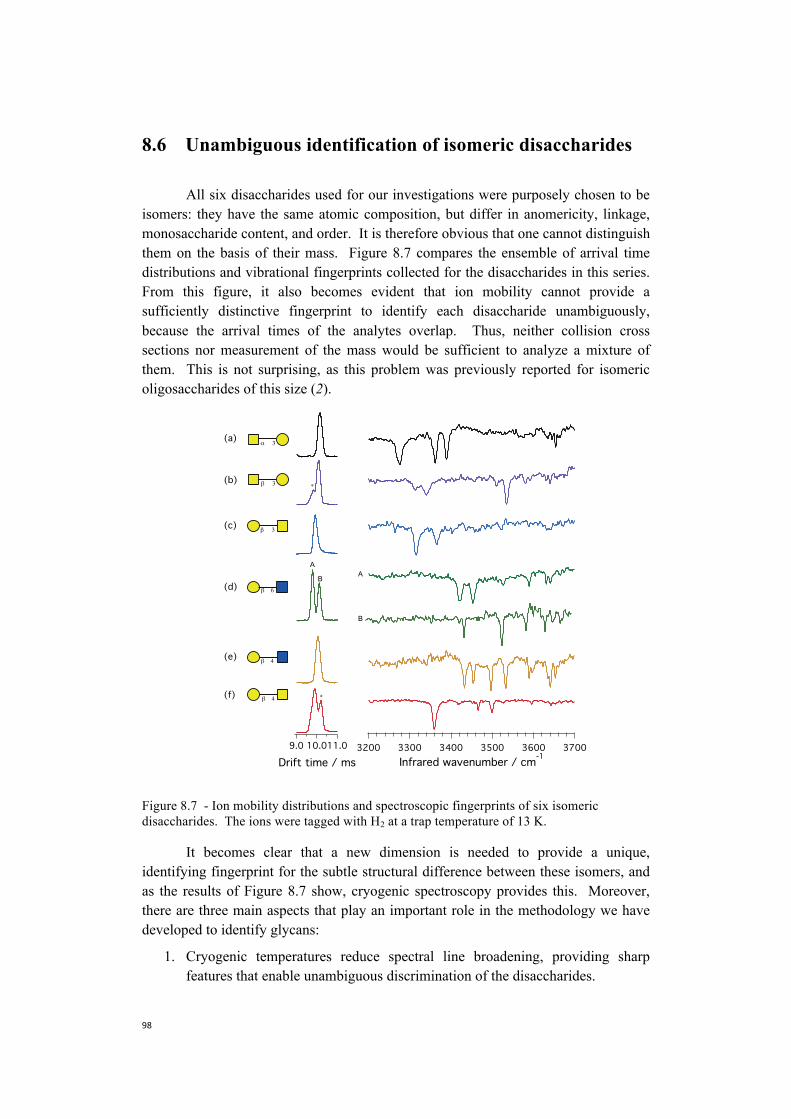
8.6 Unambiguous identification of isomeric disaccharides
All six disaccharides used for our investigations were purposely chosen to be isomers: they have the same atomic composition, but differ in anomericity, linkage, monosaccharide content, and order. It is therefore obvious that one cannot distinguish them on the basis of their mass. Figure 8.7 compares the ensemble of arrival time distributions and vibrational fingerprints collected for the disaccharides in this series. From this figure, it also becomes evident that ion mobility cannot provide a sufficiently distinctive fingerprint to identify each disaccharide unambiguously, because the arrival times of the analytes overlap. Thus, neither collision cross sections nor measurement of the mass would be sufficient to analyze a mixture of them. This is not surprising, as this problem was previously reported for isomeric oligosaccharides of this size (2).
Figure 8.7 - Ion mobility distributions and spectroscopic fingerprints of six isomeric disaccharides. The ions were tagged with H2 at a trap temperature of 13 K.
It becomes clear that a new dimension is needed to provide a unique, identifying fingerprint for the subtle structural difference between these isomers, and as the results of Figure 8.7 show, cryogenic spectroscopy provides this. Moreover, there are three main aspects that play an important role in the methodology we have developed to identify glycans:
1. Cryogenic temperatures reduce spectral line broadening, providing sharpfeatures that enable unambiguous discrimination of the disaccharides.
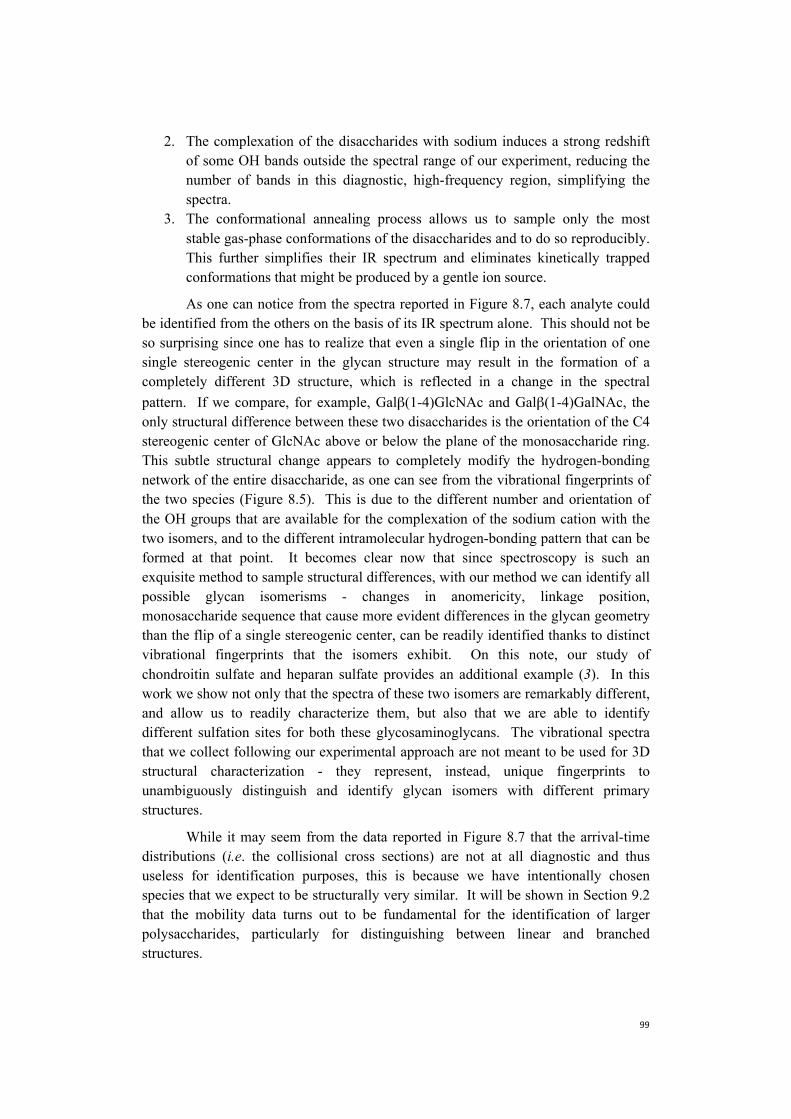
2. The complexation of the disaccharides with sodium induces a strong redshiftof some OH bands outside the spectral range of our experiment, reducing thenumber of bands in this diagnostic, high-frequency region, simplifying thespectra.
3. The conformational annealing process allows us to sample only the moststable gas-phase conformations of the disaccharides and to do so reproducibly.This further simplifies their IR spectrum and eliminates kinetically trappedconformations that might be produced by a gentle ion source.
As one can notice from the spectra reported in Figure 8.7, each analyte couldbe identified from the others on the basis of its IR spectrum alone. This should not be so surprising since one has to realize that even a single flip in the orientation of one single stereogenic center in the glycan structure may result in the formation of a completely different 3D structure, which is reflected in a change in the spectral pattern. If we compare, for example, Galβ(1-4)GlcNAc and Galβ(1-4)GalNAc, the only structural difference between these two disaccharides is the orientation of the C4 stereogenic center of GlcNAc above or below the plane of the monosaccharide ring. This subtle structural change appears to completely modify the hydrogen-bonding network of the entire disaccharide, as one can see from the vibrational fingerprints of the two species (Figure 8.5). This is due to the different number and orientation of the OH groups that are available for the complexation of the sodium cation with the two isomers, and to the different intramolecular hydrogen-bonding pattern that can be formed at that point. It becomes clear now that since spectroscopy is such an exquisite method to sample structural differences, with our method we can identify all possible glycan isomerisms - changes in anomericity, linkage position, monosaccharide sequence that cause more evident differences in the glycan geometry than the flip of a single stereogenic center, can be readily identified thanks to distinct vibrational fingerprints that the isomers exhibit. On this note, our study of chondroitin sulfate and heparan sulfate provides an additional example (3). In this work we show not only that the spectra of these two isomers are remarkably different, and allow us to readily characterize them, but also that we are able to identify different sulfation sites for both these glycosaminoglycans. The vibrational spectra that we collect following our experimental approach are not meant to be used for 3D structural characterization - they represent, instead, unique fingerprints to unambiguously distinguish and identify glycan isomers with different primary structures.
While it may seem from the data reported in Figure 8.7 that the arrival-time distributions (i.e. the collisional cross sections) are not at all diagnostic and thus useless for identification purposes, this is because we have intentionally chosen species that we expect to be structurally very similar. It will be shown in Section 9.2 that the mobility data turns out to be fundamental for the identification of larger polysaccharides, particularly for distinguishing between linear and branched structures.
References 1. D. J. Harvey et al., Proposal for a standard system for drawing structural
diagrams of N- and O-linked carbohydrates and related compounds.Proteomics 9, 3796-3801 (2009).
2. M. M. Gaye, R. Kurulugama, D. E. Clemmer, Investigating carbohydrateisomers by IMS-CID-IMS-MS: precursor and fragment ion cross-sections.Analyst 140, 6922-6932 (2015).
3. N. Khanal, C. Masellis, M. Z. Kamrath, D. E. Clemmer, T. R. Rizzo,Glycosaminoglycan Analysis by Cryogenic Messenger-Tagging IRSpectroscopy Combined with IMS-MS. Analytical Chemistry 89, 7601-7606(2017).
9. Towards the construction of adatabase*
As anticipated in Chapter 6, glycan primary structure characterization is not yet routinely available as it is for proteins, due to the large heterogeneity of oligosaccharide structures. Moreover, even coupling together different experimental techniques allows one to obtain only partial information on glycan structure. At the current state-of-the-art there is no method able to simultaneously provide information about linkage position, anomericity, monosaccharide sequence, and composition, to unambiguously characterize glycan primary structure.
The successful studies on disaccharide isomers described in Chapter 8 suggest that one could use cryogenic spectroscopic fingerprints for identification purposes using a database approach. The database would contain three types of information: 1) the mass-to-charge ratio of the glycan complexed with one or more sodium cations,2) the average collisional cross section of the cationized glycan, and 3) its vibrationalspectrum obtained by messenger-tagging spectroscopy. Such a database could inprinciple be an effective analytical tool to identify and sequence oligosaccharides in acomplex mixture, given the ability of cryogenic vibrational spectra to identifyisomeric glycans. In our approach then, vibrational spectroscopy is not used – as inthe case of proteins – to obtain glycan three-dimensional structure, since we areinterested in glycan geometry. The additional spectroscopic dimension allows us,instead, to provide characteristic fingerprints for glycan isomers that reflect thestructural difference amongst all their isomerisms. This method allows one to readilyidentify isomeric glycans with different primary structure, as showed in the case ofdisaccharides. For this reason, the extraordinary advantage in using spectroscopy as avibrational fingerprint with the sole aim of identifying glycan covalent structureinstead of glycan geometry is that it does not require quantum chemical calculations.Despite the availability of some computational methods to unravel glycan 3Dstructure, those still require high computational costs, and their agreement withexperimental data is limited (1-4). While a database of spectroscopic fingerprint does
not provide any insight on the three-dimensional glycan structure, it could nevertheless be an effective analytical tool to identify these compounds in a mixture.
In the following lines we explain how we envision the workflow of data acquisition and analysis procedures when analyzing a glycan mixture. The data acquisition part (Figure 9.1) would consist of four steps: 1) overall measurement of the arrival time distribution of the components present in the mixture, 2) selection of each peak appearing in drift time distribution, 3) measurement of the mass of each mobility-selected species using a TOF mass spectrometer, and 4) collection of its vibrational spectrum. The data analysis would consist of three steps and could be performed offline in an automated fashion: 1) conversion of the arrival time of each species into a CCS; 2) the mass and CCS measured are run against the database, and some of the entries stored in the database are selected as possible candidates; and 3) the vibrational fingerprint of each mass- and mobility-selected species is runagainst the spectra of the selected candidates to identify glycan(s). If the mixture iscomposed of isomeric glycans with different mobilities and these glycans are presentin our database, their identification is trivial since both CCS and vibrationalfingerprint are used for their characterization. If, instead, the mixture containsisomeric glycans with the same mobility, possible entries from the database areselected by matching their collisional cross section. At this point, the vibrationalspectrum of the glycan mixture is deconvoluted using the fingerprints of the mobility-selected candidates as dataset.
More complex is the case when the combination of mass, CCS, and vibrational spectrum of the glycan that we want to identify cannot be matched with any entries of the database. The solution that we suggest in this case is to sequence the unknown glycan, by using a set of stereo- and regioselective exoglycosidases (5). With these enzymes we would selectively cleave monosaccharides of the same type – depending on the particular type of enzyme chosen - from the terminal glycan residue. We would then record mass, CCS, and vibrational fingerprint of the digested glycan, and search our database to identify this structure. We would iterate the glycan digestion, and the search procedure until the matching structure is found. At that point we are able to reconstruct the structure of the entire glycan, by looking at the primary structure of the digested glycan found in our database, and by knowing which exoglycosidases were used during the digestion process, since they are selective to linkage position, anomericity, and type of monosaccharide cleaved. Mass, CCS, and vibrational fingerprints of the sequences glycan, and of its pieces is then added to the database for future reference.
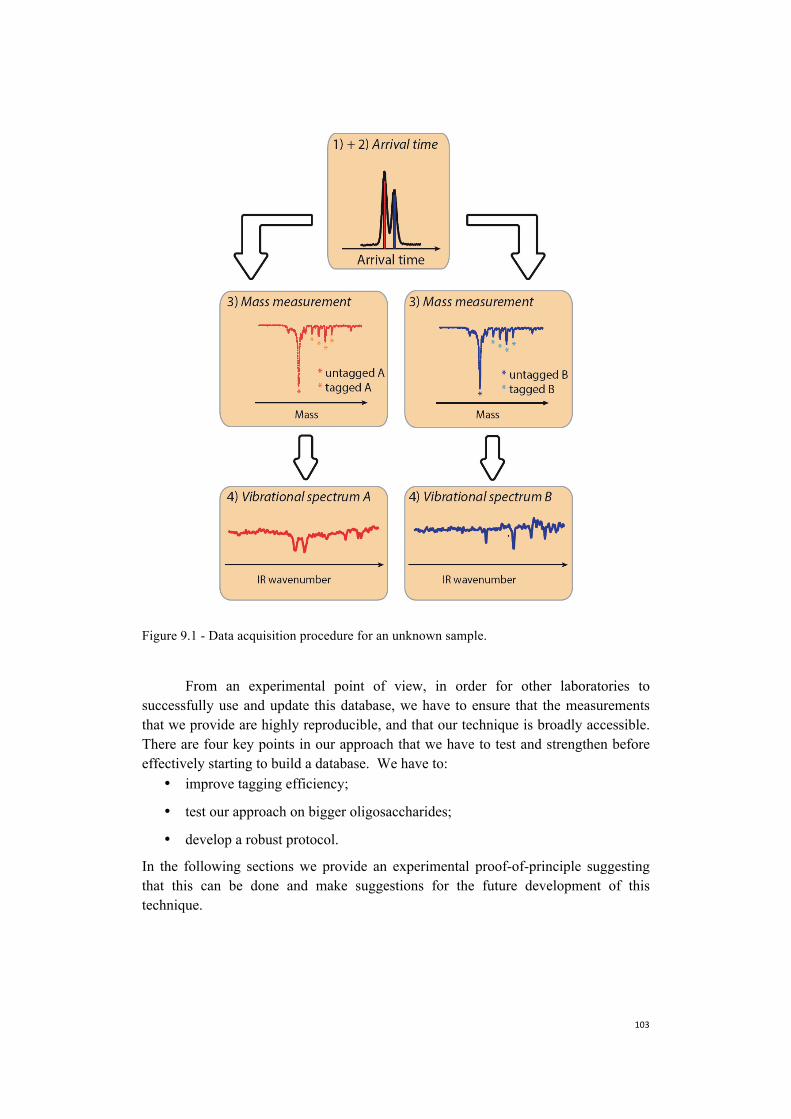
Figure 9.1 - Data acquisition procedure for an unknown sample.
From an experimental point of view, in order for other laboratories to successfully use and update this database, we have to ensure that the measurements that we provide are highly reproducible, and that our technique is broadly accessible. There are four key points in our approach that we have to test and strengthen before effectively starting to build a database. We have to:
• improve tagging efficiency;
• test our approach on bigger oligosaccharides;
• develop a robust protocol.
In the following sections we provide an experimental proof-of-principle suggesting that this can be done and make suggestions for the future development of this technique.
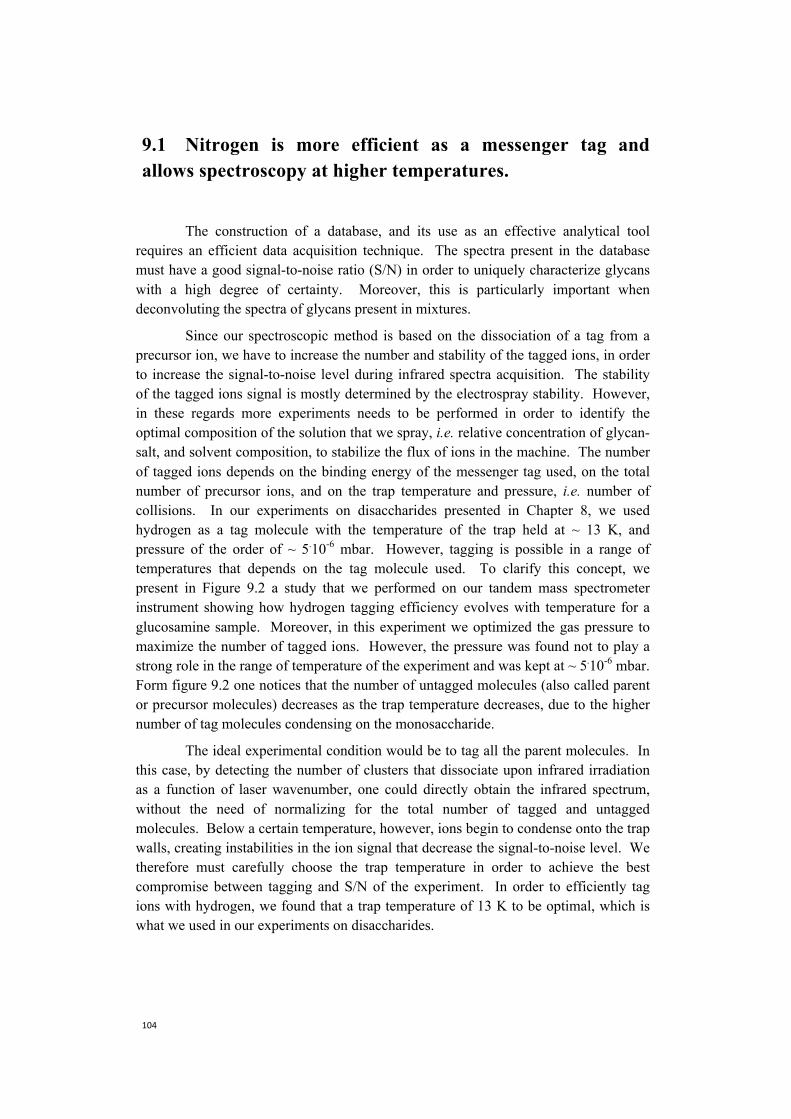
9.1 Nitrogen is more efficient as a messenger tag and allows spectroscopy at higher temperatures.
The construction of a database, and its use as an effective analytical tool requires an efficient data acquisition technique. The spectra present in the database must have a good signal-to-noise ratio (S/N) in order to uniquely characterize glycans with a high degree of certainty. Moreover, this is particularly important when deconvoluting the spectra of glycans present in mixtures.
Since our spectroscopic method is based on the dissociation of a tag from a precursor ion, we have to increase the number and stability of the tagged ions, in order to increase the signal-to-noise level during infrared spectra acquisition. The stability of the tagged ions signal is mostly determined by the electrospray stability. However, in these regards more experiments needs to be performed in order to identify the optimal composition of the solution that we spray, i.e. relative concentration of glycan-salt, and solvent composition, to stabilize the flux of ions in the machine. The number of tagged ions depends on the binding energy of the messenger tag used, on the total number of precursor ions, and on the trap temperature and pressure, i.e. number of collisions. In our experiments on disaccharides presented in Chapter 8, we used hydrogen as a tag molecule with the temperature of the trap held at ~ 13 K, and pressure of the order of ~ 5.10-6 mbar. However, tagging is possible in a range of temperatures that depends on the tag molecule used. To clarify this concept, we present in Figure 9.2 a study that we performed on our tandem mass spectrometer instrument showing how hydrogen tagging efficiency evolves with temperature for a glucosamine sample. Moreover, in this experiment we optimized the gas pressure to maximize the number of tagged ions. However, the pressure was found not to play a strong role in the range of temperature of the experiment and was kept at ~ 5.10-6 mbar. Form figure 9.2 one notices that the number of untagged molecules (also called parent or precursor molecules) decreases as the trap temperature decreases, due to the higher number of tag molecules condensing on the monosaccharide.
The ideal experimental condition would be to tag all the parent molecules. In this case, by detecting the number of clusters that dissociate upon infrared irradiation as a function of laser wavenumber, one could directly obtain the infrared spectrum, without the need of normalizing for the total number of tagged and untagged molecules. Below a certain temperature, however, ions begin to condense onto the trap walls, creating instabilities in the ion signal that decrease the signal-to-noise level. We therefore must carefully choose the trap temperature in order to achieve the best compromise between tagging and S/N of the experiment. In order to efficiently tag ions with hydrogen, we found that a trap temperature of 13 K to be optimal, which is what we used in our experiments on disaccharides.
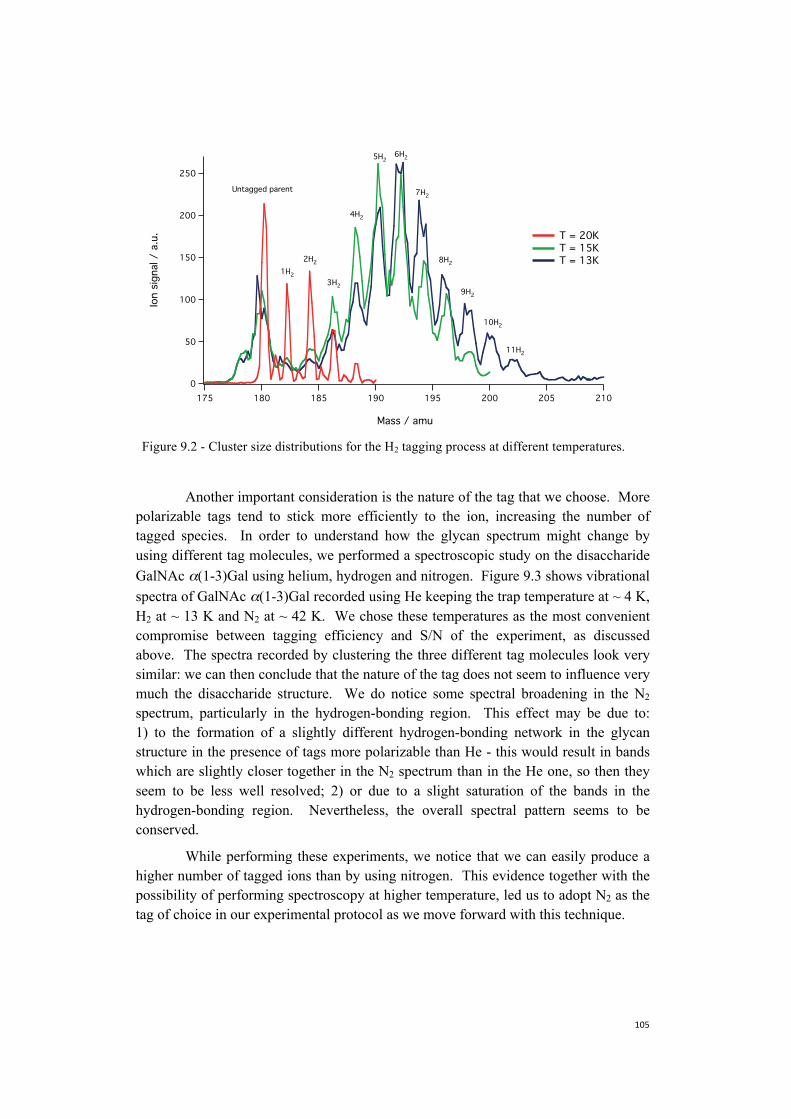
Figure 9.2 - Cluster size distributions for the H2 tagging process at different temperatures.
Another important consideration is the nature of the tag that we choose. More polarizable tags tend to stick more efficiently to the ion, increasing the number of tagged species. In order to understand how the glycan spectrum might change by using different tag molecules, we performed a spectroscopic study on the disaccharide GalNAc α(1-3)Gal using helium, hydrogen and nitrogen. Figure 9.3 shows vibrational spectra of GalNAc α(1-3)Gal recorded using He keeping the trap temperature at ~ 4 K, H2 at ~ 13 K and N2 at ~ 42 K. We chose these temperatures as the most convenient compromise between tagging efficiency and S/N of the experiment, as discussed above. The spectra recorded by clustering the three different tag molecules look very similar: we can then conclude that the nature of the tag does not seem to influence very much the disaccharide structure. We do notice some spectral broadening in the N2 spectrum, particularly in the hydrogen-bonding region. This effect may be due to: 1) to the formation of a slightly different hydrogen-bonding network in the glycanstructure in the presence of tags more polarizable than He - this would result in bandswhich are slightly closer together in the N2 spectrum than in the He one, so then theyseem to be less well resolved; 2) or due to a slight saturation of the bands in thehydrogen-bonding region. Nevertheless, the overall spectral pattern seems to beconserved.
While performing these experiments, we notice that we can easily produce a higher number of tagged ions than by using nitrogen. This evidence together with the possibility of performing spectroscopy at higher temperature, led us to adopt N2 as the tag of choice in our experimental protocol as we move forward with this technique.
250
200
150
100
50
0
Ion
sign
al /
a.u
.
210205200195190185180175
Mass / amu
T = 20K T = 15K T = 13K
Untagged parent
1H2
2H2
3H2
4H2
5H26H2
8H2
7H2
9H2
10H2
11H2
Figure 9.3 - Comparison between N2, H2 and He tagging spectra of the disaccharide GalNAc α(1-3)Gal. The three spectra were recorded maintaining the temperature of the trap respectively at 42 K, 13 K and 4 K.
9.2 Towards more biologically relevant species: two examples of pentasaccharides
In order to demonstrate that we can use our technique to identify oligosaccharides of biologically relevant size, we investigated two isomeric pentasaccharides with different branching. We show the covalent structure of these two glycans in Figure 9.4 - both of them have a linear monosaccharide chain of sequence Gal β(1-3)GlcNAc β(a-3)Gal β(1-4)Glc, and an extra fucose unit that attaches by an α(1-4) glycosidic bond. In case of lacto-N-fucopentaose I, the fucose is attached to the first galactose of the sequence, while in lacto-N-fucopentaose II, the fucose unit binds to GlcNac. We complex the two pentasaccharides with two sodium cations, since the ion signal for this doubly sodiated species was found to be more stable than the one with a single sodium. This is not surprising since larger oligosaccharides have multiple binding sites.
We report the collisional cross section for the two species in Figure 9.4. The two CCS measurements clearly overlap, and this may result from cation-induced compactation. Several of the OH bonds of the molecules may interact with the two charges, causing the glycans to wrap around them assuming a similar shape.
370036003500340033003200Infrared wavenumber / cm-1
N2 tagging, T = 42 K
H2 tagging, T = 13 K
He tagging, T = 4 K
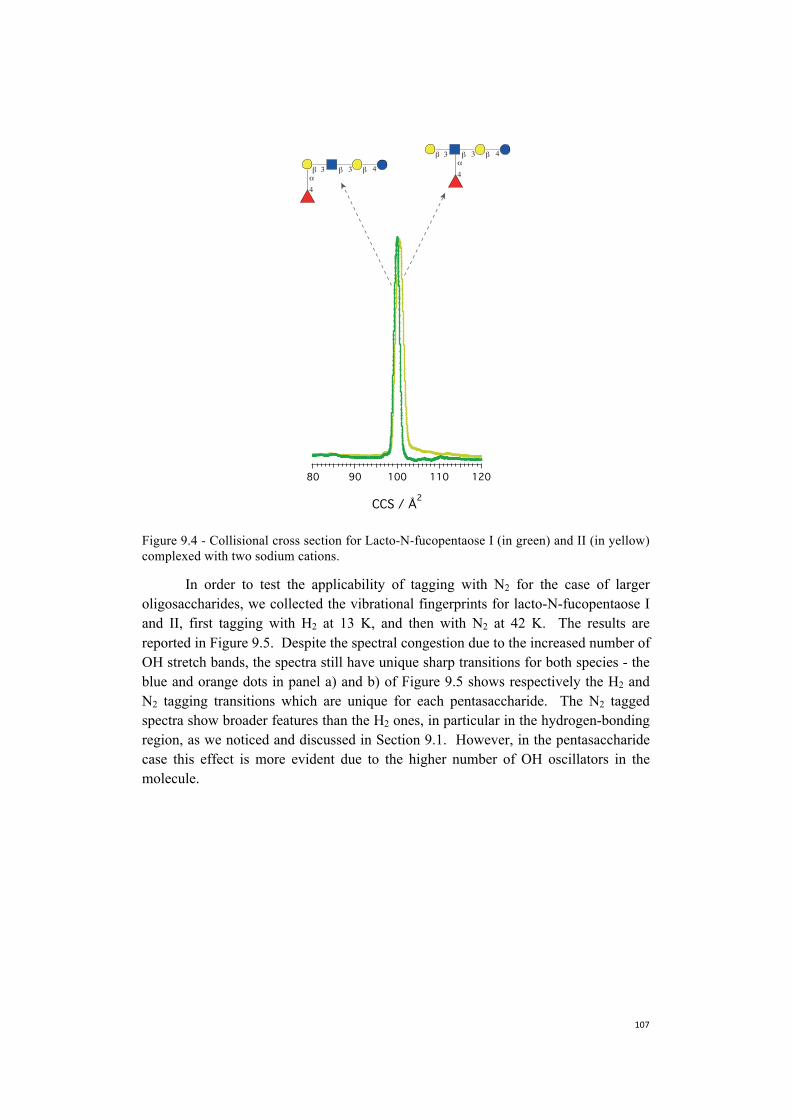
Figure 9.4 - Collisional cross section for Lacto-N-fucopentaose I (in green) and II (in yellow) complexed with two sodium cations.
In order to test the applicability of tagging with N2 for the case of larger oligosaccharides, we collected the vibrational fingerprints for lacto-N-fucopentaose I and II, first tagging with H2 at 13 K, and then with N2 at 42 K. The results are reported in Figure 9.5. Despite the spectral congestion due to the increased number of OH stretch bands, the spectra still have unique sharp transitions for both species - the blue and orange dots in panel a) and b) of Figure 9.5 shows respectively the H2 and N2 tagging transitions which are unique for each pentasaccharide. The N2 tagged spectra show broader features than the H2 ones, in particular in the hydrogen-bonding region, as we noticed and discussed in Section 9.1. However, in the pentasaccharide case this effect is more evident due to the higher number of OH oscillators in the molecule.
1201101009080
CCS / Å2
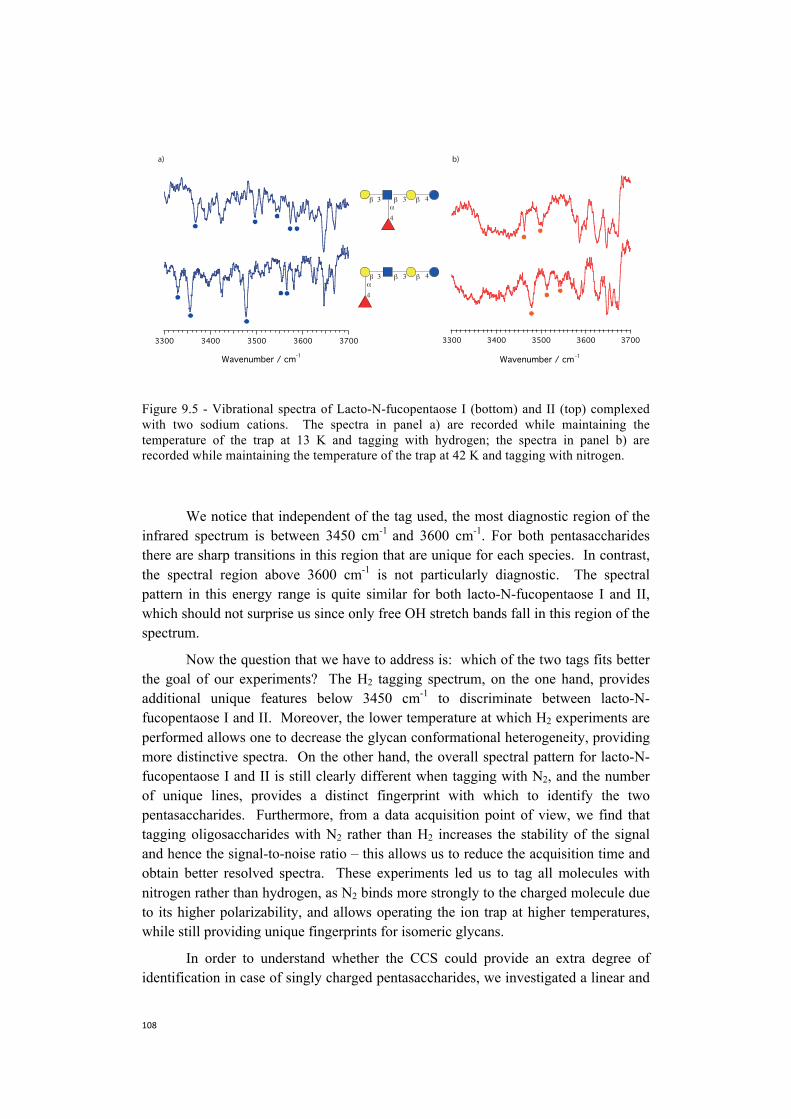
Figure 9.5 - Vibrational spectra of Lacto-N-fucopentaose I (bottom) and II (top) complexed with two sodium cations. The spectra in panel a) are recorded while maintaining the temperature of the trap at 13 K and tagging with hydrogen; the spectra in panel b) are recorded while maintaining the temperature of the trap at 42 K and tagging with nitrogen.
We notice that independent of the tag used, the most diagnostic region of the infrared spectrum is between 3450 cm-1 and 3600 cm-1. For both pentasaccharides there are sharp transitions in this region that are unique for each species. In contrast, the spectral region above 3600 cm-1 is not particularly diagnostic. The spectral pattern in this energy range is quite similar for both lacto-N-fucopentaose I and II, which should not surprise us since only free OH stretch bands fall in this region of the spectrum.
Now the question that we have to address is: which of the two tags fits better the goal of our experiments? The H2 tagging spectrum, on the one hand, provides additional unique features below 3450 cm-1 to discriminate between lacto-N-fucopentaose I and II. Moreover, the lower temperature at which H2 experiments are performed allows one to decrease the glycan conformational heterogeneity, providing more distinctive spectra. On the other hand, the overall spectral pattern for lacto-N-fucopentaose I and II is still clearly different when tagging with N2, and the number of unique lines, provides a distinct fingerprint with which to identify the two pentasaccharides. Furthermore, from a data acquisition point of view, we find that tagging oligosaccharides with N2 rather than H2 increases the stability of the signal and hence the signal-to-noise ratio – this allows us to reduce the acquisition time and obtain better resolved spectra. These experiments led us to tag all molecules with nitrogen rather than hydrogen, as N2 binds more strongly to the charged molecule due to its higher polarizability, and allows operating the ion trap at higher temperatures, while still providing unique fingerprints for isomeric glycans.
In order to understand whether the CCS could provide an extra degree of identification in case of singly charged pentasaccharides, we investigated a linear and
37003600350034003300
Wavenumber / cm-1
37003600350034003300
Wavenumber / cm-1
a) b)
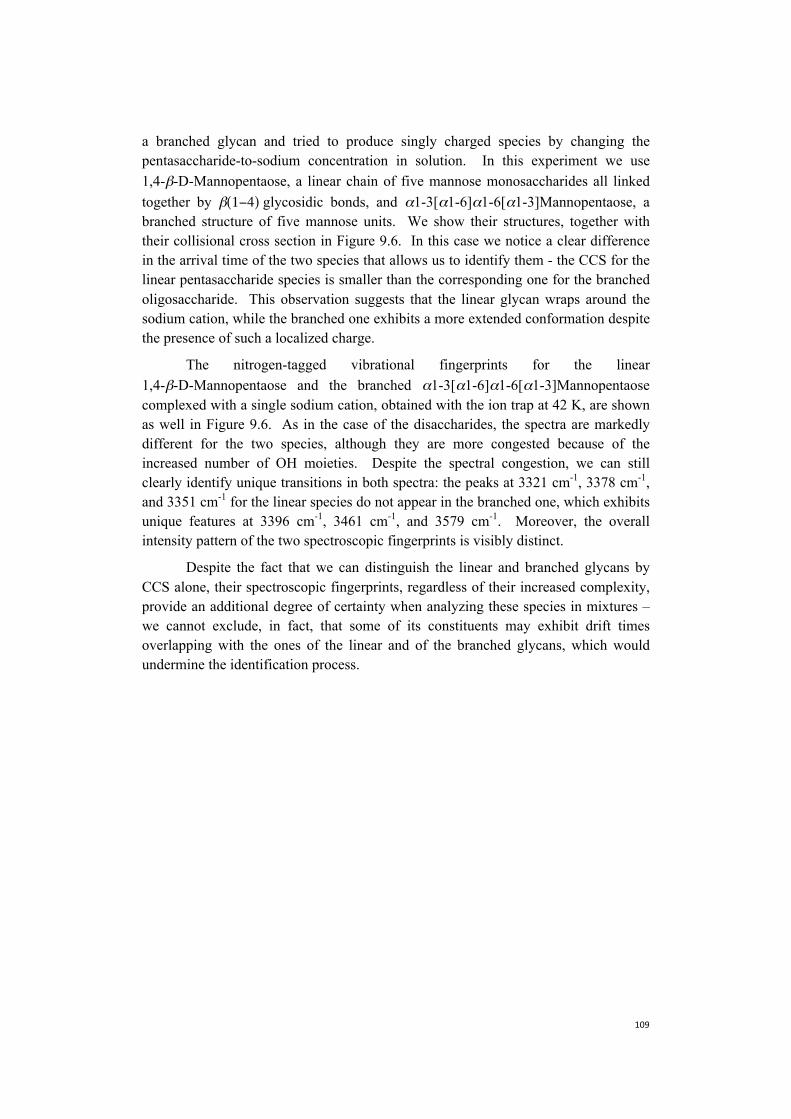
a branched glycan and tried to produce singly charged species by changing the pentasaccharide-to-sodium concentration in solution. In this experiment we use 1,4-β-D-Mannopentaose, a linear chain of five mannose monosaccharides all linked together by β(1−4) glycosidic bonds, and α1-3[α1-6]α1-6[α1-3]Mannopentaose, a branched structure of five mannose units. We show their structures, together with their collisional cross section in Figure 9.6. In this case we notice a clear difference in the arrival time of the two species that allows us to identify them - the CCS for the linear pentasaccharide species is smaller than the corresponding one for the branched oligosaccharide. This observation suggests that the linear glycan wraps around the sodium cation, while the branched one exhibits a more extended conformation despite the presence of such a localized charge.
The nitrogen-tagged vibrational fingerprints for the linear 1,4-β-D-Mannopentaose and the branched α1-3[α1-6]α1-6[α1-3]Mannopentaose complexed with a single sodium cation, obtained with the ion trap at 42 K, are shown as well in Figure 9.6. As in the case of the disaccharides, the spectra are markedly different for the two species, although they are more congested because of the increased number of OH moieties. Despite the spectral congestion, we can still clearly identify unique transitions in both spectra: the peaks at 3321 cm-1, 3378 cm-1, and 3351 cm-1 for the linear species do not appear in the branched one, which exhibits unique features at 3396 cm-1, 3461 cm-1, and 3579 cm-1. Moreover, the overall intensity pattern of the two spectroscopic fingerprints is visibly distinct.
Despite the fact that we can distinguish the linear and branched glycans by CCS alone, their spectroscopic fingerprints, regardless of their increased complexity, provide an additional degree of certainty when analyzing these species in mixtures – we cannot exclude, in fact, that some of its constituents may exhibit drift times overlapping with the ones of the linear and of the branched glycans, which would undermine the identification process.
Figure 9.6 - Collisional cross section and infrared spectroscopic fingerprint for a linear and a branched isomeric pentasaccharide. N2 was used as the messenger tag. The structure of glycans is shown using the UOXF nomenclature (6). Both pentasaccharides are complexed with a sodium cation, which is not shown.
9.3 Database protocol
The use of a database requires the development of a robust protocol to perform experiments that are highly reproducible on machines with different characteristics and ion sources. The main issue is to ensure that one measures the same glycan species each time. Since we are interested only in the primary structure of glycans, we choose to perform our experiments on sodiated species. This choice is driven by three factors: 1) sodium is naturally present in solution and binds oligosaccharides very efficiently; 2) glycans that do not contain an amine group do not protonate easily but can be sodiated - complexing aminated and non-aminated glycans with sodium allows us to study all types of glycans and avoids having to eliminate Na+ from the initial solution, which is time-consuming; 3) the addition of sodium in solution seems to reduce spectral congestion. One clear example is the spectrum of Gal β(1-4)GalNAc reported in Section 8.4. This spectroscopic fingerprint shows only 4 peaks instead of the 7 expected by counting the number of OHs in the disaccharide. This suggests that the remaining 3 bonds interact with the sodium cation, and that this interaction shifts the frequency of these bands outside the optical range of our experiment, which reduces the spectral complexity. This becomes a particularly important factor when we analyze biologically relevant oligosaccharides, since it allows us to collect relatively simple vibrational spectra despite the larger oligosaccharide size.
250200150100CCS / Å2
360034003200Infrared wavenumber / cm-1
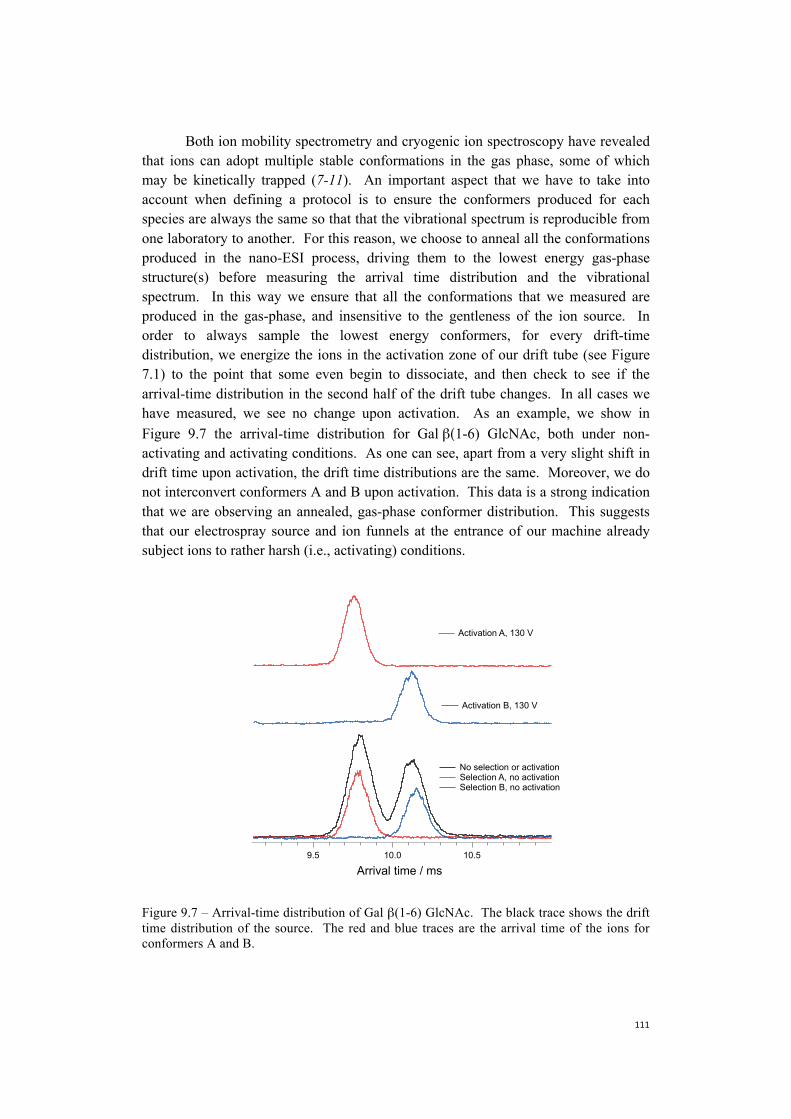
Both ion mobility spectrometry and cryogenic ion spectroscopy have revealed that ions can adopt multiple stable conformations in the gas phase, some of which may be kinetically trapped (7-11). An important aspect that we have to take into account when defining a protocol is to ensure the conformers produced for each species are always the same so that that the vibrational spectrum is reproducible from one laboratory to another. For this reason, we choose to anneal all the conformations produced in the nano-ESI process, driving them to the lowest energy gas-phase structure(s) before measuring the arrival time distribution and the vibrational spectrum. In this way we ensure that all the conformations that we measured are produced in the gas-phase, and insensitive to the gentleness of the ion source. In order to always sample the lowest energy conformers, for every drift-time distribution, we energize the ions in the activation zone of our drift tube (see Figure 7.1) to the point that some even begin to dissociate, and then check to see if the arrival-time distribution in the second half of the drift tube changes. In all cases we have measured, we see no change upon activation. As an example, we show in Figure 9.7 the arrival-time distribution for Gal β(1-6) GlcNAc, both under non-activating and activating conditions. As one can see, apart from a very slight shift in drift time upon activation, the drift time distributions are the same. Moreover, we do not interconvert conformers A and B upon activation. This data is a strong indication that we are observing an annealed, gas-phase conformer distribution. This suggests that our electrospray source and ion funnels at the entrance of our machine already subject ions to rather harsh (i.e., activating) conditions.
Figure 9.7 – Arrival-time distribution of Gal β(1-6) GlcNAc. The black trace shows the drift time distribution of the source. The red and blue traces are the arrival time of the ions for conformers A and B.
10.510.09.5
Arrival time / ms
No selection or activation Selection A, no activation Selection B, no activation
Activation A, 130 V
Activation B, 130 V
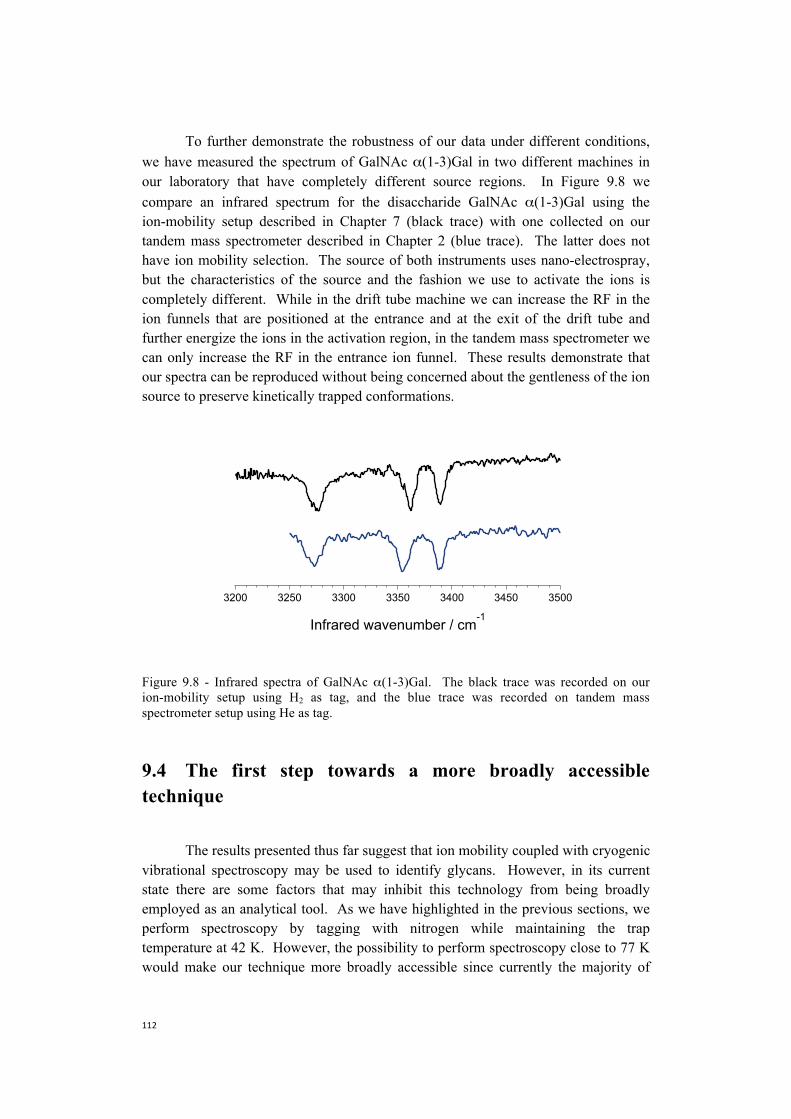
To further demonstrate the robustness of our data under different conditions, we have measured the spectrum of GalNAc α(1-3)Gal in two different machines in our laboratory that have completely different source regions. In Figure 9.8 we compare an infrared spectrum for the disaccharide GalNAc α(1-3)Gal using the ion-mobility setup described in Chapter 7 (black trace) with one collected on our tandem mass spectrometer described in Chapter 2 (blue trace). The latter does not have ion mobility selection. The source of both instruments uses nano-electrospray, but the characteristics of the source and the fashion we use to activate the ions is completely different. While in the drift tube machine we can increase the RF in the ion funnels that are positioned at the entrance and at the exit of the drift tube and further energize the ions in the activation region, in the tandem mass spectrometer we can only increase the RF in the entrance ion funnel. These results demonstrate that our spectra can be reproduced without being concerned about the gentleness of the ion source to preserve kinetically trapped conformations.
Figure 9.8 - Infrared spectra of GalNAc α(1-3)Gal. The black trace was recorded on our ion-mobility setup using H2 as tag, and the blue trace was recorded on tandem mass spectrometer setup using He as tag.
9.4 The first step towards a more broadly accessible technique
The results presented thus far suggest that ion mobility coupled with cryogenic vibrational spectroscopy may be used to identify glycans. However, in its current state there are some factors that may inhibit this technology from being broadly employed as an analytical tool. As we have highlighted in the previous sections, we perform spectroscopy by tagging with nitrogen while maintaining the trap temperature at 42 K. However, the possibility to perform spectroscopy close to 77 K would make our technique more broadly accessible since currently the majority of
3500345034003350330032503200
Infrared wavenumber / cm-1
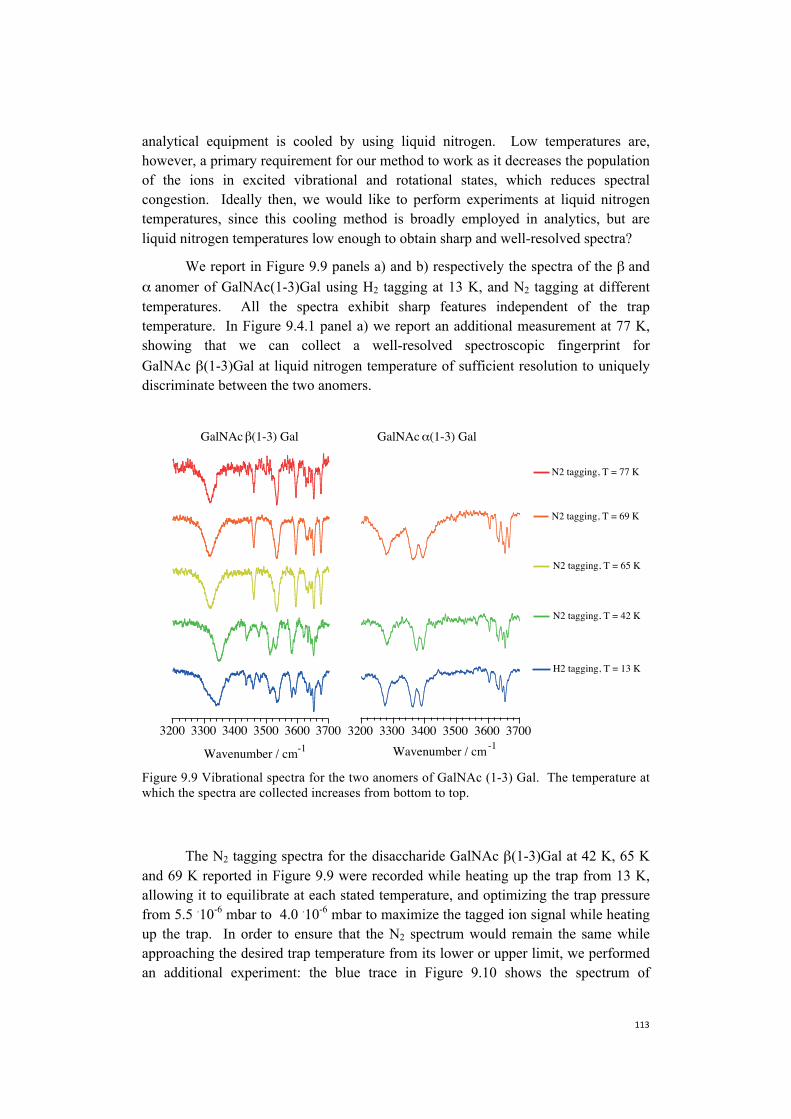
analytical equipment is cooled by using liquid nitrogen. Low temperatures are, however, a primary requirement for our method to work as it decreases the population of the ions in excited vibrational and rotational states, which reduces spectral congestion. Ideally then, we would like to perform experiments at liquid nitrogen temperatures, since this cooling method is broadly employed in analytics, but are liquid nitrogen temperatures low enough to obtain sharp and well-resolved spectra?
We report in Figure 9.9 panels a) and b) respectively the spectra of the β and α anomer of GalNAc(1-3)Gal using H2 tagging at 13 K, and N2 tagging at differenttemperatures. All the spectra exhibit sharp features independent of the traptemperature. In Figure 9.4.1 panel a) we report an additional measurement at 77 K,showing that we can collect a well-resolved spectroscopic fingerprint forGalNAc β(1-3)Gal at liquid nitrogen temperature of sufficient resolution to uniquelydiscriminate between the two anomers.
Figure 9.9 Vibrational spectra for the two anomers of GalNAc (1-3) Gal. The temperature at which the spectra are collected increases from bottom to top.
The N2 tagging spectra for the disaccharide GalNAc β(1-3)Gal at 42 K, 65 K and 69 K reported in Figure 9.9 were recorded while heating up the trap from 13 K, allowing it to equilibrate at each stated temperature, and optimizing the trap pressure from 5.5 .10-6 mbar to 4.0 .10-6 mbar to maximize the tagged ion signal while heating up the trap. In order to ensure that the N2 spectrum would remain the same while approaching the desired trap temperature from its lower or upper limit, we performed an additional experiment: the blue trace in Figure 9.10 shows the spectrum of
370036003500340033003200
Wavenumber / cm-1
GalNAc (1-3) Gal
N2 tagging, T = 77 K
N2 tagging, T = 69 K
N2 tagging, T = 65 K
N2 tagging, T = 42 K
H2 tagging, T = 13 K
370036003500340033003200
Wavenumber / cm-1
GalNAc (1-3) Gal
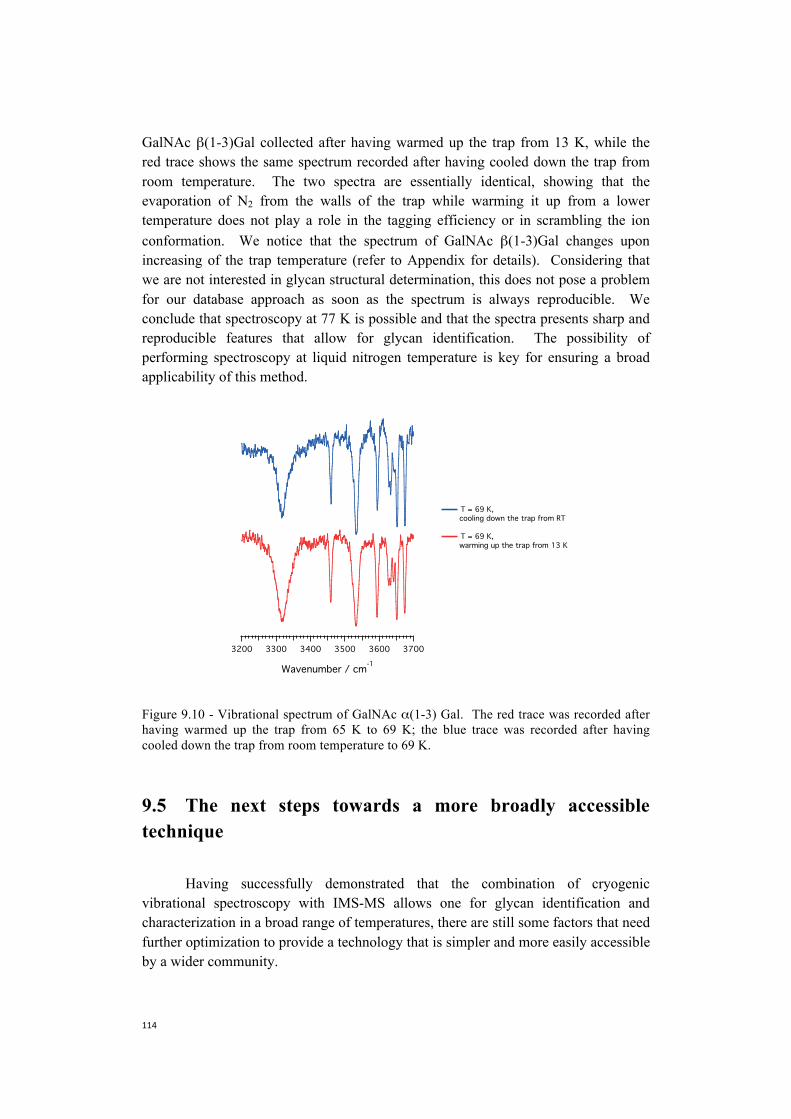
GalNAc β(1-3)Gal collected after having warmed up the trap from 13 K, while the red trace shows the same spectrum recorded after having cooled down the trap from room temperature. The two spectra are essentially identical, showing that the evaporation of N2 from the walls of the trap while warming it up from a lower temperature does not play a role in the tagging efficiency or in scrambling the ion conformation. We notice that the spectrum of GalNAc β(1-3)Gal changes upon increasing of the trap temperature (refer to Appendix for details). Considering that we are not interested in glycan structural determination, this does not pose a problem for our database approach as soon as the spectrum is always reproducible. We conclude that spectroscopy at 77 K is possible and that the spectra presents sharp and reproducible features that allow for glycan identification. The possibility of performing spectroscopy at liquid nitrogen temperature is key for ensuring a broad applicability of this method.
Figure 9.10 - Vibrational spectrum of GalNAc α(1-3) Gal. The red trace was recorded after having warmed up the trap from 65 K to 69 K; the blue trace was recorded after having cooled down the trap from room temperature to 69 K.
9.5 The next steps towards a more broadly accessible technique
Having successfully demonstrated that the combination of cryogenic vibrational spectroscopy with IMS-MS allows one for glycan identification and characterization in a broad range of temperatures, there are still some factors that need further optimization to provide a technology that is simpler and more easily accessible by a wider community.
370036003500340033003200
Wavenumber / cm-1
T = 69 K, cooling down the trap from RT
T = 69 K, warming up the trap from 13 K

We performed all our experiments using a 2-meter drift tube – the complexity, the size, and the limited resolution of this machine clearly represents a limit for broader adoption. To overcome this issue, we are currently working towards simplifying the ion-mobility part of our apparatus by using Structures for Lossless Ion Manipulation (SLIM) technology developed by R. D. Smith and coworkers (12, 13). SLIM is an extremely compact (~ 44 x 25 cm) ion-mobility module that has shown to drastically improve the resolution in ion-mobility separation of isomers with virtually no ion losses. Even by replacing our drift tube with a SLIM module, we still have to solve a very critical issue which is the data acquisition time. If on the one hand the additional spectroscopic dimension provides the key measurement to identify glycans, on the other hand the time required for the laser to scan the IR frequency range drastically slows down the measurement. A single laser scan, in fact, requires ~ 30 minutes. This means that if we consider a mixture containing, for example, 30 glycans, we would need 15 hours of data acquisition to completely characterize the mixture. The only effective solution to shorten the experiment time is then to collapse one of the dimensions of this multidimensional measurement. This can be accomplished by parallelizing the measurements and collect the vibrational spectra of the 30 species simultaneously by scanning the laser only once. In this way we can drastically reduce the total data acquisition time and provide a competitive technology to the ones currently available.
Take-home message
• The complexation of glycans with sodium has two major effects: 1) it allowsone to perform experiments on species which spontaneously tend to form insolution reducing its preparation time, and 2) it enables spectral decongestionby inducing a shift in the frequency of the OH groups which interact with it.
• Annealing all the kinetically trapped conformations produced during thenano-ESI process allows us to collect data that can be reproduced using otherinstruments without being concerned about the gentleness of the ion source.
• The vibrational fingerprints that we measure are highly reproducible over abroad range of temperatures and by using different setups. This is anindication that we sample the lowest energy gas-phase conformers.
• The ability to obtain sharp spectra at 77 K should help expedite the broaderuse of our technology in glycan analysis, but we still need new technologicaldevelopments to decrease the data acquisition time.
References
1. L. Barnes et al., Anharmonic simulations of the vibrational spectrum ofsulfated compounds: application to the glycosaminoglycan fragmentglucosamine 6-sulfate. Physical Chemistry Chemical Physics 17, 25705-25713(2015).
2. B. Brauer et al., Vibrational Spectra of alpha-Glucose, beta-Glucose, andSucrose: Anharmonic Calculations and Experiment. Journal of PhysicalChemistry A 115, 5859-5872 (2011).
3. S. K. Gregurick, J. H. Y. Liu, D. A. Brant, R. B. Gerber, Anharmonicvibrational self-consistent field calculations as an approach to improving forcefields for monosaccharides. Journal of Physical Chemistry B 103, 3476-3488(1999).
4. M. Marianski, A. Supady, T. Ingram, M. Schneider, C. Baldauf, Assessing theAccuracy of Across-the-Scale Methods for Predicting CarbohydrateConformational Energies for the Examples of Glucose and alpha-Maltose.Journal of Chemical Theory and Computation 12, 6157-6168 (2016).
5. K. Marino, J. Bones, J. J. Kattla, P. M. Rudd, A systematic approach toprotein glycosylation analysis: a path through the maze. Nature ChemicalBiology 6, 713-723 (2010).
6. D. J. Harvey et al., Proposal for a standard system for drawing structuraldiagrams of N- and O-linked carbohydrates and related compounds.Proteomics 9, 3796-3801 (2009).
7. A. Masson et al., Infrared Spectroscopy of Mobility-Selected H+-Gly-Pro-Gly-Gly (GPGG). Journal of the American Society for Mass Spectrometry 26,1444-1454 (2015).
8. N. A. Pierson, S. J. Valentine, D. E. Clemmer, Evidence for a Quasi-Equilibrium Distribution of States for Bradykinin [M + 3H]3+ Ions in the GasPhase. Journal of Chemical Physics. B 114, 7777-7783 (2010).
9. G. Papadopoulos, A. Svendsen, O. V. Boyarkin, T. R. Rizzo, ConformationalDistribution of Bradykinin bk+2 H (2+) Revealed by Cold Ion SpectroscopyCoupled with FAIMS. Journal of the American Society for Mass Spectrometry23, 1173-1181 (2012).
10. T. R. Rizzo, J. A. Stearns, O. V. Boyarkin, Spectroscopic studies of cold, gas-phase biomolecular ions. International Review of Physical Chemistry 28, 481-515 (2009).
11. J. A. Stearns, C. Seaiby, O. V. Boyarkin, T. R. Rizzo, Spectroscopy andconformational preferences of gas-phase helices. Physical ChemistryChemical Physics 11, 125-132 (2009).
12. L. L. Deng et al., Ion Mobility Separations of Isomers based upon Long PathLength Structures for Lossless Ion Manipulations Combined with MassSpectrometry. Chemistryselect 1, 2396-2399 (2016).
13. X. Y. Zheng et al., Enhancing glycan isomer separations with metal ions andpositive and negative polarity ion mobility spectrometry-mass spectrometryanalyses. Analytical and Bioanalytical Chemistry 409, 467-476 (2017).

Conclusions
Identification and characterization of oligosaccharide isomers is challenging, and no single analytical tool is currently available to address this problem. In this thesis, we presented a novel technique to enable glycan primary structure identification. This method couples IMS-MS with cryogenic vibrational spectroscopy. Our results on disaccharides show that our methodology is sensitive enough to distinguish all possible glycan isomerism (1, 2). Furthermore, the experiments we performed on larger oligosaccharides (2, 3) and improvements in the optimization of our protocol, and experimental setup promise a future for this technique to become an analytical tool. Our methodology is based on the construction of a database of mass, collisional cross section and vibrational spectrum for all standard oligosaccharides, to provide their unambiguous identification in a mixture.
But is a database approach a feasible and effective method to characterize the complex variety of glycans? And how large is this variety?
Laine et al. (4) performed a simple calculation of all possible primary structures for hexasaccharides that may be found in mammals - they considered all various types of anomericity, linkage position, monosaccharide composition and sequence possible, keeping into account that mammals have a limited number of monosaccharide options to constitute glycans (4, 5). The number of possible structures they calculated is 1.05 . 1012. This number represents a gigantic barrier for all kinds of analytical techniques based on a database approach. This barrier becomes even higher if one considers that Laine (4) ’s calculation is valid only for glycans of a well defined size, and that even larger glycans can be found in mammals (6). While on the one hand, not all of these possibilities exist in nature (4), on the other one of the most widely used glycan structure repository GlyTouCan (7) already contains 82 071 entries.
It is probably superfluous to state that designing a universal technique not database driven that could separate, identify, and sequence glycan isomers would be highly desirable, and clearly this is a common goal shared by all the laboratories interested in glycan analysis. However, as discussed in Section 6.6 of this thesis,
several DBs containing retention times, tandem mass spectra, and collisional cross sections are currently used to expedite glycan identification in mixture. Moreover, at the current state-of-the-art, they represent the only valid answer to face this problem. Additionally, a database approach has important precedents in the construction of correlation tables in organic chemistry, in the tabulation of NMR shifts, not to mention the Genome project, and all these examples are historical milestones in chemistry, and were addressed using this methodology despite their evident complexity.
The only problem of the data contained in the current DBs for glycans is that the effort put in the construction of these massive tools constitutes only a partial success in facing the glycan identification puzzle, due to the lack of one single analytical technique able to distinguish amongst all possible glycan isomerisms. This is the reason why we think that our developed technique, when coupled to a database of mass, collisional cross section, and vibrational spectrum for all standard glycans, has the potential in characterizing and identifying glycans in a unique fashion. Our goal is to provide that additional information, which we identified with the glycan vibrational spectrum, to advance the pool of analytical techniques available for glycan analysis. The approach we suggest is clearly a challenge when we consider to apply it to the 82 071 of glycans known (7). However, we can face this challenge if we are able to provide a transferrable technology that the entire glycomics community can exploit in their laboratories.
Despite its current level of complexity and the time needed to perform each experiment, we are currently pushing the limits of our experimental technique towards the needs of the analytical community. Our goal is to produce a compact high-throughput, high-resolution instrument, coupling a cold SLIM module with cryogenic vibrational spectroscopy. By using this apparatus, we aim to develop our database using a robust protocol able to be transferred from laboratory, to laboratory. Thanks to the additional spectroscopic dimension, which successfully allows us to navigate in the structural heterogeneity of glycan isomers, and to the joint effort of glycomics laboratories we imagine this database to finally address the glycan identification challenge. In conclusion, we believe that our method is enabling where there is no simpler alternative, and that it allows us to make a significant step in the understanding of these complex biomolecules.
References
1. N. Khanal, C. Masellis, M. Z. Kamrath, D. E. Clemmer, T. R. Rizzo,Glycosaminoglycan Analysis by Cryogenic Messenger-Tagging IRSpectroscopy Combined with IMS-MS. Analytical Chemistry 89, 7601-7606(2017).
2. C. Masellis, N. Khanal, M. Z. Kamrath, D. E. Clemmer, T. R. Rizzo,Cryogenic Vibrational Spectroscopy Provides Unique Fingerprints for GlycanIdentification. Journal of the American Society for Mass Spectrometry, 28,2217-2222 (2017).
3. N. Khanal et al., Cryogenic, Messenger-Tagging, IR spectroscopy Combinedwith IMS-MS for the Analysis of Human Milk Oligosaccharides.
4. R. A. Laine, A Calculation of All Possible Oligosaccharide Isomers BothBranched and Linear Yields 1.05x10(12) Structures for a ReducingHexasaccharide - the Isomer-Barrier to Development of Single-MethodSaccharide Sequencing or Synthesis Systems. Glycobiology 4, 759-767(1994).
5. K. T. Pilobello, L. K. Mahal, Deciphering the glycocode: the complexity andanalytical challenge of glycomics. Current Opiinions in Chemical Biology 11,300-305 (2007).
6. A. Varki, Cummings, R.D., Esko, J.D. et al., Essentials of Glycobiology.(Cold Spring Harbor (NY), ed. 2nd, 2009).
7. Integrated Database Project (MEXT), Program for Coordination TowardsIntegration of Related Databases (JST); GlyTouCan; https://glytoucan.org/.

Appendix The role of temperature in the N2 tagging process
Figure 9.9 in chapter 9 shows the vibrational spectra of the two anomers of GalNAc (1-3)Gal upon increasing of the trap temperature. We notice: 1) that the spectra of GalNAc β(1-3)Gal are different when recorded with H2 and N2; 2) the N2 tagging spectrum of GalNAc β(1-3)Gal changes upon increasing of the trap temperature; and 3) neither the nature of the tag, nor the temperature seem to influence the spectrum of the α-anomer.
If we focus our attention on the spectra of GalNAc β(1-3)Gal, we notice that its N2 spectrum recorded holding the trap temperature at 42 K and its H2 spectrum show similar transitions. However, the shoulder at 3320 cm-1, and the lines at 3460 cm-1 and 3610 cm-1 disappear. If we consider now only GalNAc β(1-3)Gal N2 tagging spectra upon temperature increase, we realize that the fingerprint changes in the range of temperatures 42 – 65 K, and then remains the same. Moreover, the spectra at lower temperatures are more complex than the spectra at higher ones - this observation seems counterintuitive at first: we expect more conformations for an ion to become visible increasing its temperature due to the higher number of rotational and vibrational states which become available. In our experiment, though, we recorded the spectra of a cluster, GalNac β(1-3)Gal complexed with one sodium cation. As ongoing studies carried on in Mark Johnson’s group suggest (private communication), sodium has high thermal mobility. Its binding to a molecule is not site selective. This means that by changing the temperature of the system a larger or smaller number of binding sites become available or forbidden, and this process depends on the characteristics of the system, i.e. glycan, investigated.
Figure A1 shows in orange the sum of the N2 tagging spectra of GalNac β(1-3)Gal recorded at 42 K (in green) and 77 K (in red), and compares it with the H2 tagging trace. We notice that all the transitions present in the H2 tagging spectrum are recovered by the sum of the two N2 tagging ones. This suggests that at lower temperature GalNAc β(1-3)Gal has at least two binding sites for the sodium cation. However, by rising the temperature to 42 K one (or more) of these sites becomes unavailable, and the vibrational fingerprint becomes less complex. This is visible by the lack of the transitions at 3320 cm-1, 3460 cm-1, and 3610 cm-1 from the
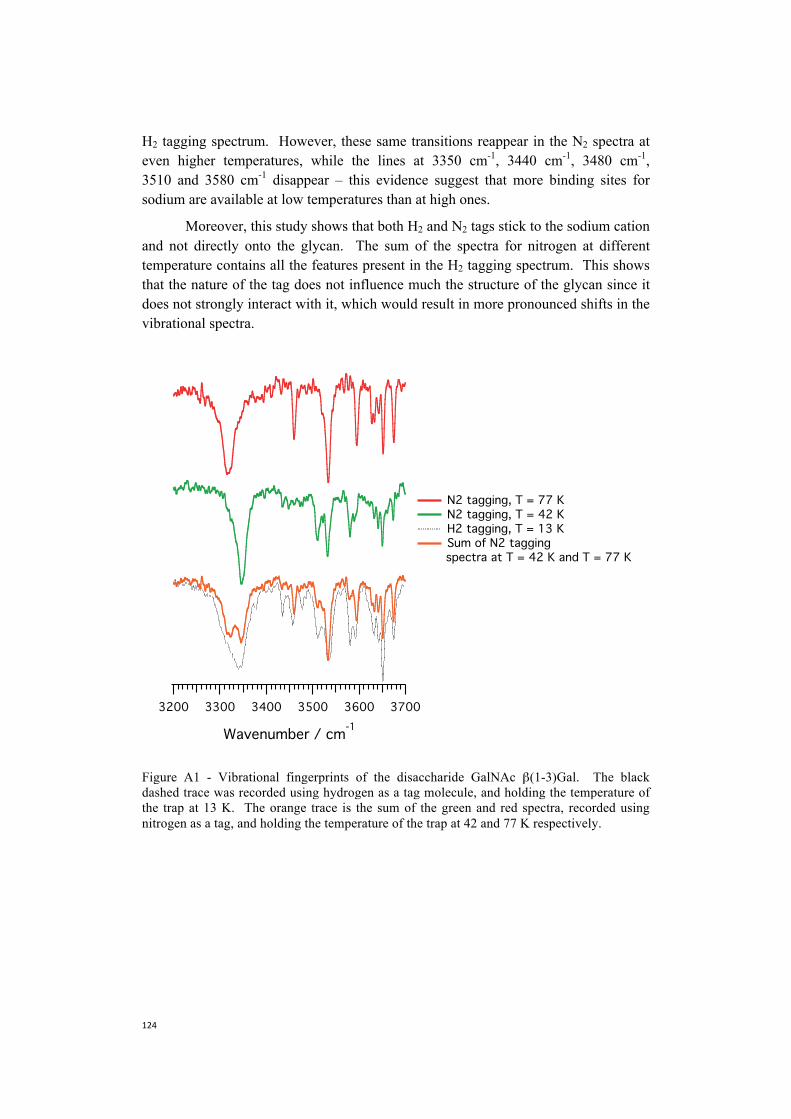
H2 tagging spectrum. However, these same transitions reappear in the N2 spectra at even higher temperatures, while the lines at 3350 cm-1, 3440 cm-1, 3480 cm-1, 3510 and 3580 cm-1 disappear – this evidence suggest that more binding sites for sodium are available at low temperatures than at high ones.
Moreover, this study shows that both H2 and N2 tags stick to the sodium cation and not directly onto the glycan. The sum of the spectra for nitrogen at different temperature contains all the features present in the H2 tagging spectrum. This shows that the nature of the tag does not influence much the structure of the glycan since it does not strongly interact with it, which would result in more pronounced shifts in the vibrational spectra.
Figure A1 - Vibrational fingerprints of the disaccharide GalNAc β(1-3)Gal. The black dashed trace was recorded using hydrogen as a tag molecule, and holding the temperature of the trap at 13 K. The orange trace is the sum of the green and red spectra, recorded using nitrogen as a tag, and holding the temperature of the trap at 42 and 77 K respectively.
370036003500340033003200
Wavenumber / cm-1
N2 tagging, T = 77 K N2 tagging, T = 42 K H2 tagging, T = 13 K Sum of N2 tagging
spectra at T = 42 K and T = 77 K
Acknowledgements
These last four years have been a continuous surprise to me. Each time I thought I reached a goal, a new road opened leading to more exciting things. All that happened - good or bad - and all the people who have been part of it, made me realized how lucky I am in having landed in Switzerland four years ago.
From the bottom of my hearth, I would like to thank Prof. Thomas Rizzo. Tom, thanks for having given me the chance to join LCPM, for providing me with both the support and the independence that is needed to develop critical thinking and self-confidence, and for reminding me that “one should always focus on the big picture”… even when nothing in the lab is working.
Another person that I would like to thank is Dr. Oleg Boyarkine. Thanks for having me introduced to Tom and LCPM, trusting my will of learning all the laser and high-vacuum stuff I did not know when I applied.
Moreover, I would also like to thank Dr. Anne-Sophie Chauvin, Prof. Perdita Barran, Prof. Philippe Dugourd, and Prof. Majed Chergui for having accepted to be members of my PhD exam committee, and evaluated this thesis.
I am extremely grateful to all the people of the present and past LCPM bio-group. A special thanks goes to Valeriu Scutelnic: Val, we spent one and a half year together fixing the machine in the lab, coming up with the most unconventional ways to screw all the pieces back together, and trying not to eat screws which would fall from above our heads... It was extremely frustrating for the both of us, but honestly looking back it was a lot of fun because we were a good team… and we made it! Thank you for the enthusiasm you always showed, even when it seemed we would never finish. I would also like to thank Dr. Lucy Voronina for spending a lot of time in the lab with me, explaining how our awesome Machine II works, discussing about data, and… about life. Thanks as well to Dr. Oleg Aseev and Dr. Aleksandra Zabuga for fruitful discussions and nice evenings along the lake. I would also like to acknowledge Dr. Mike Kamrath for his support in particular during the last part of my PhD. Each time I was collecting data and something on the drift tube would suddenly stop working, I knew I could always count on him to help me figure things out.
A big thanks goes to the present LCPM bio-lab crew: Dr. Stephan Warnke, Max Doppelbauer, Natalia Yalovenko, Ahmed Ben Faleh, and Robert Pellegrinelli. Thanks for supporting me during the last months of experiments and during the writing of my thesis. LCPM group goes beyond the only bio-lab, so I would like to thank all the wonderful people who were and are part of it for the good time we had during and after work, including as well all the members of the LND lab. A particular thanks goes to Dr. Marcel Drabbels who shared with me his passion for teaching, and to Dr. Andreas Osterwalder for all the extravagant discussions about 3D printing, and our common passion for Italian coffee.
I enjoyed a lot spending time at the Fritz Haber Institute of Berlin under the supervision of Prof. Carsten Baldauf. Thanks Carsten for all the support you gave me during the time I was there, and for the funny evenings out together with your group!
My whole gratitude goes to Markus Schneider and Neelam Khanal. All the projects we have been working on finally became papers! Thanks for being extremely supporting collaborators, and for all the time we shared inside and outside the lab. I will never forget soldering cables at 4 a.m. with Markus, and the ice-cream at 3 p.m. after the last experiment with Neelam.
A great group is held together by skilled and motivated secretaries, so I want to warmly thank Angeles Alarcon, and Marie-Christine Lehman - I would always find a smile when walking to their office… even when bringing only invoices ☺. A particular thanks goes to the first LCPM secretary, Marianne Dang Bridel. I owe you a lot, Marianne. You are one of the most special people I met, and I am so glad that we bumped into each other’s lives. Your friendship is like a gift to me.
My PhD would have surely been more difficult if I did not meet the wonderful people who I now consider part of my “extended family”. Thanks to Daniela, for standing me, encouraging me all the times I needed it, and never let me down. Thanks to Sara for our special friendship that was born over hundred cups of coffee and our trip to Tokyo. Thanks to Filippo, Lucilla, Giovanni, and Davide who always took care of me during the moments I was not able to do it myself, even without asking them.
A very special thanks goes to Vero and Ana for our evenings out, long chats, and their constant support inside and outside the lab. Thanks to Chris, one of the best guys I know, for being always positive and enthusiast. Thanks to Gabriele for the time spent together travelling in The Netherlands, Germany, and Japan! Thanks to Manon Ruchet for being the best firefighter partner ever. Thanks to Tamara, Hamish and Ghil for building together the new EPFL FSB Running Team: it is an honor for me to be part of such a great team.Thanks to my friends in Italy Stefano, Francesca and Emanuele for keeping being my friends despite the distance.
A special acknowledgment goes to Monsieur Claude Michelle for giving me a roof when I did not have one, trusting the naïve Italian woman with the caravan.

Thanks to Madame Colette Schenk who, just by shaking my hand, gave me the unforgettable opportunity to move in her horse-ranch.
Thanks to Mike, Jean-Marc, Anna-Rita, Cinzia, and Valeria who followed with me the signs to Santiago. My acknowledgements would not be complete if I did not mention my dear Teo. Meeting you and travelling together across Spain and Brazil was a blessing. Thanks for being my Camino brother forever.
The sweetest thought goes to my dearest Prof. Maria Costanza Gallino, since none of this would have been possible without her.
From the bottom of my hearth I want to thank my family who supported and encouraged me during the entire period of my PhD. Le parole non bastano per dirvi quanto vi voglia bene e per quanto vi sia grata di quello che mi avete dato. Nonostante la fatica dei viaggi e la distanza, voglio che sappiate che siamo sempre la stessa forza e che nulla ci potrà mai separare. Grazie per la fiducia che mi date ogni giorno, per il vostro supporto e per non avermi mai fatta sentire sola. L’amore non teme la distanza perché siamo sotto lo stesso cielo, e siamo sempre vicini se solo alziamo gli occhi a guardarlo. Il grazie più speciale va a mia sorella Serena per essere costantemente la mia preziosa Charlie.
One last thanks goes to my special German, Jörn. Thanks for being on my side and for loving me each day. Thanks for always finding the way to make me laugh even when nothing seems to work, and for walking with me to the summit of each mountain.
Lausanne, 31st July 2017

Chiara Masellis
Chemin de Rionza 5 1020 Renens,
Switzerland +41 77 471 44 54
[email protected] LinkedIn: ChiaraMasellis
Date of birth: 16.08.1989 Citizenship: Italian
Education• ÉÉcole Polytechnique Fédérale de Lausanne, Switzerland
Ph.D. in Physical Chemistry (2013 – current)
o Doctoral program in collaboration with the Max Plank Society.o One month exchange at Fritz-Haber Institute of the Max Plank Society in Berlin.
• University of Turin, ItalyMaster’s Degree in Physics (2013)
o Final Mark: 110/110 Cum Laude and Academic Distinction.• University of Turin, Italy
Bachelor’s Degree in Physics (2011)
o Final Mark: 110/110.
Research experience• École Polytechnique Fédérale de Lausanne, Switzerland
Research Assistant (2013 – current) - LCPM groupo Developed an innovative strategy to identify glycans (patent application number
PCT/IB201 /0551 , filed 29 August 201 )
o Led and designed experiments to characterize peptides structure.o Devised and led experiments involving home-built instruments and spectroscopic
techniques.
• European Synchrotron Radiation Facil ity (ESRF), Grenoble, France Masterthesis project (2013) – Peroni group.o Conducted an experimental and theoretical study of the geometrical and electronic
structure of the active site of Carbonic Anhydrase protein using X-rays absorption and emission techniques.
• Istituto Nazionale di Fisica Nucleare (INFN) Turin, ItalyBachelor Thesis project (2011) – (MAGIC)-5 group.
o Optimized a Channeler Ant Model algorithm for a Computer Assisted Detectionprogram to automatically analyze computer tomographies of lungs.
Scientific publications• Cryogenic Vibrational Spectroscopy Provides Unique Fingerprints for Glycan Identification
Masellis C., Khanal N., Kamrath M.Z., Clemmer D.E., Rizzo T.R.
Am. Soc. Mass. Spectrom., DOI 10.1007/s13361-017-1728-6.• Glycosaminoglycan Analysis by Cryogenic Messenger-Tagging IR Spectroscopy Combined
with IMS-MS

Khanal N., Masellis C., Kamrath M.Z., Clemmer D.E., Rizzo T.R. Anal. Chem., , 7601-7606.
• Kinetically Trapped Liquid-State Conformers of a Sodiated Model Peptide Observed inthe Gas PhaseSchneider M., Masellis C., Rizzo T.R., Baldauf C.
• Spectroscopic Fingerprint of Helical Peptides in the Gas-PhaseMasellis C., Rizzo T.R. (in preparation)
Oral presentations at international conferences• June 2017: American Society for Mass Spectrometry – Indianapolis IN, USA• March 2017: Conference on Molecular Nanostructures - Ascona, Switzerland• February 2017: Gordon Research Conference on Gaseous Ions - Ventura CA, USA• October 2016: Max Planck Society – EPFL Science Day, Stuttgart, Germany• September 2016: 4th European Conference on Trapped Ions – Arosa, Switzerland• October 2015: Max Planck Society – EPFL Science Day, Lausanne Switzerland• June 2015: Spectroscopy and Applications of Cold Molecular Ions – Bad Honnef,
Germany
Poster presentations at international conferences• April 2016: Isolated Biomolecules and Biomolecular Interactions – Oxford, UK• September 2015: Swiss Chemical Society Fall Meeting – Lausanne, Switzerland• April 2015: Tulip Summer School – Noordkijk, The Neederlands• June 2015: Spectroscopy and Applications of Cold Molecular Ions – Bad Honnef,
Germany• May 2014: Isolated Biomolecules and Biomolecular Interactions – Porquerroles Island,
France• March 2014: Conference on Molecular Nanostructures – Ascona, Switzerland
Teaching experience
• École Polytechnique Fédérale de Lausanne, SwitzerlandTeaching Assistant (2013 – current)o Prepared and discussed in class exercises for the courses of the Bachelor Program in
Chemistry and Chemical Engineering:o Quantum Chemistry – class taught in English and French.o Spectroscopy – class taught in English.o Physique Générale I – class taught in French.
o Received the EPFL Teaching Award for Quantum Chemistry class – September 2016.
o Introduced students to real-life experimental equipment, guided them in conductingthe experiments, the subsequent data analysis, and report writing for the laboratoryof Experimental Physical Chemistry of the Bachelor Program in Chemistry andChemical Engineering.
Professional skills• Proven expertise in spectroscopic techniques: IR, UV, action spectroscopy, XAS, XES and
XANES.• Expertise in ion mobility, i.e. drift tube IM and FAIMS.

• Operation and maintenance of laser systems and low- and high-vacuum equipment.• Expertise in: MS Office Suite, Igor Pro, LaTeX, Adobe Illustrator.• Knowledge of C++, Python.• Experience in writing scientific articles, abstracts, proposals, and provisional patent files.• Strong analytical and problem-solving skills.• Excellent communication and presentation skills.
Languages• Italian: Native.• English: Fluent written and oral.• French: Fluent oral and intermediate written.• German, Spanish: Basic written and oral.