Embed Size (px)
Citation preview
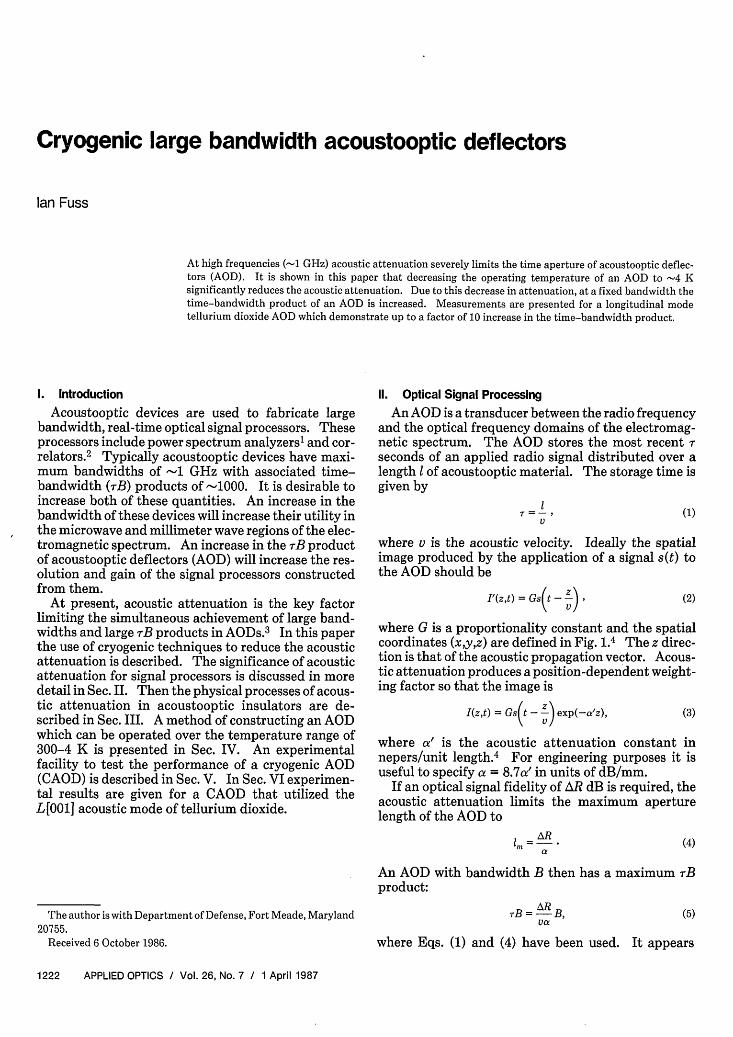
Cryogenic large bandwidth acoustooptic deflectors
Ian Fuss
At high frequencies (1 GHz) acoustic attenuation severely limits the time aperture of acoustooptic deflec-tors (AOD). It is shown in this paper that decreasing the operating temperature of an AOD to -4 Ksignificantly reduces the acoustic attenuation. Due to this decrease in attenuation, at a fixed bandwidth thetime-bandwidth product of an AOD is increased. Measurements are presented for a longitudinal modetellurium dioxide AOD which demonstrate up to a factor of 10 increase in the time-bandwidth product.
1. Introduction
Acoustooptic devices are used to fabricate largebandwidth, real-time optical signal processors. Theseprocessors include power spectrum analyzers' and cor-relators.2 Typically acoustooptic devices have maxi-mum bandwidths of -1 GHz with associated time-bandwidth (rB) products of -1000. It is desirable toincrease both of these quantities. An increase in thebandwidth of these devices will increase their utility inthe microwave and millimeter wave regions of the elec-tromagnetic spectrum. An increase in the rB productof acoustooptic deflectors (AOD) will increase the res-olution and gain of the signal processors constructedfrom them.
At present, acoustic attenuation is the key factorlimiting the simultaneous achievement of large band-widths and large rB products in AODs.3 In this paperthe use of cryogenic techniques to reduce the acousticattenuation is described. The significance of acousticattenuation for signal processors is discussed in moredetail in Sec. II. Then the physical processes of acous-tic attenuation in acoustooptic insulators are de-scribed in Sec. III. A method of constructing an AODwhich can be operated over the temperature range of300-4 K is presented in Sec. IV. An experimentalfacility to test the performance of a cryogenic AOD(CAOD) is described in Sec. V. In Sec. VI experimen-tal results are given for a CAOD that utilized theL[001] acoustic mode of tellurium dioxide.
11. Optical Signal Processing
An AOD is a transducer between the radio frequencyand the optical frequency domains of the electromag-netic spectrum. The AOD stores the most recent rseconds of an applied radio signal distributed over alength of acoustooptic material. The storage time isgiven by
1=-,V
(1)
where v is the acoustic velocity. Ideally the spatialimage produced by the application of a signal s(t) tothe AOD should be
(2)
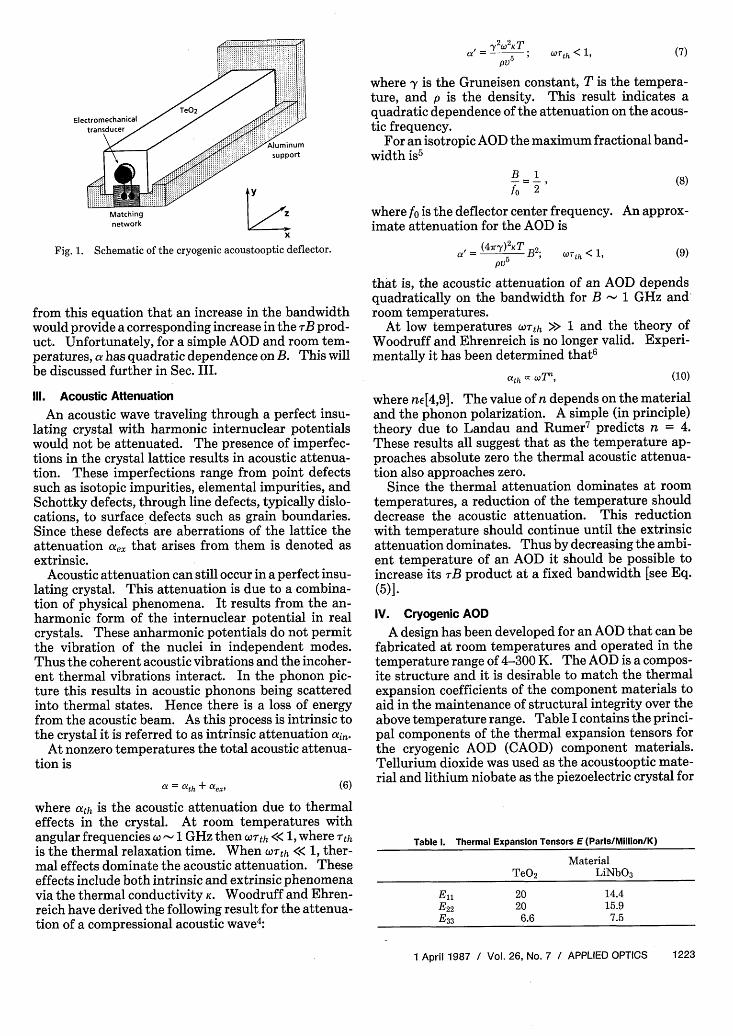
where G is a proportionality constant and the spatialcoordinates (x,y,z) are defined in Fig. 1.4 The z direc-tion is that of the acoustic propagation vector. Acous-tic attenuation produces a position-dependent weight-ing factor so that the image is
I(z,t) = Gs(t - ) exp(-a'z), (3)
where a' is the acoustic attenuation constant innepers/unit length.4 For engineering purposes it isuseful to specify a = 8.7a' in units of dB/mm.
If an optical signal fidelity of AR dB is required, theacoustic attenuation limits the maximum aperturelength of the AOD to
a =-. (4)
An AOD with bandwidth B then has a maximum rBproduct:
The author is with Department of Defense, Fort Meade, Maryland20755.
Received 6 October 1986.
rB = - B,Va
(5)
where Eqs. (1) and (4) have been used. It appears
1222 APPLIED OPTICS / Vol. 26, No. 7 / 1 April 1987
ZF(zt = Gs t - - ,V )
a' = 2 ; CTth < 1,pV
(7)
where y is the Gruneisen constant, T is the tempera-ture, and p is the density. This result indicates aquadratic dependence of the attenuation on the acous-tic frequency.
For an isotropic AOD the maximum fractional band-width is5
B 1= ,
fo 2B~~~~~~~~~1Y
Matching Znetwork / >
X
Fig. 1. Schematic of the cryogenic acoustooptic deflector.
(8)
where fo is the deflector center frequency. An approx-imate attenuation for the AOD is
(4ry)KT 2 h < 1B; WTjl (9)
from this equation that an increase in the bandwidthwould provide a corresponding increase in the TB prod-uct. Unfortunately, for a simple AOD and room tem-peratures, a has quadratic dependence on B. This willbe discussed further in Sec. III.
III. Acoustic Attenuation
An acoustic wave traveling through a perfect insu-lating crystal with harmonic internuclear potentialswould not be attenuated. The presence of imperfec-tions in the crystal lattice results in acoustic attenua-tion. These imperfections range from point defectssuch as isotopic impurities, elemental impurities, andSchottky defects, through line defects, typically dislo-cations, to surface defects such as grain boundaries.Since these defects are aberrations of the lattice theattenuation aex that arises from them is denoted asextrinsic.
Acoustic attenuation can still occur in a perfect insu-lating crystal. This attenuation is due to a combina-tion of physical phenomena. It results from the an-harmonic form of the internuclear potential in realcrystals. These anharmonic potentials do not permitthe vibration of the nuclei in independent modes.Thus the coherent acoustic vibrations and the incoher-ent thermal vibrations interact. In the phonon pic-ture this results in acoustic phonons being scatteredinto thermal states. Hence there is a loss of energyfrom the acoustic beam. As this process is intrinsic tothe crystal it is referred to as intrinsic attenuation ain.
At nonzero temperatures the total acoustic attenua-tion is
a =ath + aex, (6)
that is, the acoustic attenuation of an AOD dependsquadratically on the bandwidth for B 1 GHz androom temperatures.
At low temperatures W'th >> 1 and the theory ofWoodruff and Ehrenreich is no longer valid. Experi-mentally it has been determined that6
ath 7" (10)
where nE[4,9]. The value of n depends on the materialand the phonon polarization. A simple (in principle)theory due to Landau and Rumer7 predicts n = 4.These results all suggest that as the temperature ap-proaches absolute zero the thermal acoustic attenua-tion also approaches zero.
Since the thermal attenuation dominates at roomtemperatures, a reduction of the temperature shoulddecrease the acoustic attenuation. This reductionwith temperature should continue until the extrinsicattenuation dominates. Thus by decreasing the ambi-ent temperature of an AOD it should be possible toincrease its rB product at a fixed bandwidth [see Eq.(5)].
IV. Cryogenic AOD
A design has been developed for an AOD that can befabricated at room temperatures and operated in thetemperature range of 4-300 K. The AOD is a compos-ite structure and it is desirable to match the thermalexpansion coefficients of the component materials toaid in the maintenance of structural integrity over theabove temperature range. Table I contains the princi-pal components of the thermal expansion tensors forthe cryogenic AOD (CAOD) component materials.Tellurium dioxide was used as the acoustooptic mate-rial and lithium niobate as the piezoelectric crystal for
where ath is the acoustic attenuation due to thermaleffects in the crystal. At room temperatures withangular frequencies c 1 GHz then COfth << 1, where Tth
is the thermal relaxation time. When CWTth << 1, ther-mal effects dominate the acoustic attenuation. Theseeffects include both intrinsic and extrinsic phenomenavia the thermal conductivity K. Woodruff and Ehren-reich have derived the following result for the attenua-tion of a compressional acoustic wave4:
Table I. Thermal Expansion Tensors E (Parts/Million/K)
MaterialTeO2 LiNbO3
E1l 20 14.4E22 20 15.9E3 3 6.6 7.5
1 April 1987 / Vol. 26, No. 7 / APPLIED OPTICS 1223
DCSTOP TRANSLATION STAGE 2
TRANSLATION STAGE 1
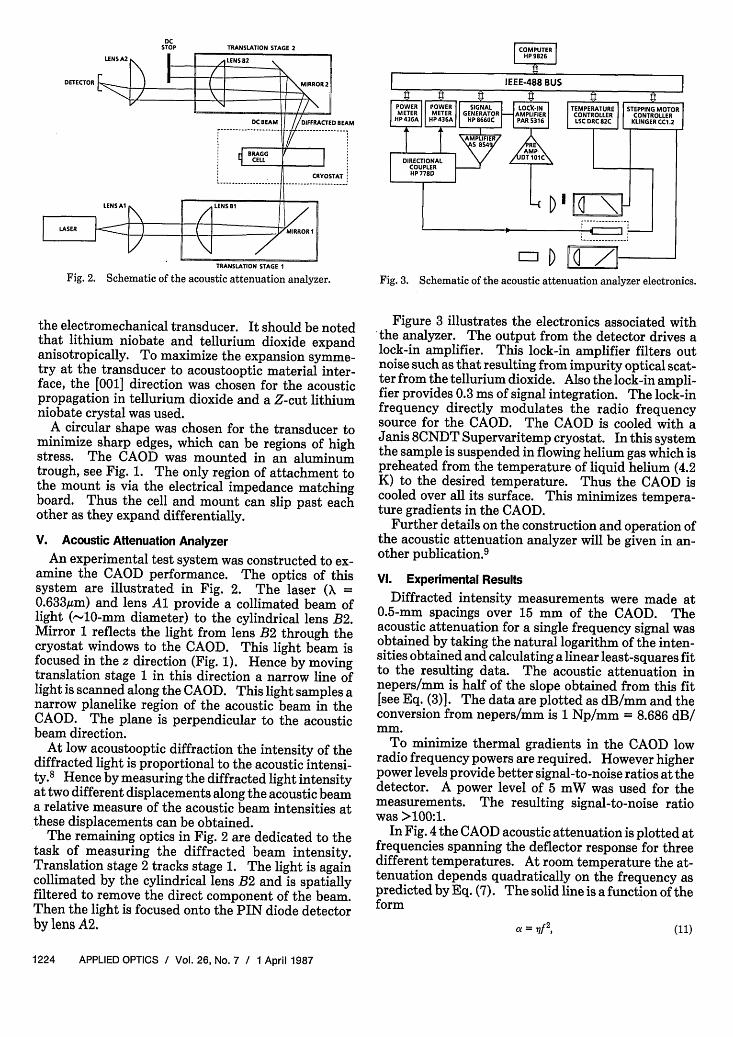
Fig. 2. Schematic of the acoustic attenuation analyzer.
the electromechanical transducer. It should be notedthat lithium niobate and tellurium dioxide expandanisotropically. To maximize the expansion symme-try at the transducer to acoustooptic material inter-face, the [001] direction was chosen for the acousticpropagation in tellurium dioxide and a Z-cut lithiumniobate crystal was used.
A circular shape was chosen for the transducer tominimize sharp edges, which can be regions of highstress. The CAOD was mounted in an aluminumtrough, see Fig. 1. The only region of attachment tothe mount is via the electrical impedance matchingboard. Thus the cell and mount can slip past eachother as they expand differentially.
V. Acoustic Attenuation Analyzer
An experimental test system was constructed to ex-amine the CAOD performance. The optics of thissystem are illustrated in Fig. 2. The laser ( =0.633gm) and lens Al provide a collimated beam oflight (10-mm diameter) to the cylindrical lens B2.Mirror 1 reflects the light from lens B2 through thecryostat windows to the CAOD. This light beam isfocused in the z direction (Fig. 1). Hence by movingtranslation stage 1 in this direction a narrow line oflight is scanned along the CAOD. This light samples anarrow planelike region of the acoustic beam in theCAOD. The plane is perpendicular to the acousticbeam direction.
At low acoustooptic diffraction the intensity of thediffracted light is proportional to the acoustic intensi-ty.8 Hence by measuring the diffracted light intensityat two different displacements along the acoustic beama relative measure of the acoustic beam intensities atthese displacements can be obtained.
The remaining optics in Fig. 2 are dedicated to thetask of measuring the diffracted beam intensity.Translation stage 2 tracks stage 1. The light is againcollimated by the cylindrical lens B2 and is spatiallyfiltered to remove the direct component of the beam.Then the light is focused onto the PIN diode detectorby lens A2.
Fig. 3. Schematic of the acoustic attenuation analyzer electronics.
Figure 3 illustrates the electronics associated with*the analyzer. The output from the detector drives alock-in amplifier. This lock-in amplifier filters outnoise such as that resulting from impurity optical scat-ter from the tellurium dioxide. Also the lock-in ampli-fier provides 0.3 ms of signal integration. The lock-infrequency directly modulates the radio frequencysource for the CAOD. The CAOD is cooled with aJanis 8CNDT Supervaritemp cryostat. In this systemthe sample is suspended in flowing helium gas which ispreheated from the temperature of liquid helium (4.2K) to the desired temperature. Thus the CAOD iscooled over all its surface. This minimizes tempera-ture gradients in the CAOD.
Further details on the construction and operation ofthe acoustic attenuation analyzer will be given in an-other publication.9
VI. Experimental Results
Diffracted intensity measurements were made at0.5-mm spacings over 15 mm of the CAOD. Theacoustic attenuation for a single frequency signal wasobtained by taking the natural logarithm of the inten-sities obtained and calculating a linear least-squares fitto the resulting data. The acoustic attenuation innepers/mm is half of the slope obtained from this fit[see Eq. (3)]. The data are plotted as dB/mm and theconversion from nepers/mm is 1 Np/mm = 8.686 dB/mm.
To minimize thermal gradients in the CAOD lowradio frequency powers are required. However higherpower levels provide better signal-to-noise ratios at thedetector. A power level of 5 mW was used for themeasurements. The resulting signal-to-noise ratiowas >100:1.
In Fig. 4 the CAOD acoustic attenuation is plotted atfrequencies spanning the deflector response for threedifferent temperatures. At room temperature the at-tenuation depends quadratically on the frequency aspredicted by Eq. (7). The solid line is a function of theform
O = nf2, (11)
1224 APPLIED OPTICS / Vol. 26, No. 7 / 1 April 1987
1.2
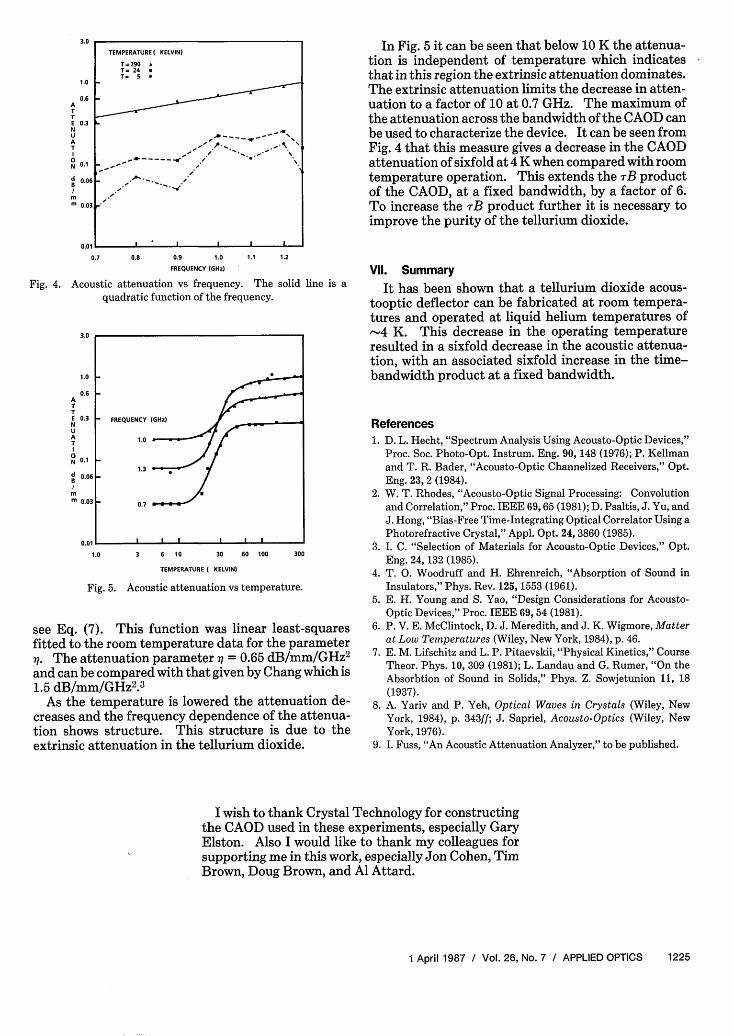
Fig. 4. Acoustic attenuation vs frequency. The solid line is aquadratic function of the frequency.
3.0
1.0
0.6 -ATT
0.3 FREQUENCY (Hz)NUAT 1.0 - -
N 0.1
d 0.06 /
m 0.03 0.7
0.01 I l l l
1.0 3 6 10 30 60 100 300
TEMPERATURE ( KELVIN)
Fig. 5. Acoustic attenuation vs temperature.
see Eq. (7). This function was linear least-squaresfitted to the room temperature data for the parameteraq. The attenuation parameter X = 0.65 dB/mm/GHz 2
and can be compared with that given by Chang which is1.5 dB/mm/GHz 2 .3
As the temperature is lowered the attenuation de-creases and the frequency dependence of the attenua-tion shows structure. This structure is due to theextrinsic attenuation in the tellurium dioxide.
In Fig. 5 it can be seen that below 10 K the attenua-tion is independent of temperature which indicatesthat in this region the extrinsic attenuation dominates.The extrinsic attenuation limits the decrease in atten-uation to a factor of 10 at 0.7 GHz. The maximum ofthe attenuation across the bandwidth of the CAOD canbe used to characterize the device. It can be seen fromFig. 4 that this measure gives a decrease in the CAODattenuation of sixfold at 4 K when compared with roomtemperature operation. This extends the rB productof the CAOD, at a fixed bandwidth, by a factor of 6.To increase the rB product further it is necessary toimprove the purity of the tellurium dioxide.
VII. Summary
It has been shown that a tellurium dioxide acous-tooptic deflector can be fabricated at room tempera-tures and operated at liquid helium temperatures of-4 K. This decrease in the operating temperatureresulted in a sixfold decrease in the acoustic attenua-tion, with an associated sixfold increase in the time-bandwidth product at a fixed bandwidth.
References1. D. L. Hecht, "Spectrum Analysis Using Acousto-Optic Devices,"
Proc. Soc. Photo-Opt. Instrum. Eng. 90, 148 (1976); P. Kellmanand T. R. Bader, "Acousto-Optic Channelized Receivers," Opt.Eng. 23, 2 (1984).
2. W. T. Rhodes, "Acousto-Optic Signal Processing: Convolutionand Correlation," Proc. IEEE 69,65 (1981); D. Psaltis, J. Yu, andJ. Hong, "Bias-Free Time-Integrating Optical Correlator Using aPhotorefractive Crystal," Appl. Opt. 24, 3860 (1985).
3. I. C. "Selection of Materials for Acousto-Optic Devices," Opt.Eng. 24, 132 (1985).
4. T. 0. Woodruff and H. Ehrenreich, "Absorption of Sound inInsulators," Phys. Rev. 125, 1553 (1961).
5. E. H. Young and S. Yao, "Design Considerations for Acousto-Optic Devices," Proc. IEEE 69, 54 (1981).
6. P. V. E. McClintock, D. J. Meredith, and J. K. Wigmore, Matterat Low Temperatures (Wiley, New York, 1984), p. 46.
7. E. M. Lifschitz and L. P. Pitaevskii, "Physical Kinetics," CourseTheor. Phys. 10, 309 (1981); L. Landau and G. Rumer, "On theAbsorbtion of Sound in Solids," Phys. Z. Sowjetunion 11, 18(1937).
8. A. Yariv and P. Yeh, Optical Waves in Crystals (Wiley, NewYork, 1984), p. 343ff; J. Sapriel, Acousto-Optics (Wiley, NewYork, 1976).
9. I. Fuss, "An Acoustic Attenuation Analyzer," to be published.
I wish to thank Crystal Technology for constructingthe CAOD used in these experiments, especially GaryElston. Also I would like to thank my colleagues forsupporting me in this work, especially Jon Cohen, TimBrown, Doug Brown, and Al Attard.
1 April 1987 / Vol. 26, No. 7 / APPLIED OPTICS 1225
3.0
1.0
0.6
TATE 0.3N
AT
N 0.1
TEMPERATURE( KELVIN)
T=290 T= 24 T=
_ 1.>
-p.. , -.#, # -- ~~-S
Ioi . ~~~~~ . /~Id
B 0.06
0.03 13,
0.01
0.7 0.8 0.9 1.0 1.1
FREQUENCY (GHz)
. . . .
A.1 . w.