Embed Size (px)
Citation preview
NOTES
Cryogenic Separation of Methane from Other Hydrocarbons in Air
John C. Cooper,' Harvey E. Birdseye, and Russell J. Donnelly Department of Physics, University of Oregon, Eugene, Ore. 97403
Methane has a higher vapor pressure than any other hydrocarbon. Because of this, methane can be separated from the other hydrocarbons in ambient air by condensing the heavier ones on a suitably cold surface. A methane separator based on this idea has been constructed and tested with bottled gas mixtures. At the present stage of development, the device traps more than 95% of all the nonmethane hydrocarbons used and has no measurable ef- fect on methane. When used with a total hydrocarbon an- alyzer, the separator establishes a baseline for nonmeth- ane hydrocarbons, obviating the problem of setting an ac- curate hydrocarbon zero level.
Many of the hydrocarbon contaminants in air take part in the photochemical reactions tha t form smog, but meth- ane, which occurs naturally a t relatively high levels, does not. Studies (Environmental Protection Agency, 1970) have shown tha t methane typically is present a t levels above 940 pg/m3 (1.4 ppm) and constitutes perhaps half of the total hydrocarbon level in an urban atmosphere. The ratio of methane to nonmethane hydrocarbons varies so widely, however, that total hydrocarbon measurements do not accurately reflect smog generation potential. For this reason the Environmental Protection Agency (EPA) has set a national primary and secondary ambient air standard for hydrocarbons (Federal Register, 1971) speci- fying tha t the 6-9 a.m. 3-hr average of nonmethane hydro- carbons shall not exceed 160 pg/m3 (0.24 ppm) more than once per year.
Methane in ambient air can be measured by gas chro- matography using flame ionization detectors (Stevens et al., 1970). Systems tha t will automatically sample ambient air once each 5-15 min, measuring separately methane and total hydrocarbons, are commercially available and this method has been approved by the EPA (Federal R P ~ - ister, 1971). There are, however, reasons for considering other possible methods of measurement. Gas chromatog- raphy is inherently a batch process, requiring a few min- utes per analysis, thus it cannot follow the more rapid hy- drocarbon fluctuations that occur in urban atmospheres. Also, since this system and the requirement to correct for methane is fairly new, many air pollution agencies have total hydrocarbon analyzers but no method of discrimi- nating between methane and other hydrocarbons. For them a relatively inexpensive modification to their sam- pling system would be preferable to purchase of a com- plete new instrument.
This paper describes a device based on a cryogenic t rap tha t provides a useful separation of methane from other hydrocarbons. Results of tests performed in our laboratory are included. Evaluation of performance of this instru- ment for a wide range of ambient air conditions will be part of a comprehensive field test program planned for the next year.
To whom correspondence should be addressed.
Device Descript ion
Examination of vapor pressure data for hydrocar- bons (some extrapolated from higher temperatures) indicated tha t a t temperatures near 77°K it should be possible to t rap most hydrocarbon compounds to such an extent tha t their concentrations would be reduced to neg- ligibly small levels in an air sample. At the same time, methane, at typical ambient air concentrations of a few parts per million, should pass through the trap. Thus a separation appeared possible using a cryogenic trap a t liq- uid nitrogen temperature.
The basic methane separation device is a cooled tube (trap) through which air flows before entering a total hy- drocarbon analyzer (THC). At the optimum temperature, methane concentration in the air is unchanged, while con- centrations of the heavier hydrocarbons and many other air contaminants are reduced, most to negligibly small amounts. The THC then measures the methane level with very little interference from other compounds. A tempera- ture around 80°K will cause good separation between methane and other hydrocarbons. Liquid nitrogen boils a t i i K, is readily available and not expensive, so it was used as the coolant in our work to date.
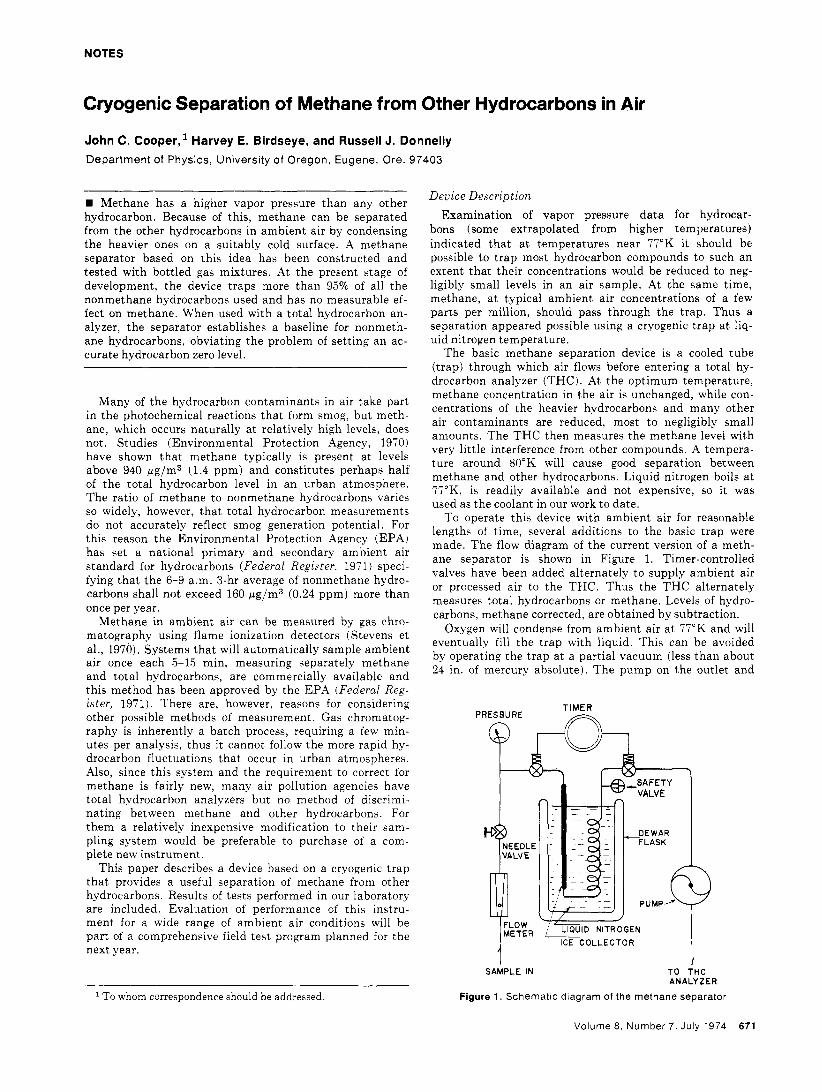
To operate this device with ambient air for reasonable lengths of time, several additions to the basic trap were made. The flow diagram of the current version of a meth- ane separator is shown in Figure 1. Timer-controlled valves have been added alternately to supply ambient air or processed air to the THC. Thus the THC alternately measures total hydrocarbons or methane. Levels of hydro- carbons. methane corrected, are obtained by subtraction.
Oxygen will condense from ambient air a t 77°K and will eventually fill the trap with liquid. This can be avoided by operating the trap a t a partial vacuum (less than about 24 in. of mercury absolute). The pump on the outlet and
7 - 0
VALVE iDLE I
SAMPLE IN TO THC ANALYZER
Figure 1. Schematic diagram of the methane separator
Volume 8, Number 7, July 1974 671
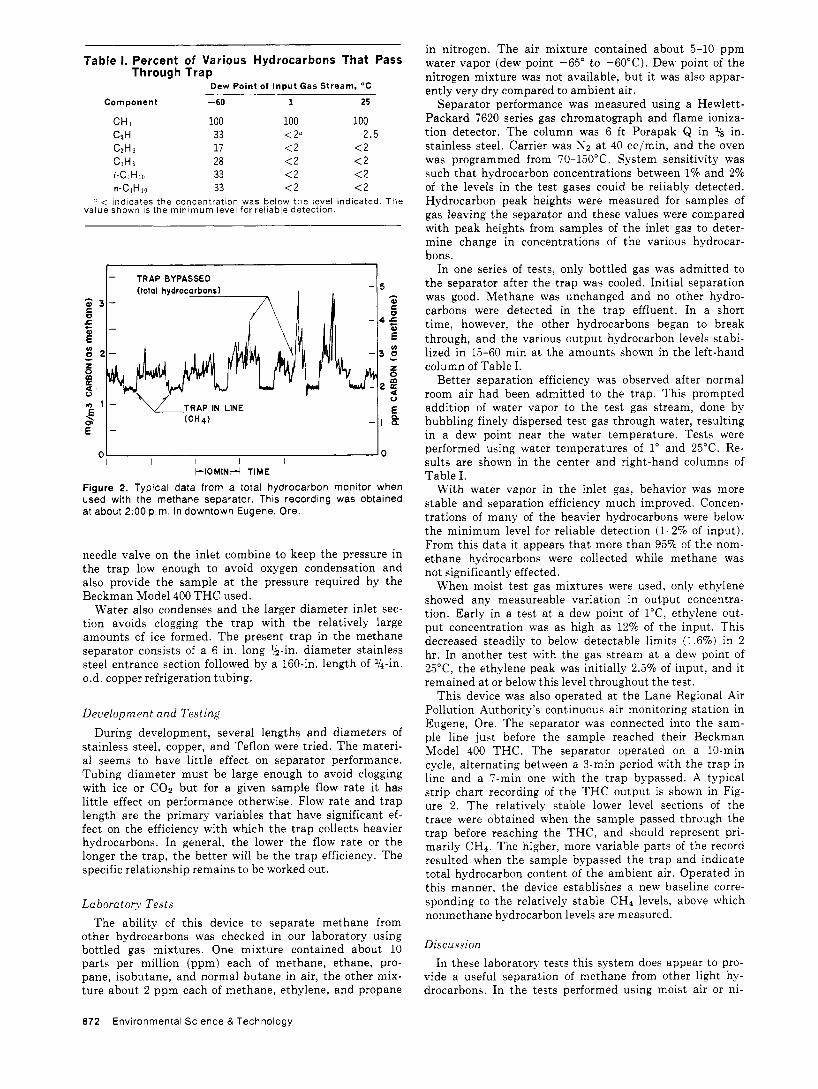
Table I . Percent of Various Hydrocarbons That Pass Through Trap
Dew Point of Input Gas Stream, "C
Component -60 1 25
CH L 100 100 100 C2H I 33 < 2a 2.5 CzH 6 17 <2 <2 C3Hs 28 <2 <2 i-C<Hia 33 <2 <2 n-CdHlo 33 <2 <2
< indicates t h e concent ra t ion was below t h e level indicated. T h e value shown IS t h e minimum level for re l lable detect ion.
- TRAP BYPASSED
E I- -Il H E
10 0: I I I I I I
k I O M l N . 4 TIME
Figure 2. Typical data from a total hydrocarbon monitor when used with the methane separator. This recording was obtained at about 2:OO p.m. in downtown Eugene, Ore.
needle valve on the inlet combine to keep the pressure in the t rap low enough to avoid oxygen condensation and also provide the sample at the pressure required by the Beckman Model 400 THC used.
Water also condenses and the larger diameter inlet sec- tion avoids clogging the t rap with the relatively large amounts of ice formed. The present t rap in the methane separator consists of a 6 in. long Ih-in. diameter stainless steel entrance section followed by a 160-in. length of %-in. 0.d. copper refrigeration tubing.
Development and Tes t ing
During development, several lengths and diameters of stainless steel, copper, and Teflon were tried. The materi- al seems to have little effect on separator performance. Tubing diameter must be large enough to avoid clogging with ice or COz but for a given sample flow rate it has little effect on performance otherwise. Flow rate and t rap length are the primary variables tha t have significant ef- fect on the efficiency with which the t rap collects heavier hydrocarbons. In general, the lower the flow rate or the longer the trap, the better will be the t rap efficiency. The specific relationship remains to be worked out.
L a b o r a t o q T e s t s
The ability of this device to separate methane from other hydrocarbons was checked in our laboratory using bottled gas mixtures. One mixture contained about 10 parts per million (ppm) each of methane, ethane, pro- pane, isobutane, and normal butane in air, the other mix- ture about 2 ppm each of methane, ethylene, and propane
in nitrogen. The air mixture contained about 5-10 ppm water vapor (dew point -65" to -60°C). Dew point of the nitrogen mixture was not available, but it was also appar- ently very dry compared to ambient air.
Separator performance was measured using a Hewlett- Packard 7620 series gas chromatograph and flame ioniza- tion detector. The column was 6 ft Porapak Q in 1b in. stainless steel. Carrier was Nz a t 40 cc/min, and the oven was programmed from 70-150°C. System sensitivity was such tha t hydrocarbon concentrations between 1% and 2% of the levels in the test gases could be reliably detected. Hydrocarbon peak heights were measured for samples of gas leaving the separator and these values were compared with peak heights from samples of the inlet gas to deter- mine change in concentrations of the various hydrocar- bons.
In one series of tests, only bottled gas was admitted to the separator after the t rap was cooled. Initial separation was good. Methane was unchanged and no other hydro- carbons were detected in the t rap effluent. In a short time, however, the other hydrocarbons began to break through, and the various output hydrocarbon levels stabi- lized in 15-60 min a t the amounts shown in the left-hand column of Table I.
Better separation efficiency was observed after normal room air had been admitted to the trap. This prompted addition of water vapor to the test gas stream, done by bubbling finely dispersed test gas through water, resulting in a dew point near the water temperature. Tests were performed using water temperatures of 1" and 25°C. Re- sults are shown in the center and right-hand columns of Table I.
With water vapor in the inlet gas, behavior was more stable and separation efficiency much improved. Concen- trations of many of the heavier hydrocarbons were below the minimum level for reliable detection (1-270 of input). From this data it appears tha t more than 95% of the nom- ethane hydrocarbons were collected while methane was not significantly effected.
When moist test gas mixtures were used, only ethylene showed any measureable variation in output concentra- tion. Early in a test at a dew point of 1"C, ethylene out- put concentration was as high as 12% of the input. This decreased steadily to below detectable limits (1.6%) in 2 hr. In another test with the gas stream a t a dew point of 25"C, the ethylene peak was initially 2.5% of input, and it remained at or below this level throughout the test.
This device was also operated a t the Lane Regional Air Pollution Authority's continuous air monitoring station in Eugene, Ore. The separator was connected into the sam- ple line just before the sample reached their Beckman Model 400 THC. The separator operated on a 10-min cycle, alternating between a 3-min period with the t rap in line and a 7-min one with the t rap bypassed. A typical strip chart recording of the THC output is shown in Fig- ure 2. The relatively stable lower level sections of the trace were obtained when the sample passed through the t rap before reaching the THC, and should represent pri- marily CH4. The higher, more variable parts of the record resulted when the sample bypassed the t rap and indicate total hydrocarbon content of the ambient air. Operated in this manner, the device establishes a new baseline corre- sponding to the relatively stable CHI levels, above which nonmethane hydrocarbon levels are measured.
Discussion In these laboratory tests this system does appear to pro-
vide a useful separation of methane from other light hy- drocarbons. In the tests performed using moist air or ni-
672 Environmental Science & Technology
trogen as the diluent, well over 95% of the nonmethane hydrocarbons were trapped, while methane level was not measureably changed. The presence of relatively large amounts of water vapor compared to the amount of hy- drocarbons is necessary for this performance. In very dry conditions it may be useful to add water vapor to the gas stream as was done in our tests with bottled gas.
Use of this separator with a total hydrocarbon monitor makes it possible to monitor ambient total hydrocarbon levels most of the time with the speed of response of the total hydrocarbon monitor, and to sample the relatively stable methane levels periodically. This method essential- ly generates a new baseline, corresponding to the CH4 level, above which nonmethane levels are measured. Sinnce the standards do not require measurement of the actual level of methane, it is only necessary to set the span of the THC accurately. The exact zero setting no longer effects the data, so the troublesome problems of setting an accurate zero are eliminated.
Algal Blooms-Possible Effects of Iron Stephen D. Morton’ and Terrence H. Lee WARF Institute, P.O. Box 2599, Madison, Wis. 53701
Iron. in concentrations of 0.1-1.0 mg/l., causes a shift in the dominant type of algae grown in batch cultures from relatively unobjectionable greens to the scum-forming blue-greens, without causing a significant change in the total algal biomass. Results were not dependent on the manganese concentration (0-0.40 mg/l.) or the phospho- rus concentration (0.07-7.0 mg/l.).
Perhaps the most widely publicized method of control- ling excessive algal growth in a lake is by limiting an es- sential nutrient, such as the removal of phosphorus from sewage effluents and detergents. However, not all types of algae are equally troublesome in eutrophication problems. Blue-green algae, which form surface scums and cause odors, are very undesirable a t typical algal bloom concen- trations of 6-12 mg/l. (dry weight) while the same amounts of green algae are not so objectionable. I t is therefore important to understand the chemical and phys- ical conditions tha t control the dominant algal type.
I t is well known tha t certain factors, both natural and man caused, can increase the green to blue-green algal ratio (G/BG), without necessarily changing the total algal biomass. The diversion of domestic sewage effluent away from a lake can cause the G/BG to increase as does aera- tion, mixing, and upwelling. Symons (1969) and cowork- ers, Bernhardt (19671, Wirth et al. (1970), and others have documented the increase in the G/BG and the changes in water chemistry when small lakes and reservoirs are mixed mechanically or with compressed air. Shapiro (1973) and King (1970) feel tha t low COz concentrations and high pH favor blue-greens and tha t the increase in the G/BG with aeration is due to increased COz. Our pre- vious work (Morton et al. 1972) on COz and eutrophica-
To whom correspondence should be addressed.
A c k n o w l e d g m e n t
To aid in this work the Lane Regional Air Pollution Au- thority provided a grant of equipment and the use of their Continuous Monitoring Station in downtown Eugene. Dis- cussions with Ron Nance of LRAPA and R. K. Stevens of EPA have been most helpful.
Li tera ture Ci ted
Environmental Protection Agency, Air Pollution Control Office, Washington, D.C., “Air Quality Criteria for Hydrocarbons,”
Fed. Regist., Vol. 36, p 22385, Supt . of Documents, U.S. GPO,
Stevens, R. K . , O’Keeffe, A . E., Ortman, G. C. , ISA Trans., 9,
Received for review September IO, 1973. Accepted January 18, 1974. This uork uas supported by the National Science Founda- tion, R A N N grant 3301 7x, and by the Lane Regional Air Pollution Authority.
AP-64, pp 3-1 to 3-15,1970.
Washington, D.C., 1971.
1-9 (1970).
Ibid., p p 22394-6.
tion showed tha t both greens and blue-greens can effi- ciently utilize COz a t very low concentrations and high pH, but we worked with individual algae species and not mixtures. Bella (1970) feels tha t aeration and mixing favor the denser species. Guseva (1952) and Patrick et al. (1969) have studied the effects of manganese and concluded tha t high manganese concentrations inhibit the blue-greens more than the greens and diatoms. Gerloff and Skoog (1957), using the blue-green alga Microcys t i s , found tha t iron antagonizes or reduces the manganese toxicity.
Procedure
We have studied in the laboratory the effects of iron and manganese on the G/BG in mixtures of algae grown in batch cultures. Algae used were the green algae Chlo- rella pyrenoidosa (Wis 2005), Dictyosphaer ium pul lche l - lum, and Se lenas t rum capr icornutum; and the problem- causing blue-green algae A n a b a e n a circinalis (Wis 1038), Gloeotrichia echinula ta (Wis 1052), and Microcys t i s aeru- ginosa (Wis 1036). The growth medium was Hughes’ (1958), modified to contain 15 mg/l. N as NaN03, 0.07- 7.0 mg/l. P as KzHP04, 10 mg/l. Ca as CaClz, 7 mg/l. Mg as MgS04, 20 mg/l. NazC03, 6 mg/l. citric acid, and 25 mg/l. NazSiOs. EDTA was not present except where noted. The medium was prepared using double glass dis- tilled water. The light intensity was 150 ft-candles and the temperature was 23-25°C. The growth of each type of algae was followed by cell counts, while the total algal growth was also monitored by spectrophotometric mea- surements a t 600 mp. Manganese was added as MnClz.4H20 in the concentration range of 0-1 mg/l. Iron was added as FeC13.6Hz0 in the concentration range of 0.01-2 mg/l. Data were taken a t various growth times with total algal growth from 8-150 mg/l. The initial pH range of the various solutions was between 7.2 and 7.8, which is satisfactory for both greens and blue-greens. The controls showed iron was not toxic to any of the individual algal species but tha t manganese did exhibit increasing
Volume 8, Number 7, July 1974 673