Embed Size (px)
Citation preview
REPORT NO. 687
Cryptosporidium and Giardia (Round 26)
Proficiency Testing Program
November 2010
ACKNOWLEDGMENTS
PTA wishes to gratefully acknowledge the technical assistance provided for this program by Dr J Smith, Applied Microbiology, Environmental Chemistry, Institute for Sustainable Resources, Queensland University of Technology. This assistance included providing input into the design of the program and technical commentary for the report. Further appreciation is extended to Ms B Ferrari of the School of Biotechnology and Biomolecular Sciences, University of New South Wales, for the supply of QC Mud and to the staff at BTF Pty Ltd for sample preparation, distribution and homogeneity testing.
© COPYRIGHT PROFICIENCY TESTING AUSTRALIA 2010
PO Box 7507, SILVERWATER NSW 2128, Australia
CONTENTS
PAGE(S)
1. FOREWORD 1
2. FEATURES OF THE PROGRAM 1
3. DESIGN OF THE PROGRAM 2 TABLE A: Round 26 Sample Design 2 Sample preparation 2
Confounding materials 3 Quality assurance of seed samples 3
Quality assurance of QC mud 3
4. FORMAT OF APPENDICES 4
5. FALSE RESULTS 4 TABLE B: Cryptosporidium False Negative Results 4
6. LOW/HIGH RECOVERIES 4 TABLE C: Cryptosporidium Low Recovery Rates 5
7. PTA AND TECHNICAL ADVISER'S COMMENTS 5 Percentage Recovery Rate 5 Figure 1A: Comparison of total average recovery rates for Cryptosporidium 6 Figure 1B: Comparison of total average recovery rates for Giardia 6 Measurement Uncertainty (MU) Estimation 7 TABLE D: Cryptosporidium and Giardia Round 26 (Oo)cyst Recovery Measurement Uncertainty 7 TABLE E: Cryptosporidium and Giardia Round 26 Recovery- % Measurement Uncertainty 7 TABLE F: Comparison of Cryptosporidium Oocyst Levels for Each Round 8 TABLE G: Comparison of Giardia Cyst Levels for Each Round 8 Method Commentary 9 Overall Laboratory Performance 9 TABLE H: Overall Laboratory Performance 10 Conclusions 13
8. REFERENCE 13
APPENDIX A Summary of Results A1.1 Summary of Percentage Recovery Rates and Charts A1.5
APPENDIX B Homogeneity Testing B1.1 TABLE I: Relative Standard Deviation for Various Sample Doses B1.2 Quality Control B1.3 Trip Control B1.4
APPENDIX C Instructions to Participants C1.1 Results Sheet C1.3
GLOSSARY
1
1. FOREWORD This report summarises the results of the twenty-sixth round of a planned series
of proficiency testing rounds involving the analysis of water samples for the detection and enumeration of Cryptosporidium and Giardia.
The exercise was conducted in October 2010 by PTA. The Program Coordinator
was Ms F Ward. This report was authorised by Mr P Briggs, PTA General Manager.
The program aim was to assess laboratories’ ability to competently detect and report levels of Cryptosporidium and Giardia (oo)cysts in water.
2. FEATURES OF THE PROGRAM (a) A total of seven laboratories (five Australian and two New Zealand) received
samples, all of which returned results by the due date. (b) Participating laboratories were requested to report both total and confirmed count
results. Participants were also requested to calculate and report an estimate of measurement uncertainty (MU) for each reported result.
(c) Results as reported by participants are presented in Appendix A. (d) In addition to the samples, laboratories were provided with the Instructions to
Participants and a Results Sheet (see Appendix C). Laboratories were requested to perform the tests according to their routine methods. Laboratories were reminded that PTA is aware of the internal positive control ColorSeedTM, developed by BTF Pty Ltd. Although PTA can see the advantage of ColorSeedTM as an internal positive control, participants were instructed to note that it is not acceptable for laboratories to adjust results obtained with the PTA proficiency testing samples on the basis of recoveries obtained using ColorSeedTM for PTA proficiency testing samples.
(e) Prior to the addition of QC Mud and sample distribution, a number of selected
samples were analysed for homogeneity. Based on the results, the samples utilised for this round were considered homogenous (see Appendix B).
(f) Each laboratory was randomly allocated a unique code number for the round to
ensure confidentiality of results. Reference to each laboratory in this report is by code number.
2
3. DESIGN OF THE PROGRAM
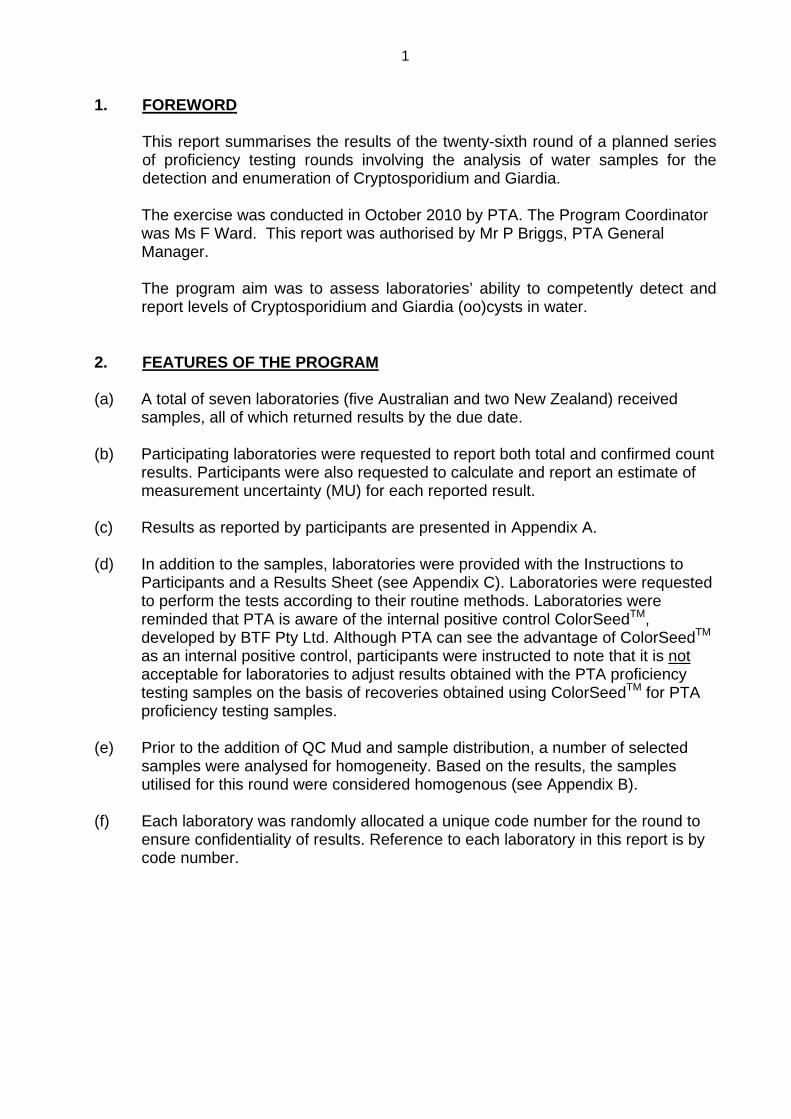
Participants were requested to provide quantitative results for the presence of Cryptosporidium and Giardia in five water concentrate samples. Sample design is presented below.
TABLE A: Round 26 Sample Design
Sample Cryptosporidium (Count)
Giardia (Count)
Amount of QC mud added
A 0 0 400µl
B 50 0 400µl
C 200 250 800µl
D 100 50 400µl
E 0 150 400µl
F (Trip control) 200 250 800µl
Notes for Table A: 1. QC mud was added to these samples to simulate an environmental sample. 2. One nominated laboratory (Code 4) was provided with a sixth sample, as a trip control.
All samples were added to Milli-Q water to make a final volume of approximately 50 mL.
Sample preparation
BTF Pty Ltd, NSW, prepared different water concentrate samples for this program. Seed samples were prepared on 16 September 2010. Seed samples were dispensed in IsoFlow and the sterilisation method was gamma irradiation. Cryptosporidium parvum (Iowa strain) oocysts were of bovine origin, excreted on 16 August 2010. Oocysts were purified by discontinuous sucrose and caesium chloride gradient centrifugation.
Giardia lamblia (H3 strain) cysts were obtained from experimentally-infected gerbils and were excreted on 27 August 2010. Cysts were purified by sucrose and percoll density gradient centrifugation, followed by water washes. The seed samples were prepared using flow cytometry and an automated dispensing method. Cryptosporidium and Giardia (suspended in IsoFlow solution) were dispensed into 50 mL tubes.
3
Seed samples were then sealed, labelled and exposed to a controlled dose of gamma irradiation. The Cryptosporidium oocysts were also heat treated to prevent excystation. Quality Control was performed on the seed samples. On 5 October 2010 (dispatch day) each of the seed samples were then made up to approximately 50 mL with Milli-Q water and spiked with QC mud (see ‘Confounding materials’ below) to produce the water concentrate samples sent to participants. Participating laboratories were asked to add each of the water concentrate samples to 10 L of water of their choice prior to analysis. The laboratories were also instructed to take care to ensure that the water used did not contain any cysts or oocysts and could, for example, use reverse osmosis or membrane filtered (suggested pore size ≤45µm) water.
Confounding materials QC mud: QC mud was added to all water concentrate samples at a concentration of 400 or 800µL QC mud per water concentrate sample (see Table A). Quality assurance of seed samples (refer to Appendix B) BTF Pty Ltd provided counts for Cryptosporidium and Giardia on eight seed samples for homogeneity testing. The counts were performed prior to addition to the Milli-Q water to create water concentrates. As a quality control check, selected samples from each spike material type (Cryptosporidium oocysts, Giardia cysts) were analysed to determine percent DAPI positive. The internal structures of the Cryptosporidium seeds were analysed by flow cytometry to determine percentage full.
Quality assurance of QC mud
To ensure the QC mud did not contain Cryptosporidium oocysts or Giardia cysts, QC mud samples were analysed prior to addition to proficiency samples. Briefly, samples of QC Mud were stained using FITC-labelled monoclonal antibodies (EasyStainTM – BTF Pty Ltd), screened and purified using flow cytometry then examined using epifluorescence microscopy. No Cryptosporidium oocysts or Giardia cysts were found in 10 mL of QC mud.
4
4. FORMAT OF APPENDICES
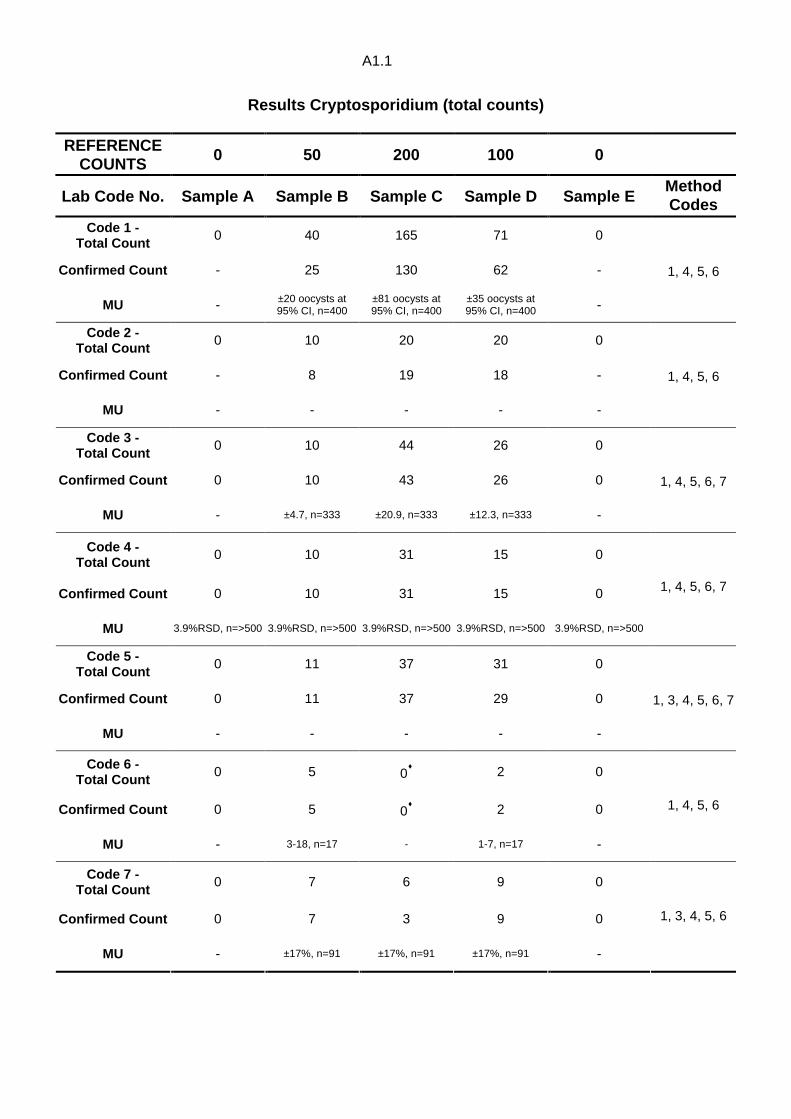
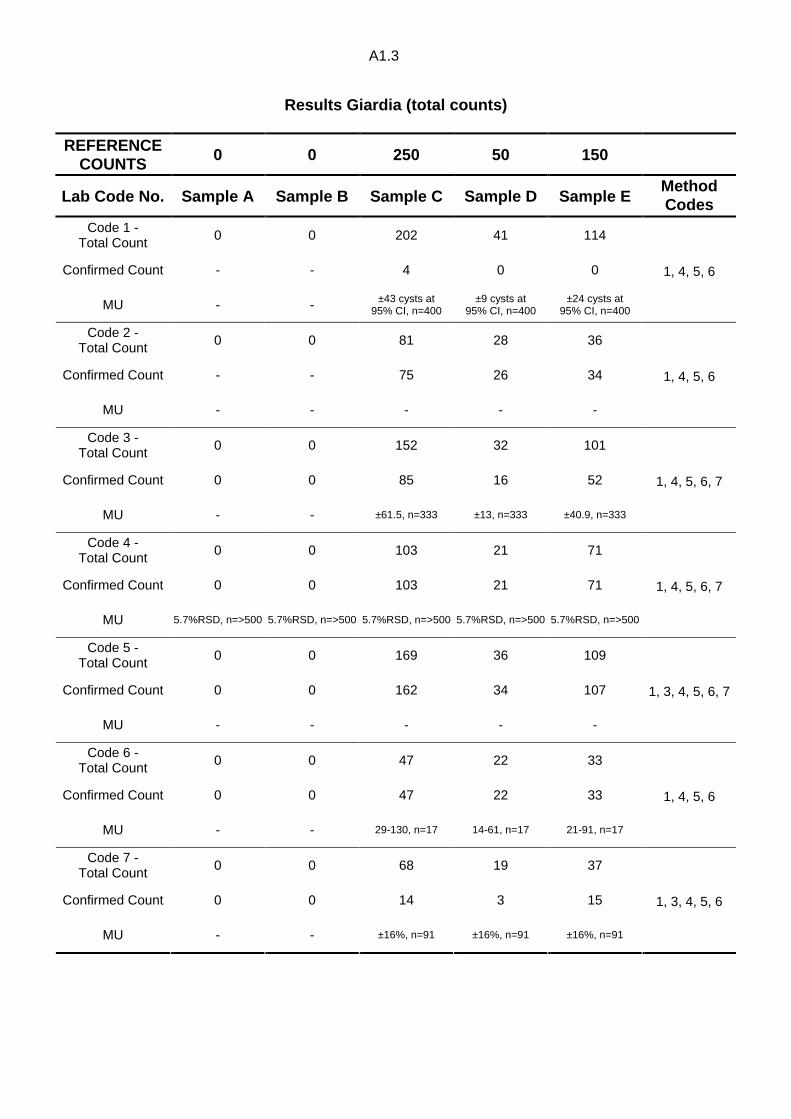
Appendix A (A1.1 - A1.8) contains the total count and confirmed count results reported by participating laboratories for each of the five water concentrate samples. Percentage recovery rates and charts are also presented. Please note that recovery rates are calculated using total counts only.
Appendix B contains details of homogeneity testing, quality control and trip control results (B1.1 - B1.5).
Appendix C contains Instructions to Participants and Results Sheet (C1.1 – C1.3).
5. FALSE RESULTS
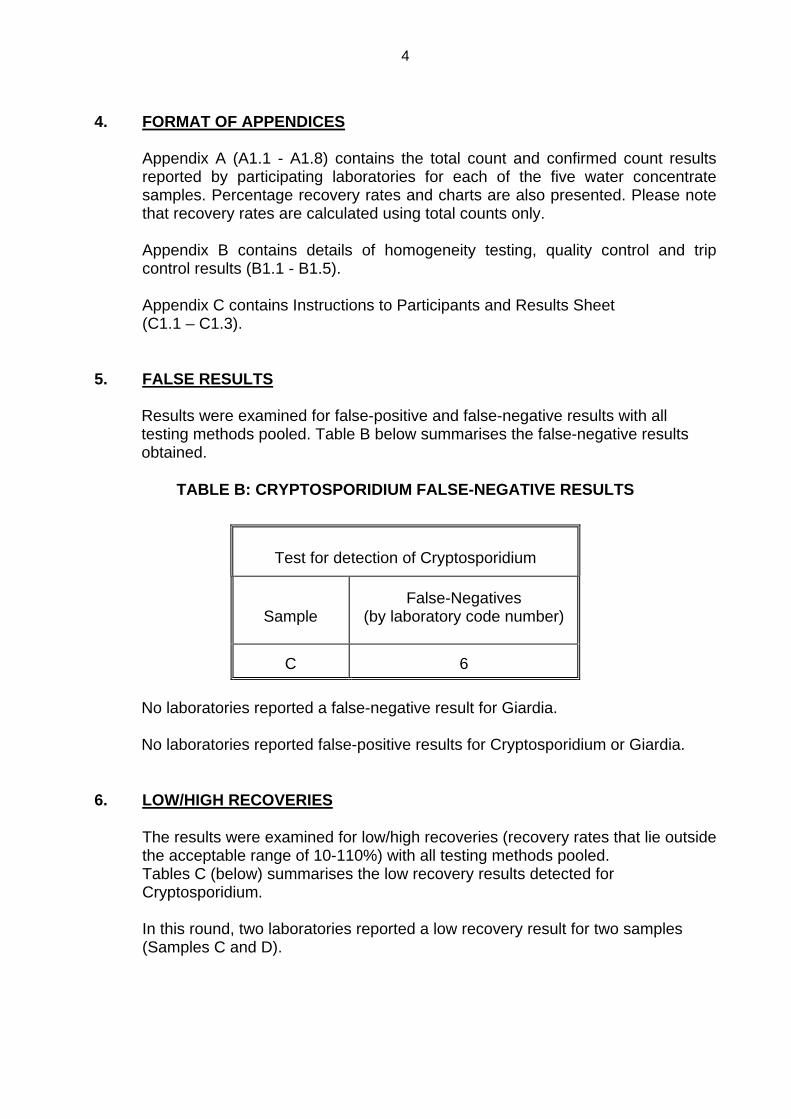
Results were examined for false-positive and false-negative results with all testing methods pooled. Table B below summarises the false-negative results obtained.
TABLE B: CRYPTOSPORIDIUM FALSE-NEGATIVE RESULTS
Test for detection of Cryptosporidium
Sample
False-Negatives (by laboratory code number)
C 6
No laboratories reported a false-negative result for Giardia. No laboratories reported false-positive results for Cryptosporidium or Giardia.
6. LOW/HIGH RECOVERIES
The results were examined for low/high recoveries (recovery rates that lie outside the acceptable range of 10-110%) with all testing methods pooled. Tables C (below) summarises the low recovery results detected for Cryptosporidium. In this round, two laboratories reported a low recovery result for two samples (Samples C and D).
5
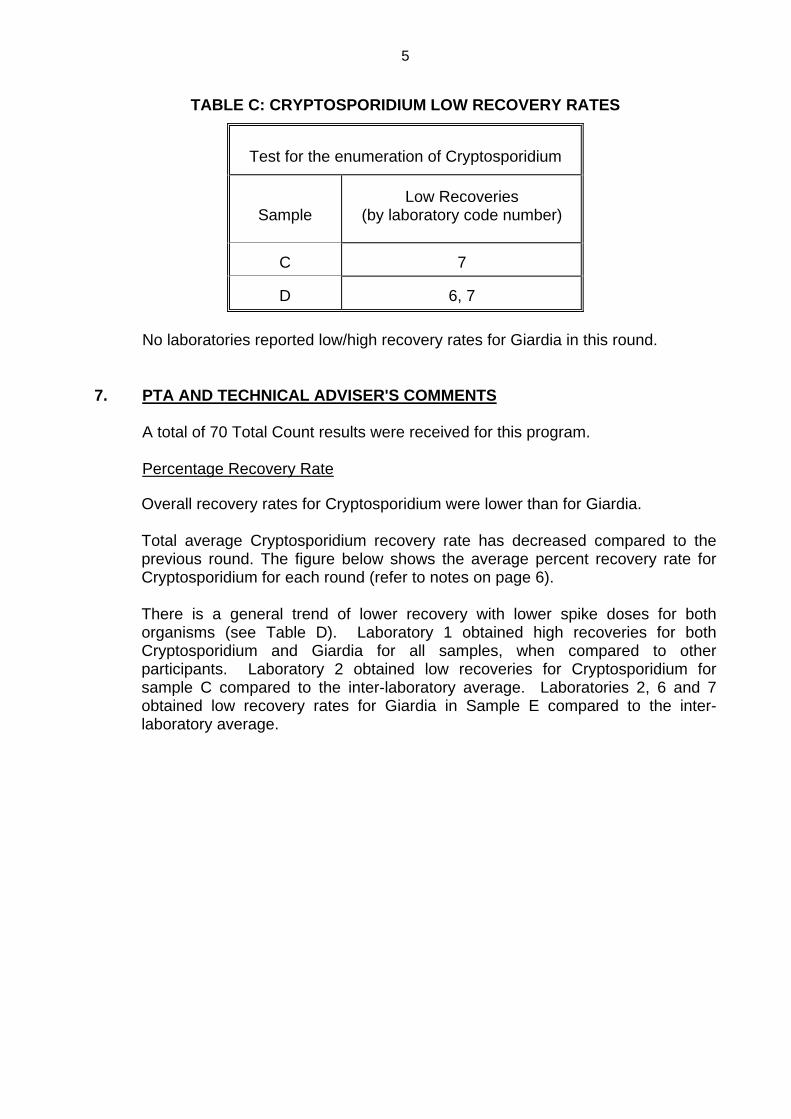
TABLE C: CRYPTOSPORIDIUM LOW RECOVERY RATES
Test for the enumeration of Cryptosporidium
Sample
Low Recoveries (by laboratory code number)
C 7
D 6, 7
No laboratories reported low/high recovery rates for Giardia in this round.
7. PTA AND TECHNICAL ADVISER'S COMMENTS
A total of 70 Total Count results were received for this program. Percentage Recovery Rate
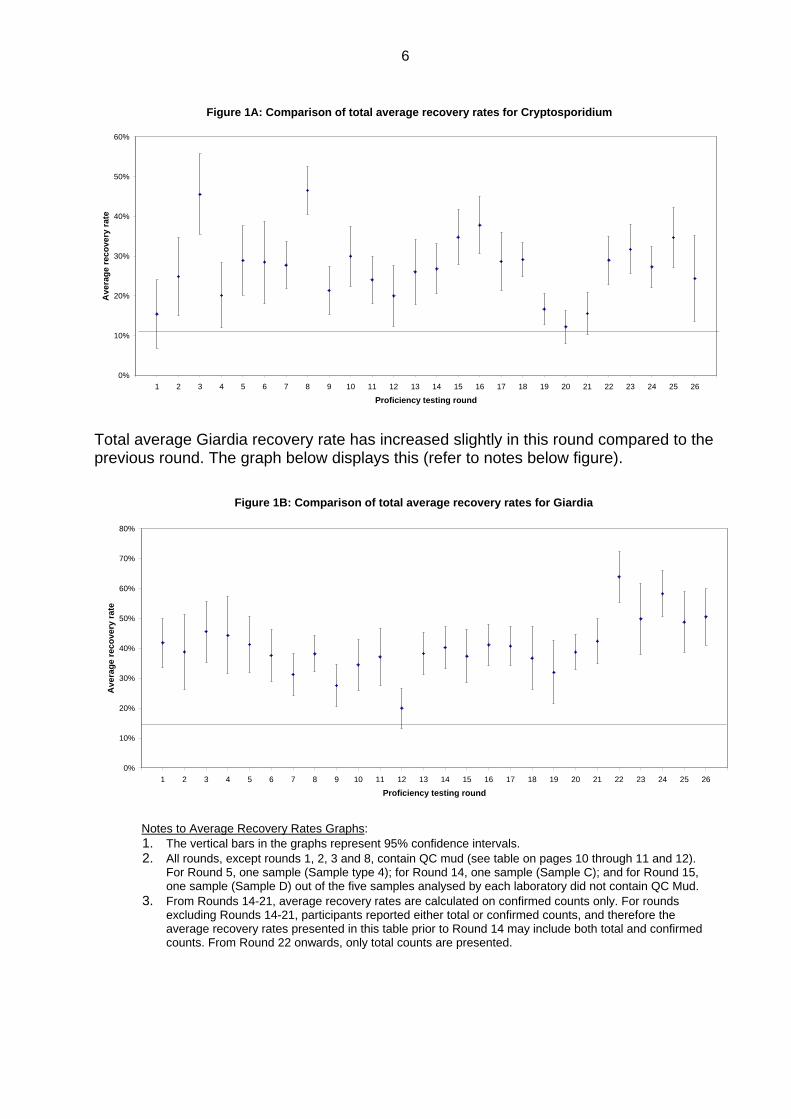
Overall recovery rates for Cryptosporidium were lower than for Giardia. Total average Cryptosporidium recovery rate has decreased compared to the previous round. The figure below shows the average percent recovery rate for Cryptosporidium for each round (refer to notes on page 6). There is a general trend of lower recovery with lower spike doses for both organisms (see Table D). Laboratory 1 obtained high recoveries for both Cryptosporidium and Giardia for all samples, when compared to other participants. Laboratory 2 obtained low recoveries for Cryptosporidium for sample C compared to the inter-laboratory average. Laboratories 2, 6 and 7 obtained low recovery rates for Giardia in Sample E compared to the inter-laboratory average.
6
Figure 1A: Comparison of total average recovery rat es for Cryptosporidium
0%
10%
20%
30%
40%
50%
60%
0 1 2 3 4 5 6 7 8 9 10 11 12 13 14 15 16 17 18 19 20 21 22 23 24 25 26 27
Proficiency testing round
Ave
rage
rec
over
y ra
te
Total average Giardia recovery rate has increased slightly in this round compared to the previous round. The graph below displays this (refer to notes below figure).
Figure 1B: Comparison of total average recovery rat es for Giardia
0%
10%
20%
30%
40%
50%
60%
70%
80%
0 1 2 3 4 5 6 7 8 9 10 11 12 13 14 15 16 17 18 19 20 21 22 23 24 25 26 27
Proficiency testing round
Ave
rage
rec
over
y ra
te
Notes to Average Recovery Rates Graphs: 1. The vertical bars in the graphs represent 95% confidence intervals. 2. All rounds, except rounds 1, 2, 3 and 8, contain QC mud (see table on pages 10 through 11 and 12).
For Round 5, one sample (Sample type 4); for Round 14, one sample (Sample C); and for Round 15, one sample (Sample D) out of the five samples analysed by each laboratory did not contain QC Mud.
3. From Rounds 14-21, average recovery rates are calculated on confirmed counts only. For rounds excluding Rounds 14-21, participants reported either total or confirmed counts, and therefore the average recovery rates presented in this table prior to Round 14 may include both total and confirmed counts. From Round 22 onwards, only total counts are presented.
7
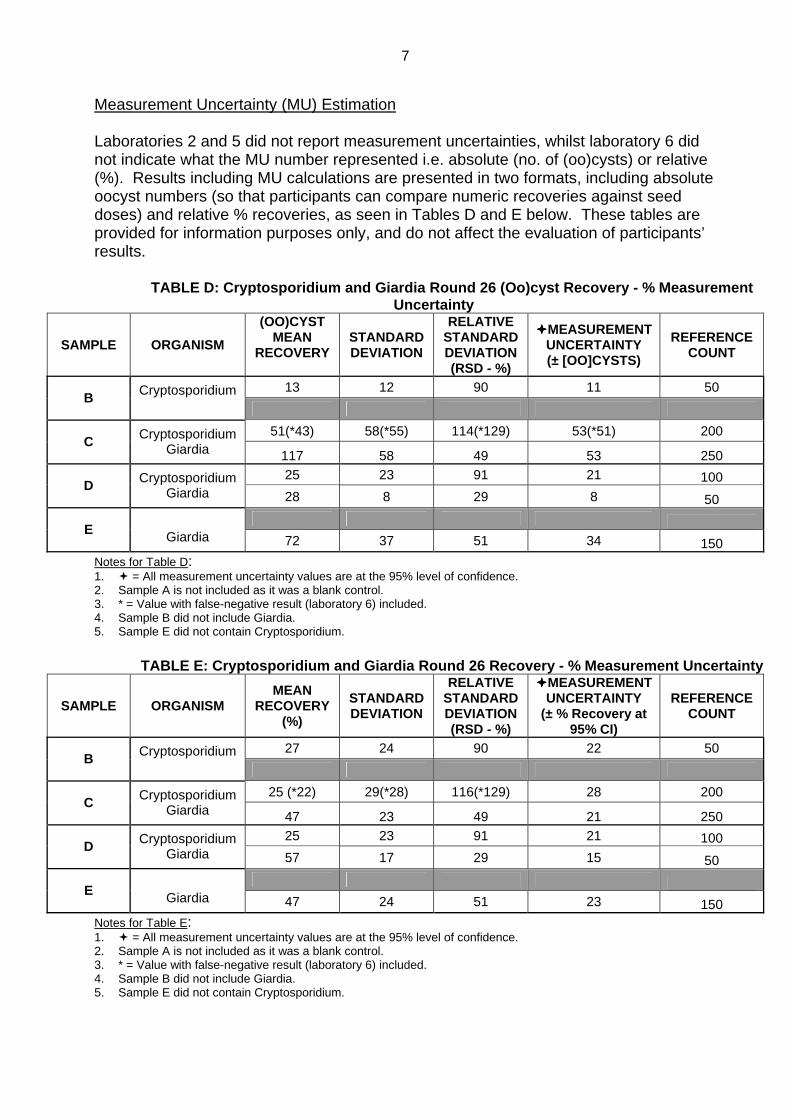
Measurement Uncertainty (MU) Estimation
Laboratories 2 and 5 did not report measurement uncertainties, whilst laboratory 6 did not indicate what the MU number represented i.e. absolute (no. of (oo)cysts) or relative (%). Results including MU calculations are presented in two formats, including absolute oocyst numbers (so that participants can compare numeric recoveries against seed doses) and relative % recoveries, as seen in Tables D and E below. These tables are provided for information purposes only, and do not affect the evaluation of participants’ results.
TABLE D: Cryptosporidium and Giardia Round 26 (Oo)cyst Recovery - % Measurement
Uncertainty
SAMPLE ORGANISM
(OO)CYST MEAN
RECOVERY
STANDARD DEVIATION
RELATIVE STANDARD DEVIATION (RSD - %)
����MEASUREMENT UNCERTAINTY (± [OO]CYSTS)
REFERENCE COUNT
13 12 90 11 50 B Cryptosporidium
51(*43) 58(*55) 114(*129) 53(*51) 200 C Cryptosporidium
Giardia 117 58 49 53 250 25 23 91 21 100
D Cryptosporidium Giardia 28 8 29 8 50
E Giardia 72 37 51 34 150
Notes for Table D: 1. � = All measurement uncertainty values are at the 95% level of confidence. 2. Sample A is not included as it was a blank control. 3. * = Value with false-negative result (laboratory 6) included. 4. Sample B did not include Giardia. 5. Sample E did not contain Cryptosporidium.
TABLE E: Cryptosporidium and Giardia Round 26 Recovery - % Measurement Uncertainty
SAMPLE ORGANISM MEAN
RECOVERY (%)
STANDARD DEVIATION
RELATIVE STANDARD DEVIATION (RSD - %)
����MEASUREMENT UNCERTAINTY
(± % Recovery at 95% CI)
REFERENCE COUNT
27 24 90 22 50 B Cryptosporidium
25 (*22) 29(*28) 116(*129) 28 200 C Cryptosporidium
Giardia 47 23 49 21 250 25 23 91 21 100
D Cryptosporidium Giardia 57 17 29 15 50
E Giardia 47 24 51 23 150
Notes for Table E: 1. � = All measurement uncertainty values are at the 95% level of confidence. 2. Sample A is not included as it was a blank control. 3. * = Value with false-negative result (laboratory 6) included. 4. Sample B did not include Giardia. 5. Sample E did not contain Cryptosporidium.
8
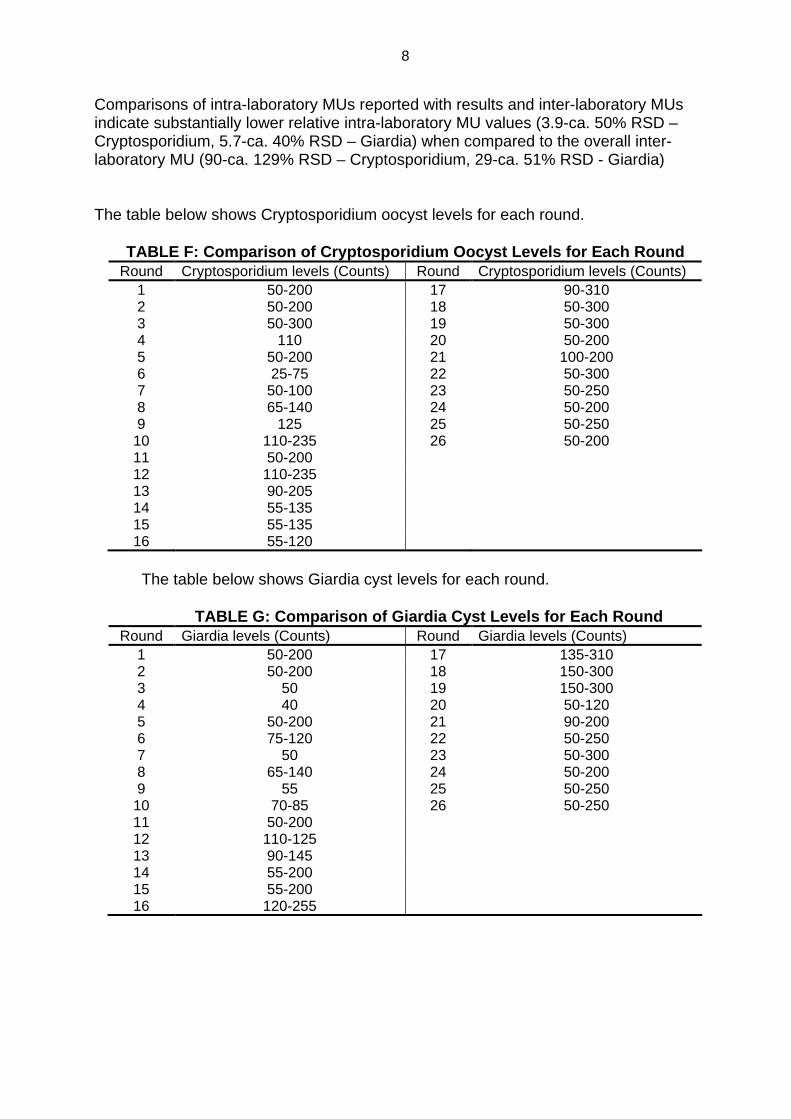
Comparisons of intra-laboratory MUs reported with results and inter-laboratory MUs indicate substantially lower relative intra-laboratory MU values (3.9-ca. 50% RSD – Cryptosporidium, 5.7-ca. 40% RSD – Giardia) when compared to the overall inter-laboratory MU (90-ca. 129% RSD – Cryptosporidium, 29-ca. 51% RSD - Giardia) The table below shows Cryptosporidium oocyst levels for each round.
TABLE F: Comparison of Cryptosporidium Oocyst Levels for Each Round
Round Cryptosporidium levels (Counts) Round Cryptosporidium levels (Counts) 1 50-200 17 90-310 2 50-200 18 50-300 3 50-300 19 50-300 4 110 20 50-200 5 50-200 21 100-200 6 25-75 22 50-300 7 50-100 23 50-250 8 65-140 24 50-200 9 125 25 50-250
10 110-235 26 50-200 11 50-200 12 110-235 13 90-205 14 55-135 15 55-135 16 55-120 The table below shows Giardia cyst levels for each round.
TABLE G: Comparison of Giardia Cyst Levels for Each Round Round Giardia levels (Counts) Round Giardia levels (Counts)
1 50-200 17 135-310 2 50-200 18 150-300 3 50 19 150-300 4 40 20 50-120 5 50-200 21 90-200 6 75-120 22 50-250 7 50 23 50-300 8 65-140 24 50-200 9 55 25 50-250
10 70-85 26 50-250 11 50-200 12 110-125 13 90-145 14 55-200 15 55-200 16 120-255
8
Method Commentary
Of the seven participating laboratories, all provided details of the methods used to determine their results. Of these seven laboratories, all used membrane filtration as the method of concentration and two also used centrifugation. All seven laboratories used IMS as their purification method and all laboratories used fluorescent microscopy as the enumeration method. Seven laboratories reported the use of DAPI staining as the confirmation method. Three laboratories reported the additional use of DIC microscopy. No standard method has been prescribed in Australia. The variety of methods and modifications used by the participating laboratories reflected this lack of standardisation.
A number of participants (Laboratories 4 and 6) reported 100% confirmation for all Cryptosporidium oocysts and Giardia cysts examined. In these cases, participants may be reporting all presumptive cysts as confirmed, as it is unlikely that 100% of post bulk water concentration cysts will be confirmed using either DAPI staining and/or DIC microscopy. Overall Laboratory Performance
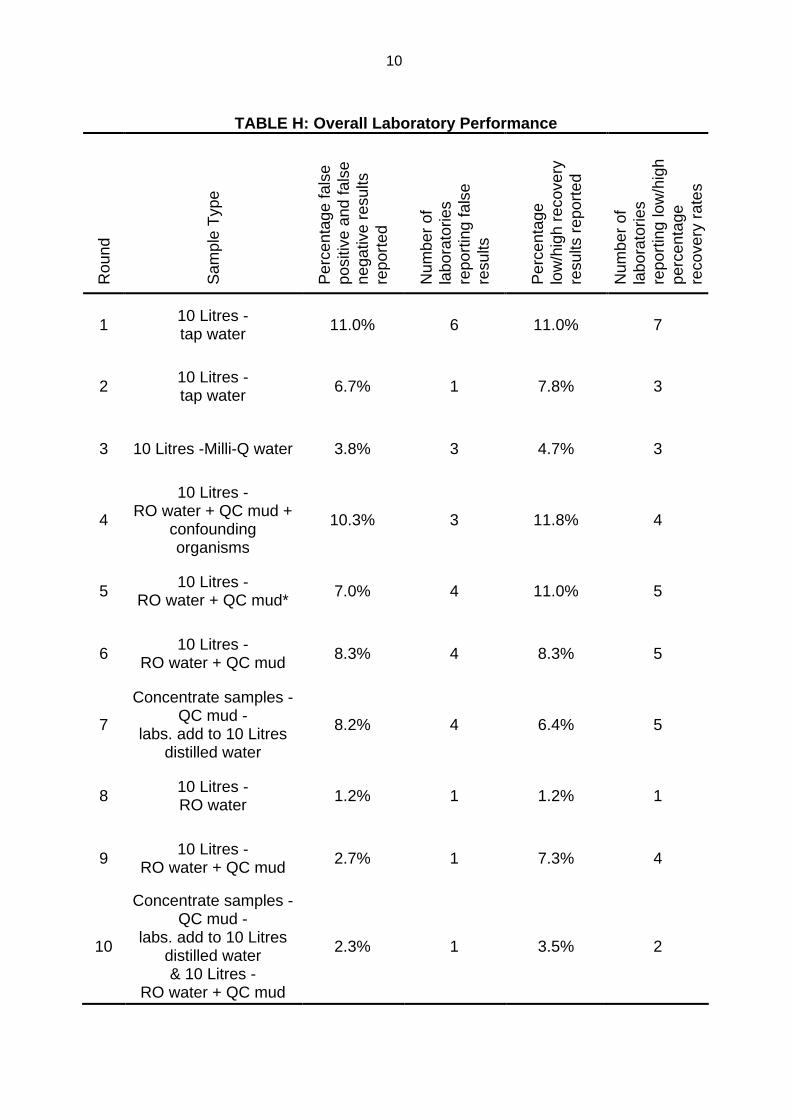
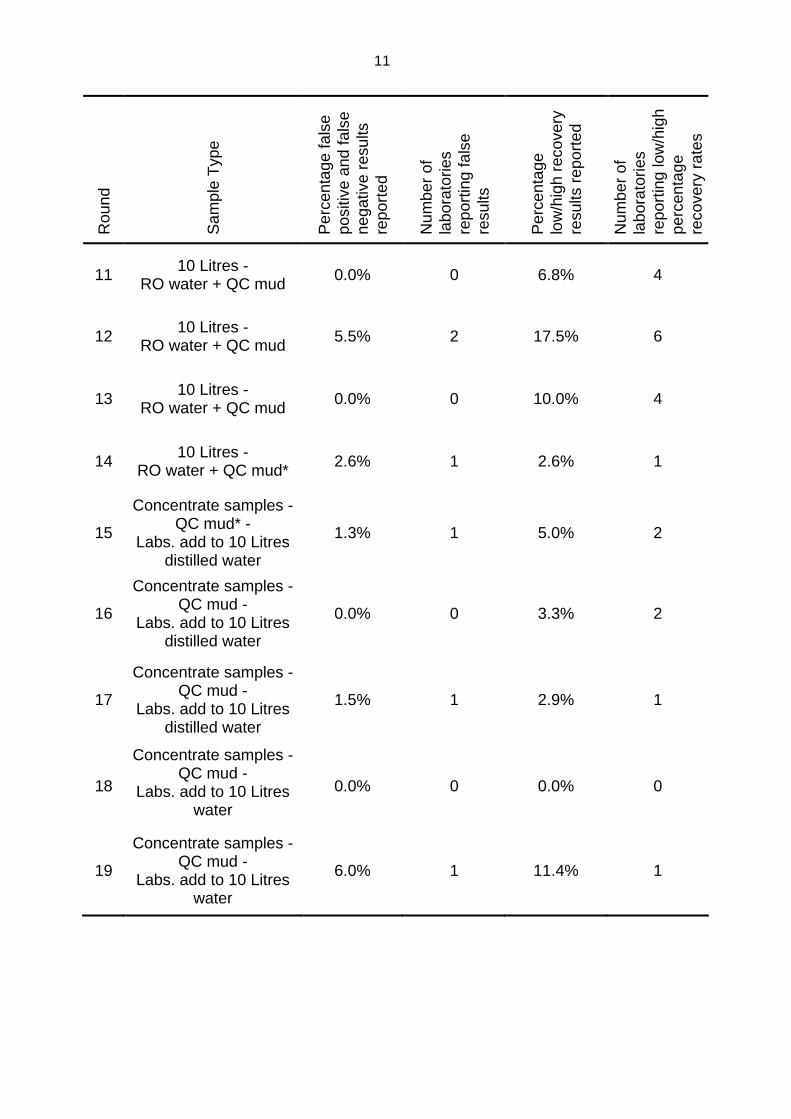
Table H that appears over the next three pages illustrates the comparison of overall laboratory performance for rounds 1 - 26. The percentage of false results reported in this round has increased since the previous round. Laboratory 6 returned a false-negative result for Cryptosporidium detection in Sample C and a low recovery for Cryptosporidium in Sample D. Laboratory 7 returned low recoveries for Cryptosporidium in Samples C and D. Pooled participant data indicates that the lowest Cryptosporidium recovery is associated with the lowest dose (50 oocysts), however, laboratories 6 and 7 obtained low recoveries for Cryptosporidium from the higher dose (100-200 oocysts), but not at the lower dose (50 oocysts). False results at a high dose suggests a significant non-conformance has occurred and that corrective actions are required to investigate possible sources of error and possible oocyst losses / failure to stain during sample processing, including filter elution, IMS and IFA staining (particularly during wash steps if performed on slides). These participants’ performance with Sample B was at or near the minimum acceptable recovery limit and lower than other participants.
9
8
TABLE H: Overall Laboratory Performance
Rou
nd
Sam
ple
Typ
e
Per
cent
age
fals
e po
sitiv
e an
d fa
lse
nega
tive
resu
lts
repo
rted
Num
ber
of
labo
rato
ries
repo
rtin
g fa
lse
resu
lts
Per
cent
age
low
/hig
h re
cove
ry
resu
lts r
epor
ted
Num
ber
of
labo
rato
ries
repo
rtin
g lo
w/h
igh
perc
enta
ge
reco
very
rat
es
1 10 Litres - tap water 11.0% 6 11.0% 7
2 10 Litres - tap water 6.7% 1 7.8% 3
3 10 Litres -Milli-Q water 3.8% 3 4.7% 3
4
10 Litres - RO water + QC mud +
confounding organisms
10.3% 3 11.8% 4
5 10 Litres - RO water + QC mud* 7.0% 4 11.0% 5
6 10 Litres - RO water + QC mud 8.3% 4 8.3% 5
7
Concentrate samples - QC mud -
labs. add to 10 Litres distilled water
8.2% 4 6.4% 5
8 10 Litres - RO water 1.2% 1 1.2% 1
9 10 Litres - RO water + QC mud 2.7% 1 7.3% 4
10
Concentrate samples - QC mud -
labs. add to 10 Litres distilled water & 10 Litres -
RO water + QC mud
2.3% 1 3.5% 2
10
8
Rou
nd
Sam
ple
Typ
e
Per
cent
age
fals
e po
sitiv
e an
d fa
lse
nega
tive
resu
lts
repo
rted
Num
ber
of
labo
rato
ries
repo
rtin
g fa
lse
resu
lts
Per
cent
age
low
/hig
h re
cove
ry
resu
lts r
epor
ted
Num
ber
of
labo
rato
ries
repo
rtin
g lo
w/h
igh
perc
enta
ge
reco
very
rat
es
11 10 Litres - RO water + QC mud 0.0% 0 6.8% 4
12 10 Litres - RO water + QC mud 5.5% 2 17.5% 6
13 10 Litres - RO water + QC mud 0.0% 0 10.0% 4
14 10 Litres - RO water + QC mud* 2.6% 1 2.6% 1
15
Concentrate samples - QC mud* -
Labs. add to 10 Litres distilled water
1.3% 1 5.0% 2
16
Concentrate samples - QC mud -
Labs. add to 10 Litres distilled water
0.0% 0 3.3% 2
17
Concentrate samples - QC mud -
Labs. add to 10 Litres distilled water
1.5% 1 2.9% 1
18
Concentrate samples - QC mud -
Labs. add to 10 Litres water
0.0% 0 0.0% 0
19
Concentrate samples - QC mud -
Labs. add to 10 Litres water
6.0% 1 11.4% 1
11
8
Rou
nd
Sam
ple
Typ
e
Per
cent
age
fals
e po
sitiv
e an
d fa
lse
nega
tive
resu
lts
repo
rted
Num
ber
of
labo
rato
ries
repo
rtin
g fa
lse
resu
lts
Per
cent
age
low
/hig
h re
cove
ry
resu
lts r
epor
ted
Num
ber
of
labo
rato
ries
repo
rtin
g lo
w/h
igh
perc
enta
ge
reco
very
rat
es
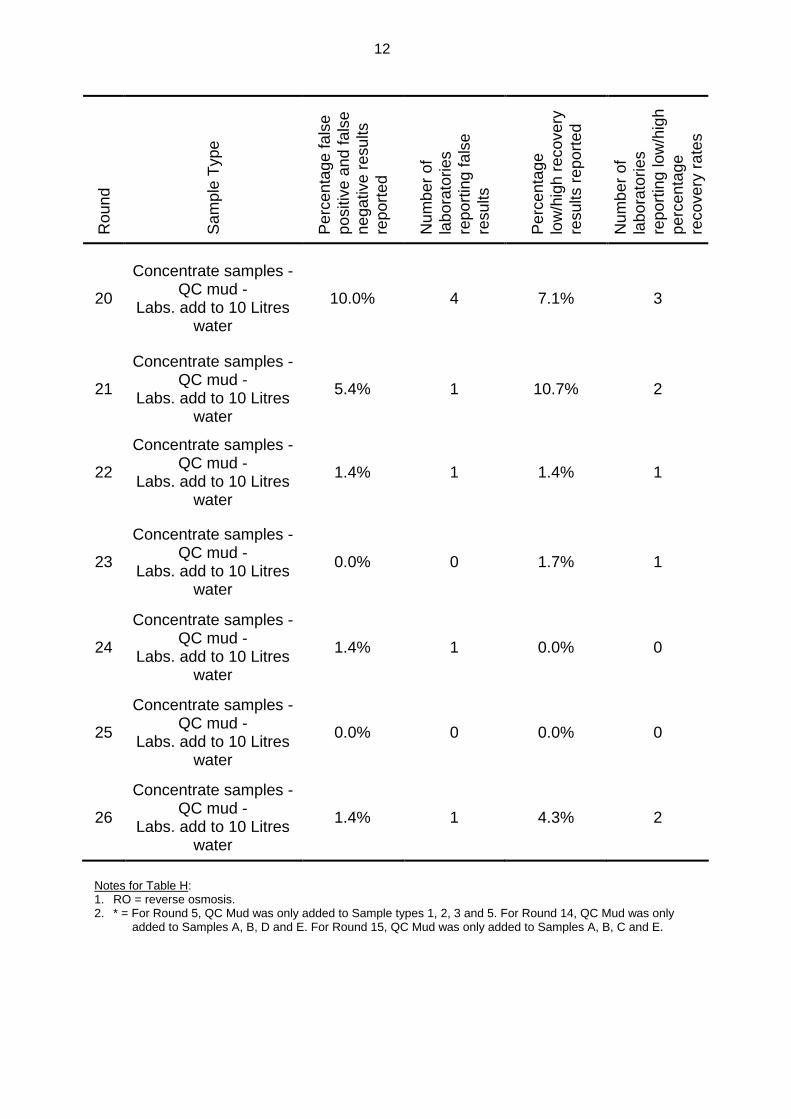
20
Concentrate samples - QC mud -
Labs. add to 10 Litres water
10.0% 4 7.1% 3
21
Concentrate samples - QC mud -
Labs. add to 10 Litres water
5.4% 1 10.7% 2
22
Concentrate samples - QC mud -
Labs. add to 10 Litres water
1.4% 1 1.4% 1
23
Concentrate samples - QC mud -
Labs. add to 10 Litres water
0.0% 0 1.7% 1
24
Concentrate samples - QC mud -
Labs. add to 10 Litres water
1.4% 1 0.0% 0
25
Concentrate samples - QC mud -
Labs. add to 10 Litres water
0.0% 0 0.0% 0
26
Concentrate samples - QC mud -
Labs. add to 10 Litres water
1.4% 1 4.3% 2
Notes for Table H: 1. RO = reverse osmosis. 2. * = For Round 5, QC Mud was only added to Sample types 1, 2, 3 and 5. For Round 14, QC Mud was only
added to Samples A, B, D and E. For Round 15, QC Mud was only added to Samples A, B, C and E.
12
8
Conclusions Overall, performance in Round 26 is considered satisfactory for all but two participants. As these low recoveries / false (-) results were obtained for relatively high dose samples, corrective actions should be taken by these facilities. Participants may wish to review their MU as a measure of analytical precision, both inter-laboratory and intra-laboratory. 8. REFERENCE [1] Guide to Proficiency Testing Australia, 2008.
13
APPENDIX A
Summary of Results
A1.1
Results Cryptosporidium (total counts)
REFERENCE COUNTS 0 50 200 100 0
Lab Code No. Sample A Sample B Sample C Sample D Sample E Method Codes
Code 1 - Total Count
0 40 165 71 0
Confirmed Count - 25 130 62 -
MU - ±20 oocysts at 95% CI, n=400
±81 oocysts at 95% CI, n=400
±35 oocysts at 95% CI, n=400 -
1, 4, 5, 6
Code 2 - Total Count
0 10 20 20 0
Confirmed Count - 8 19 18 -
MU - - - - -
1, 4, 5, 6
Code 3 - Total Count
0 10 44 26 0
Confirmed Count 0 10 43 26 0
MU - ±4.7, n=333 ±20.9, n=333 ±12.3, n=333 -
1, 4, 5, 6, 7
Code 4 - Total Count
0 10 31 15 0
Confirmed Count 0 10 31 15 0
MU 3.9%RSD, n=>500 3.9%RSD, n=>500 3.9%RSD, n=>500 3.9%RSD, n=>500 3.9%RSD, n=>500
1, 4, 5, 6, 7
Code 5 - Total Count
0 11 37 31 0
Confirmed Count 0 11 37 29 0
MU - - - - -
1, 3, 4, 5, 6, 7
Code 6 - Total Count
0 5 0� 2 0
Confirmed Count 0 5 0� 2 0
MU - 3-18, n=17 - 1-7, n=17 -
1, 4, 5, 6
Code 7 - Total Count
0 7 6 9 0
Confirmed Count 0 7 3 9 0
MU - ±17%, n=91 ±17%, n=91 ±17%, n=91 -
1, 3, 4, 5, 6
A1.1
A1.1
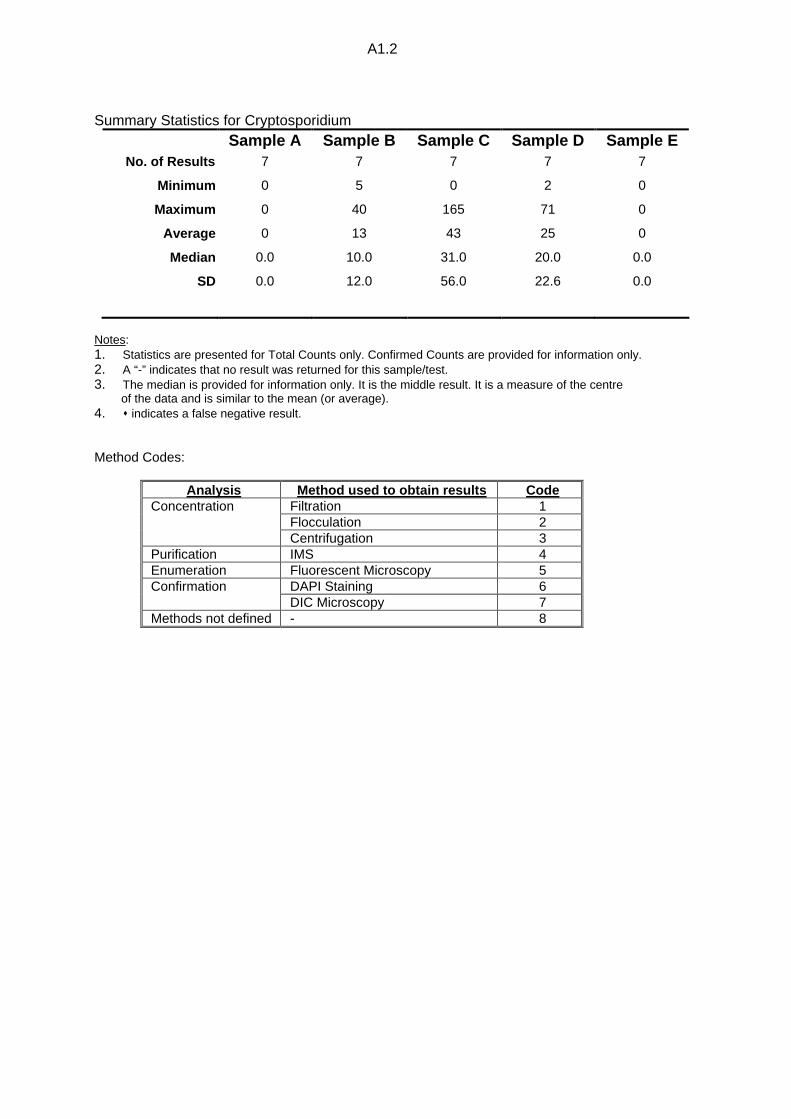
Summary Statistics for Cryptosporidium
Sample A Sample B Sample C Sample D Sample E No. of Results s 7 7 7 7 7
Minimum 0 5 0 2 0
Maximum 0 40 165 71 0
Average 0 13 43 25 0
Median 0.0 10.0 31.0 20.0 0.0
SD 0.0 12.0 56.0 22.6 0.0
Notes: 1. Statistics are presented for Total Counts only. Confirmed Counts are provided for information only. 2. A “-” indicates that no result was returned for this sample/test. 3. The median is provided for information only. It is the middle result. It is a measure of the centre of the data and is similar to the mean (or average). 4. � indicates a false negative result. Method Codes:
Analysis Method used to obtain results Code Concentration Filtration 1 Flocculation 2 Centrifugation 3 Purification IMS 4 Enumeration Fluorescent Microscopy 5 Confirmation DAPI Staining 6 DIC Microscopy 7 Methods not defined - 8
A1.2
A1.3
Results Giardia (total counts)
REFERENCE COUNTS 0 0 250 50 150
Lab Code No. Sample A Sample B Sample C Sample D Sample E Method Codes
Code 1 - Total Count 0 0 202 41 114
Confirmed Count - - 4 0 0
MU - - ±43 cysts at 95% CI, n=400
±9 cysts at 95% CI, n=400
±24 cysts at 95% CI, n=400
1, 4, 5, 6
Code 2 - Total Count 0 0 81 28 36
Confirmed Count - - 75 26 34
MU - - - - -
1, 4, 5, 6
Code 3 - Total Count 0 0 152 32 101
Confirmed Count 0 0 85 16 52
MU - - ±61.5, n=333 ±13, n=333 ±40.9, n=333
1, 4, 5, 6, 7
Code 4 - Total Count 0 0 103 21 71
Confirmed Count 0 0 103 21 71
MU 5.7%RSD, n=>500 5.7%RSD, n=>500 5.7%RSD, n=>500 5.7%RSD, n=>500 5.7%RSD, n=>500
1, 4, 5, 6, 7
Code 5 - Total Count 0 0 169 36 109
Confirmed Count 0 0 162 34 107
MU - - - - -
1, 3, 4, 5, 6, 7
Code 6 - Total Count 0 0 47 22 33
Confirmed Count 0 0 47 22 33
MU - - 29-130, n=17 14-61, n=17 21-91, n=17
1, 4, 5, 6
Code 7 - Total Count 0 0 68 19 37
Confirmed Count 0 0 14 3 15
MU - - ±16%, n=91 ±16%, n=91 ±16%, n=91
1, 3, 4, 5, 6
A1.3
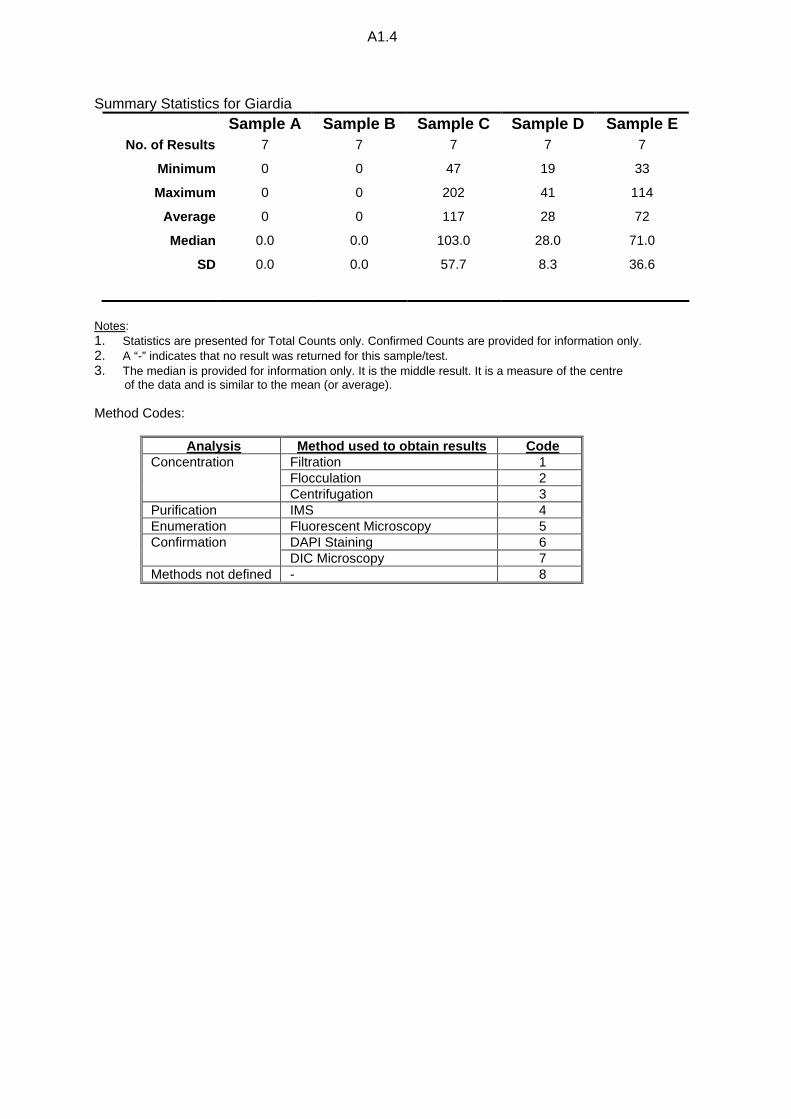
Summary Statistics for Giardia Sample A Sample B Sample C Sample D Sample E
No. of Results s 7 7 7 7 7
Minimum 0 0 47 19 33
Maximum 0 0 202 41 114
Average 0 0 117 28 72
Median 0.0 0.0 103.0 28.0 71.0
SD 0.0 0.0 57.7 8.3 36.6
Notes: 1. Statistics are presented for Total Counts only. Confirmed Counts are provided for information only. 2. A “-” indicates that no result was returned for this sample/test. 3. The median is provided for information only. It is the middle result. It is a measure of the centre of the data and is similar to the mean (or average). Method Codes:
Analysis Method used to obtain results Code Concentration Filtration 1 Flocculation 2 Centrifugation 3 Purification IMS 4 Enumeration Fluorescent Microscopy 5 Confirmation DAPI Staining 6 DIC Microscopy 7 Methods not defined - 8
A1.4 A1.4
A1.5
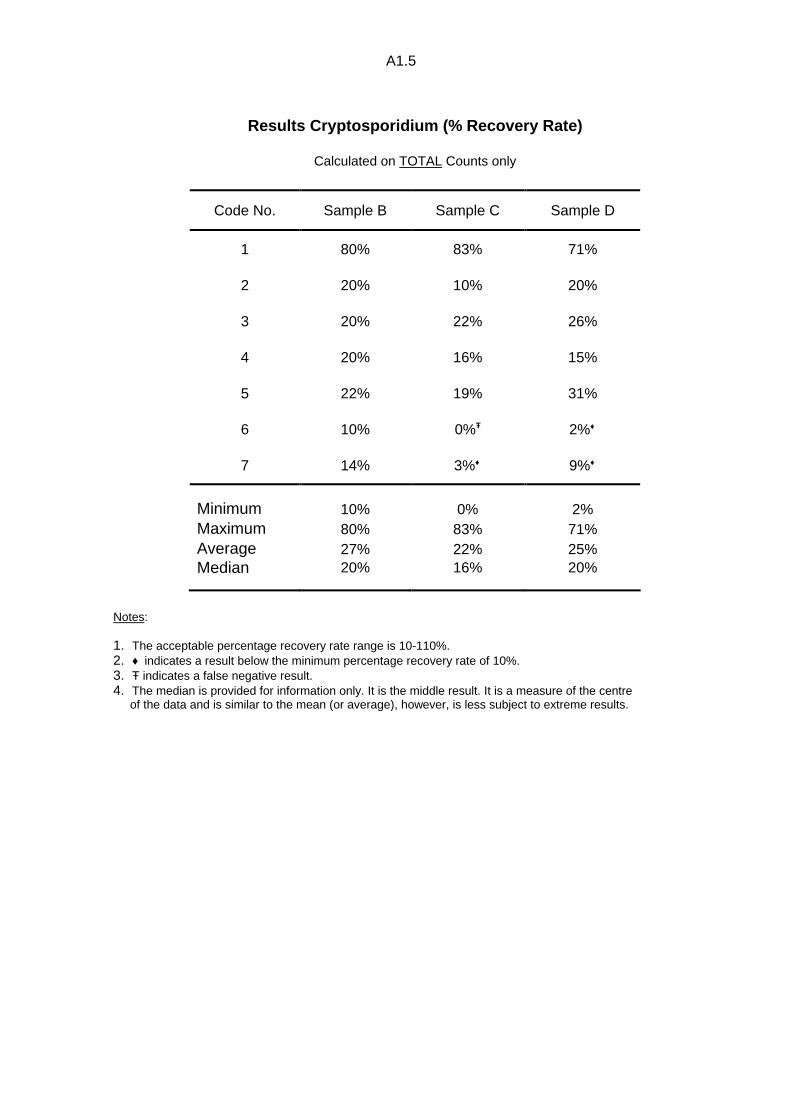
Results Cryptosporidium (% Recovery Rate)
Calculated on TOTAL Counts only
Code No. Sample B Sample C Sample D
1 80% 83% 71%
2 20% 10% 20%
3 20% 22% 26%
4 20% 16% 15%
5 22% 19% 31%
6 10% 0%Ŧ 2%♦
7 14% 3%♦ 9%♦
Minimum 10% 0% 2% Maximum 80% 83% 71% Average 27% 22% 25% Median 20% 16% 20%
Notes: 1. The acceptable percentage recovery rate range is 10-110%. 2. ♦ indicates a result below the minimum percentage recovery rate of 10%. 3. Ŧ indicates a false negative result. 4. The median is provided for information only. It is the middle result. It is a measure of the centre of the data and is similar to the mean (or average), however, is less subject to extreme results.
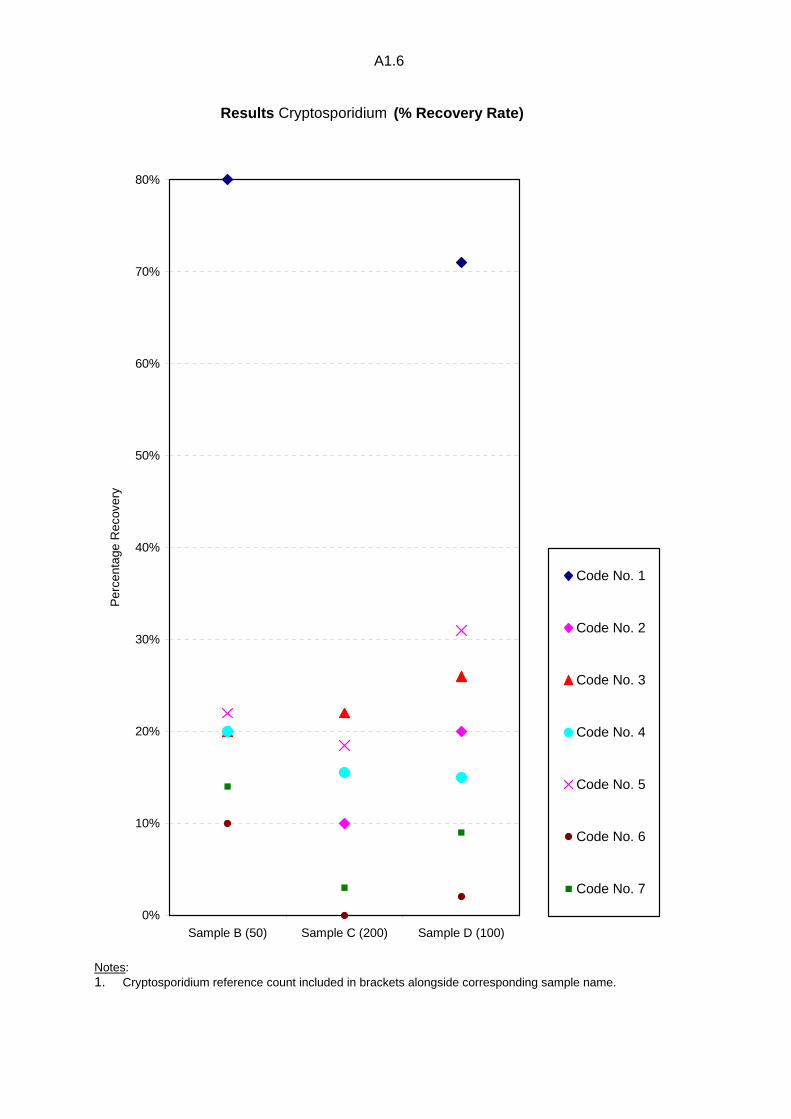
Results Cryptosporidium (% Recovery Rate)
0%
10%
20%
30%
40%
50%
60%
70%
80%
Sample B (50) Sample C (200) Sample D (100)
Per
cent
age
Rec
over
y
Code No. 1
Code No. 2
Code No. 3
Code No. 4
Code No. 5
Code No. 6
Code No. 7
Notes: 1. Cryptosporidium reference count included in brackets alongside corresponding sample name.
A1.6
A1.7
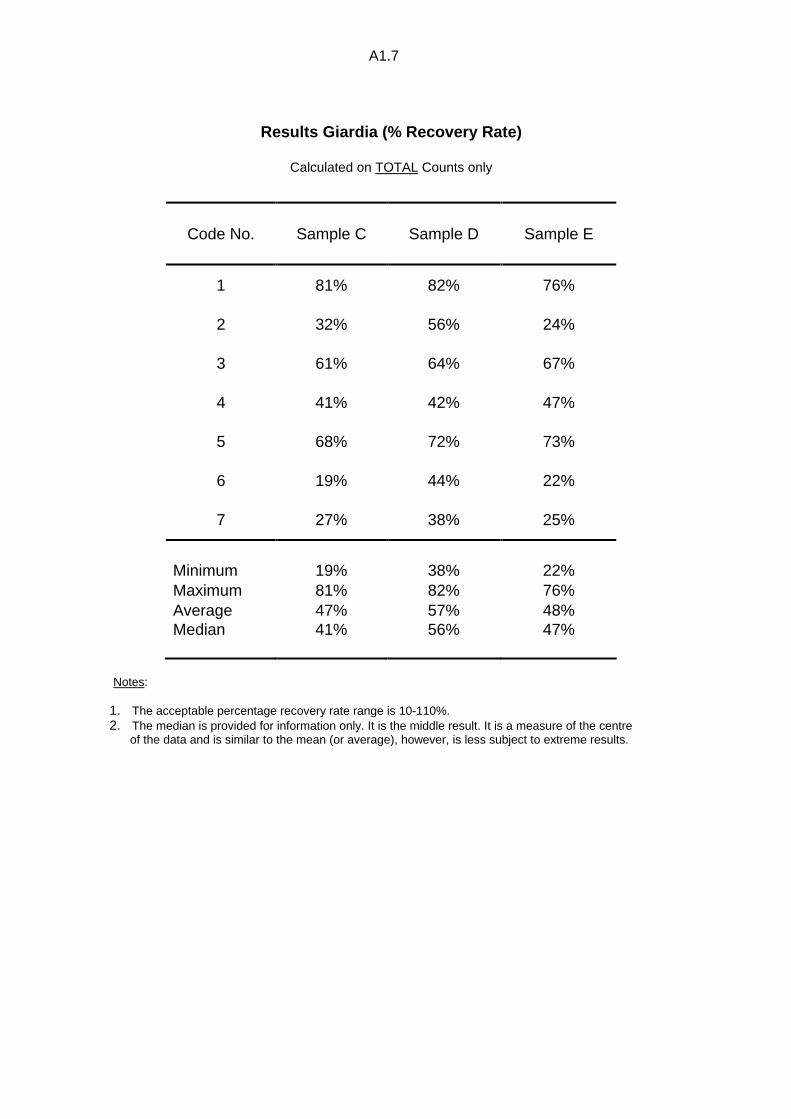
Results Giardia (% Recovery Rate)
Calculated on TOTAL Counts only
Code No. Sample C Sample D Sample E
1 81% 82% 76%
2 32% 56% 24%
3 61% 64% 67%
4 41% 42% 47%
5 68% 72% 73%
6 19% 44% 22%
7 27% 38% 25%
Minimum 19% 38% 22% Maximum 81% 82% 76% Average 47% 57% 48% Median 41% 56% 47%
Notes:
1. The acceptable percentage recovery rate range is 10-110%. 2. The median is provided for information only. It is the middle result. It is a measure of the centre of the data and is similar to the mean (or average), however, is less subject to extreme results.
A1.7
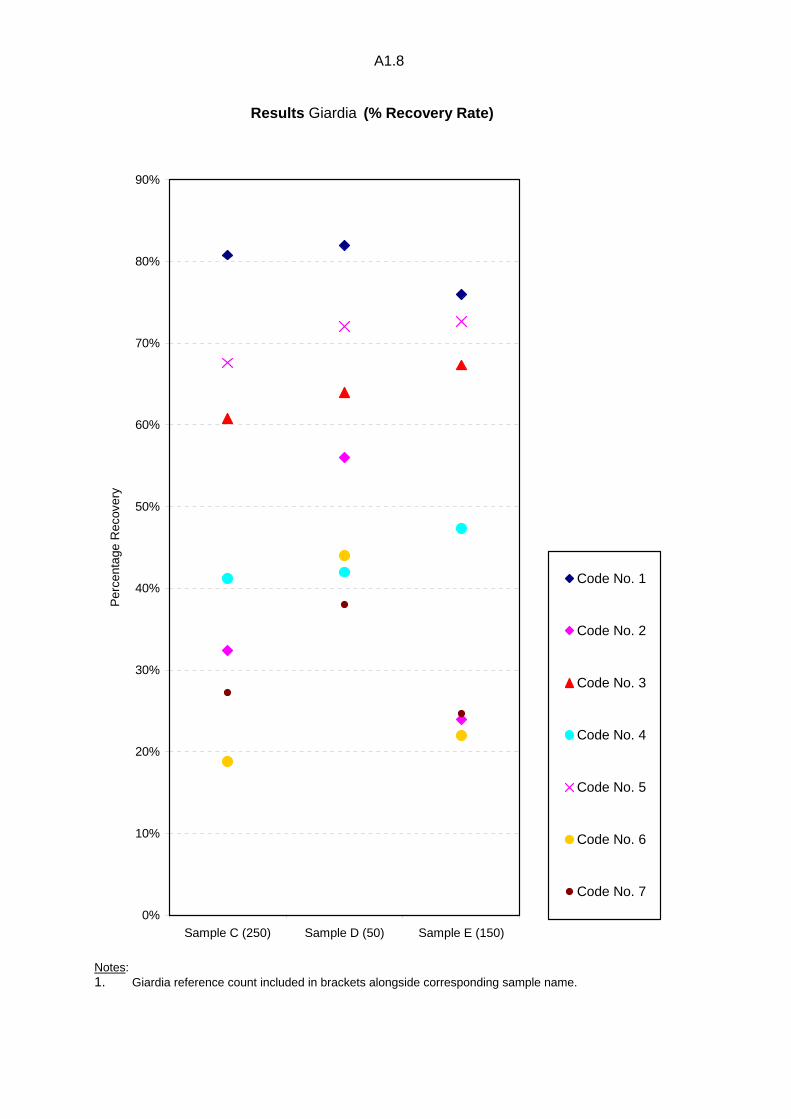
Results Giardia (% Recovery Rate)
0%
10%
20%
30%
40%
50%
60%
70%
80%
90%
Sample C (250) Sample D (50) Sample E (150)
Per
cent
age
Rec
over
y
Code No. 1
Code No. 2
Code No. 3
Code No. 4
Code No. 5
Code No. 6
Code No. 7
Notes: 1. Giardia reference count included in brackets alongside corresponding sample name.
A1.8
APPENDIX B
Homogeneity Testing Quality Control
and Trip Control
B1.1
Homogeneity Testing
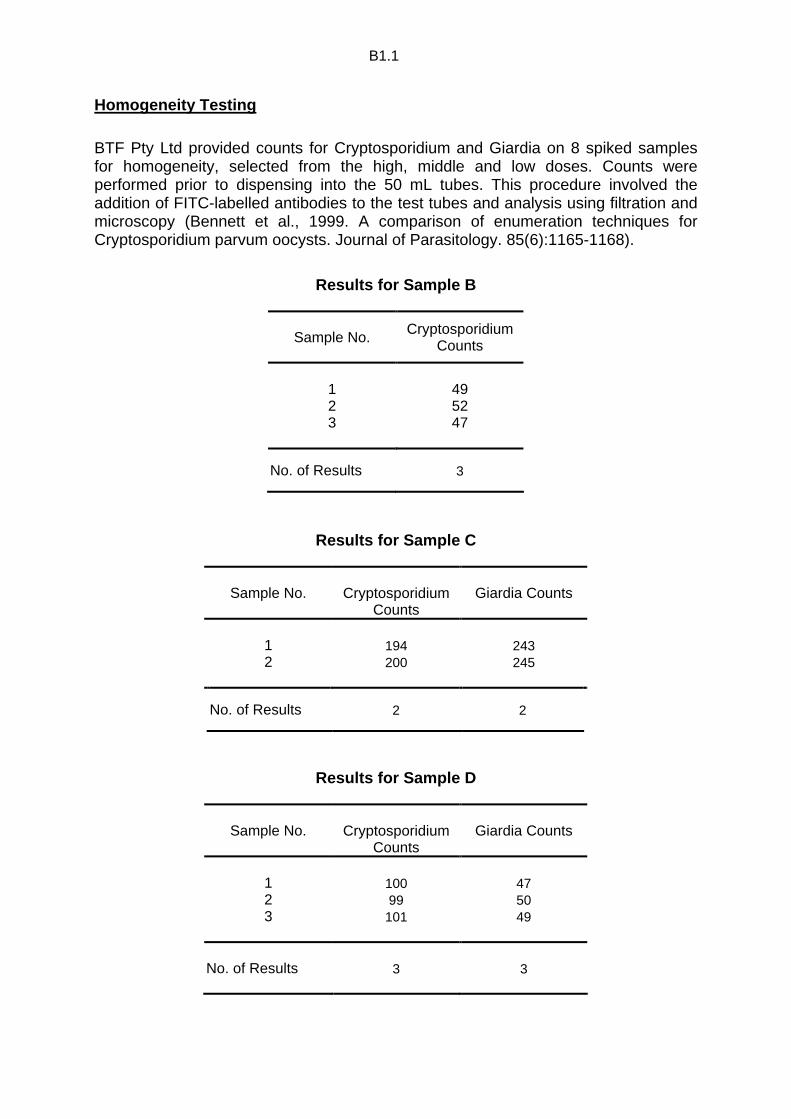
BTF Pty Ltd provided counts for Cryptosporidium and Giardia on 8 spiked samples for homogeneity, selected from the high, middle and low doses. Counts were performed prior to dispensing into the 50 mL tubes. This procedure involved the addition of FITC-labelled antibodies to the test tubes and analysis using filtration and microscopy (Bennett et al., 1999. A comparison of enumeration techniques for Cryptosporidium parvum oocysts. Journal of Parasitology. 85(6):1165-1168).
Results for Sample B
Sample No. Cryptosporidium Counts
1 49 2 52 3 47
No. of Results 3
Results for Sample C
Sample No.
Cryptosporidium Counts
Giardia Counts
1 194 243 2 200 245
No. of Results 2 2
Results for Sample D
Sample No.
Cryptosporidium Counts
Giardia Counts
1 100 47 2 99 50 3 101 49
No. of Results 3 3
B1.1
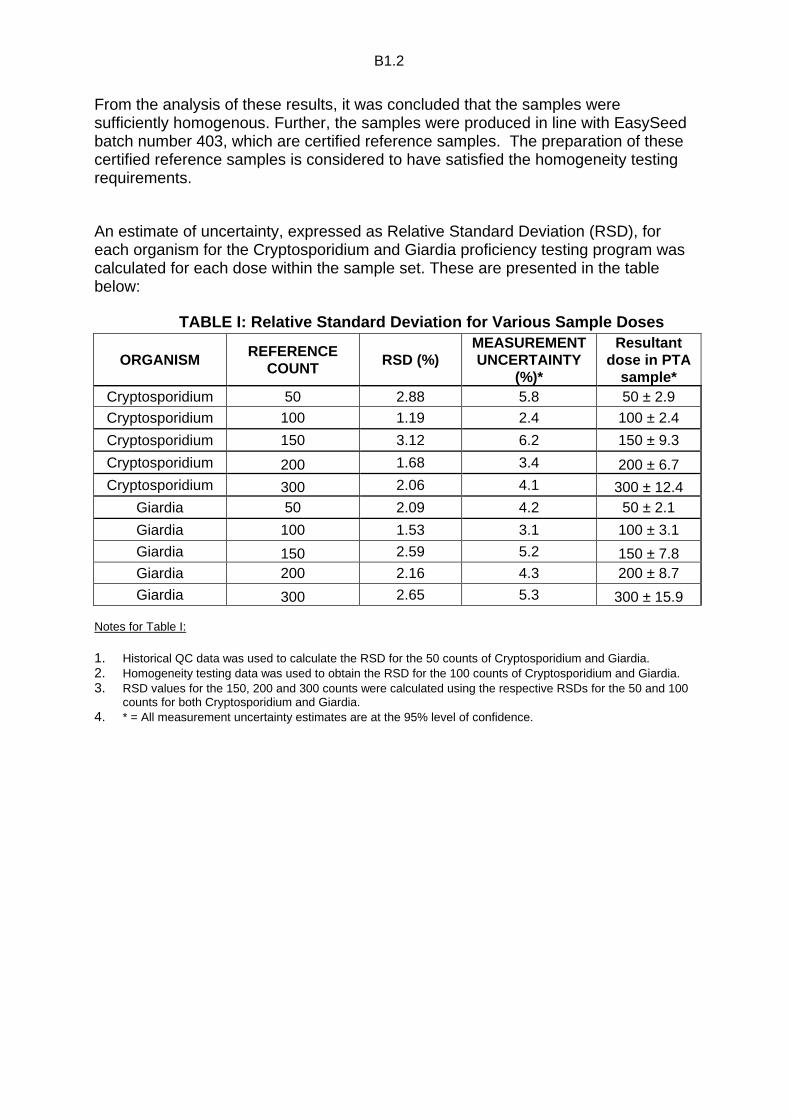
From the analysis of these results, it was concluded that the samples were sufficiently homogenous. Further, the samples were produced in line with EasySeed batch number 403, which are certified reference samples. The preparation of these certified reference samples is considered to have satisfied the homogeneity testing requirements. An estimate of uncertainty, expressed as Relative Standard Deviation (RSD), for each organism for the Cryptosporidium and Giardia proficiency testing program was calculated for each dose within the sample set. These are presented in the table below:
TABLE I: Relative Standard Deviation for Various Sa mple Doses
ORGANISM REFERENCE COUNT RSD (%)
MEASUREMENT UNCERTAINTY
(%)*
Resultant dose in PTA
sample* Cryptosporidium 50 2.88 5.8 50 ± 2.9
Cryptosporidium 100 1.19 2.4 100 ± 2.4
Cryptosporidium 150 3.12 6.2 150 ± 9.3
Cryptosporidium 200 1.68 3.4 200 ± 6.7 Cryptosporidium 300 2.06 4.1 300 ± 12.4
Giardia 50 2.09 4.2 50 ± 2.1
Giardia 100 1.53 3.1 100 ± 3.1
Giardia 150 2.59 5.2 150 ± 7.8 Giardia 200 2.16 4.3 200 ± 8.7
Giardia 300 2.65 5.3 300 ± 15.9 Notes for Table I: 1. Historical QC data was used to calculate the RSD for the 50 counts of Cryptosporidium and Giardia. 2. Homogeneity testing data was used to obtain the RSD for the 100 counts of Cryptosporidium and Giardia. 3. RSD values for the 150, 200 and 300 counts were calculated using the respective RSDs for the 50 and 100
counts for both Cryptosporidium and Giardia. 4. * = All measurement uncertainty estimates are at the 95% level of confidence.
B1.2
B1.1
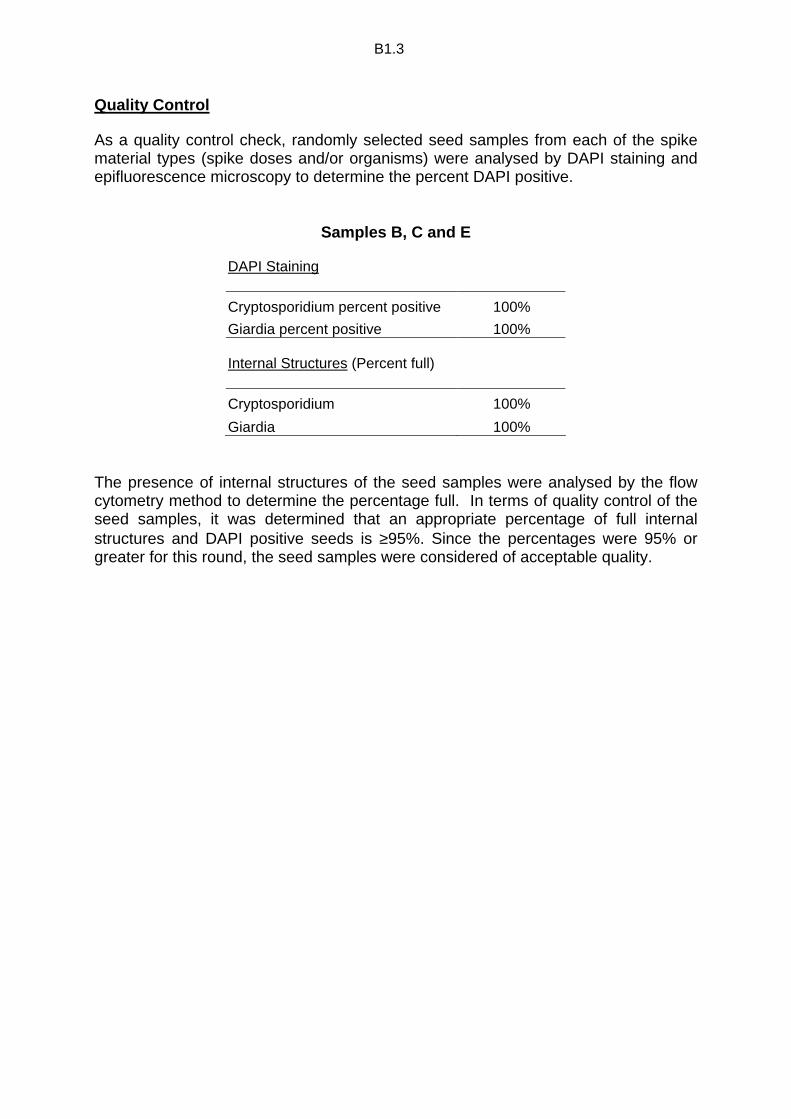
Quality Control As a quality control check, randomly selected seed samples from each of the spike material types (spike doses and/or organisms) were analysed by DAPI staining and epifluorescence microscopy to determine the percent DAPI positive.
Samples B, C and E
DAPI Staining
Cryptosporidium percent positive 100%
Giardia percent positive 100% Internal Structures (Percent full)
Cryptosporidium 100%
Giardia 100%
The presence of internal structures of the seed samples were analysed by the flow cytometry method to determine the percentage full. In terms of quality control of the seed samples, it was determined that an appropriate percentage of full internal structures and DAPI positive seeds is ≥95%. Since the percentages were 95% or greater for this round, the seed samples were considered of acceptable quality.
B1.3
B1.4
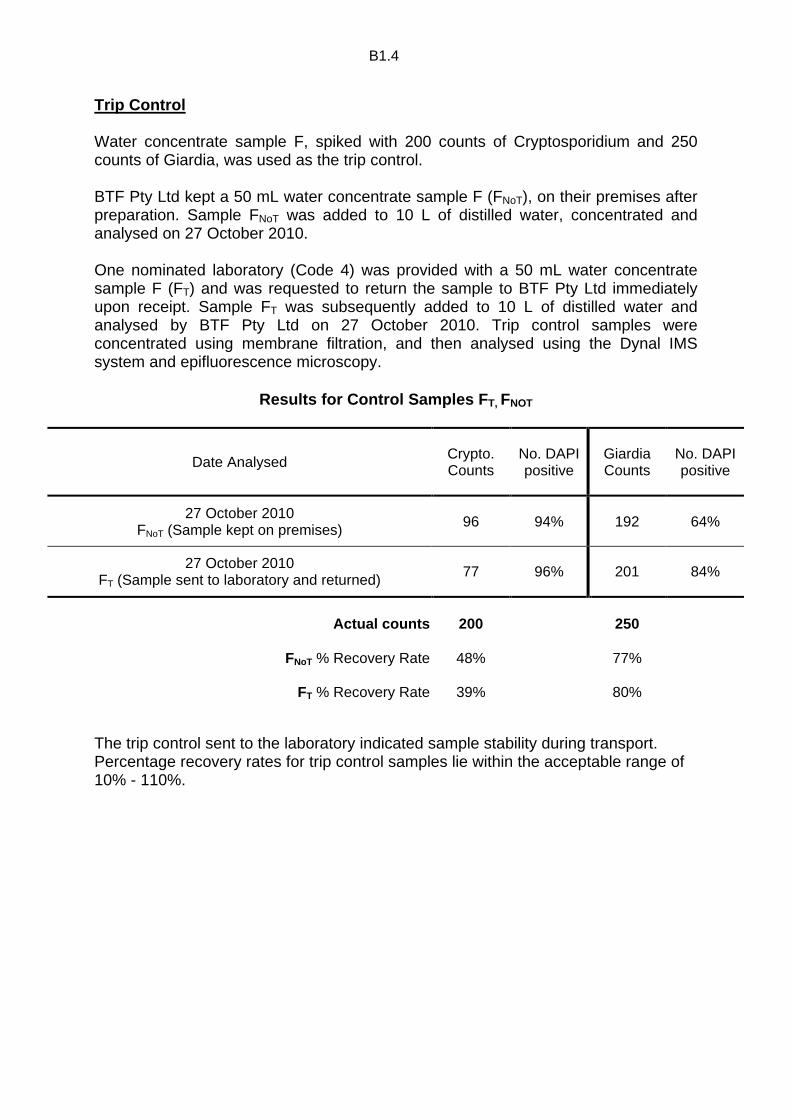
Trip Control Water concentrate sample F, spiked with 200 counts of Cryptosporidium and 250 counts of Giardia, was used as the trip control. BTF Pty Ltd kept a 50 mL water concentrate sample F (FNoT), on their premises after preparation. Sample FNoT was added to 10 L of distilled water, concentrated and analysed on 27 October 2010. One nominated laboratory (Code 4) was provided with a 50 mL water concentrate sample F (FT) and was requested to return the sample to BTF Pty Ltd immediately upon receipt. Sample FT was subsequently added to 10 L of distilled water and analysed by BTF Pty Ltd on 27 October 2010. Trip control samples were concentrated using membrane filtration, and then analysed using the Dynal IMS system and epifluorescence microscopy.
Results for Control Samples F T, FNOT
Date Analysed Crypto. Counts
No. DAPI positive
Giardia Counts
No. DAPI positive
27 October 2010 FNoT (Sample kept on premises) 96 94% 192 64%
27 October 2010 FT (Sample sent to laboratory and returned) 77 96% 201 84%
Actual counts 200 250
FNoT % Recovery Rate 48% 77%
FT % Recovery Rate 39% 80%
The trip control sent to the laboratory indicated sample stability during transport. Percentage recovery rates for trip control samples lie within the acceptable range of 10% - 110%.
APPENDIX C
Instructions to Participants
and
Results Sheet
C1.1
Proficiency Testing Australia
Proficiency Testing Program
Cryptosporidium and Giardia Round 26
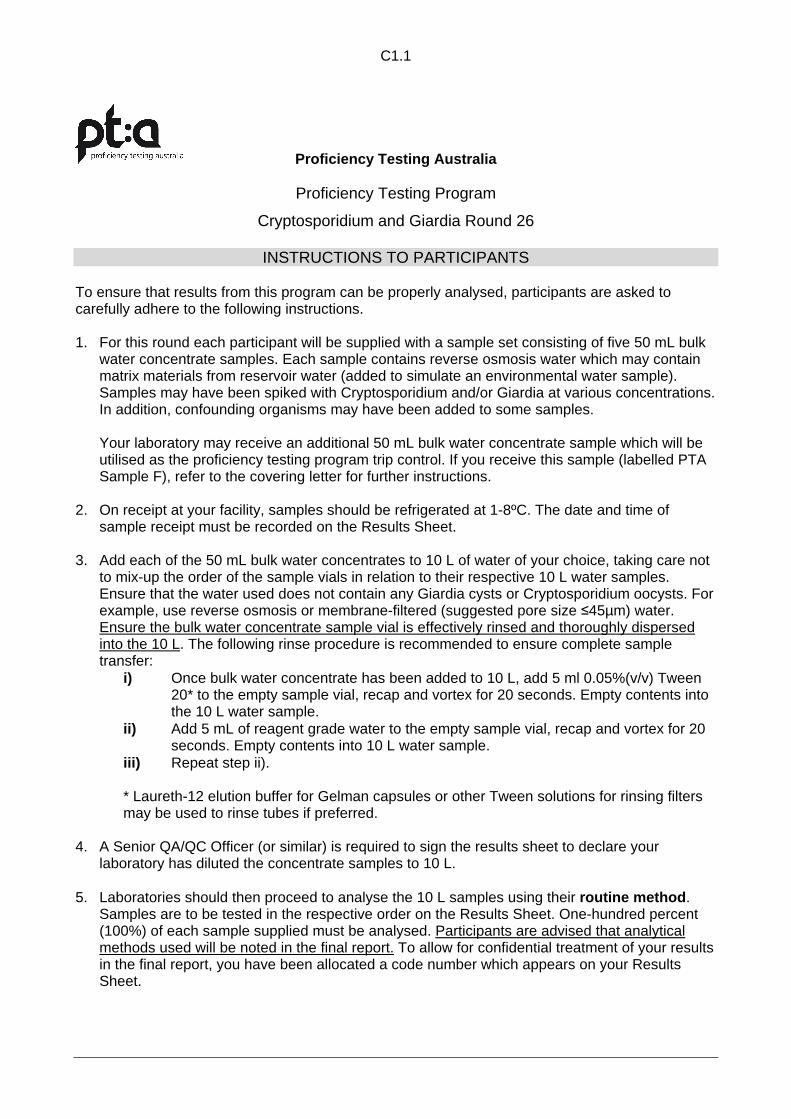
INSTRUCTIONS TO PARTICIPANTS
To ensure that results from this program can be properly analysed, participants are asked to carefully adhere to the following instructions. 1. For this round each participant will be supplied with a sample set consisting of five 50 mL bulk
water concentrate samples. Each sample contains reverse osmosis water which may contain matrix materials from reservoir water (added to simulate an environmental water sample). Samples may have been spiked with Cryptosporidium and/or Giardia at various concentrations. In addition, confounding organisms may have been added to some samples.
Your laboratory may receive an additional 50 mL bulk water concentrate sample which will be utilised as the proficiency testing program trip control. If you receive this sample (labelled PTA Sample F), refer to the covering letter for further instructions.
2. On receipt at your facility, samples should be refrigerated at 1-8ºC. The date and time of
sample receipt must be recorded on the Results Sheet. 3. Add each of the 50 mL bulk water concentrates to 10 L of water of your choice, taking care not
to mix-up the order of the sample vials in relation to their respective 10 L water samples. Ensure that the water used does not contain any Giardia cysts or Cryptosporidium oocysts. For example, use reverse osmosis or membrane-filtered (suggested pore size ≤45µm) water. Ensure the bulk water concentrate sample vial is effectively rinsed and thoroughly dispersed into the 10 L. The following rinse procedure is recommended to ensure complete sample transfer:
i) Once bulk water concentrate has been added to 10 L, add 5 ml 0.05%(v/v) Tween 20* to the empty sample vial, recap and vortex for 20 seconds. Empty contents into the 10 L water sample.
ii) Add 5 mL of reagent grade water to the empty sample vial, recap and vortex for 20 seconds. Empty contents into 10 L water sample.
iii) Repeat step ii).
* Laureth-12 elution buffer for Gelman capsules or other Tween solutions for rinsing filters may be used to rinse tubes if preferred.
4. A Senior QA/QC Officer (or similar) is required to sign the results sheet to declare your laboratory has diluted the concentrate samples to 10 L.
5. Laboratories should then proceed to analyse the 10 L samples using their routine method .
Samples are to be tested in the respective order on the Results Sheet. One-hundred percent (100%) of each sample supplied must be analysed. Participants are advised that analytical methods used will be noted in the final report. To allow for confidential treatment of your results in the final report, you have been allocated a code number which appears on your Results Sheet.
C1.1
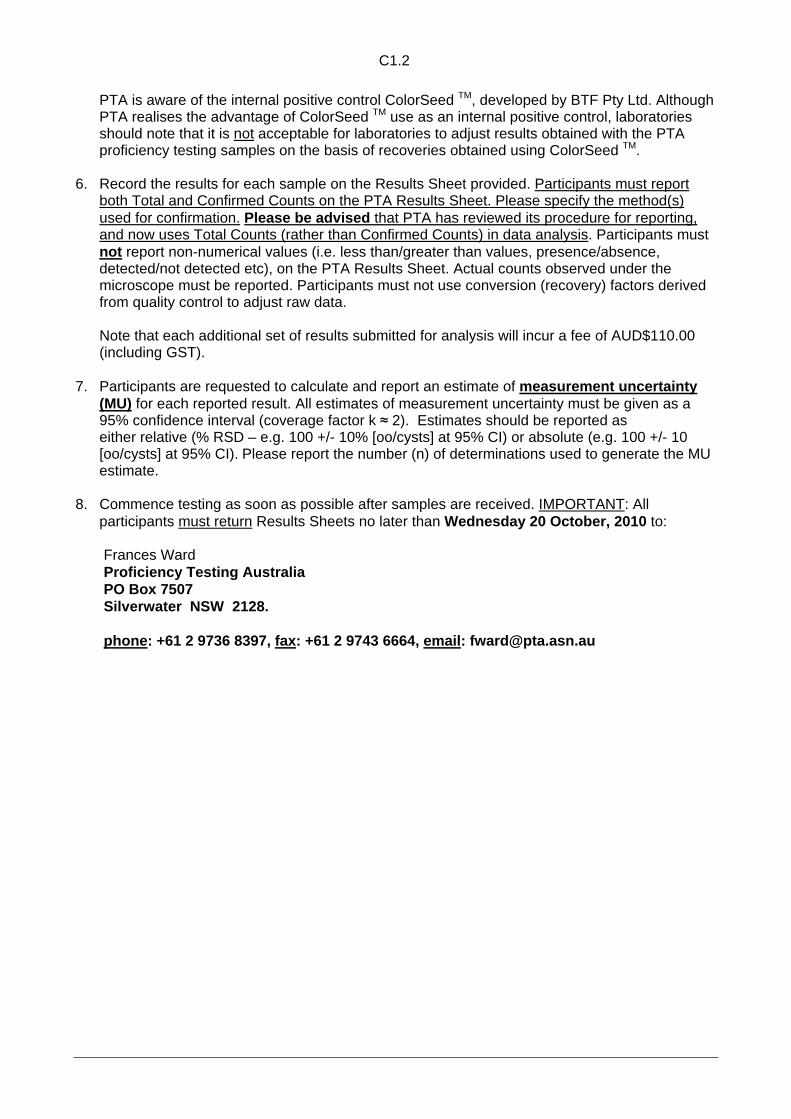
PTA is aware of the internal positive control ColorSeed TM, developed by BTF Pty Ltd. Although PTA realises the advantage of ColorSeed TM use as an internal positive control, laboratories should note that it is not acceptable for laboratories to adjust results obtained with the PTA proficiency testing samples on the basis of recoveries obtained using ColorSeed TM.
6. Record the results for each sample on the Results Sheet provided. Participants must report
both Total and Confirmed Counts on the PTA Results Sheet. Please specify the method(s) used for confirmation. Please be advised that PTA has reviewed its procedure for reporting, and now uses Total Counts (rather than Confirmed Counts) in data analysis. Participants must not report non-numerical values (i.e. less than/greater than values, presence/absence, detected/not detected etc), on the PTA Results Sheet. Actual counts observed under the microscope must be reported. Participants must not use conversion (recovery) factors derived from quality control to adjust raw data.
Note that each additional set of results submitted for analysis will incur a fee of AUD$110.00 (including GST).
7. Participants are requested to calculate and report an estimate of measurement uncertainty (MU) for each reported result. All estimates of measurement uncertainty must be given as a 95% confidence interval (coverage factor k ≈ 2). Estimates should be reported as either relative (% RSD – e.g. 100 +/- 10% [oo/cysts] at 95% CI) or absolute (e.g. 100 +/- 10 [oo/cysts] at 95% CI). Please report the number (n) of determinations used to generate the MU estimate.
8. Commence testing as soon as possible after samples are received. IMPORTANT: All participants must return Results Sheets no later than Wednesday 20 October, 2010 to: Frances Ward Proficiency Testing Australia PO Box 7507 Silverwater NSW 2128. phone : +61 2 9736 8397, fax : +61 2 9743 6664, email : [email protected]
C1.2
C1.1
Proficiency Testing Australia
Cryptosporidium and Giardia Round 26 - Proficiency Testing Program
Results Sheet
Lab Code:
Date and Time of Sample Receipt:
Cryptosporidium Counts
Giardia Counts Sample
Total Count
MU and *n Confirmed Count
Total Count
MU and *n Confirmed Count
Date & time of testing
A
B
C
D
E
*n – number of determinations used to generate MU estimate.
Methods used:
Concentration (e.g. Flocculation Method)
Purification (e.g. IMS) Enumeration (e.g. Microscopy) Details of confirmation methods
*Please be advised that methods used to obtain resu lts will be noted in the final report.*
Print Name: Date:
Signed: (Analyst/s)
I confirm that the concentrate was added to 10 L of water prior to analysis.
Print Name: Date:
Signed: (Senior QA/QC Officer or similar) Return no later than Wednesday 20 October, 2010 , to:
Frances Ward Proficiency Testing Australia, PO Box 7507, Silverw ater NSW 2128. Email: [email protected], Phone: +61 2 9736 8397, Fax: +61 2 9743 666 4
C1.3
GLOSSARY
Trip Control
A sample used to monitor the effect(s) of sample set transport. Sent to a nominated laboratory and returned.
Seed Sample
Sample containing Cryptosporidium oocysts and/or Giardia cysts in various doses, prior to dispensing into the PTA sample container.
Water Concentrate Sample
Final proficiency testing sample, containing Cryptosporidium oocysts and/or Giardia cysts, QC mud and Milli-Q water.
IMS Immunomagnetic separation
DAPI 4’,6-diamidino-2-phenylindole
DIC Differential Interference Contrast (Microscopy)
IFA Immunofluorescent Antibody
FITC Fluorescein isothiocyanate
---------- End of report ---------


![Prevalence of Cryptosporidium and Giardia lamblia in Water ...cyst of Cryptosporidium and Giardia lamblia as described earlier [16,17]. Oocysts in the specimens are usually difficult](https://img.pdfslide.net/doc/110x75/6035961b3d575467871f6698/prevalence-of-cryptosporidium-and-giardia-lamblia-in-water-cyst-of-cryptosporidium.jpg)