Embed Size (px)
Citation preview
Current Biology, Volume 23 Supplemental Information The Hippo Pathway Member Nf2 Is Required for Inner Cell Mass Specification Katie Cockburn, Steffen Biechele, Jodi Garner, and Janet Rossant Inventory of Supplemental Information Supplemental Figures
Figure S1, Related to Figure 2 Figure S2, Related to Figure 3 Figure S3, Related to Figure 4
Supplemental Experimental Procedures Supplemental References
E
Figure S1
GFP + GFP -Total GFP + GFP -TotalGFP + GFP -Total
Total cells Outer cells Inner cells
193 (54%)
172(53%)
165 (46%)
151(47%)
358
323
65(43%)
51(40%)
86 (57%)
75(60%)
151
126
258(51%)
223(50%)
251 (49%)
226(50%)
509
449
GFP(10 embryos)
dnNf2 + GFP(9 embryos)
380 (50%)
358(52%)
382 (50%)
325(48%)
762
683
68(43%)
88(51%)
90 (57%)
86(49%)
158
174
448(49%)
446(52%)
472 (51%)
411(48%)
920
857
GFP(10 embryos)
dnNf2 + GFP(10 embryos)la
te b
last
.ea
rly b
last
.
142 (51%)
158(54%)
137 (49%)
134(46%)
279
292
51(48%)
43(42%)
56 (52%)
59(58%)
107
102
193(50%)
201(51%)
193 (50%)
193(49%)
386
394
GFP(13 embryos)
dnNf2 + GFP(13 embryos)
mor
ula
GFP, dominant negative or wildtype mRNA
A
GFP
dnN
f2 +
GFP
Yap NucleiEcad
Yap NucleiEcad
GFP
kdLa
ts2
kdM
st1/
2dn
Nf2
GFP
Lats
2N
f2
B
pYap GFPpYap
C
D
8 cell (compacted) morula
Lats2-GFP
Lats1
F
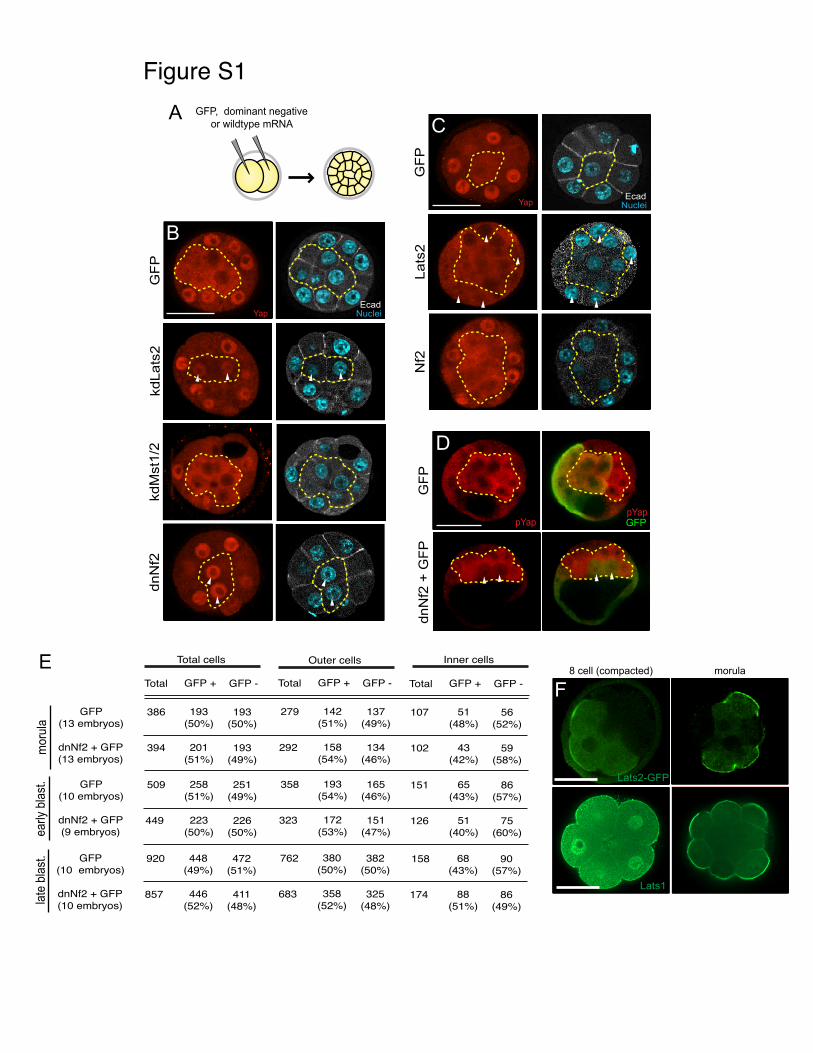
Figure S1. Additional Characterization of dnNf2 Injection, Related to Figure 2 (A) Schematic of preliminary dominant negative and wildtype over-expression injection experiments shown in (B) and (C). (B) Yap localization in morulas expressing GFP, kdLats2, dnNf2, or kdMst1/2 in all cells. (C) Yap localization in morulas expressing GFP, Lats2 or Nf2 in all cells. (D) pYap staining in GFP or dnNf2 + GFP mosaic early blastocysts. (E) Contribution of GFP positive and negative cells to inside and outside positions in GFP and dnNf2 + GFP mosaic morulas, early blastocysts and late blastocysts. Values do not vary significantly from expected results by Chi squared test (p > 0.05). (F) Localization of Lats2-GFP in mosaically injected embryos (top panel) and Lats1 staining (bottom panel) at the compacted 8 cell and morula stages. Dotted lines surround inside cells. Arrowheads indicate inside cells with nuclear Yap (B), outside cells with non-nuclear Yap (C), or inside cells with lower levels of pYap (D). Scale bars: 40μm.
Nf2flox/flox; Zp3-CreCre/+
(oocytes: Nf2del/del; Zp3-CreCre/+)
Nf2del/+
Nf2del/del; Zp3-CreCre/+ Nf2del/del; Zp3-Cre+/+ Nf2del/+; Zp3-CreCre/+ Nf2del/+; Zp3-Cre+/+
m-z-Nf2 m-z+Nf2
Figure S2
Nf2del/+
Nf2del/del Nf2+/+
m+z-Nf2
Nf2del/+
Nf2del/+
A
B
m+z+Nf2

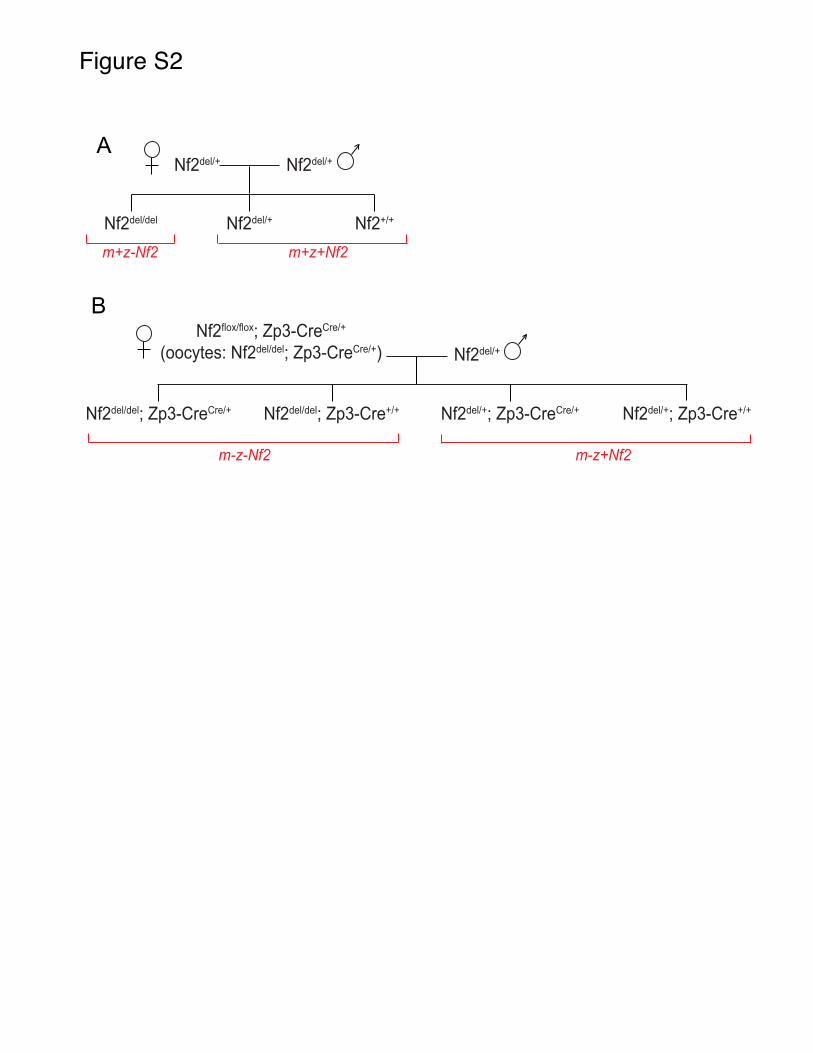
Figure S2. Breeding Scheme Used to Generate Nf2 Mutant Embryos, Related to Figure 3 (A) Nf2del/+ males and females were intercrossed to generate zygotically wildtype and heterozygous embryos, designated m+z+Nf2, and zygotically null embryos, designated m+z-Nf2. (B) Nf2flox/flox; Zp3-CreCre/+ females were mated with Nf2del/+ males to generate maternally null and zygotically heterozygous embryos, designated m-z+Nf2, and maternally and zygotically null embryos, designated m-z-Nf2.
C
Yap NucleiEcad
Cdx2 NucleiEcad
0
25
50
75
100
125
OutsideInside
BA
Aver
age
cell
num
ber
Figure S3m
-z+N
f2m
-z-N
f2
m-z+Nf2 m-z-Nf2

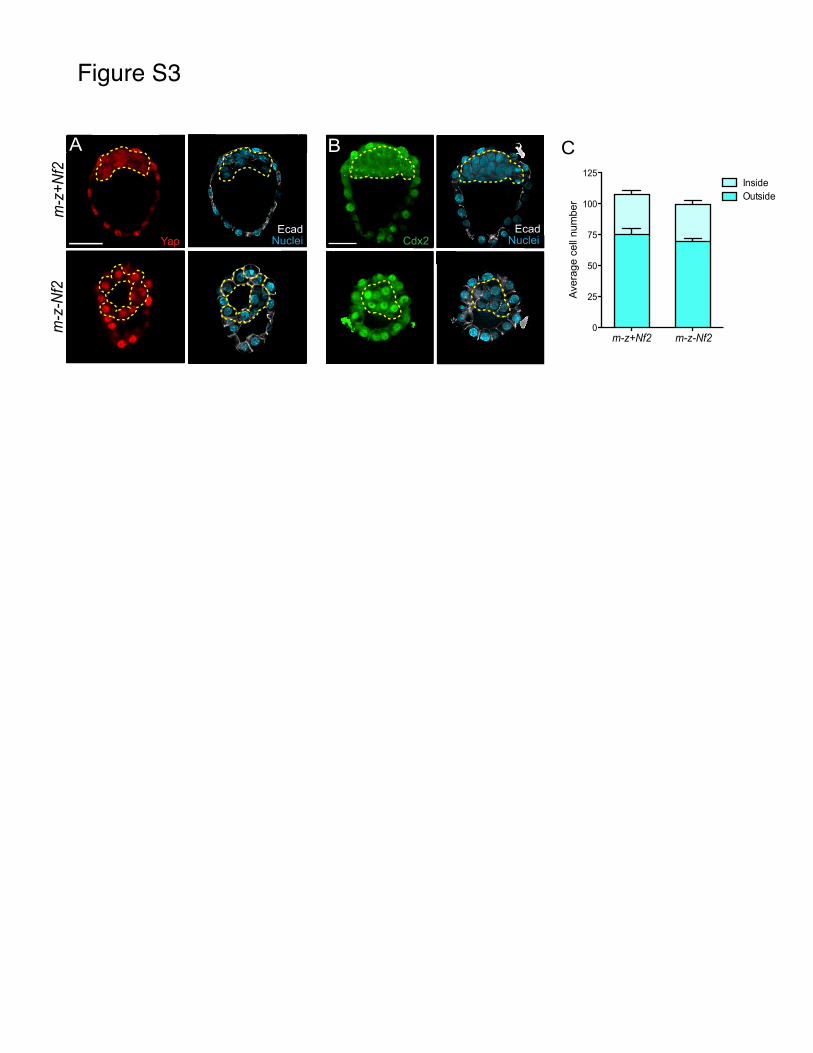
Figure S3. Preliminary Characterization of Maternal/Zygotic Mutant Late Blastocysts, Related to Figure 4 (A and B) Yap localization (A) and Cdx2 expression (B) in m-z+Nf2 and m-z-Nf2 late blastocysts flushed at E3.5 and cultured for 24 hours. (C) Average numbers of inside and outside cells in m-z+Nf2 (9 embryos) and m-z-Nf2 (5 embryos) late blastocysts. Total cell number per embryo as well as proportions of cells scored as outside or inside did not differ significantly between genotypes (p >0.05, t-test and p>0.05, Fisher’s exact test). Error bars indicate s.d. Dotted lines indicate inside cells. Scale bars: 40μm.
Supplemental Experimental Procedures Mouse Lines Wildtype ICR mice were used for all Nf2 expression profiling and mRNA injection experiments. To generate Nf2 mutant embryos, a previously described floxed allele of Nf2, (Nf2tm2Gth) [1], generously provided by Marco Giovannini, and a female oocyte-specific Cre, Tg(Zp3-cre)93Knw [2] were used. All mice were treated in accordance with institutional guidelines. Nf2m+/z- mutants and Nf2m+/z+ littermates were obtained by intercrossing Nf2del/+ males and females, while Nf2m-/z- mutants and Nf2m-/z+ littermates were obtained by crossing Nf2flox/flox; Zp3-CreCre/+ females to Nf2del/+ males (Figure S2). All mice were maintained on an outbred background. Genotyping Genomic DNA was extracted from ear punches and embryos using the Red Extract-N-Amp kit (Sigma), and genotyping PCR was performed in general as described previously [1]. To genotype individual preimplantation embryos after imaging, the following PCR reaction conditions were used: 94°C for 5 min, 10 cycles of 94°C for 1 min, 60°C for 1 min and 72°C for 1 min, 35 cycles of 94°C for 1 min, 50°C for 1 min, and 72°C for 1 min, and 72°C for 5 min. Embryo Collection and Culture All embryos were obtained by natural mating except the MII oocytes used for QPCR, which were obtained from superovulated females injected with 5 IU each pregnant mare serum gondadotropin and human chorionic gonadotropin (Sigma), 48 hours apart. Preimplantation embryos were obtained by flushing oviducts or uteri with M2 medium (Specialty Media, Chemicon), while E6.5 embryos were dissected from deciduae in PBS with Ca2+ and Mg2+. Oocytes were washed clean of cumulus cells by brief treatment with 300μg/ml hyaluronidase (Sigma). Injected 2-cell embryos and early blastocysts were cultured in droplets of KSOM (Chemicon) under mineral oil at 37°C, 5% CO2 until the desired developmental stage. QPCR RNA from pools of 25 embryos or individual MII oocytes was exctracted using the PicoPure RNA Isolation Kit (Invitrogen) and reverse transcribed using the Quantitect Kit (Quiagen). QPCR analysis was performed using SYBR Green and a Lightcycler 480 (Roche), and samples were run in three technical and at least three biological replicates. Ct values for Nf2 and the housekeeping genes Hprt and Ppia were used to calculate relative expression using the ΔΔCT method. Primers used were (5’-3’): Nf2, CTCTTGGCGTCATATGCTGT and GAGCAATTCCTCTTGGGCTA (spanning exons 4-5, for detection of Nf2 at different preimplantation stages) and CCTGGCTCAAAATGGACAAG and AATTTGGCCAGGAAGTGAAA (spanning exons 2-3, for detection of wildtype Nf2 in MII oocytes), Hprt, GCTTGCTGGTGAAAAGGACCTCTCGAAG and CCCTGAAGTACTCATTATAGTCAAGGGCAT [3] and Ppia, CGCGTCTCCTTCGAGCTGTTTG and TGTAAAGTCACCACCCTGGCACAT [3]. Constructs For in vitro transcription, all coding regions of interest were cloned into the pCS2+ vector. kdLats2 was generously provided by Hiroshi Sasaki, wildtype and dnNf2 were from Tyler Jacks (Addgene plasmids 14116 and 12170) and dnMst1 and 2 were from Jonathan Chernoff
(Addgene plasmids 12204 and 12206). To generate Nf2-GFP and Lats2-GFP, wildtype Nf2 or Lats2 was cloned upstream of GFP in the pCS2+ vector. mRNA Injection All mRNA was transcribed using the mMESSAGE mMACHINE SP6 Kit (Invitrogen) and resuspended in Rnase-free water. Microinjection was performed using a Leica microscope and micromanipulators (Leica Microsystems). Injection pressure was provided by a FemtoJet (Eppendorf) and negative capacitance was generated using a Cyto721 intracellular amplifier. Injections were performed in an open glass chamber in M2 medium. After injection embryos were cultured to the desired stage (~40h or less for morula, ~50h for early blastocyst, ~64h for late blastocyst) before fixation. For initial testing of dominant negative and wildtype mRNA, very high (1-2μg/μl) concentrations were injected. To generate dnNf2 + GFP mosaic embryos, a mixture of 0.45μg/μl dnNf2 and 0.5μg/μl GFP was injected, and for GFP mosaic controls, 0.95μg/μl GFP was injected. For the Lats2 rescue experiment, embryos were injected into both cells with 0.45μg/μl dnNf2, followed by re-injection into one cells with 0.5μg/μl Lats2 or GFP. Immunostaining In most cases fixation, permeabilization and blocking of embryos were performed as previously described [4]. For Atp1b1 staining, embryos were fixed for 12 minutes in a solution of 10% trichloroacetic acid in PBS, followed by permeabilization and fixation as usual. Embryos were incubated with primary antibdodies overnight at 4°C, rinsed, and incubated with secondary antibodies for at least one hour at room temperature. Nuclei were labelled with Hoechst 33342 (Invitrogen). Primary antibodies used in this study included chicken anti-GFP 1:400 (Invitrogen, A10262), rabbit anti-GFP 1:1000 (Invitrogen, A11122), mouse anti-Yap 1:100 (Santa Cruz, sc-101199), rat anti-E-cadherin 1:100 (DECMA-1) (Sigma, U3254), rabbit anti-phospho-Yap 1:100 (Cell Signalling, 4911), rabbit anti-Lats1 1:50 (Santa Cruz sc-28223), mouse anti-Cdx2 1:200 (Biogenex, MU392-UC), rabbit anti-Cdx2 1:200 [5], rabbit anti-Eomes 1:100 (abcam, ab23345), rabbit anti-Tcfap2c 1:100 (Santa Cruz, sc-8977), rabbit anti-Gata3 1:200 (abcam, ab23345), rabbit anti-aPKCζ 1:200 (Santa Cruz, sc-216), mouse anti-Atp1b1 1:1000 (Millipore, 05-369), mouse anti-ZO-1 1:200 (Invitrogen, 33-9100), mouse anti-Oct4 1:200 (Santa Cruz, sc-5279), rabbit anti-Nanog 1:200 (Reprocell, RCABP0001P) and goat anti-Gata6 1:200 (R&D, AF1700). Secondary antibodies included DyLight 448 and 549 conjugated donkey anti-mouse, donkey anti-rabbit, donkey anti-chicken, and donkey anti-goat (Jackson Immunoresearch) and Alexa Fluor 633 conjugated donkey anti-rat (Invitrogen). Image Acquisition and Analysis Images were aquired using a Zeiss Axiovert 200 inverted microscope equipped with a Hamamatsu C9100-13 EM-CCD camera, a Quorum spinning disk confocal scan head and Volocity aquisition software (Perkin Elmer). Z-stacks were taken at 1μm intervals with a 20x water immersion objective (NA=0.75). Images were exported to ImageJ for analysis. Cell position was judged by E-cadherin staining, with cells displaying a region of outward-facing E-cadherin negative membrane scored as “outside” and cells with E-cadherin detectable throughout the membrane scored as “inside”.
To quantify Yap localization, ratios of average nuclear intesity to average cytoplasmic intensity were calculated and cells were scored as having either cytoplasmic (<1.0), weakly nuclear (1.0-1.3) or strongly nuclear (>1.3) Yap. To quantify Cdx2 expression, average nuclear
intensities of inside cells were normalized to the average nuclear intensity of the strongest Cdx2-expressing outside cell in their respective embryos, and cells were scored as Cdx2 positive (≥0.5) or Cdx2 negative (<0.5). Embryo Outgrowths and Stem Cell Derivation To observe outgrowth morphology, blastocysts were cultured feeder-free for 6 days in standard ESC media containing 20% fetal bovine serum (FBS) and 1000 U/ml leukemia inhibitory factor (LIF) and then genotyped. To derive ESC lines, blastocysts were allowed to outgrow on feeders in ESC media supplemented with 1000U/ml LIF, 1μM PD0325901 (Stemgent) and 3μM CHIR99021 (Stemgent) and then passaged into FBS/LIF media for maintenance. Supplemental References 1. Giovannini, M., Robanus-Maandag, E., van der Valk, M., Niwa-Kawakita, M.,
Abramowski, V., Goutebroze, L., Woodruff, J. M., Berns, A., and Thomas, G. (2000). Conditional biallelic Nf2 mutation in the mouse promotes manifestations of human neurofibromatosis type 2. Genes Dev 14, 1617–1630.
2. de Vries, W. N., Binns, L. T., Fancher, K. S., Dean, J., Moore, R., Kemler, R., and Knowles, B. B. (2000). Expression of Cre recombinase in mouse oocytes: a means to study maternal effect genes. genesis 26, 110–112.
3. Mamo, S., Gal, A. B., Bodo, S., and Dinnyes, A. (2007). Quantitative evaluation and selection of reference genes in mouse oocytes and embryos cultured in vivo and in vitro. BMC Dev Biol 7, 14.
4. Yamanaka, Y., Lanner, F., and Rossant, J. (2010). FGF signal-dependent segregation of primitive endoderm and epiblast in the mouse blastocyst. Development 137, 715–724.
5. Chawengsaksophak, K., James, R., Hammond, V. E., Köntgen, F., and Beck, F. (1997). Homeosis and intestinal tumours in Cdx2 mutant mice. Nature 386, 84–87.