Embed Size (px)
Citation preview
August 2019
Release Date: September 6, 2019
Prepared by Analysts of the National Estimates Branch
Current Employment Statistics Survey U.S. Bureau of Labor Statistics
202-691-6555 Email CES
Contents
Summary
Mining & Logging
Construction
Manufacturing
Wholesale Trade
Retail Trade
Transportation, Warehousing, & Utilities
Information
Financial Activities
Professional & Business Services
Private Education & Health Services
Leisure & Hospitality
Other Services
Government
Current Employment Statistics Highlights
Detailed Industry Employment Analysis
Current Employment Statistics
Highlights
Current Employment Statistics Summary, August 2019
CES Highlights
Release Date: September 6, 2019
and business services has increased by an
average 34,000 per month, compared to an
average of 47,000 per month in 2018.
+34,000 Government
Employment in federal government, except
U.S. Postal Service, rose by 27,000 over the
month. This gain resulted from the hiring of
25,000 temporary workers to prepare for the
2020 Census.
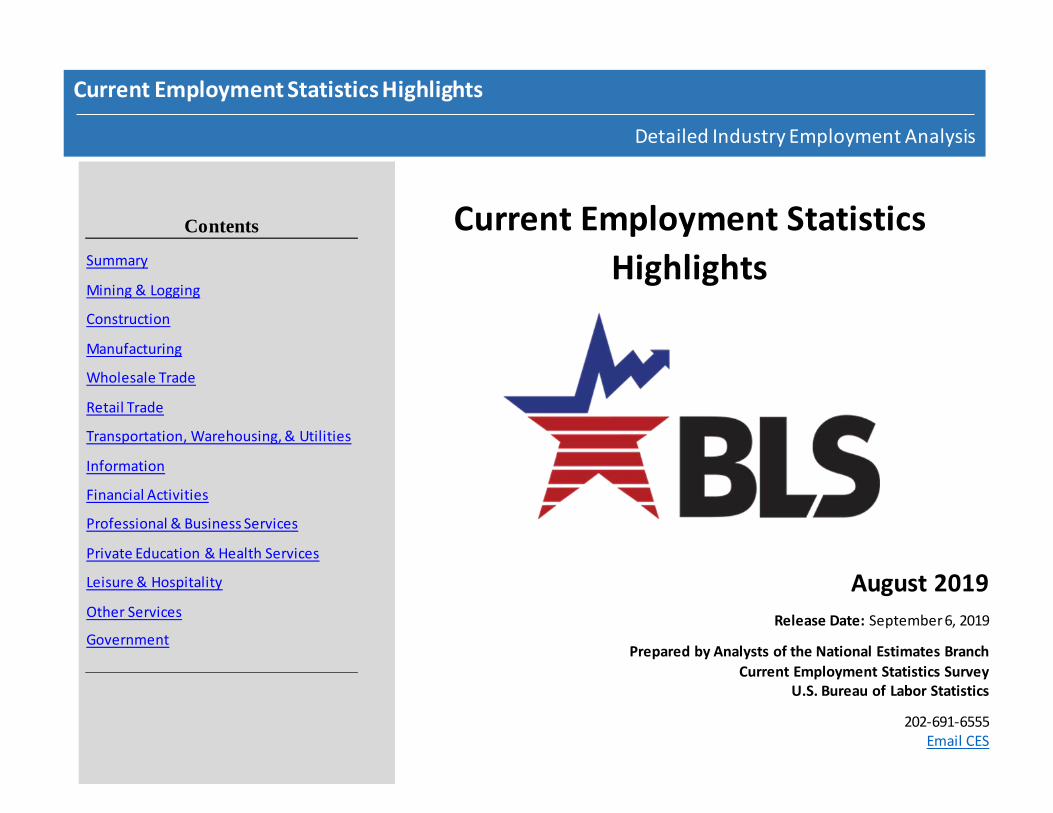
Nonfarm payroll employment increased by
130,000 in August. Federal government,
health care and financial activities added jobs
over the month, while mining lost jobs. Year to
date, job growth has averaged 158,000 per
month, down from 223,000 per month in
2018.
The employment change for June revised
down from +193,000 to +178,000, and the
change for July also revised down from
+164,000 to +159,000. On net, employment
over June and July is 20,000 lower than
previously reported.
In August, average hourly earnings of all
private-sector employees increased by 11
cents, or 0.4 percent, after gains of 9 cents in
both June and July. Over the year, hourly
earnings have risen by 3.2 percent. Average
weekly hours increased by 0.1 hour to 34.4
hours.
+37,000 Professional and Business Services
Employment in professional and business
services continued to trend up in August
(+37,000). Within the industry, employment
rose by 10,000 each in computer systems
design and related services and in
management of companies and enterprises.
So far this year, employment in professional
90
232234
211
15
282
336
135
270
128
170
215
252
141
127
213
128
229
204
187
18
260
220
174171
330
182
196
270262
178
282
108
277
196
227
312
56
153
216
62
178
159
130
0
50
100
150
200
250
300
350
400
Jan-16 Jul-16 Jan-17 Jul-17 Jan-18 Jul-18 Jan-19 Jul-19
Over-the-month change Annual average
Bureau of Labor Statistics, Current Employment Statistics, September 06, 2019.Most recent 2 months of data are preliminary.
Over-the-month change, January 2016–August 2019Seasonally adjusted, in thousands
Employment in total nonfarm
Summary Mining & Logging
Construction Manufacturing
Trade:
Wholesale Retail
Transp.,
Warehousing & Utilities
Information Financial Activities
Professional
& Business Services
Private
Education & Health
Services
Leisure & Hospitality
Other Services
Government
CES Highlights
Release Date: September 6, 2019
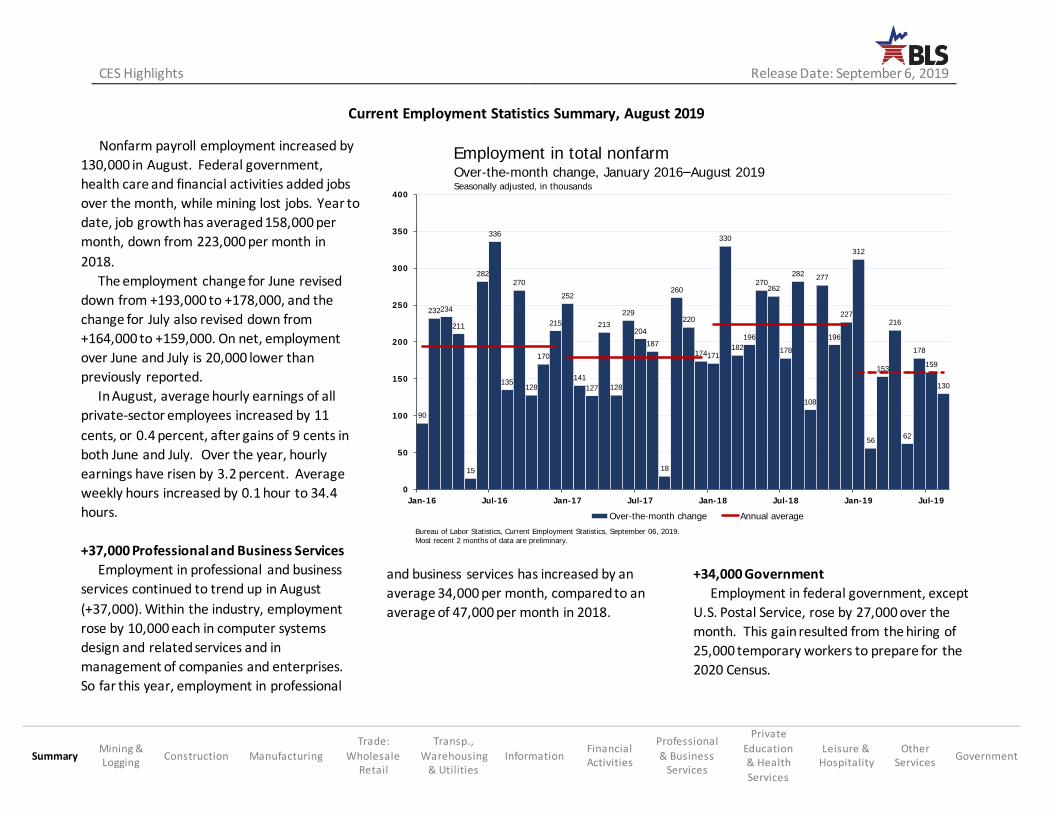
+32,000 Education and Health Services
Health care added 24,000 jobs in August.
Among health care providers, employment
continued to trend up in ambulatory care
services (+12,000) and in hospitals (+9,000).
Over the past 12 months, health care has
added 392,000 jobs.
Within social assistance, employment in
individual and family services rose by 17,000 in
August and by 113,000 over the year.
+15,000 Financial Activities
Within financial activities, insurance carriers
and related activities added 7,000 jobs in
August.
+3,000 Manufacturing
Manufacturing employment changed little in
August (+3,000). So far this year, employment
in the industry has changed by an average
+6,000 per month, compared to gains
averaging +22,000 per month in 2018.
-5,000 Mining and Logging
Mining employment declined by 6,000 in
August and has fallen by 12,000 over the past
3 months.
-11,000 Retail Trade
Employment in retail trade changed little in
August (-11,000). So far this year, employment
in the industry has fallen by 74,000.
34
-1
12
32
37
15
0
-1
-1
-11
3
3
14
-5
-40 -20 0 20 40 60 80
Government
Other services
Leisure and hospitality
Education and health services
Professional and business services
Financial activities*
Information
Utilities
Transportation and warehousing
Retail trade
Wholesale trade
Manufacturing
Construction
Mining and logging
Employment in total nonfarm
August 2019 Prior 12-month average
Over-the-month change, August 2019Seasonally adjusted, in thousands
Total nonfarm:130*
Bureau of Labor Statistics, Current Employment Statistics survey, September 06, 2019.
Data are preliminary.
* denotes significance
Current Employment Statistics Summary, August 2019
Summary Mining &
Logging Construction Manufacturing
Trade:
Wholesale
Retail
Transp.,
Warehousing
& Utilities
Information Financial
Activities
Professional
& Business
Services
Private Education
& Health
Services
Leisure &
Hospitality
Other
Services Government
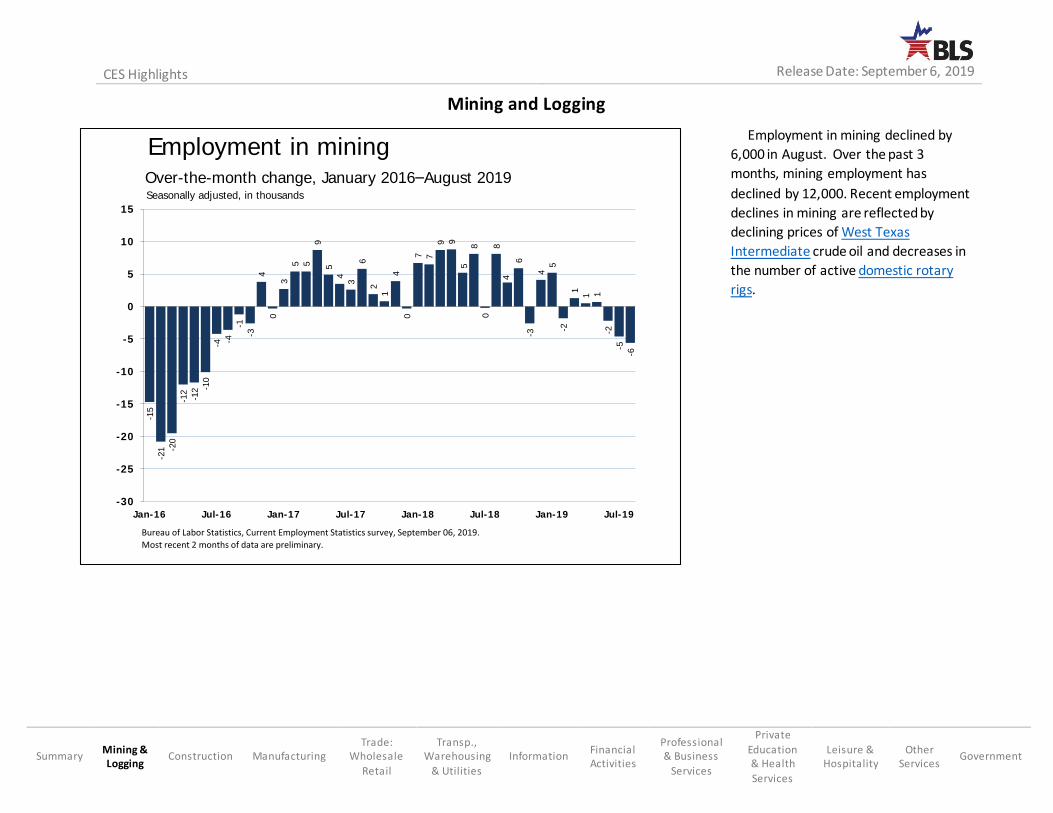
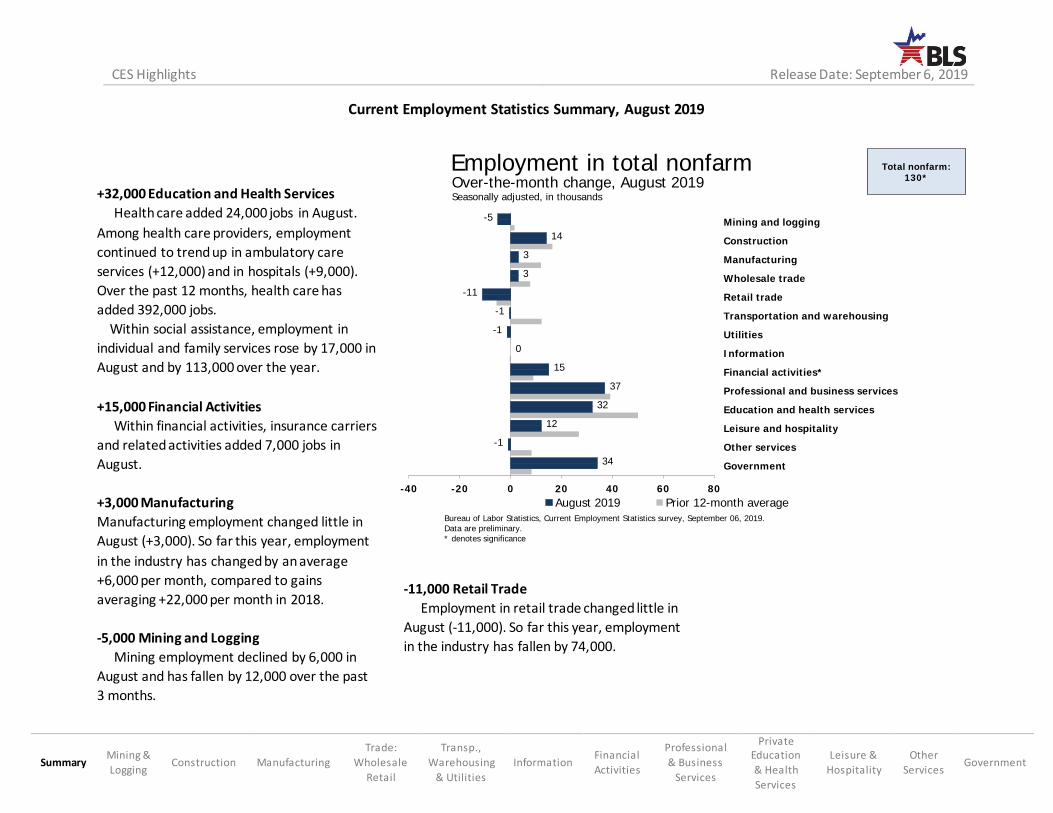
Employment in mining declined by
6,000 in August. Over the past 3
months, mining employment has
declined by 12,000. Recent employment
declines in mining are reflected by
declining prices of West Texas
Intermediate crude oil and decreases in
the number of active domestic rotary
rigs.
-15
-21 -2
0
-12
-12 -1
0
-4 -4
-1
-3
4
0
3
5 5
9
5
4
3
6
2
1
4
0
7 7
9 9
58
0
84
6
-3
4
5
-2
1
1 1
-2
-5
-6
-30
-25
-20
-15
-10
-5
0
5
10
15
Jan-16 Jul-16 Jan-17 Jul-17 Jan-18 Jul-18 Jan-19 Jul-19
Employment in miningOver-the-month change, January 2016–August 2019Seasonally adjusted, in thousands
Bureau of Labor Statistics, Current Employment Statistics survey, September 06, 2019.
Most recent 2 months of data are preliminary.
Mining and Logging
Summary Mining & Logging
Construction Manufacturing Trade:
Wholesale
Retail
Transp., Warehousing
& Utilities
Information Financial Activities
Professional & Business
Services
Private
Education & Health
Services
Leisure & Hospitality
Other Services
Government
CES Highlights
Release Date: September 6, 2019
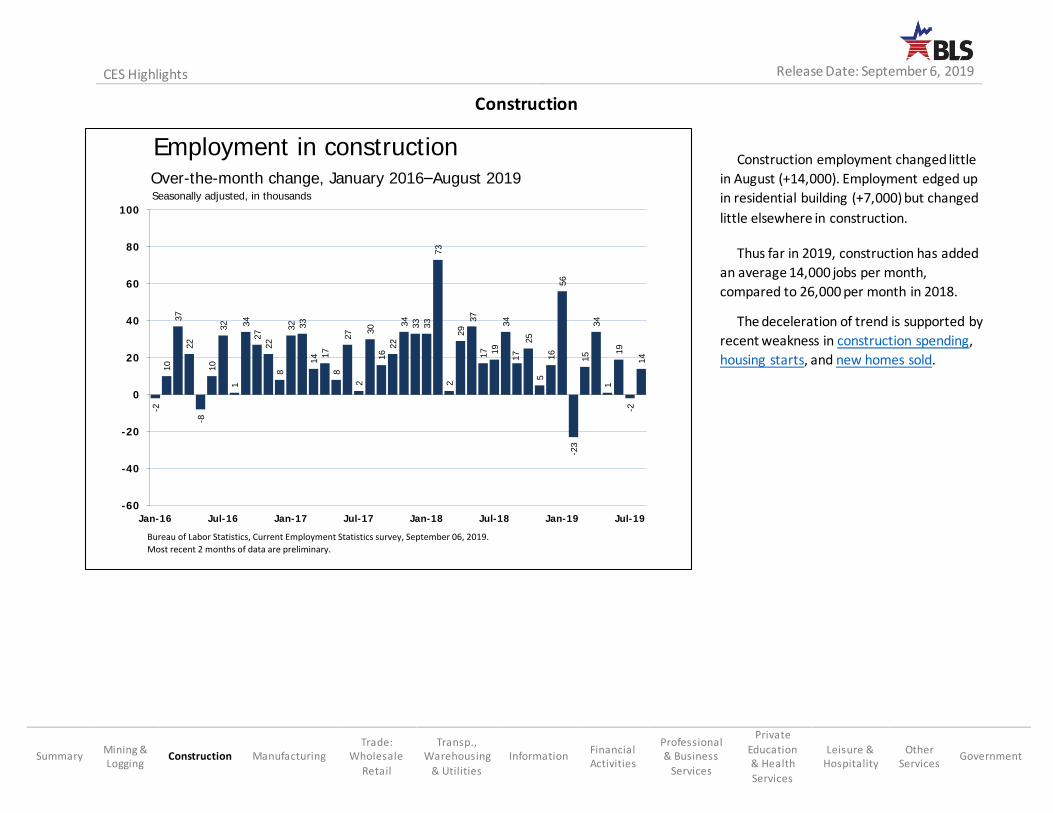
Construction employment changed little
in August (+14,000). Employment edged up
in residential building (+7,000) but changed
little elsewhere in construction.
Thus far in 2019, construction has added
an average 14,000 jobs per month,
compared to 26,000 per month in 2018.
The deceleration of trend is supported by
recent weakness in construction spending,
housing starts, and new homes sold.
-2
10
37
22
-8
10
32
1
34
27
22
8
32 33
14 1
7
8
27
2
30
16
22
34
33
33
73
2
29
37
17 19
34
17
25
5
16
56
-23
15
34
1
19
-2
14
-60
-40
-20
0
20
40
60
80
100
Jan-16 Jul-16 Jan-17 Jul-17 Jan-18 Jul-18 Jan-19 Jul-19
Employment in constructionOver-the-month change, January 2016–August 2019Seasonally adjusted, in thousands
Bureau of Labor Statistics, Current Employment Statistics survey, September 06, 2019.
Most recent 2 months of data are preliminary.
Construction
Summary Mining & Logging
Construction Manufacturing Trade:
Wholesale
Retail
Transp., Warehousing
& Utilities
Information Financial Activities
Professional & Business
Services
Private
Education & Health
Services
Leisure & Hospitality
Other Services
Government
CES Highlights
Release Date: September 6, 2019
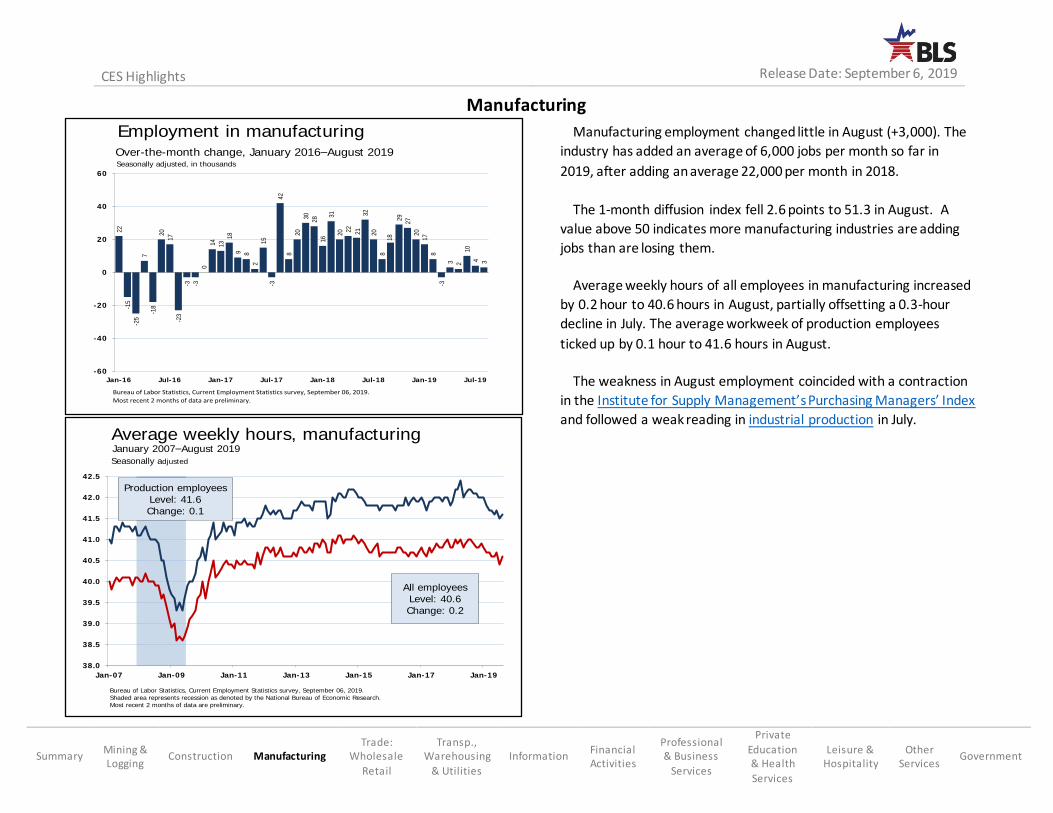
Manufacturing employment changed little in August (+3,000). The
industry has added an average of 6,000 jobs per month so far in
2019, after adding an average 22,000 per month in 2018.
The 1-month diffusion index fell 2.6 points to 51.3 in August. A
value above 50 indicates more manufacturing industries are adding
jobs than are losing them.
Average weekly hours of all employees in manufacturing increased
by 0.2 hour to 40.6 hours in August, partially offsetting a 0.3-hour
decline in July. The average workweek of production employees
ticked up by 0.1 hour to 41.6 hours in August.
The weakness in August employment coincided with a contraction
in the Institute for Supply Management’s Purchasing Managers’ Index
and followed a weak reading in industrial production in July.
22
-15
-25
7
-18
20
17
-23
-3 -3
0
14 13
18
9 8
2
15
-3
42
8
20
30
28
16
31
20
22 2132
20
818
29
27
20
17
8
-3
3 2
10
4 3
-60
-40
-20
0
20
40
60
Jan-16 Jul-16 Jan-17 Jul-17 Jan-18 Jul-18 Jan-19 Jul-19
Employment in manufacturingOver-the-month change, January 2016–August 2019Seasonally adjusted, in thousands
Bureau of Labor Statistics, Current Employment Statistics survey, September 06, 2019.
Most recent 2 months of data are preliminary.
38.0
38.5
39.0
39.5
40.0
40.5
41.0
41.5
42.0
42.5
Jan-07 Jan-09 Jan-11 Jan-13 Jan-15 Jan-17 Jan-19
Average weekly hours, manufacturing
Bureau of Labor Statistics, Current Employment Statistics survey, September 06, 2019.
Shaded area represents recession as denoted by the National Bureau of Economic Research.
Most recent 2 months of data are preliminary.
January 2007–August 2019
Seasonally adjusted
Production employeesLevel: 41.6Change: 0.1
All employeesLevel: 40.6Change: 0.2
Manufacturing
CES Highlights
Release Date: September 6, 2019
Summary Mining & Logging
Construction Manufacturing Trade:
Wholesale
Retail
Transp., Warehousing
& Utilities
Information Financial Activities
Professional & Business
Services
Private
Education & Health
Services
Leisure & Hospitality
Other Services
Government
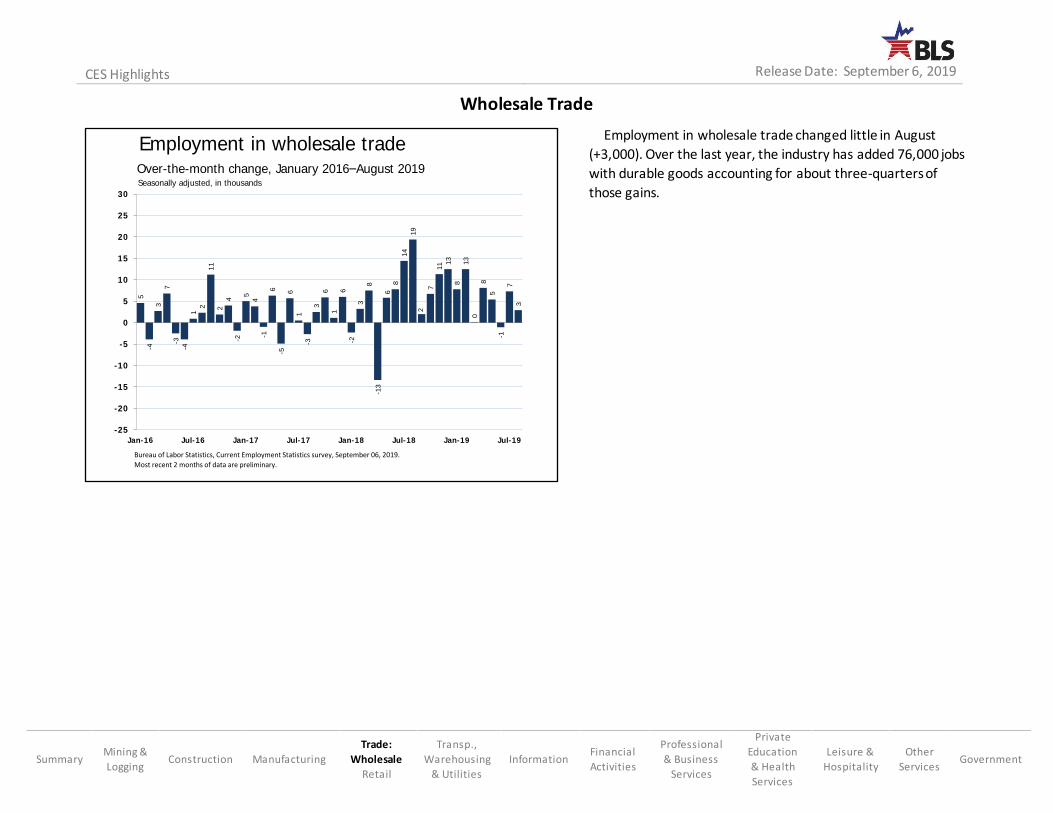
Employment in wholesale trade changed little in August
(+3,000). Over the last year, the industry has added 76,000 jobs
with durable goods accounting for about three-quarters of
those gains.
5
-4
3
7
-3
-4
1
2
11
2
4
-2
5
4
-1
6
-5
6
1
-3
3
6
1
6
-2
3
8
-13
68
14
19
2
7
11 1
3
8
13
0
8
5
-1
7
3
-25
-20
-15
-10
-5
0
5
10
15
20
25
30
Jan-16 Jul-16 Jan-17 Jul-17 Jan-18 Jul-18 Jan-19 Jul-19
Employment in wholesale tradeOver-the-month change, January 2016–August 2019Seasonally adjusted, in thousands
Bureau of Labor Statistics, Current Employment Statistics survey, September 06, 2019.
Most recent 2 months of data are preliminary.
Wholesale Trade
Summary Mining &
Logging Construction Manufacturing
Trade:
Wholesale
Retail
Transp.,
Warehousing
& Utilities
Information Financial
Activities
Professional
& Business
Services
Private
Education
& Health
Services
Leisure &
Hospitality
Other
Services Government
CES Highlights
Release Date: September 6, 2019
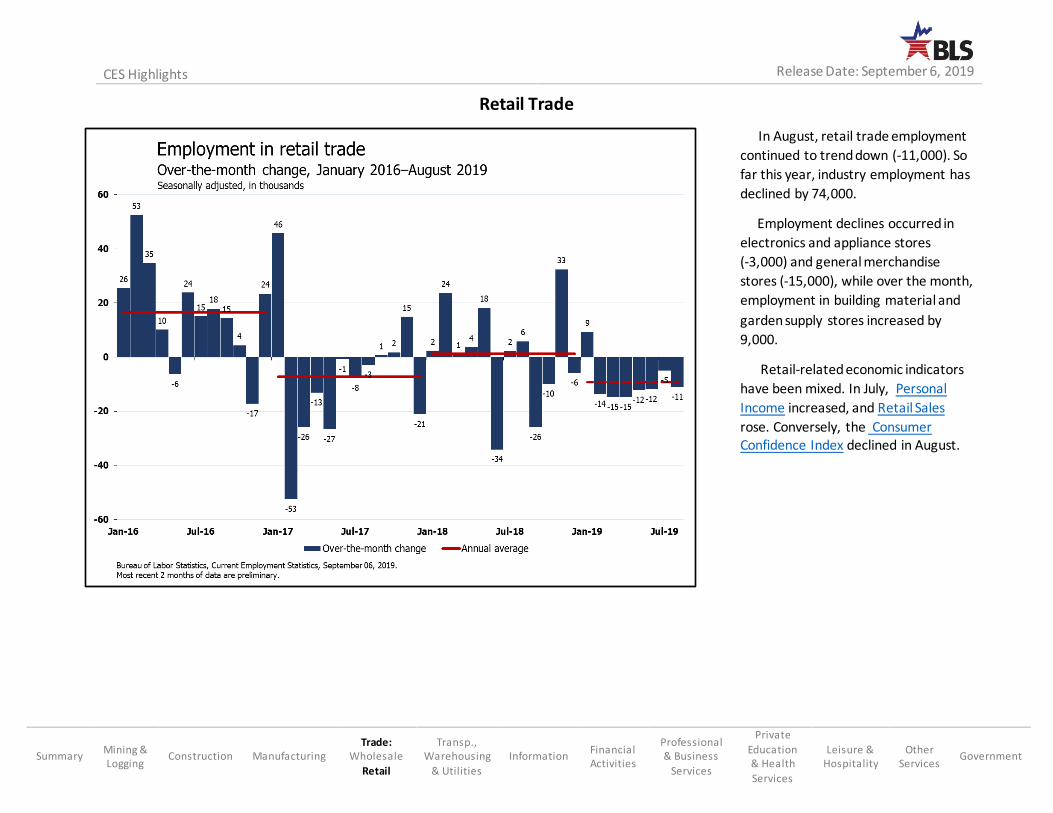
In August, retail trade employment
continued to trend down (-11,000). So
far this year, industry employment has
declined by 74,000.
Employment declines occurred in
electronics and appliance stores
(-3,000) and general merchandise
stores (-15,000), while over the month,
employment in building material and
garden supply stores increased by
9,000.
Retail-related economic indicators
have been mixed. In July, Personal
Income increased, and Retail Sales
rose. Conversely, the Consumer Confidence Index declined in August.
Retail Trade
Summary Mining & Logging
Construction Manufacturing Trade:
Wholesale
Retail
Transp., Warehousing
& Utilities
Information Financial Activities
Professional & Business
Services
Private
Education & Health
Services
Leisure & Hospitality
Other Services
Government
CES Highlights
Release Date: September 6, 2019
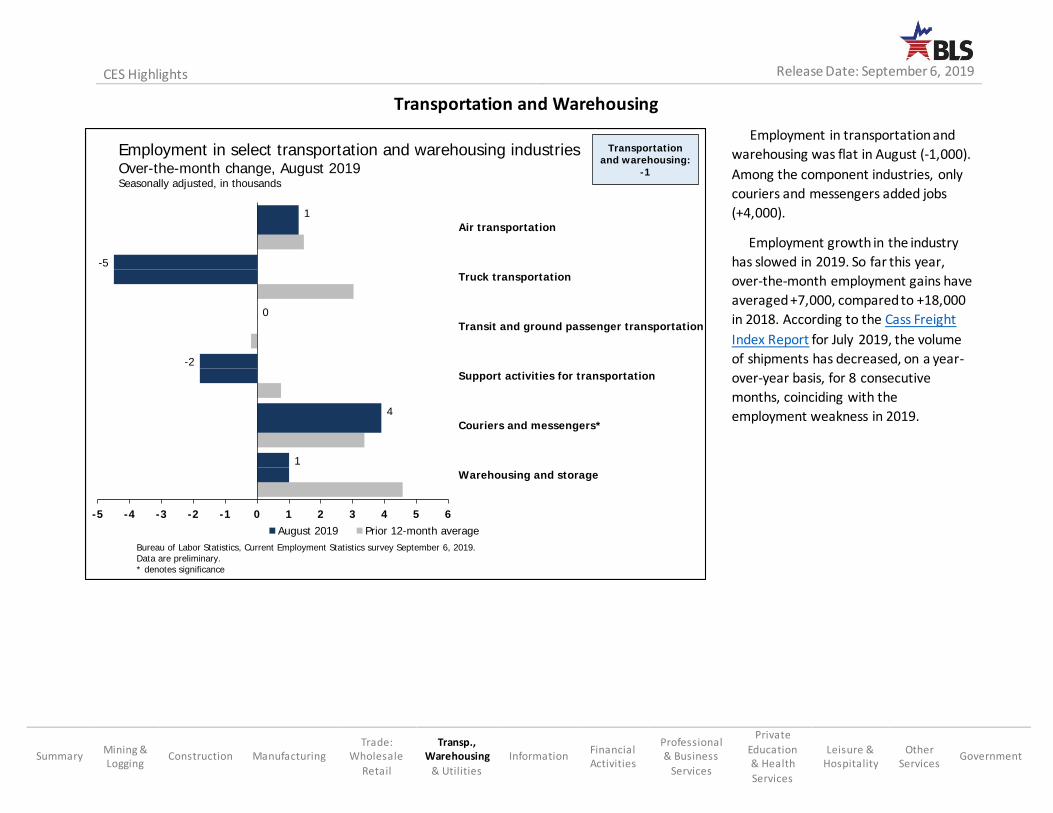
Employment in transportation and
warehousing was flat in August (-1,000).
Among the component industries, only
couriers and messengers added jobs
(+4,000).
Employment growth in the industry
has slowed in 2019. So far this year,
over-the-month employment gains have
averaged +7,000, compared to +18,000
in 2018. According to the Cass Freight
Index Report for July 2019, the volume
of shipments has decreased, on a year-
over-year basis, for 8 consecutive
months, coinciding with the
employment weakness in 2019.
1
4
-2
0
-5
1
-5 -4 -3 -2 -1 0 1 2 3 4 5 6
Warehousing and storage
Couriers and messengers*
Support activities for transportation
Transit and ground passenger transportation
Truck transportation
Air transportation
Employment in select transportation and warehousing industriesOver-the-month change, August 2019Seasonally adjusted, in thousands
August 2019 Prior 12-month average
Bureau of Labor Statistics, Current Employment Statistics survey September 6, 2019.
Data are preliminary.
* denotes significance
Transportationand warehousing:
-1
Transportation and Warehousing
Summary Mining & Logging
Construction Manufacturing Trade:
Wholesale
Retail
Transp., Warehousing
& Utilities
Information Financial Activities
Professional & Business
Services
Private
Education & Health
Services
Leisure & Hospitality
Other Services
Government
CES Highlights
Release Date: September 6, 2019
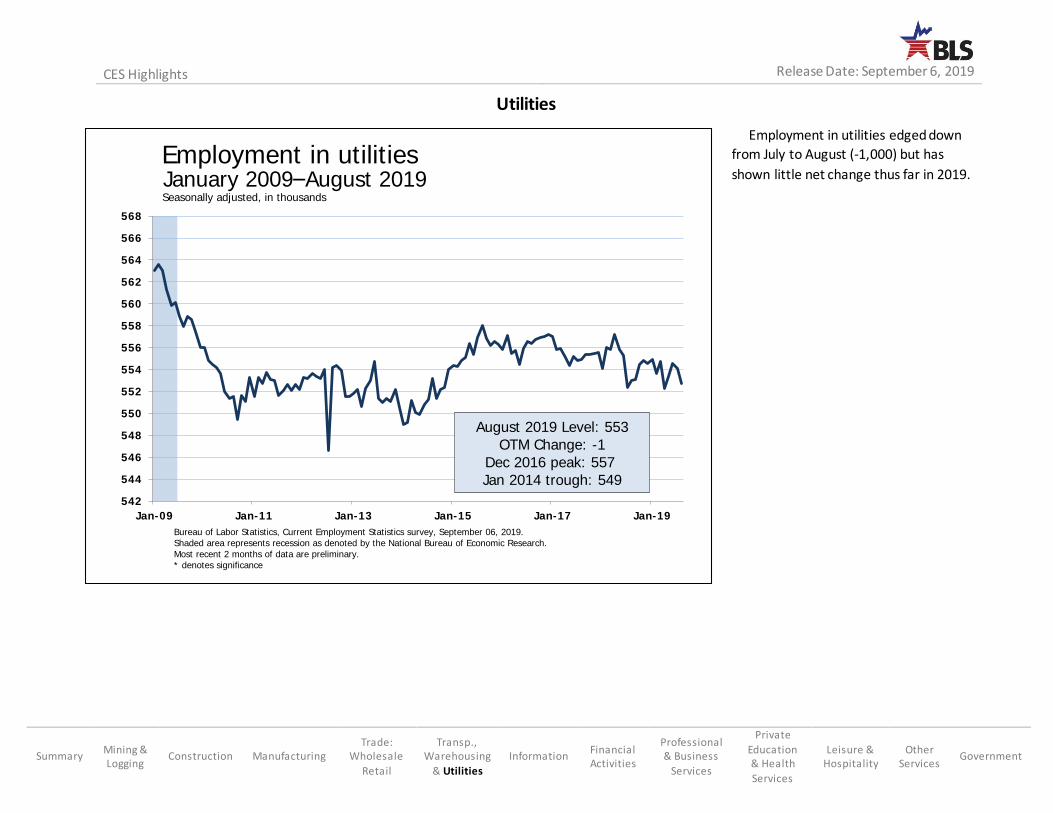
Employment in utilities edged down
from July to August (-1,000) but has
shown little net change thus far in 2019.
542
544
546
548
550
552
554
556
558
560
562
564
566
568
Jan-09 Jan-11 Jan-13 Jan-15 Jan-17 Jan-19
Employment in utilities
August 2019 Level: 553OTM Change: -1
Dec 2016 peak: 557 Jan 2014 trough: 549
Bureau of Labor Statistics, Current Employment Statistics survey, September 06, 2019.
Shaded area represents recession as denoted by the National Bureau of Economic Research.
Most recent 2 months of data are preliminary.* denotes significance
January 2009–August 2019Seasonally adjusted, in thousands
Utilities
Summary Mining & Logging
Construction Manufacturing Trade:
Wholesale
Retail
Transp., Warehousing
& Utilities
Information Financial Activities
Professional & Business
Services
Private
Education & Health
Services
Leisure & Hospitality
Other Services
Government
CES Highlights
Release Date: September 6, 2019
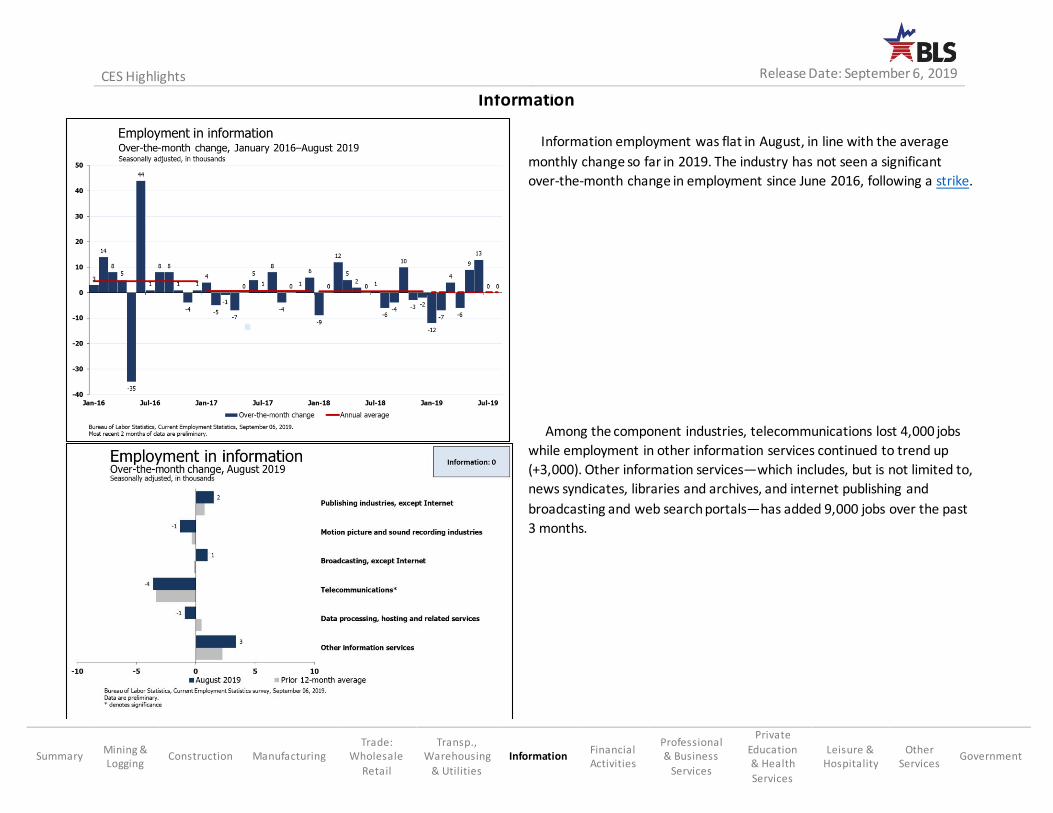
Information employment was flat in August, in line with the average
monthly change so far in 2019. The industry has not seen a significant
over-the-month change in employment since June 2016, following a strike.
Among the component industries, telecommunications lost 4,000 jobs
while employment in other information services continued to trend up
(+3,000). Other information services—which includes, but is not limited to,
news syndicates, libraries and archives, and internet publishing and
broadcasting and web search portals—has added 9,000 jobs over the past
3 months.
Information
CES Highlights
Release Date: September 6, 2019
Summary Mining & Logging
Construction Manufacturing Trade:
Wholesale
Retail
Transp., Warehousing
& Utilities
Information Financial Activities
Professional & Business
Services
Private
Education & Health
Services
Leisure & Hospitality
Other Services
Government
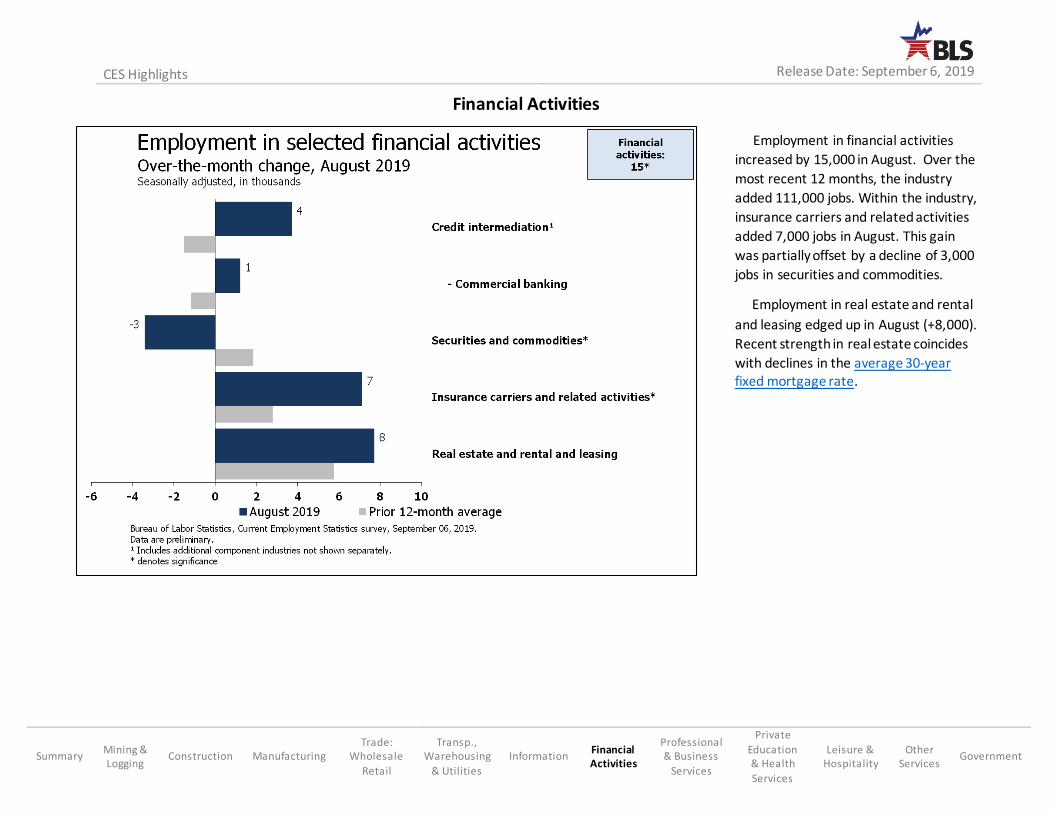
Employment in financial activities
increased by 15,000 in August. Over the
most recent 12 months, the industry
added 111,000 jobs. Within the industry,
insurance carriers and related activities
added 7,000 jobs in August. This gain
was partially offset by a decline of 3,000
jobs in securities and commodities.
Employment in real estate and rental
and leasing edged up in August (+8,000).
Recent strength in real estate coincides
with declines in the average 30-year fixed mortgage rate.
Financial Activities
Summary Mining & Logging
Construction Manufacturing Trade:
Wholesale
Retail
Transp., Warehousing
& Utilities
Information Financial Activities
Professional & Business
Services
Private
Education & Health
Services
Leisure & Hospitality
Other Services
Government
CES Highlights
Release Date: September 6, 2019
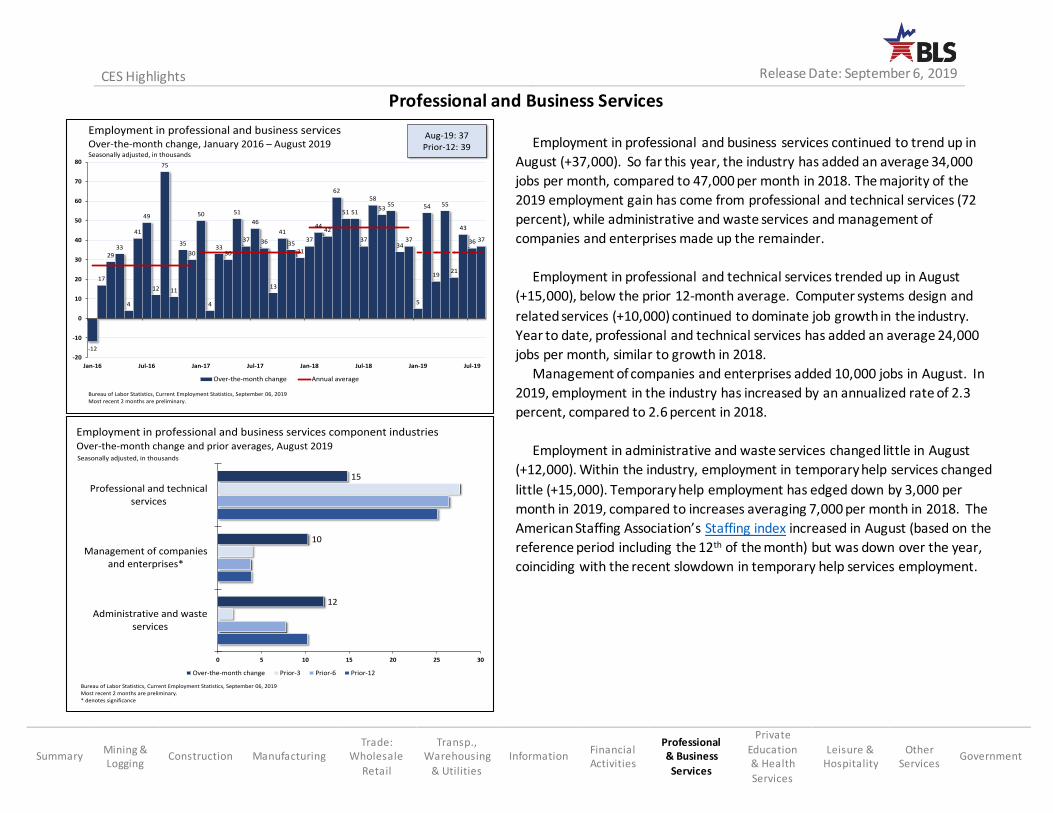
Employment in professional and business services continued to trend up in
August (+37,000). So far this year, the industry has added an average 34,000
jobs per month, compared to 47,000 per month in 2018. The majority of the
2019 employment gain has come from professional and technical services (72
percent), while administrative and waste services and management of
companies and enterprises made up the remainder.
Employment in professional and technical services trended up in August
(+15,000), below the prior 12-month average. Computer systems design and
related services (+10,000) continued to dominate job growth in the industry.
Year to date, professional and technical services has added an average 24,000
jobs per month, similar to growth in 2018.
Management of companies and enterprises added 10,000 jobs in August. In
2019, employment in the industry has increased by an annualized rate of 2.3
percent, compared to 2.6 percent in 2018.
Employment in administrative and waste services changed little in August
(+12,000). Within the industry, employment in temporary help services changed
little (+15,000). Temporary help employment has edged down by 3,000 per
month in 2019, compared to increases averaging 7,000 per month in 2018. The
American Staffing Association’s Staffing index increased in August (based on the
reference period including the 12th of the month) but was down over the year,
coinciding with the recent slowdown in temporary help services employment.
-12
17
2933
4
41
49
12
75
11
35
30
50
4
3330
51
37
46
36
13
41
3531
37
4442
62
51 51
37
58
5355
3437
5
54
19
55
21
43
36 37
-20
-10
0
10
20
30
40
50
60
70
80
Jan-16 Jul-16 Jan-17 Jul-17 Jan-18 Jul-18 Jan-19 Jul-19
Over-the-month change Annual average
Over-the-month change, January 2016 ̶ August 2019Seasonally adjusted, in thousands
Employment in professional and business services
Bureau of Labor Statistics, Current Employment Statistics, September 06, 2019Most recent 2 months are preliminary.
Aug-19: 37Prior-12: 39
12
10
15
0 5 10 15 20 25 30
Administrative and wasteservices
Management of companiesand enterprises*
Professional and technicalservices
Over-the-month change Prior-3 Prior-6 Prior-12
Employment in professional and business services component industriesOver-the-month change and prior averages, August 2019Seasonally adjusted, in thousands
Bureau of Labor Statistics, Current Employment Statistics, September 06, 2019Most recent 2 months are preliminary.* denotes significance
CES Highlights
Release Date: September 6, 2019
Summary Mining & Logging
Construction Manufacturing Trade:
Wholesale
Retail
Transp., Warehousing
& Utilities
Information Financial Activities
Professional & Business
Services
Private
Education & Health
Services
Leisure & Hospitality
Other Services
Government
Professional and Business Services
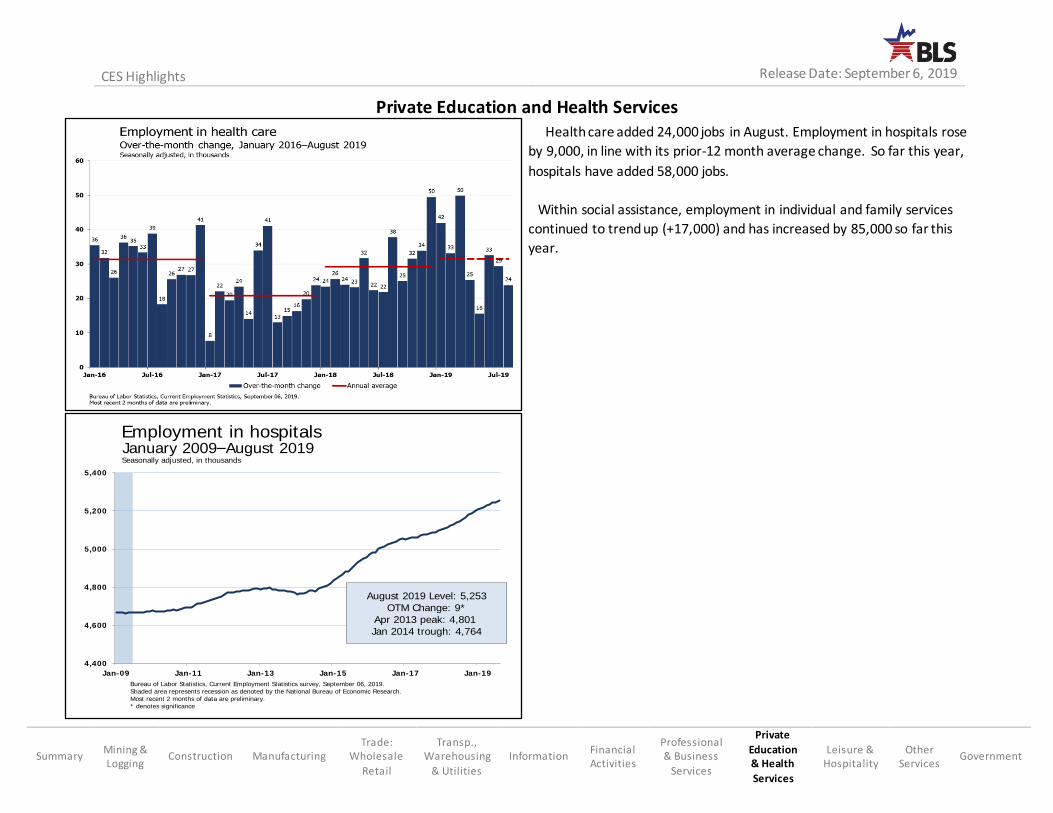
Health care added 24,000 jobs in August. Employment in hospitals rose
by 9,000, in line with its prior-12 month average change. So far this year,
hospitals have added 58,000 jobs.
Within social assistance, employment in individual and family services
continued to trend up (+17,000) and has increased by 85,000 so far this
year.
4,400
4,600
4,800
5,000
5,200
5,400
Jan-09 Jan-11 Jan-13 Jan-15 Jan-17 Jan-19
Employment in hospitals
August 2019 Level: 5,253OTM Change: 9*
Apr 2013 peak: 4,801 Jan 2014 trough: 4,764
Bureau of Labor Statistics, Current Employment Statistics survey, September 06, 2019.
Shaded area represents recession as denoted by the National Bureau of Economic Research.
Most recent 2 months of data are preliminary.* denotes significance
January 2009–August 2019Seasonally adjusted, in thousands
Private Education and Health Services
CES Highlights
Release Date: September 6, 2019
Summary Mining & Logging
Construction Manufacturing Trade:
Wholesale
Retail
Transp., Warehousing
& Utilities
Information Financial Activities
Professional & Business
Services
Private
Education & Health
Services
Leisure & Hospitality
Other Services
Government
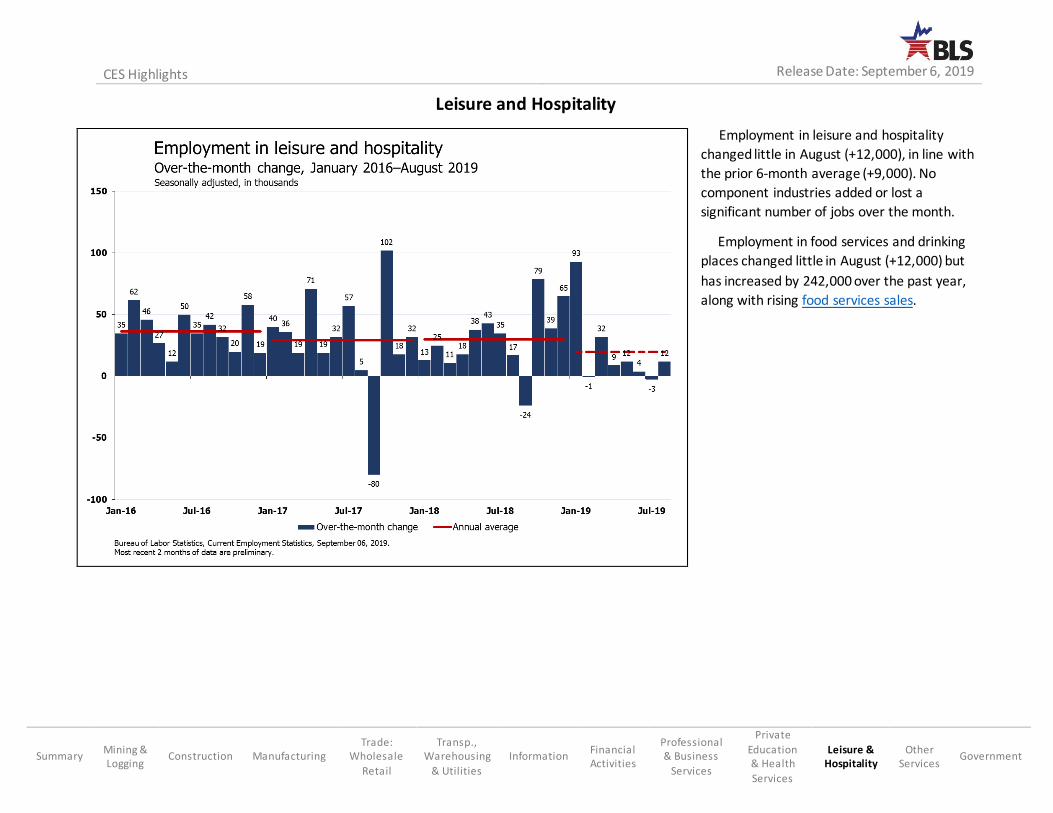
Employment in leisure and hospitality
changed little in August (+12,000), in line with
the prior 6-month average (+9,000). No
component industries added or lost a
significant number of jobs over the month.
Employment in food services and drinking
places changed little in August (+12,000) but
has increased by 242,000 over the past year,
along with rising food services sales.
Leisure and Hospitality
Summary Mining & Logging
Construction Manufacturing Trade:
Wholesale
Retail
Transp., Warehousing
& Utilities
Information Financial Activities
Professional & Business
Services
Private
Education & Health
Services
Leisure & Hospitality
Other Services
Government
CES Highlights
Release Date: September 6, 2019
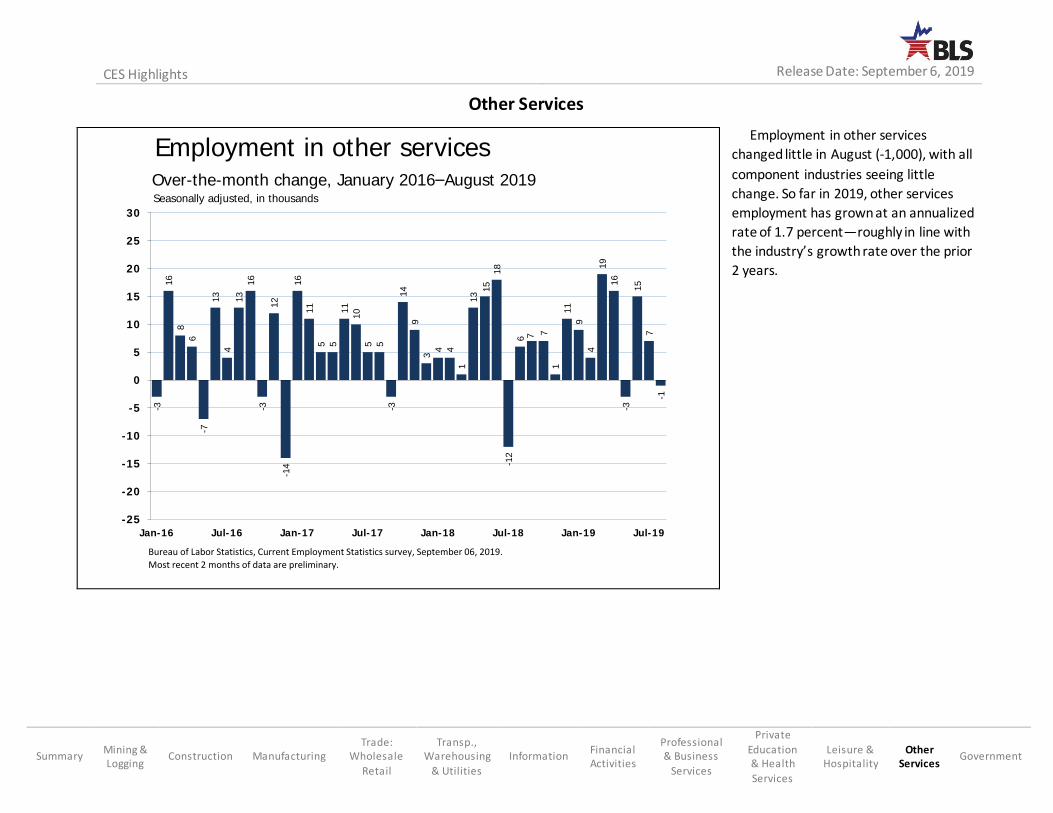
Employment in other services
changed little in August (-1,000), with all
component industries seeing little
change. So far in 2019, other services
employment has grown at an annualized
rate of 1.7 percent—roughly in line with
the industry’s growth rate over the prior
2 years.
-3
16
8
6
-7
13
4
13
16
-3
12
-14
16
11
5 5
11
10
5 5
-3
14
9
3
4 4
1
13
15
18
-12
6 7 7
1
11
9
4
19
16
-3
15
7
-1
-25
-20
-15
-10
-5
0
5
10
15
20
25
30
Jan-16 Jul-16 Jan-17 Jul-17 Jan-18 Jul-18 Jan-19 Jul-19
Employment in other servicesOver-the-month change, January 2016–August 2019Seasonally adjusted, in thousands
Bureau of Labor Statistics, Current Employment Statistics survey, September 06, 2019.
Most recent 2 months of data are preliminary.
Other Services
Summary Mining & Logging
Construction Manufacturing Trade:
Wholesale
Retail
Transp., Warehousing
& Utilities
Information Financial Activities
Professional & Business
Services
Private
Education & Health
Services
Leisure & Hospitality
Other Services
Government
CES Highlights
Release Date: September 6, 2019
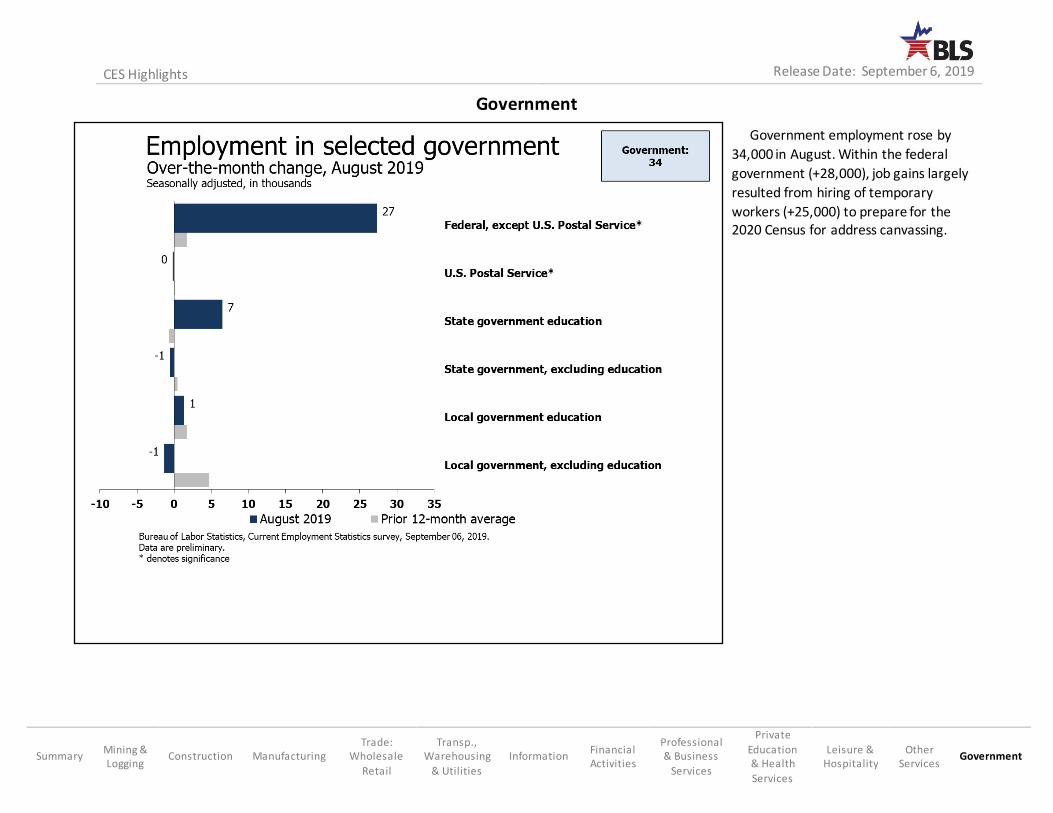
Government employment rose by
34,000 in August. Within the federal
government (+28,000), job gains largely
resulted from hiring of temporary
workers (+25,000) to prepare for the 2020 Census for address canvassing.
Government
Summary Mining & Logging
Construction Manufacturing Trade:
Wholesale
Retail
Transp., Warehousing
& Utilities
Information Financial Activities
Professional & Business
Services
Private
Education & Health
Services
Leisure & Hospitality
Other Services
Government
CES Highlights
Release Date: September 6, 2019
Prepared by Staff of the National Estimates Branch Current Employment Statistics Survey
U.S. Bureau of Labor Statistics 202-691-6555
Email CES
CES Analysts
Osman Alhassan
Hyun Choi
Steve Crestol
Tyler Downing
Katelynn Harris
Mike McCall
John Mullins
Michael Osifalujo
Edward Park
Carson Wilson
Current Employment Statistics Highlights
Detailed Industry Employment Analysis