Embed Size (px)
Citation preview
Current Revenue Sharing
Practices in Kenya: How Fair?
John Kinuthia
Research Analyst
20/09/2016
Equity: From Principles to Practice
• We have discussed 6 key principles of equity
• Most revenue sharing approaches globally
incorporate need
• Many incorporate at least some of the other 5
principles as well
• Let’s look at how well Kenya’s national and county
programs incorporate principles in practice
www.Internationalbudget.org/kenya 2
National Level
• National Constituency Development Fund
• Level 5 Hospitals
• Equalization Fund
County Level
• Equitable Development Act - Elgeyo-Marakwet
• Ward Development Funds in Baringo and Meru
www.Internationalbudget.org/kenya 3
National
www.Internationalbudget.org/kenya 4
National Government Constituency Development
Fund (CDF)
• CDF is 2.5% of the national government share of
revenue.
• 75% of the fund is distributed equally among the
constituencies and 25% is shared based on the
number of poor people as a share of the national total.
• CDF is mainly a capital fund but there are no direct
measures of infrastructure needs in the distribution
criteria.
www.Internationalbudget.org/kenya 5
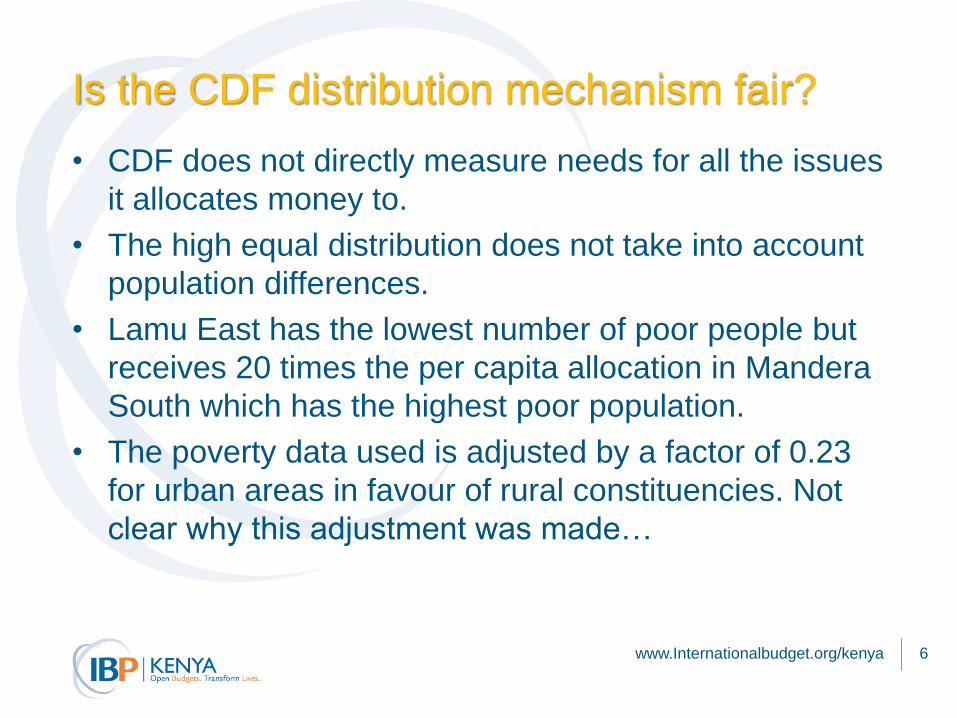
Is the CDF distribution mechanism fair?
• CDF does not directly measure needs for all the issues
it allocates money to.
• The high equal distribution does not take into account
population differences.
• Lamu East has the lowest number of poor people but
receives 20 times the per capita allocation in Mandera
South which has the highest poor population.
• The poverty data used is adjusted by a factor of 0.23
for urban areas in favour of rural constituencies. Not
clear why this adjustment was made…
www.Internationalbudget.org/kenya 6
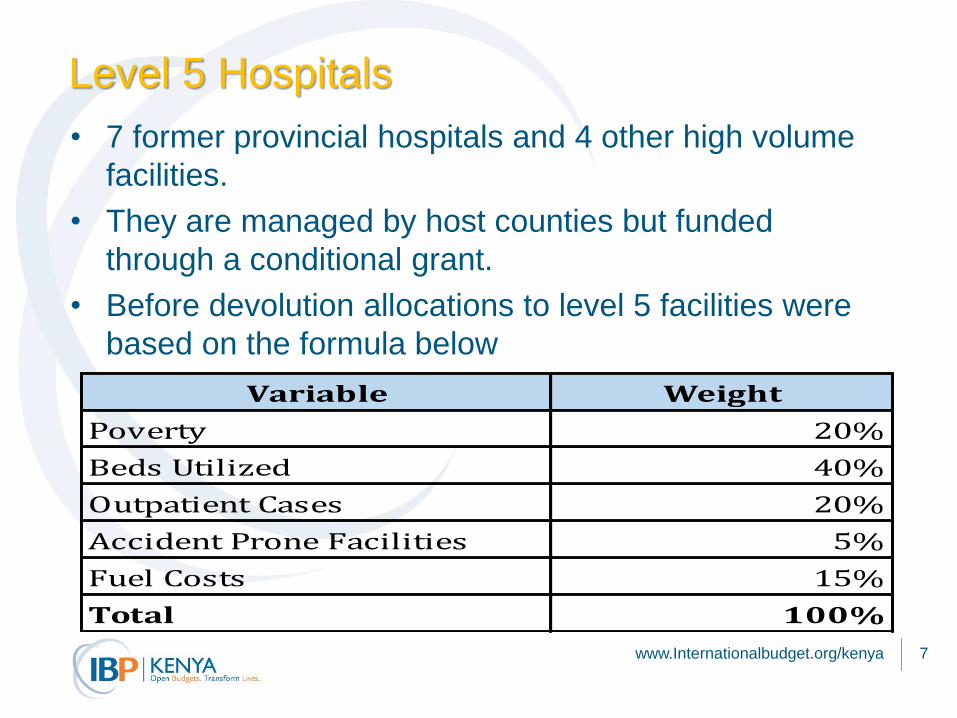
Level 5 Hospitals
• 7 former provincial hospitals and 4 other high volume
facilities.
• They are managed by host counties but funded
through a conditional grant.
• Before devolution allocations to level 5 facilities were
based on the formula below
www.Internationalbudget.org/kenya 7
Variable Weight
Poverty 20%
Beds Utilized 40%
Outpatient Cases 20%
Accident Prone Facilities 5%
Fuel Costs 15%
Total 100%
After devolution…
• In 2013/14 and 2014/15 the criteria used has been
unclear.
• In 2015/16 and 2016/17 the allocations were
based on the bed occupancy rates.
• The higher the rate, the more money a facility
receives.
www.Internationalbudget.org/kenya 8
Is the Level 5 grant distributed fairly?
• The bed occupancy rates ignore the actual number of
beds whose occupancy drives costs.
• For example Nakuru and Meru have the same
occupancy rates but Nakuru has almost twice the
number of beds than Meru.
• However both facilities received Ksh 356 million each
in 2016/17. Is this fair?
• In addition these facilities provide other services that
drive their costs beside inpatient services
www.Internationalbudget.org/kenya 9
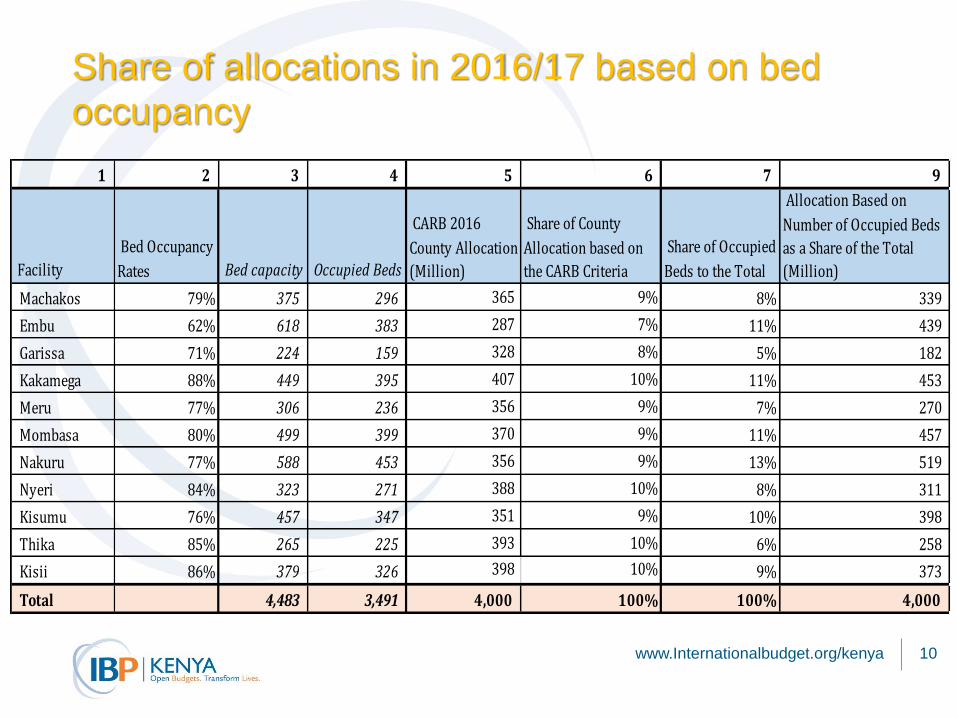
Share of allocations in 2016/17 based on bed
occupancy
www.Internationalbudget.org/kenya 10
1 2 3 4 5 6 7 9
Facility
Bed Occupancy
Rates Bed capacity Occupied Beds
CARB 2016
County Allocation
(Million)
Share of County
Allocation based on
the CARB Criteria
Share of Occupied
Beds to the Total
Allocation Based on
Number of Occupied Beds
as a Share of the Total
(Million)
Machakos 79% 375 296 365 9% 8% 339
Embu 62% 618 383 287 7% 11% 439
Garissa 71% 224 159 328 8% 5% 182
Kakamega 88% 449 395 407 10% 11% 453
Meru 77% 306 236 356 9% 7% 270
Mombasa 80% 499 399 370 9% 11% 457
Nakuru 77% 588 453 356 9% 13% 519
Nyeri 84% 323 271 388 10% 8% 311
Kisumu 76% 457 347 351 9% 10% 398
Thika 85% 265 225 393 10% 6% 258
Kisii 86% 379 326 398 10% 9% 373
Total 4,483 3,491 4,000 100% 100% 4,000
Equalization Fund
• EF established by constitution to target “marginalized”
areas: access to health facilities, water, roads and
electricity lags behind other areas
• CRA marginalization policy identifies 14 counties to
receive funds based on assessment of development
and historical marginalization.
• Half of the fund is shared equally and the other half is
shared based on a formula based criteria.
www.Internationalbudget.org/kenya 11
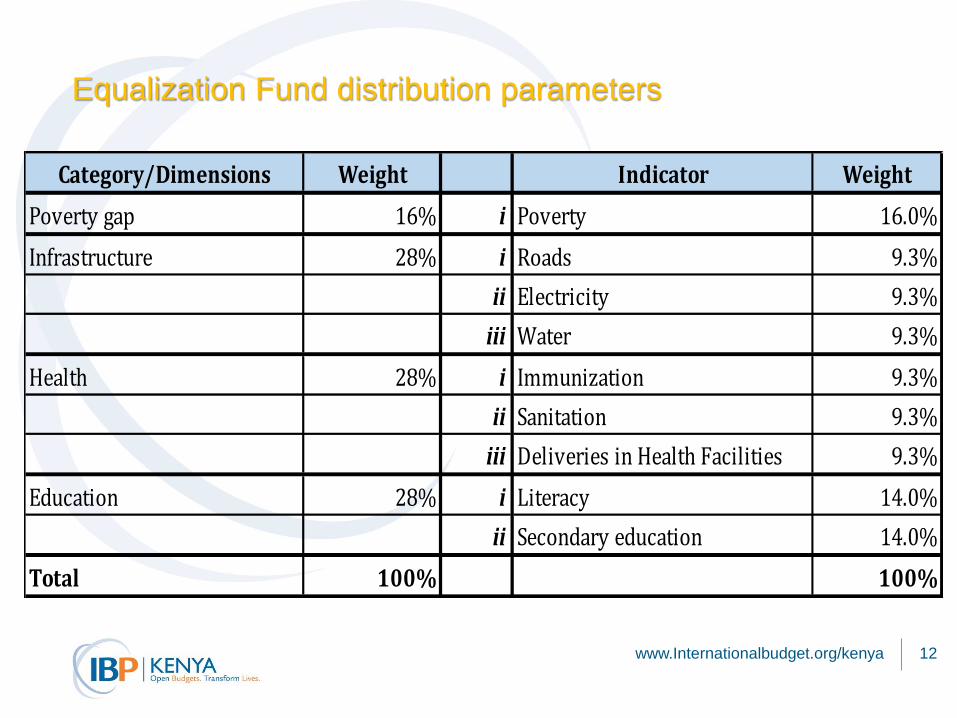
Equalization Fund distribution parameters
www.Internationalbudget.org/kenya 12
Category/Dimensions Weight Indicator Weight
Poverty gap 16% i Poverty 16.0%
Infrastructure 28% i Roads 9.3%
ii Electricity 9.3%
iii Water 9.3%
Health 28% i Immunization 9.3%
ii Sanitation 9.3%
iii Deliveries in Health Facilities 9.3%
Education 28% i Literacy 14.0%
ii Secondary education 14.0%
Total 100% 100%
Is the distribution of the Equalization Fund fair?
• The marginalization policy includes parameters that
are not in the constitution: education and poverty.
• The CRA policy does not explain how these weights
were arrived at. For example, health and education are
given the same weight of 28 percent. Why?
• Why are certain variables used for the parameters and
not others?
• For example, immunization is part of the health
parameter but child nutrition is not.
www.Internationalbudget.org/kenya 13
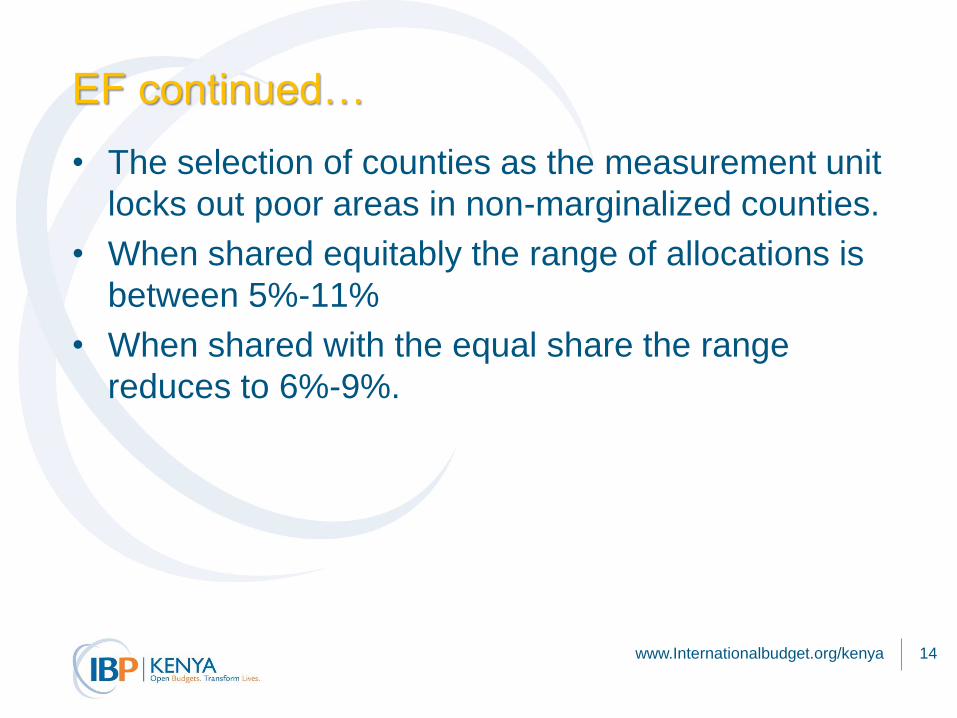
EF continued…
• The selection of counties as the measurement unit
locks out poor areas in non-marginalized counties.
• When shared equitably the range of allocations is
between 5%-11%
• When shared with the equal share the range
reduces to 6%-9%.
www.Internationalbudget.org/kenya 14
Counties
www.Internationalbudget.org/kenya 15
County approaches to revenue distribution
Two common approaches to distribution by counties:
• First, mimic the CRA formula in some form
• Second, adapt the CDF criteria in some form
• Many counties are not fully implementing these laws
but they give an idea of thinking about equity
www.Internationalbudget.org/kenya 16
Quick review: CRA and CDF
• The first CRA formula had five parameters that
determined the horizontal allocation of revenue
among counties.
• The parameters are population, poverty, basic
equal share, land area and fiscal responsibility.
• CDF approach has a big proportion of the fund
shared equally (75%) and remainder shared
based on poverty numbers in each constituency.
www.Internationalbudget.org/kenya 17
EDA in Elgeyo-Marakwet
• The Equitable Development Act guides distribution of
the full development budget among EMC wards.
• 60% of development budget in each department is
shared equally and 40% is shared based on a formula
borrowed from CRA’s 2012 criteria.
• However, the EDA appears to be more re-distributive
compared to the CRA formula. More weight on poverty
and less on population
www.Internationalbudget.org/kenya 18
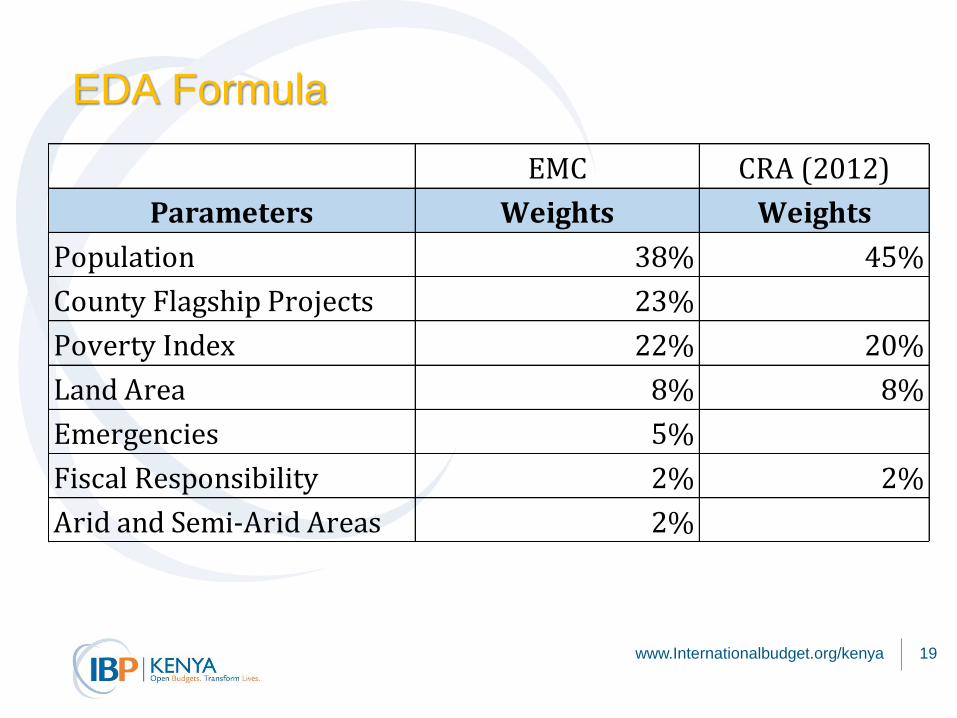
EDA Formula
www.Internationalbudget.org/kenya 19
EMC CRA (2012)
Parameters Weights Weights
Population 38% 45%
County Flagship Projects 23%
Poverty Index 22% 20%
Land Area 8% 8%
Emergencies 5%
Fiscal Responsibility 2% 2%
Arid and Semi-Arid Areas 2%
Is the EDA Fair?
• The formula does not directly address the needs and
the high equal share assumes the development needs
in wards are almost similar.
• Example: the share of people without access to water
ranges from 2%-9%,while the allocations to wards in
that department is between 2%-6%.
www.Internationalbudget.org/kenya 20
Is the EDA fair? (continued)
• The county distributes the whole development budget
through the EDA: leaves very little funding for county-
wide projects.
• It does seem the county changed the formula
(informally) to allocate more resources to county flagship
projects.
• The adjustments made in the formula are not clear and
the county has not published these changes
(undermines fair process)
www.Internationalbudget.org/kenya 21
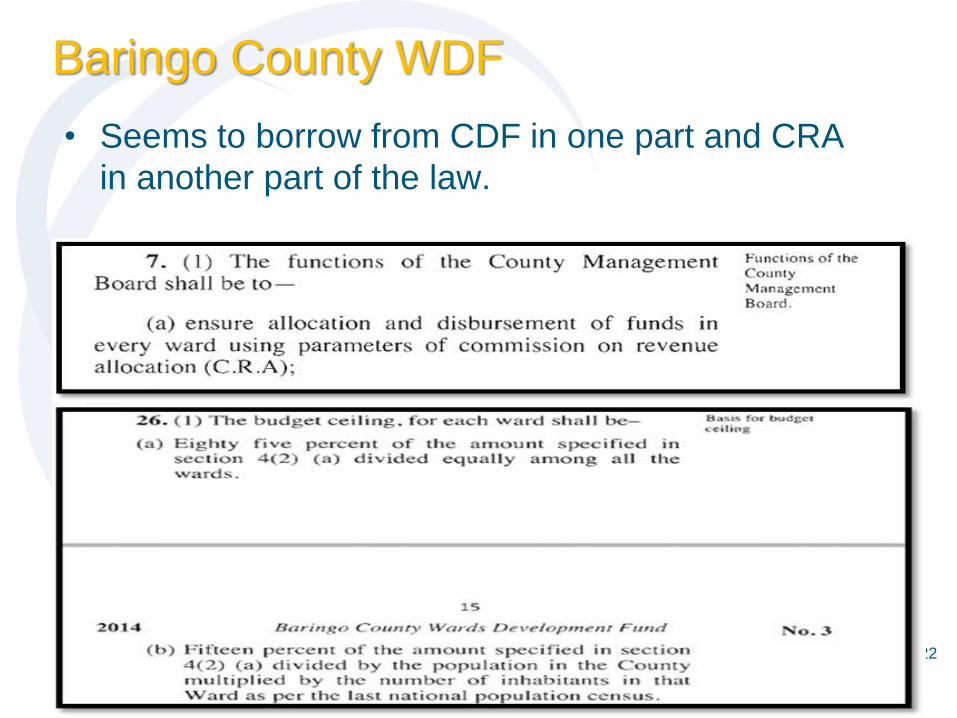
Baringo County WDF
• Seems to borrow from CDF in one part and CRA
in another part of the law.
www.Internationalbudget.org/kenya 22
Baringo Approach to Ward Distribution
• The act requires 10% of the development budget be
distributed to wards.
• Baringo’s modified CDF approach requires 85% of the
fund be distributed equally and 15% based on ward
population. Does not measure poverty (unlike CDF).
www.Internationalbudget.org/kenya 23
Is the Baringo approach fair?
• The CDF approach has a very high equal share (75%)
but Baringo’s is higher at 85%.
• Population might give an idea of pressure on
infrastructure but does not give a true picture of current
deficits in the wards.
• A smaller portion is allocated to the wards compared to
EMC but the distribution is highly equal.
• For example, share of people without access to
improved water ranges between 1%-6%
• Fund allocations per ward range between 3%-4%
www.Internationalbudget.org/kenya 24
Meru County WDF
• The sets aside at least 22.5% of “ordinary revenue” to
a Ward Development Fund.
• 85% of the fund is to be shared equally and the
remaining 15% shared based on population size,
poverty levels, and infrastructure differences among
the wards.
www.Internationalbudget.org/kenya 25
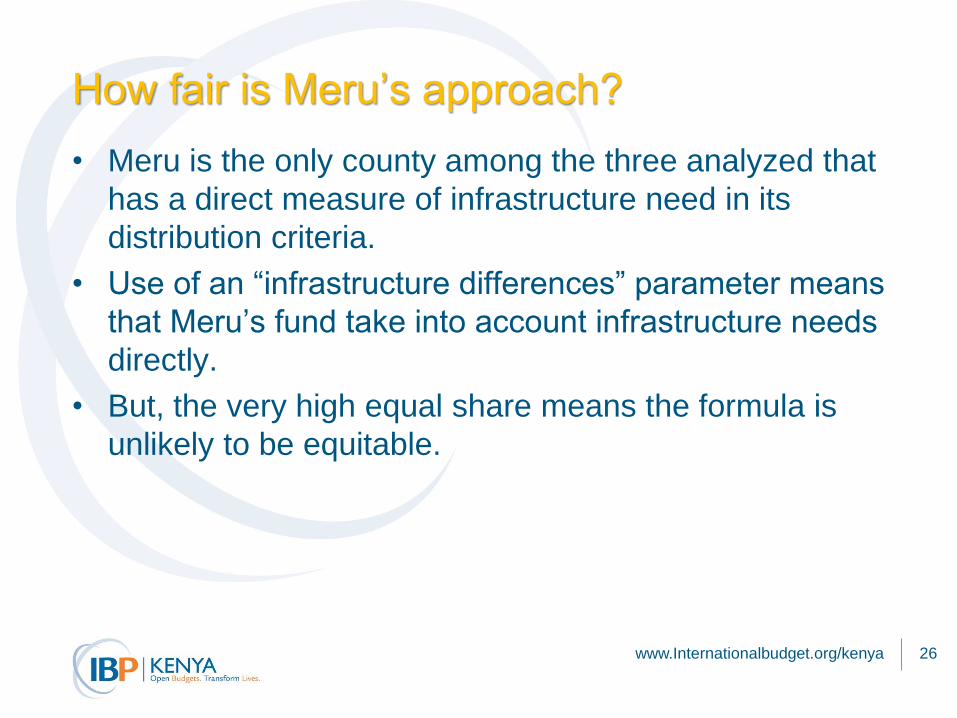
How fair is Meru’s approach?
• Meru is the only county among the three analyzed that
has a direct measure of infrastructure need in its
distribution criteria.
• Use of an “infrastructure differences” parameter means
that Meru’s fund take into account infrastructure needs
directly.
• But, the very high equal share means the formula is
unlikely to be equitable.
www.Internationalbudget.org/kenya 26
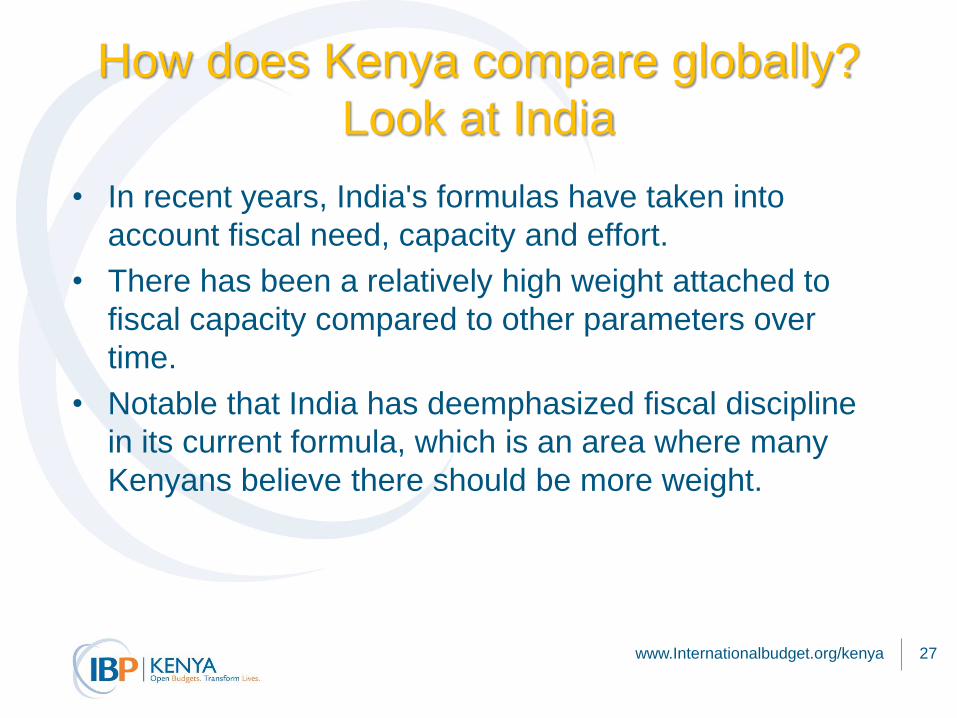
How does Kenya compare globally?
Look at India
• In recent years, India's formulas have taken into
account fiscal need, capacity and effort.
• There has been a relatively high weight attached to
fiscal capacity compared to other parameters over
time.
• Notable that India has deemphasized fiscal discipline
in its current formula, which is an area where many
Kenyans believe there should be more weight.
www.Internationalbudget.org/kenya 27
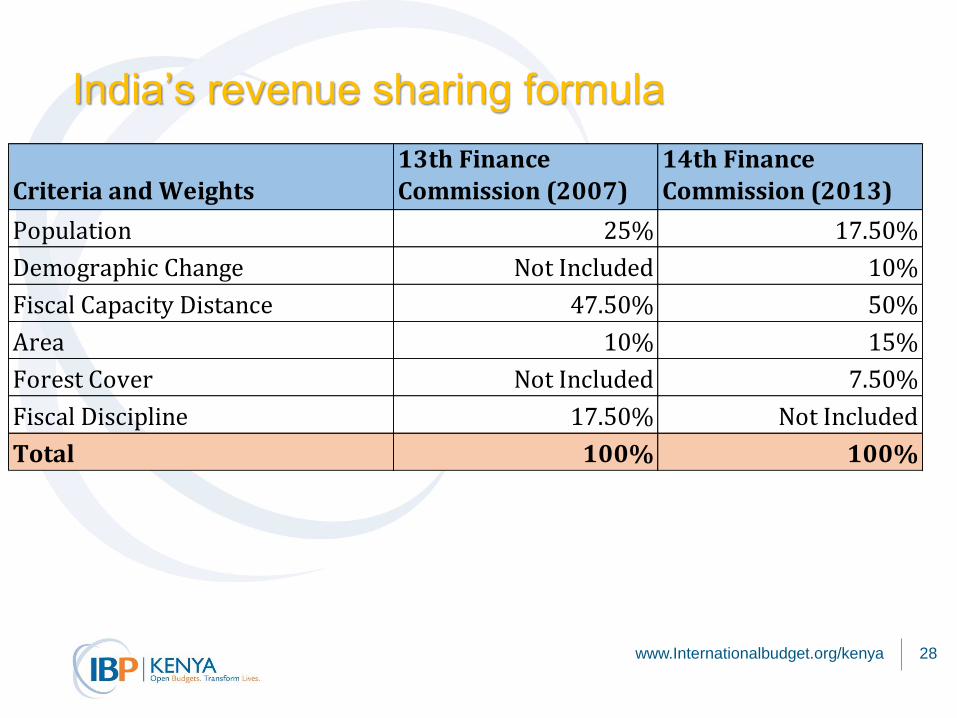
India’s revenue sharing formula
www.Internationalbudget.org/kenya 28
Criteria and Weights13th Finance Commission (2007)
14th Finance Commission (2013)
Population 25% 17.50%
Demographic Change Not Included 10%
Fiscal Capacity Distance 47.50% 50%
Area 10% 15%
Forest Cover Not Included 7.50%
Fiscal Discipline 17.50% Not Included
Total 100% 100%
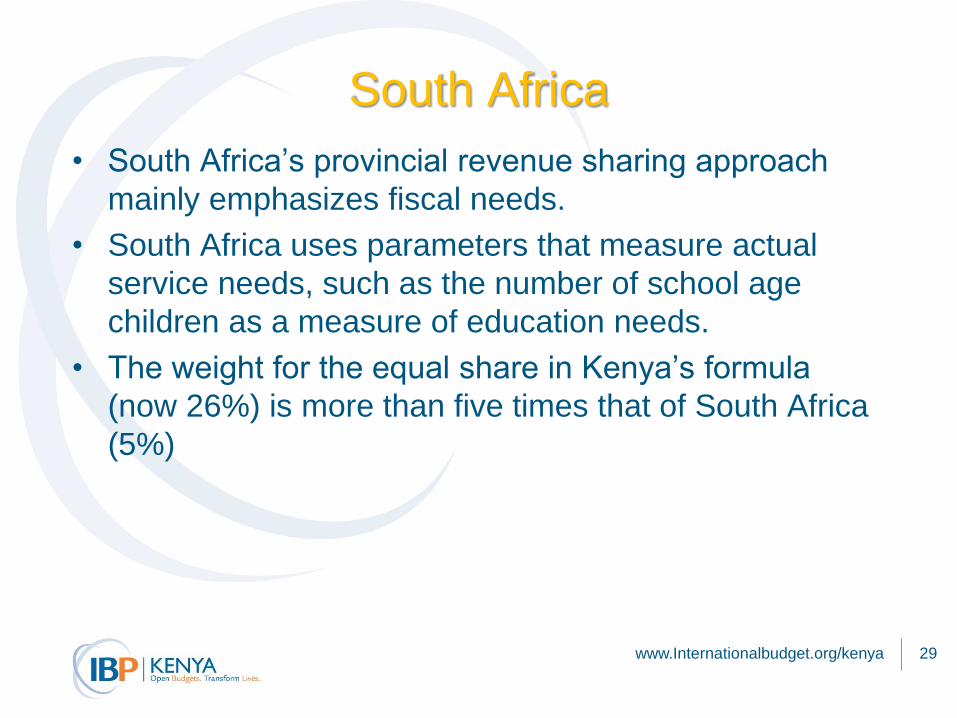
South Africa
• South Africa’s provincial revenue sharing approach
mainly emphasizes fiscal needs.
• South Africa uses parameters that measure actual
service needs, such as the number of school age
children as a measure of education needs.
• The weight for the equal share in Kenya’s formula
(now 26%) is more than five times that of South Africa
(5%)
www.Internationalbudget.org/kenya 29
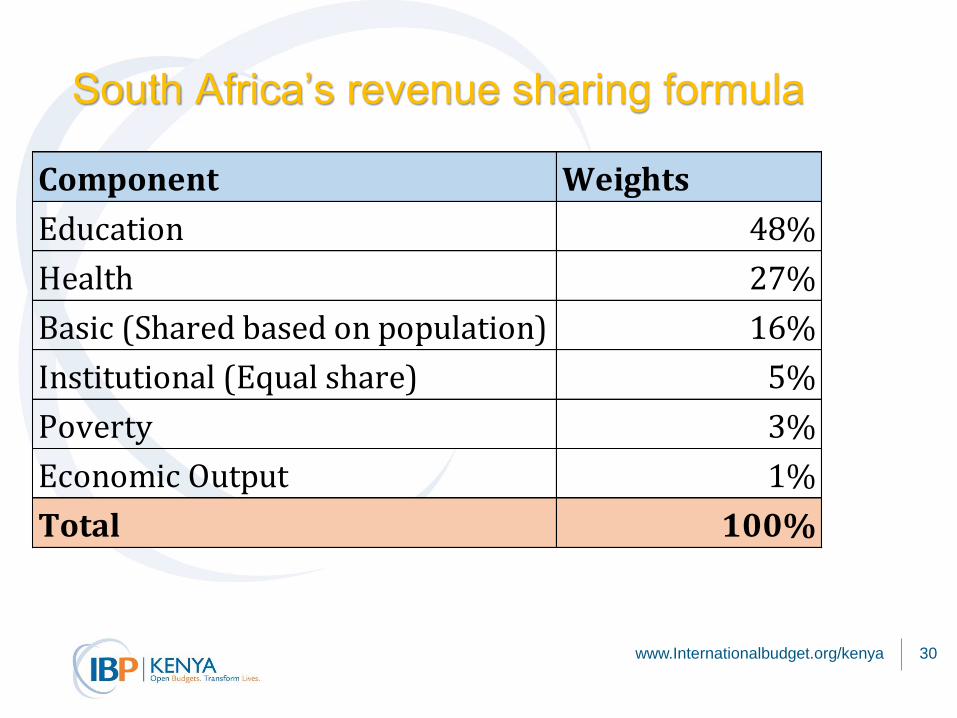
South Africa’s revenue sharing formula
www.Internationalbudget.org/kenya 30
Component Weights
Education 48%
Health 27%
Basic (Shared based on population) 16%
Institutional (Equal share) 5%
Poverty 3%
Economic Output 1%
Total 100%
Conclusions
• Fiscal need is the main driver of resource distribution
in Kenya, but not always well-measured.
• Many programs use different approaches to measuring
poverty and marginalization, not all of which are
consistent or fair.
• Kenya tends to put inordinate weight on equality over
equity.
• Equality stands out when compared to the low weight
given to equal shares in South Africa and India.
• Little attention has been given to fiscal capacity or
fiscal effort in Kenya, though these are given
considerable weight in other countries like India
www.Internationalbudget.org/kenya 31
At County Level…
• Counties are making attempts to share revenue
among their wards and are borrowing from CDF and
the CRA formula.
• This approach has meant some measure of need is
applied by the formulas
• However, equality seems to outweigh equity in all the
counties.
• Projects funded in each ward are determined exclusive
of the main budget process and this parallel process
might create challenges (as it has with CDF)
www.Internationalbudget.org/kenya 32