Embed Size (px)
Citation preview
1
Customized JMP Analytics: Kraft Foods’ Consumer Test
Evaluation Package
David Rose, SAS Professional Services
Jeff Stagg, Manager KFE Statistics
11th September 2012
JMP Discovery Summit 2012 SAS Headquarters, Cary, Illinois
2
Workflow for presentation
Order of ‘play’
• Case Study Overview
• KICS package introduction
• Case study analysis
• Benefits of KICS package
• Q&A
This presentation will demonstrate ‘live’ specific features of Kraft Foods’ Consumer Test Evaluation (KICS) package on a real case study The illustration of features and analysis workflow to be shown is captured in this presentation but may not follow exactly what is shown
3
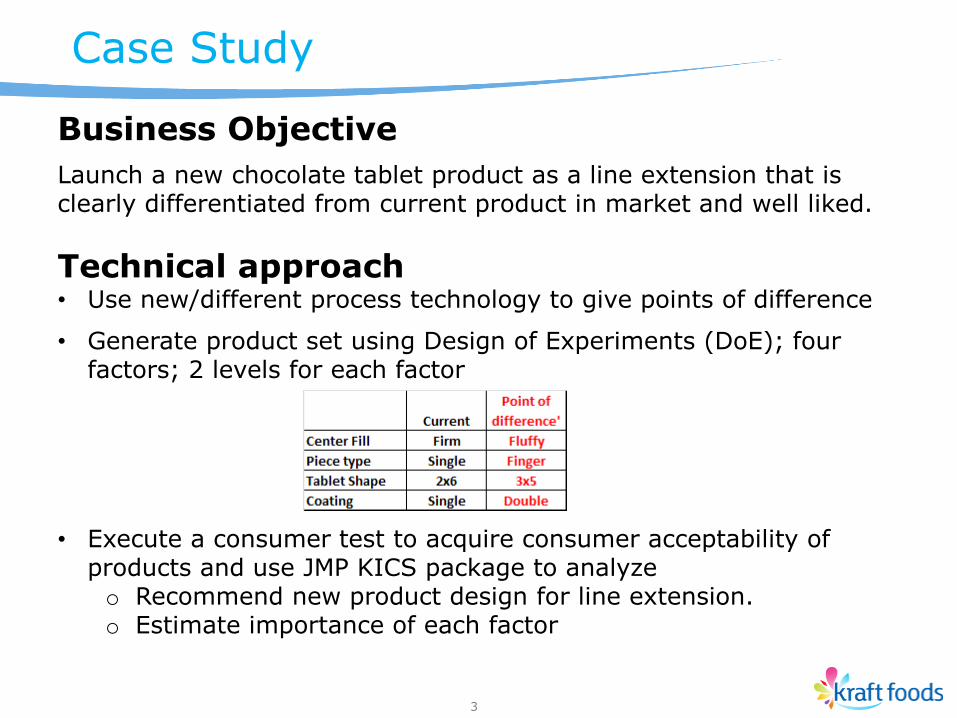
Case Study
Business Objective
Launch a new chocolate tablet product as a line extension that is clearly differentiated from current product in market and well liked.
Technical approach • Use new/different process technology to give points of difference
• Generate product set using Design of Experiments (DoE); four factors; 2 levels for each factor
• Execute a consumer test to acquire consumer acceptability of products and use JMP KICS package to analyze o Recommend new product design for line extension. o Estimate importance of each factor
4
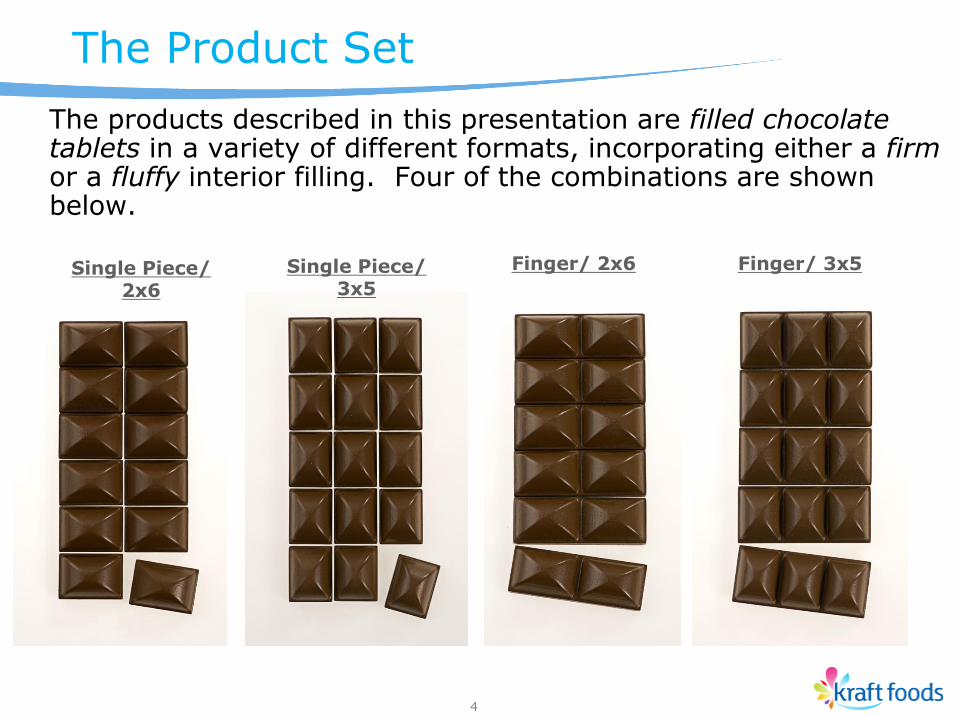
The products described in this presentation are filled chocolate tablets in a variety of different formats, incorporating either a firm or a fluffy interior filling. Four of the combinations are shown below.
Single Piece/ 2x6
Single Piece/ 3x5
Finger/ 2x6 Finger/ 3x5
The Product Set
5
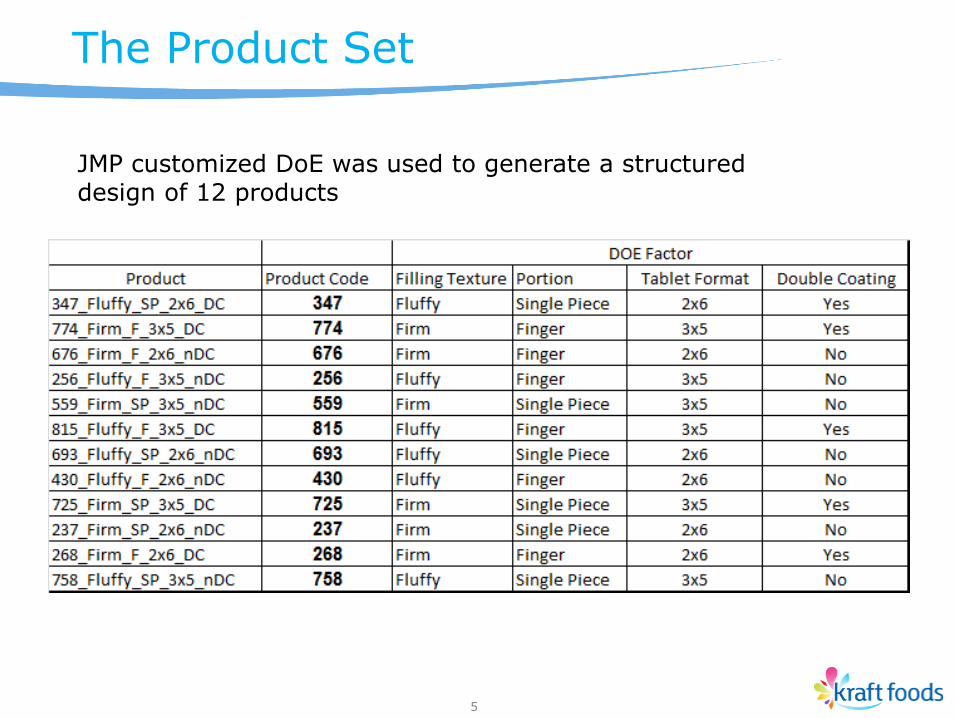
The Product Set
JMP customized DoE was used to generate a structured design of 12 products
6
Case Study Design
Consumer Test Design
• Central location test (CLT)
• 153 consumers
• 12 products (DoE)
• Each consumer evaluates all the products
• 2 sessions, 6 products per session
• Overall & attribute liking questions (scale 1-9)
• Just about right (JAR) attribute ratings
• Managed by external market research agency
7
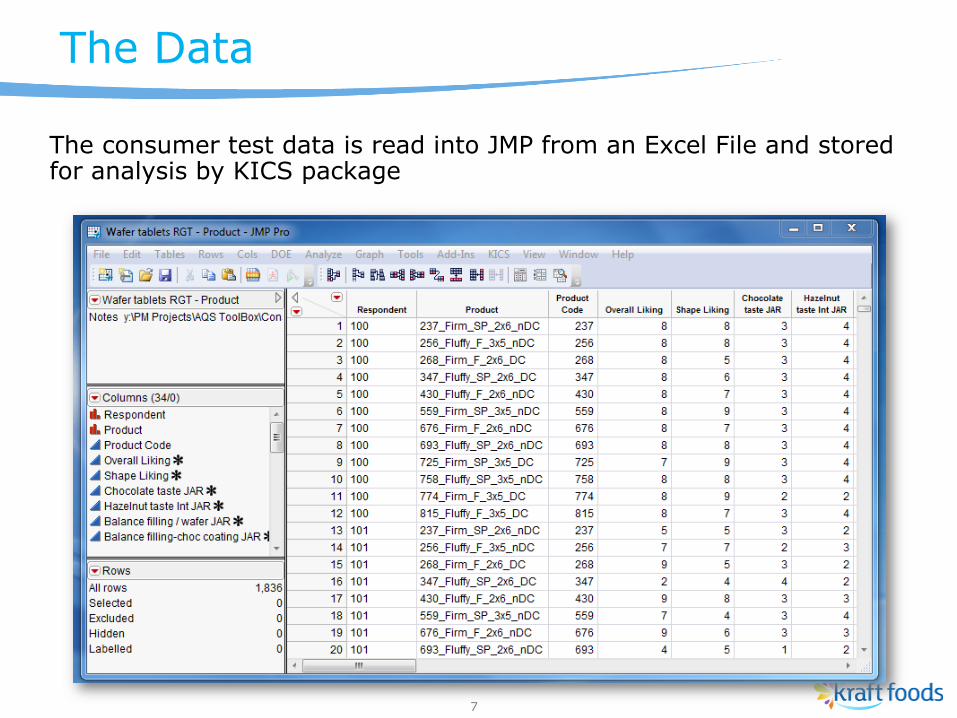
The consumer test data is read into JMP from an Excel File and stored for analysis by KICS package
The Data
8
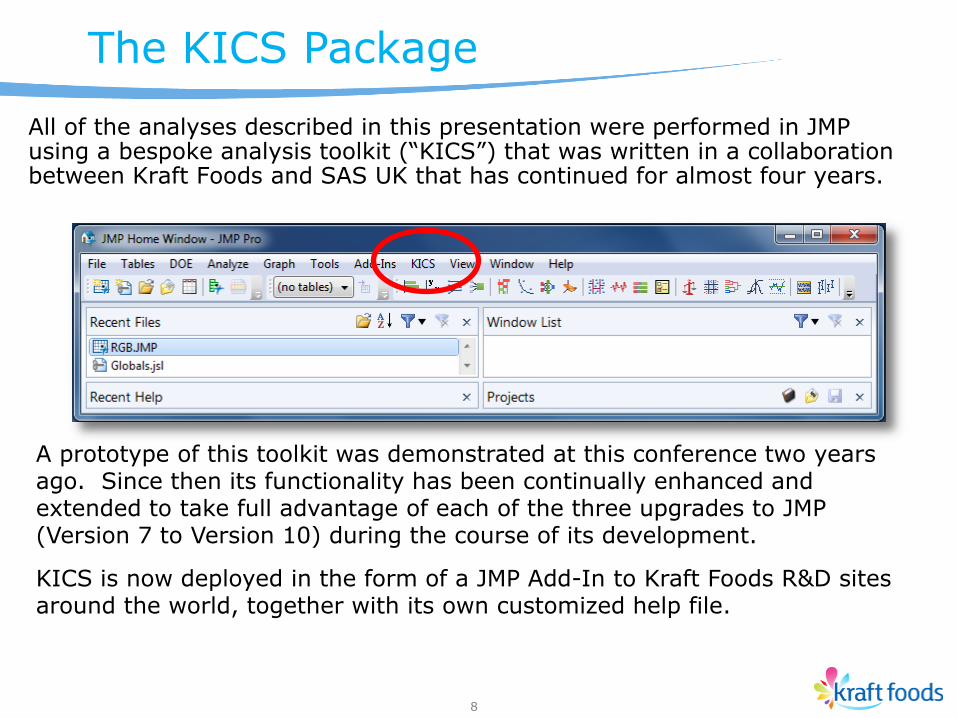
All of the analyses described in this presentation were performed in JMP using a bespoke analysis toolkit (“KICS”) that was written in a collaboration between Kraft Foods and SAS UK that has continued for almost four years.
A prototype of this toolkit was demonstrated at this conference two years ago. Since then its functionality has been continually enhanced and extended to take full advantage of each of the three upgrades to JMP (Version 7 to Version 10) during the course of its development.
KICS is now deployed in the form of a JMP Add-In to Kraft Foods R&D sites around the world, together with its own customized help file.
The KICS Package
9
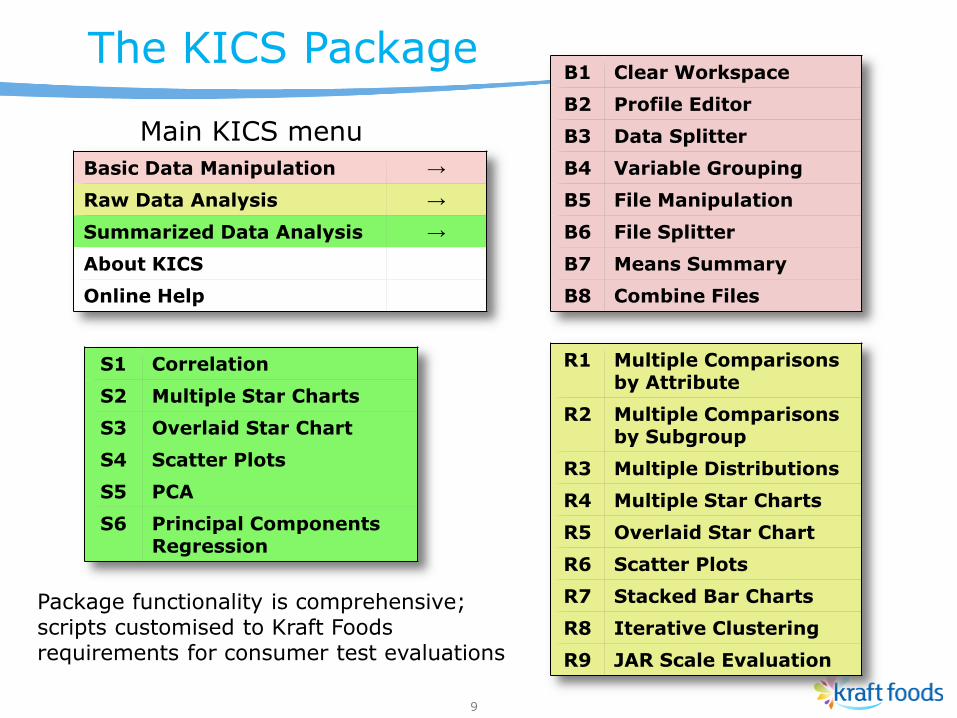
Basic Data Manipulation →
Raw Data Analysis →
Summarized Data Analysis →
About KICS
Online Help
B1 Clear Workspace
B2 Profile Editor
B3 Data Splitter
B4 Variable Grouping
B5 File Manipulation
B6 File Splitter
B7 Means Summary
B8 Combine Files
The KICS Package
R1 Multiple Comparisons by Attribute
R2 Multiple Comparisons by Subgroup
R3 Multiple Distributions
R4 Multiple Star Charts
R5 Overlaid Star Chart
R6 Scatter Plots
R7 Stacked Bar Charts
R8 Iterative Clustering
R9 JAR Scale Evaluation
S1 Correlation
S2 Multiple Star Charts
S3 Overlaid Star Chart
S4 Scatter Plots
S5 PCA
S6 Principal Components Regression
Main KICS menu
Package functionality is comprehensive; scripts customised to Kraft Foods requirements for consumer test evaluations
The KICS Package
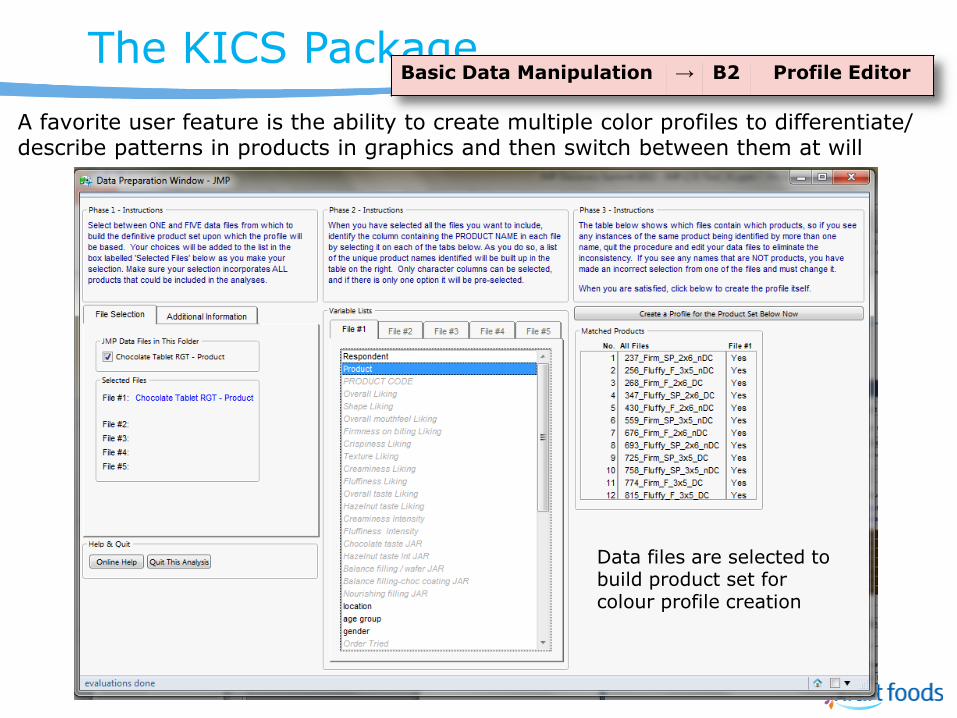
Data files are selected to build product set for colour profile creation
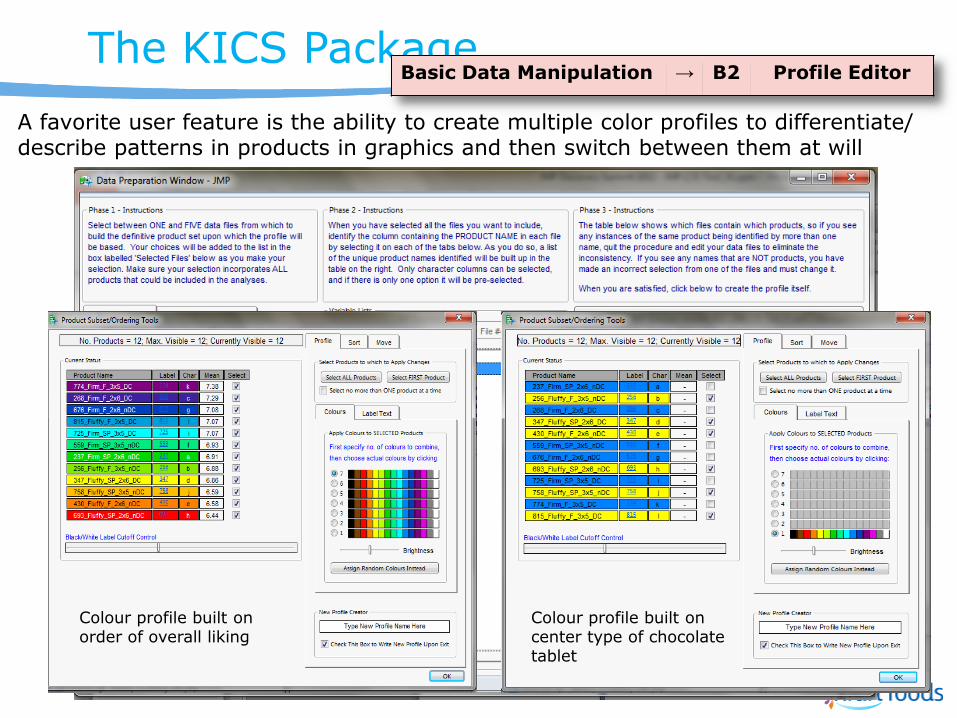
A favorite user feature is the ability to create multiple color profiles to differentiate/ describe patterns in products in graphics and then switch between them at will
Basic Data Manipulation → B2 Profile Editor
The KICS Package
Data files are selected to build product set for colour profile creation
A favorite user feature is the ability to create multiple color profiles to differentiate/ describe patterns in products in graphics and then switch between them at will
Basic Data Manipulation → B2 Profile Editor
Colour profile built on order of overall liking
Colour profile built on center type of chocolate tablet
The KICS Package
12
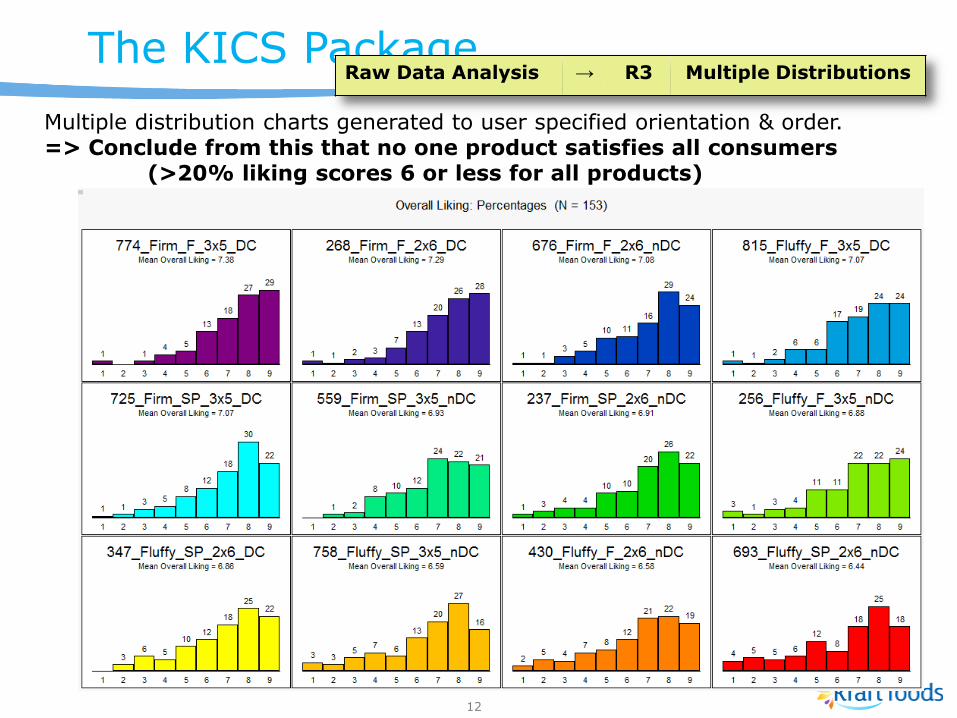
Raw Data Analysis → R3 Multiple Distributions
Multiple distribution charts generated to user specified orientation & order. => Conclude from this that no one product satisfies all consumers (>20% liking scores 6 or less for all products)
13
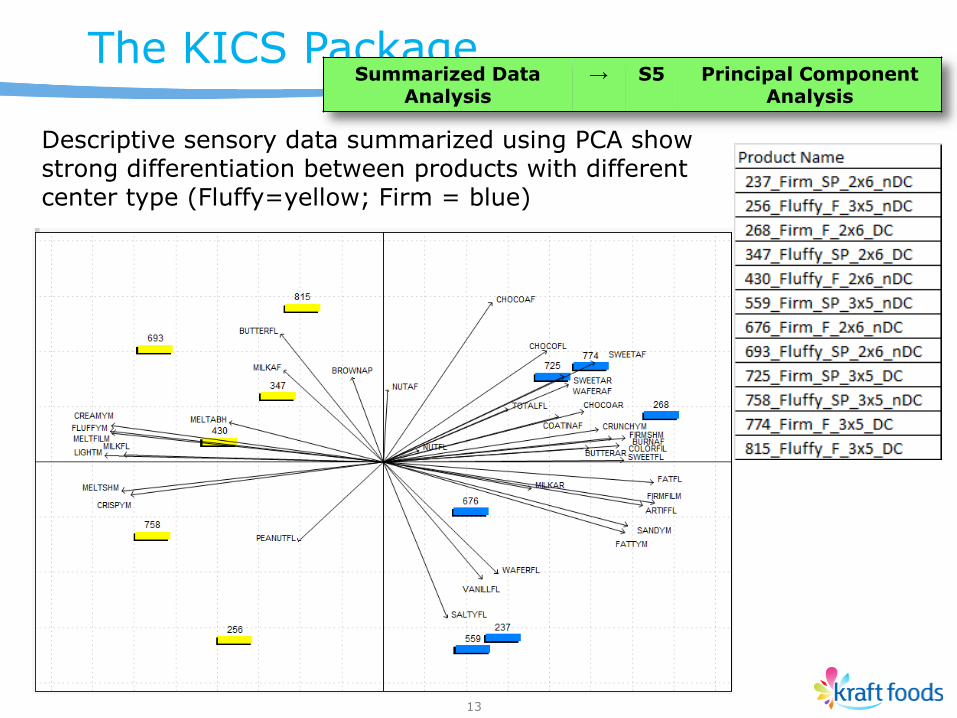
The KICS Package Summarized Data
Analysis → S5 Principal Component
Analysis
Descriptive sensory data summarized using PCA show strong differentiation between products with different center type (Fluffy=yellow; Firm = blue)
The KICS Package
14
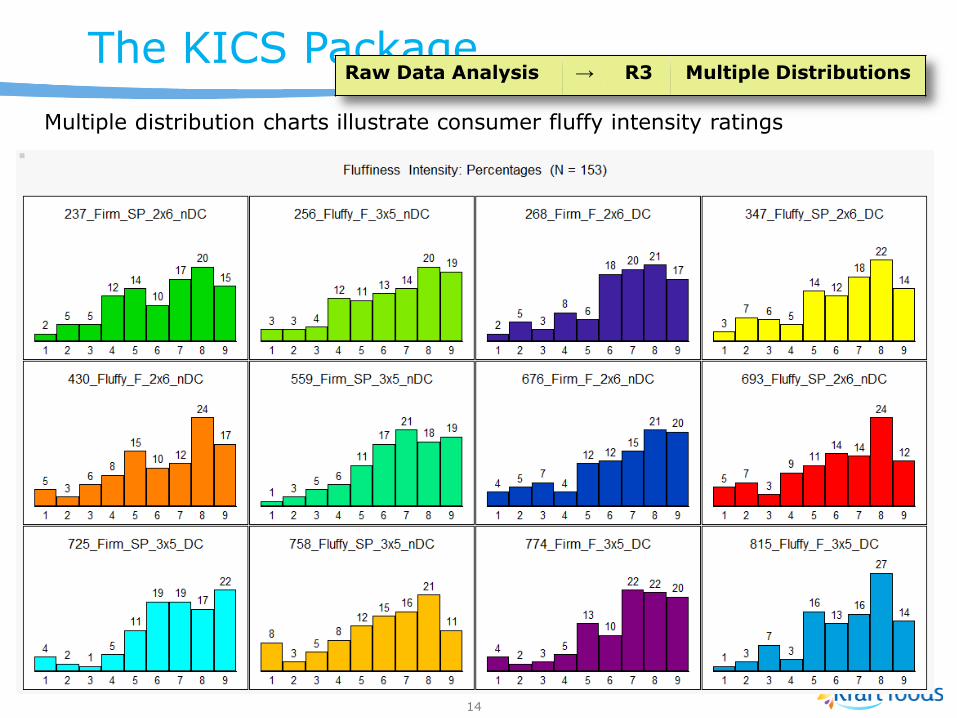
Raw Data Analysis → R3 Multiple Distributions
Multiple distribution charts illustrate consumer fluffy intensity ratings
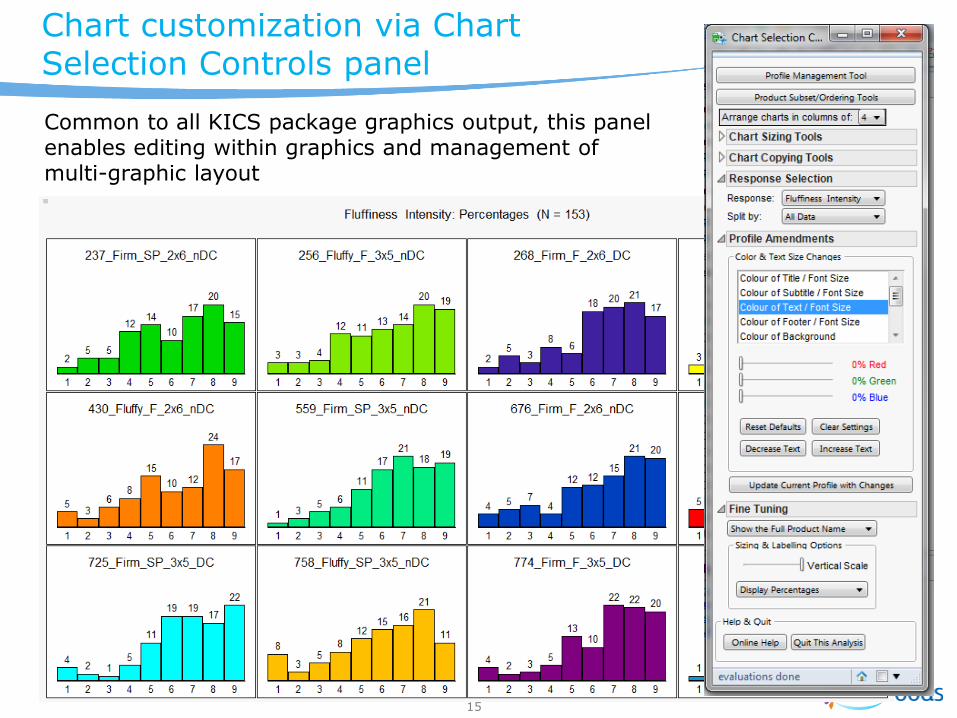
Chart customization via Chart Selection Controls panel
15
Common to all KICS package graphics output, this panel enables editing within graphics and management of multi-graphic layout
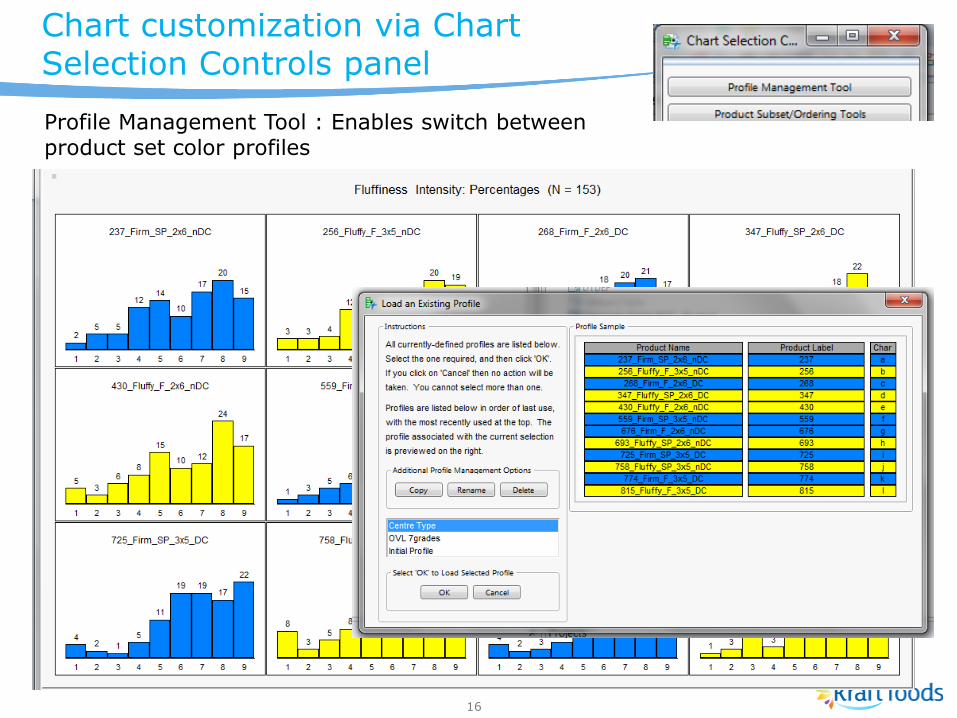
Chart customization via Chart Selection Controls panel
16
Profile Management Tool : Enables switch between product set color profiles
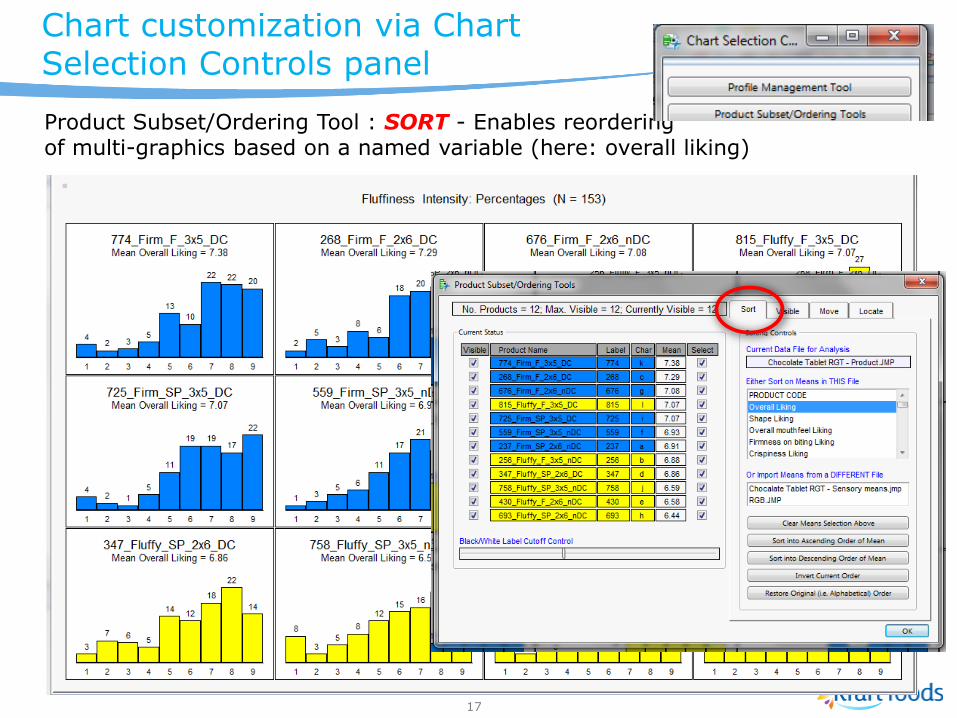
Chart customization via Chart Selection Controls panel
17
Product Subset/Ordering Tool : SORT - Enables reordering of multi-graphics based on a named variable (here: overall liking)
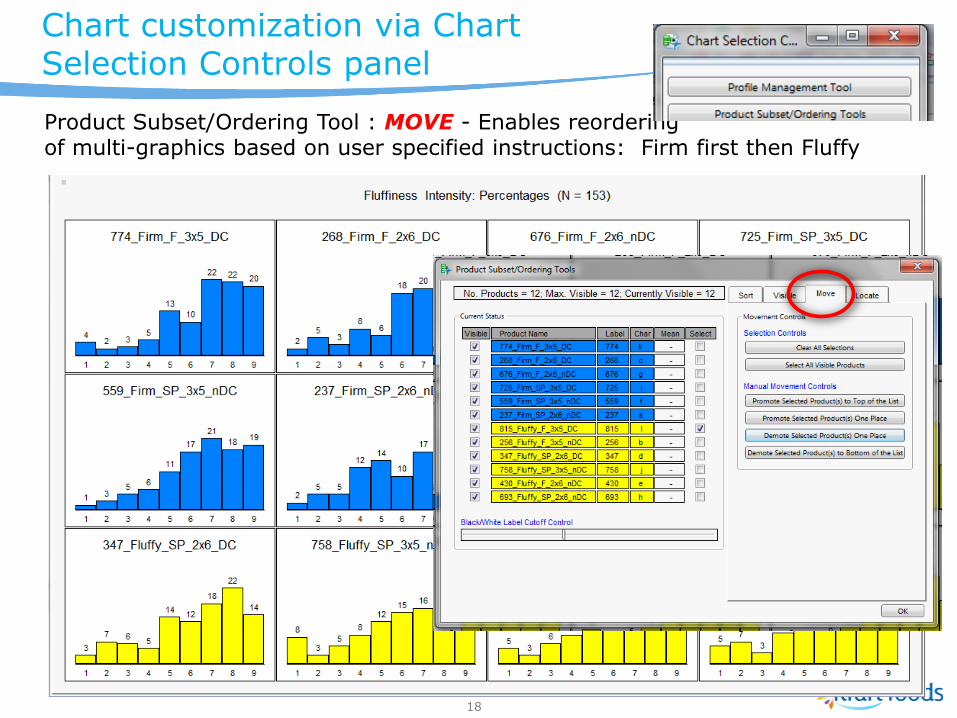
Chart customization via Chart Selection Controls panel
18
Product Subset/Ordering Tool : MOVE - Enables reordering of multi-graphics based on user specified instructions: Firm first then Fluffy
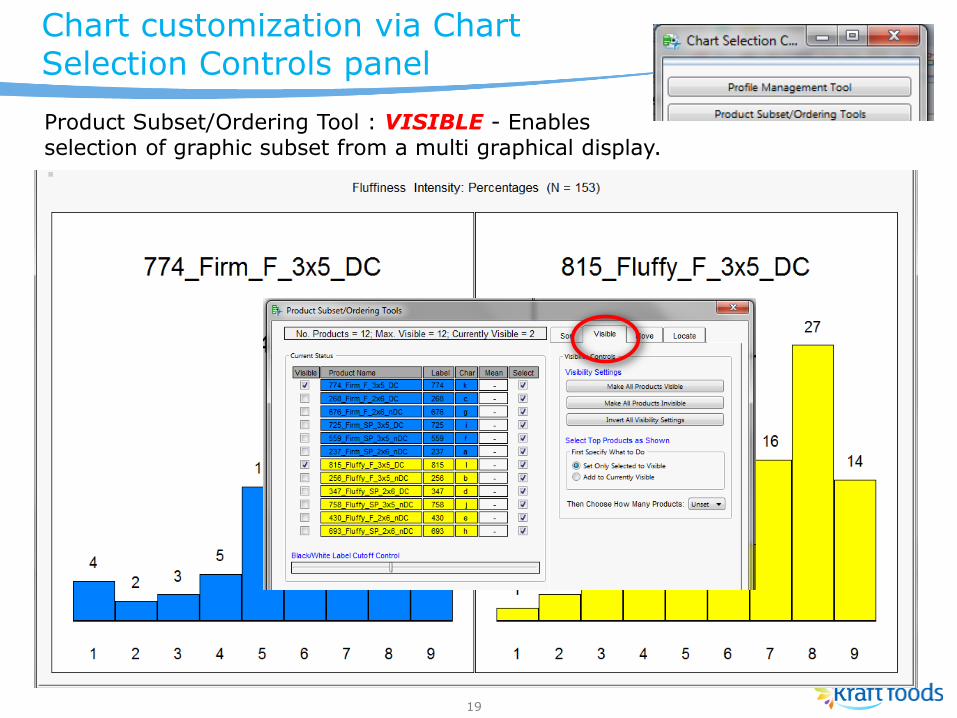
Chart customization via Chart Selection Controls panel
19
Product Subset/Ordering Tool : VISIBLE - Enables selection of graphic subset from a multi graphical display.
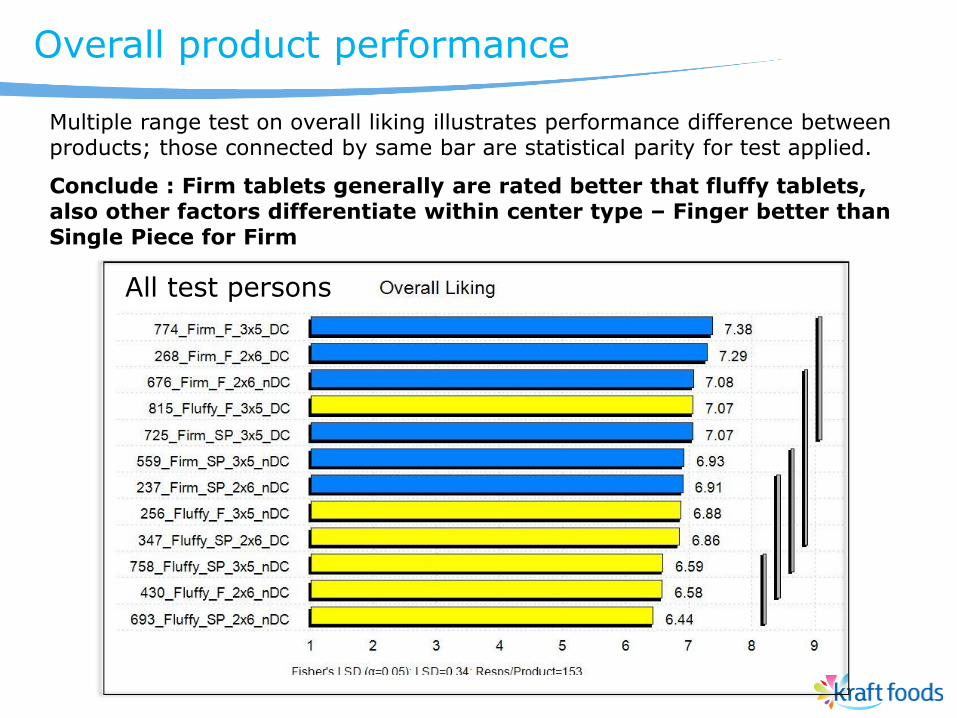
Overall product performance
Multiple range test on overall liking illustrates performance difference between products; those connected by same bar are statistical parity for test applied.
Conclude : Firm tablets generally are rated better that fluffy tablets, also other factors differentiate within center type – Finger better than Single Piece for Firm
All test persons
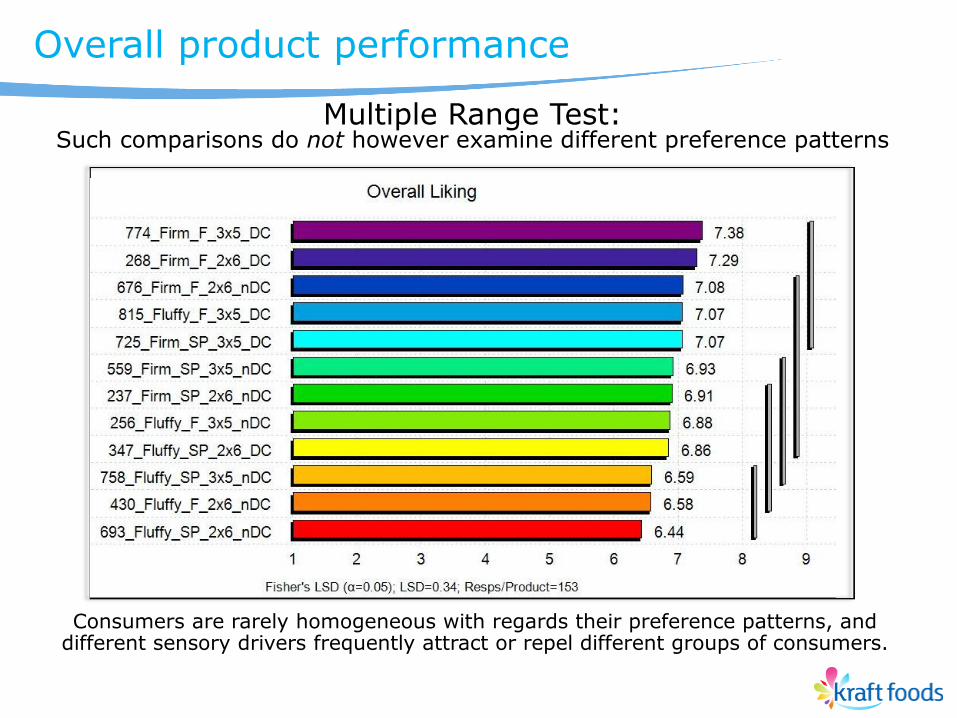
Multiple Range Test: Such comparisons do not however examine different preference patterns
Consumers are rarely homogeneous with regards their preference patterns, and different sensory drivers frequently attract or repel different groups of consumers.
Overall product performance
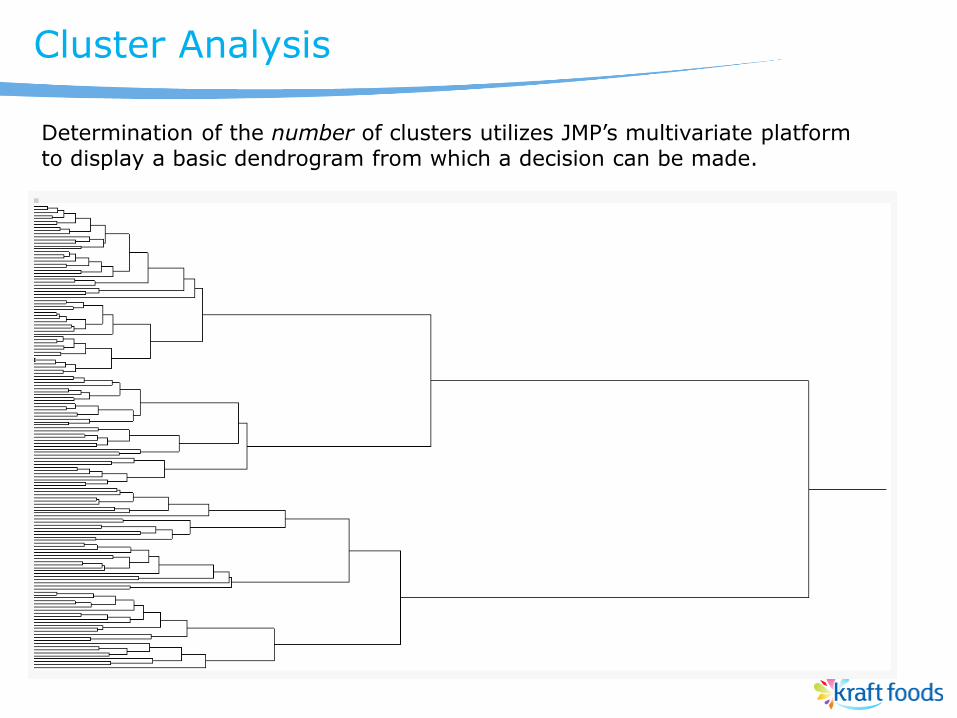
Cluster Analysis
Determination of the number of clusters utilizes JMP’s multivariate platform to display a basic dendrogram from which a decision can be made.
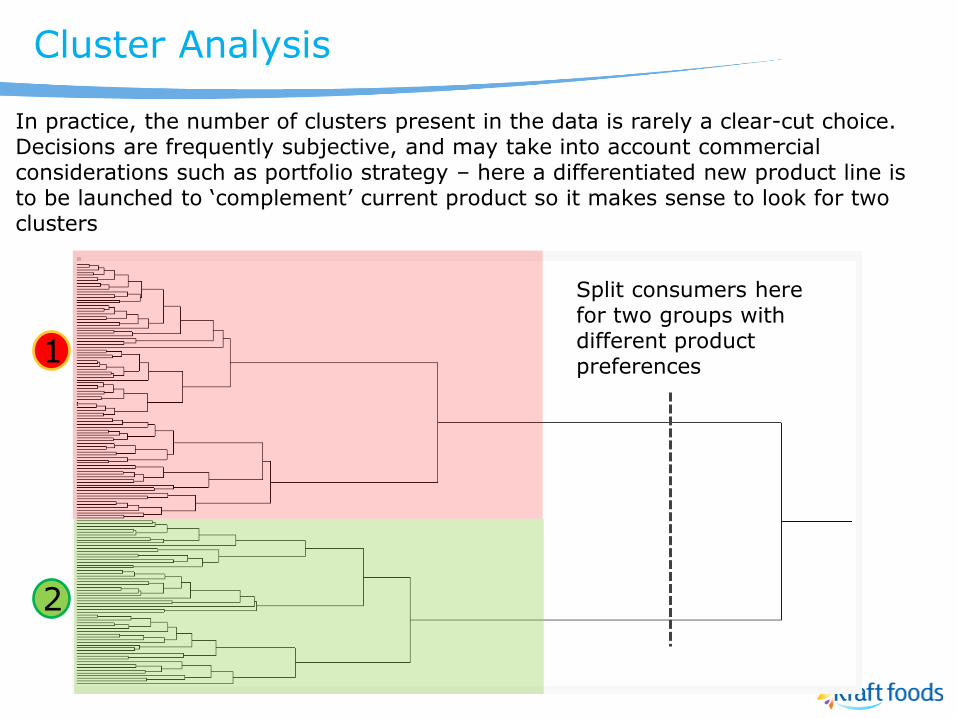
In practice, the number of clusters present in the data is rarely a clear-cut choice. Decisions are frequently subjective, and may take into account commercial considerations such as portfolio strategy – here a differentiated new product line is to be launched to ‘complement’ current product so it makes sense to look for two clusters
Cluster Analysis
1
2
Split consumers here for two groups with different product preferences
Cluster Analysis: Solution Stability
Any one or more of the following can have a dramatic effect upon the cluster solution obtained:
• Cluster method (typically k-Means or Ward)
• Presentation order of consumers
• Inclusion or exclusion of one or more consumers from the analysis
How can a stable solution be generated?
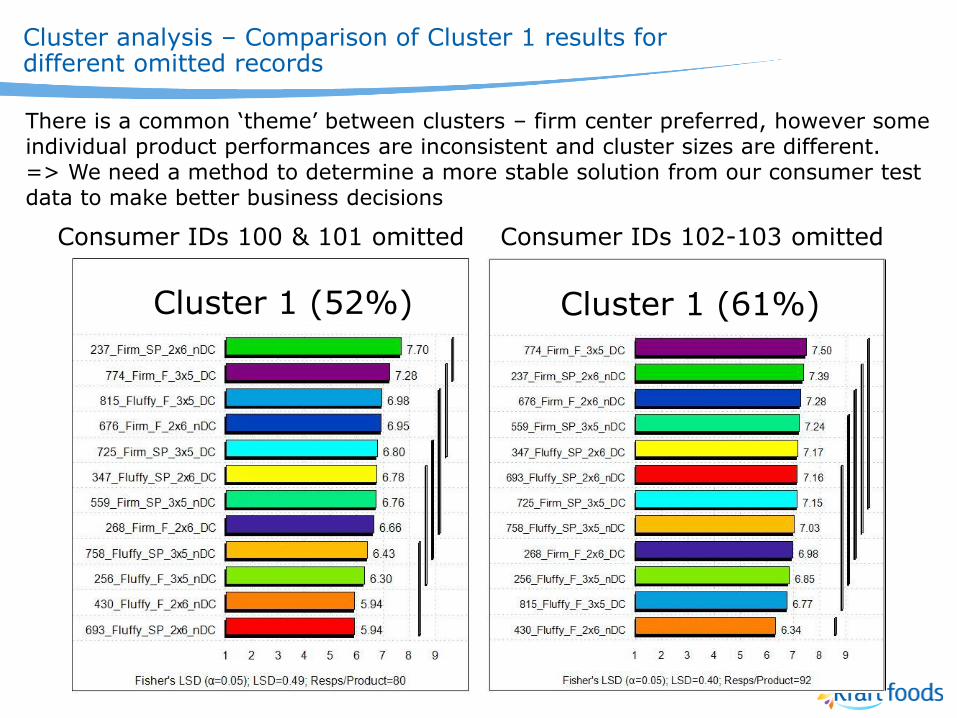
Cluster analysis – Comparison of Cluster 1 results for different omitted records
Vanilla
Consumer IDs 100 & 101 omitted Consumer IDs 102-103 omitted
There is a common ‘theme’ between clusters – firm center preferred, however some individual product performances are inconsistent and cluster sizes are different. => We need a method to determine a more stable solution from our consumer test data to make better business decisions
Cluster 1 (52%) Cluster 1 (61%)
Cluster Analysis: Iterative Clustering
Approach
Run clustering methods (Kmeans or Ward) iteratively for ‘perturbed’ data files and assign individual consumers to their consensus cluster.
Perturbed: Structured omission of consumers; 50 iterations
Challenges overcome
• Cluster analysis is not consistent in assigning the same name to clusters from different executions
Cluster 1 in one solution can be cluster 2 in another
• Consensus cluster solution should have the same interpretation each time it’s generated
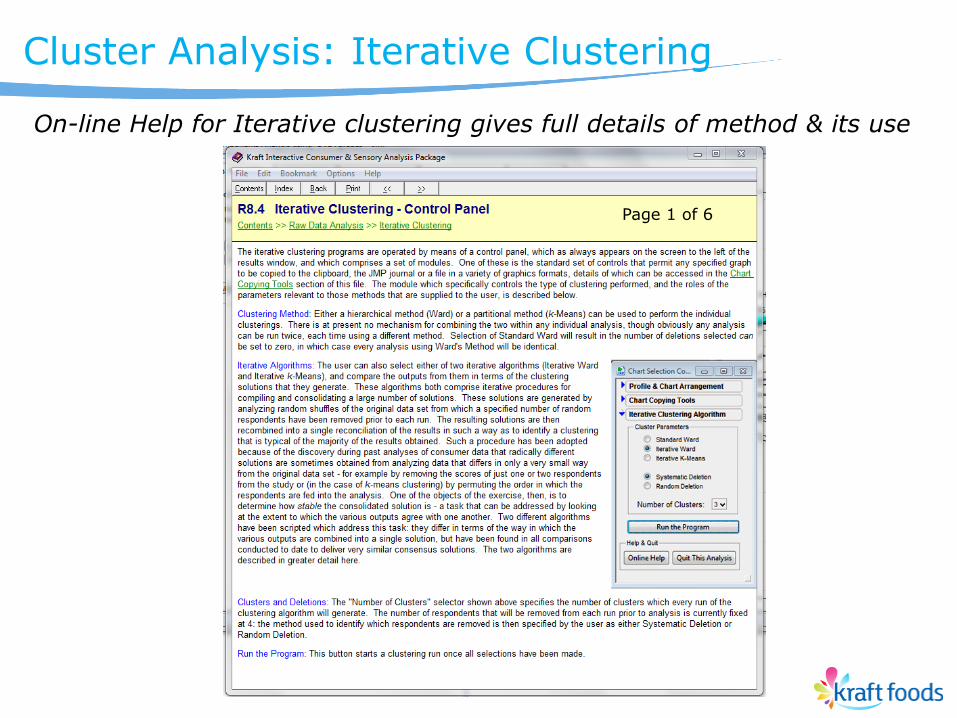
Cluster Analysis: Iterative Clustering
On-line Help for Iterative clustering gives full details of method & its use
Page 1 of 6
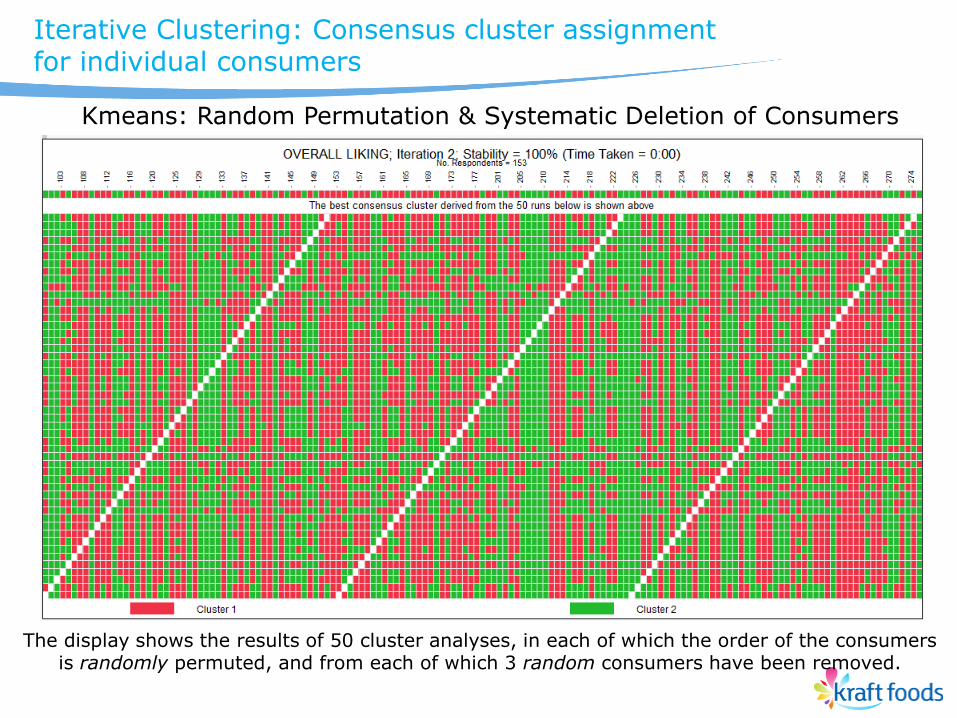
The display shows the results of 50 cluster analyses, in each of which the order of the consumers is randomly permuted, and from each of which 3 random consumers have been removed.
Iterative Clustering: Consensus cluster assignment for individual consumers
Kmeans: Random Permutation & Systematic Deletion of Consumers
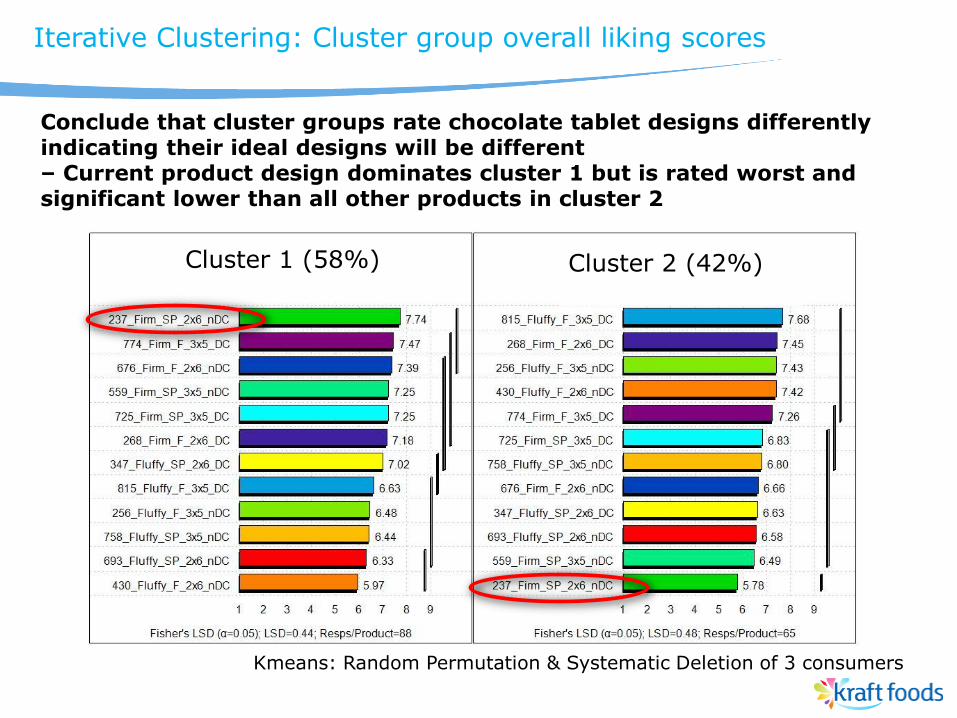
Iterative Clustering: Cluster group overall liking scores
Kmeans: Random Permutation & Systematic Deletion of 3 consumers
Cluster 1 (58%)
Cluster 2 (42%)
Conclude that cluster groups rate chocolate tablet designs differently indicating their ideal designs will be different – Current product design dominates cluster 1 but is rated worst and significant lower than all other products in cluster 2
30
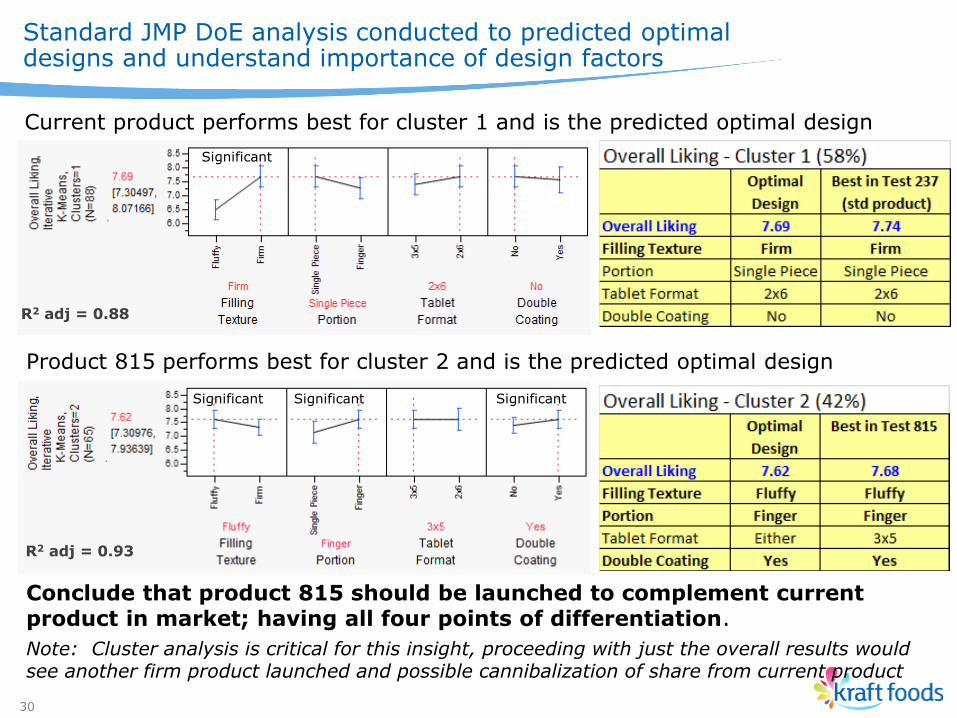
Standard JMP DoE analysis conducted to predicted optimal designs and understand importance of design factors
Current product performs best for cluster 1 and is the predicted optimal design
Product 815 performs best for cluster 2 and is the predicted optimal design
R2 adj = 0.93
Significant Significant Significant
R2 adj = 0.88
Significant
Conclude that product 815 should be launched to complement current product in market; having all four points of differentiation.
Note: Cluster analysis is critical for this insight, proceeding with just the overall results would see another firm product launched and possible cannibalization of share from current product
31
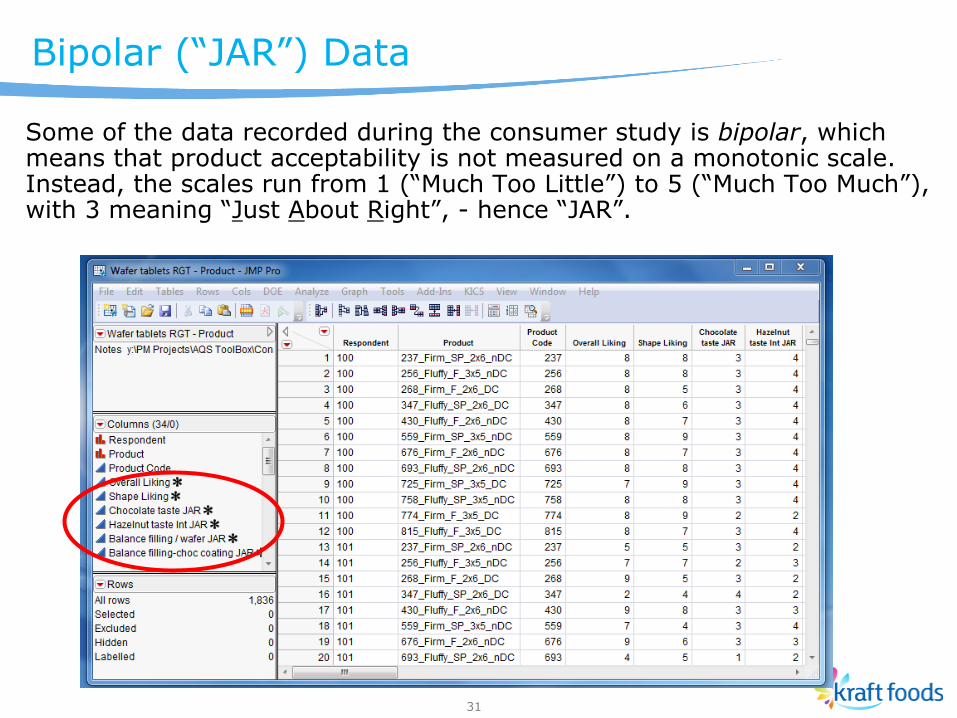
Some of the data recorded during the consumer study is bipolar, which means that product acceptability is not measured on a monotonic scale. Instead, the scales run from 1 (“Much Too Little”) to 5 (“Much Too Much”), with 3 meaning “Just About Right”, - hence “JAR”.
Bipolar (“JAR”) Data
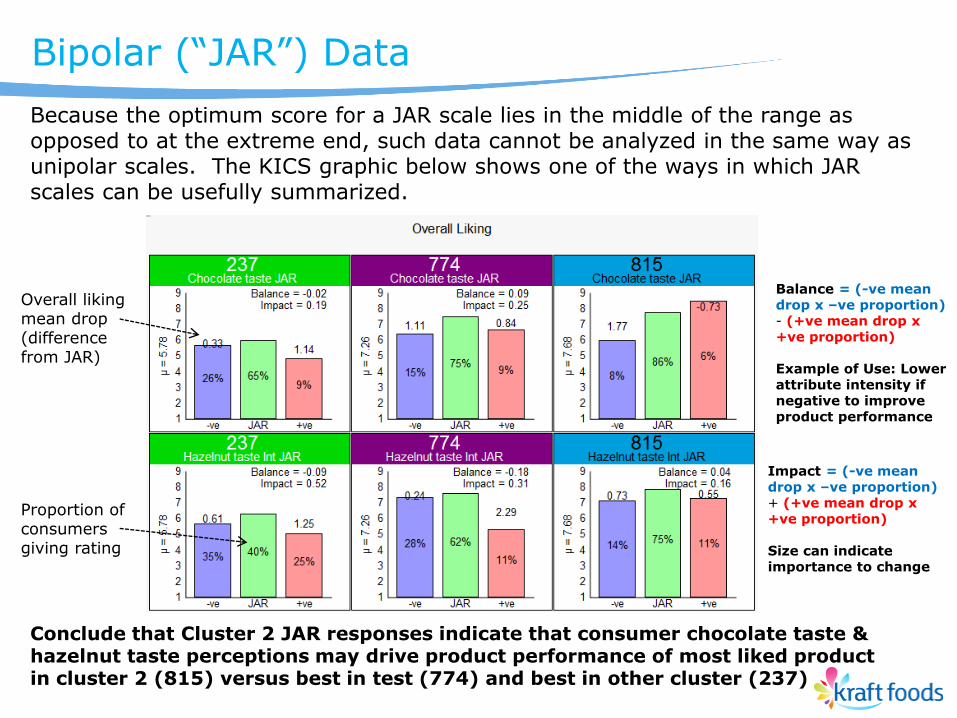
Because the optimum score for a JAR scale lies in the middle of the range as opposed to at the extreme end, such data cannot be analyzed in the same way as unipolar scales. The KICS graphic below shows one of the ways in which JAR scales can be usefully summarized.
Bipolar (“JAR”) Data
Conclude that Cluster 2 JAR responses indicate that consumer chocolate taste & hazelnut taste perceptions may drive product performance of most liked product in cluster 2 (815) versus best in test (774) and best in other cluster (237)
Overall liking mean drop (difference from JAR)
Proportion of consumers giving rating
Balance = (-ve mean drop x –ve proportion) - (+ve mean drop x +ve proportion) Example of Use: Lower attribute intensity if negative to improve product performance
Impact = (-ve mean drop x –ve proportion) + (+ve mean drop x +ve proportion) Size can indicate importance to change
Benefits of KICS Package
• 50% Efficiency
2-5 rather than 5-10 man days for analysis, interpretation and report generation
Graphics can be customized within agreed report formats and exported into business presentation
• Simpler, less error prone
Point & Click on JMP rather than use of several statistical software and self customisation of macros for case study specifics
• Extended user capability
Several active users per RD&Q site rather than reliance on a few company experts/ external agencies
Local knowledge of project/process applied better to the interpretation
• Use of best practice analysis
Customized scripts use Kraft Foods’ best statistical practices for global deployment – experts focusing more on this

Collaborative Approach Creates a Successful Kraft Foods Application for Consumer Test Evaluation Using JMP® 10 David Rose, PhD, Principal Implementation Consultant, SAS UK Jeff Stagg, Principal Scientist , Kraft Foods
EBC7 | Topic: JSL Application Development Kraft Foods promotes statistical thinking and best practices globally with the development of software tools that execute complex data handling, calculation and reporting. JMP software was selected as the platform to provide a multi-product consumer test evaluation tool for the global Consumer Science function in Kraft Foods. Developed in 2009 in collaboration with SAS Professional Services in Marlow, it is now deployed to more than 40 consumer science professionals around the world. There are obvious benefits: the ease and speed of use reduces the processing time by half; the consistent use of best practice in analysis methods improves interpretation; and tailored reporting formats enable smart and efficient communication to customers. Just as important are the people benefits: many more are empowered through training and coaching to conduct effective analyses on their own, with confidence and their knowledge of product and process fully applied to the interpretation. Application development continues as user enthusiasm and feedback drive change in both flexibility and functionality. Developments in 2012 have taken advantage of new capabilities introduced in JMP 10; an online help manual is incorporated and Kraft Foods analysis methods are customized with JMP Scripting Language. We’ll discuss: 1) an iterative clustering technique that reduces the uncertainty in individual consumer assignment to a cluster (a group of consumers with similar product preferences) and 2) consumers’ Just About Right [JAR] scale evaluation, which generates insight for product change. The full standard JMP functionality (e.g., DOE, regression analysis, etc.) complements the customized scripts to provide the user with the ultimate tool to evaluate multiproduct consumer tests within Kraft Foods, so much so that users enjoy this work