Embed Size (px)
Citation preview

CWB 2020 Second Quarter Report
CWB reports second quarter 2020 financial and strategic performance
Second Quarter 2020 Highlights(1) (compared to the same period in the prior year)
Adjusted cash EPS Total revenue Loans(2) Branch-raised
deposits Common share
dividend declared(3)
$0.60 $214 million $29.2 billion $15.2 billion $0.29
Down 19% Up 2% Up 7% in total; 10% in Ontario
Up 20% Two cent increase from last year; consistent with
last quarter
(1) Includes certain non-IFRS measures – refer to definitions and detail provided on page 6. (2) Excludes the allowance for credit losses. (3) Declared by our Board of Directors on May 28, 2020.
Edmonton, May 29, 2020 – CWB Financial Group (TSX: CWB) (CWB) today announced financial performance for the three and six month periods ended April 30, 2020. Our second quarter report includes discussion of how the COVID-19 pandemic and economic impact has affected our financial results and our business. We also provide an update on our continued strategic execution to enhance our differentiated full-service client experience.
“We started this quarter with strong financial performance, including robust branch-raised deposit growth and very strong new lending both within our strategically targeted general commercial portfolio and in Ontario.” said Chris Fowler, President and CEO. “As the quarter progressed, a significant economic slowdown commenced as Canadian government agencies enacted measures to slow the spread of COVID-19. We were proactive in our approach to dealing with the economic challenges that this pandemic presented for our business and our clients’ businesses.”
“Our past investments in technology infrastructure supported the rollout of our business continuity plan and enabled us to smoothly transition over 85% of our team members to work remotely. We quickly mobilized our teams to reach out to clients to provide advice, support, and offer the right solutions for those in need of financial assistance. Our teams were among the first in the industry to deliver loan relief to businesses, and we put their minds more at ease by efficiently processing changes. Through this challenging period, I am pleased with the very positive feedback we have received for our proactive approach to client service and our #CWBHasYourBack program. With so much change asked of our team members this quarter, it is especially rewarding that confidential employee survey results supported our recognition as one of the 50 Best Workplaces in Canada for 2020 by Great Place to Work CanadaTM.”
Chris Fowler continued, “The significant actions we have taken over the last decade to strengthen and diversify our business enable us to face this challenging environment from a position of stability and confidence. Our dedicated employees and diversified business, supported by strong capital and liquidity levels allow us to continue to proactively help our clients navigate this difficult time and enable CWB to achieve ongoing success.”
“The deteriorating economic and financial market conditions put pressure on our operating results, particularly on the estimated provision for credit losses on performing loans and net interest income. While our estimated provision for credit losses on performing loans increased this quarter based on an adverse shift in macroeconomic forecasts, we continue to see the benefit from our strategic actions over many years to diversify our loan portfolio. Our disciplined and secured lending model, with no significant exposure to unsecured personal borrowing including credit cards, continues to support the resilience of our business. Our capital ratios remain strong and well above regulatory requirements, and we hold ample liquidity to support our clients and continue to invest in our strategic priorities.”
“Working remotely has not stopped us from advancing our strategic initiatives. This quarter, we announced both the acquisition of T.E. Wealth and Leon Frazer & Associates as well as the submission of our formal application for transition to the Advanced Internal Ratings Based (AIRB) approach for regulatory capital and risk management. Both events represent significant opportunities to fundamentally enhance our operating model to put us on a more equal footing with our competition, increase our addressable market and support full service client relationships. While we are focused on maintaining our strength today, we continue to execute on the opportunities of tomorrow.”
CWB 2020 Second Quarter Report 2
Financial Performance
Q2 2020, compared to
Q2 2019(1)
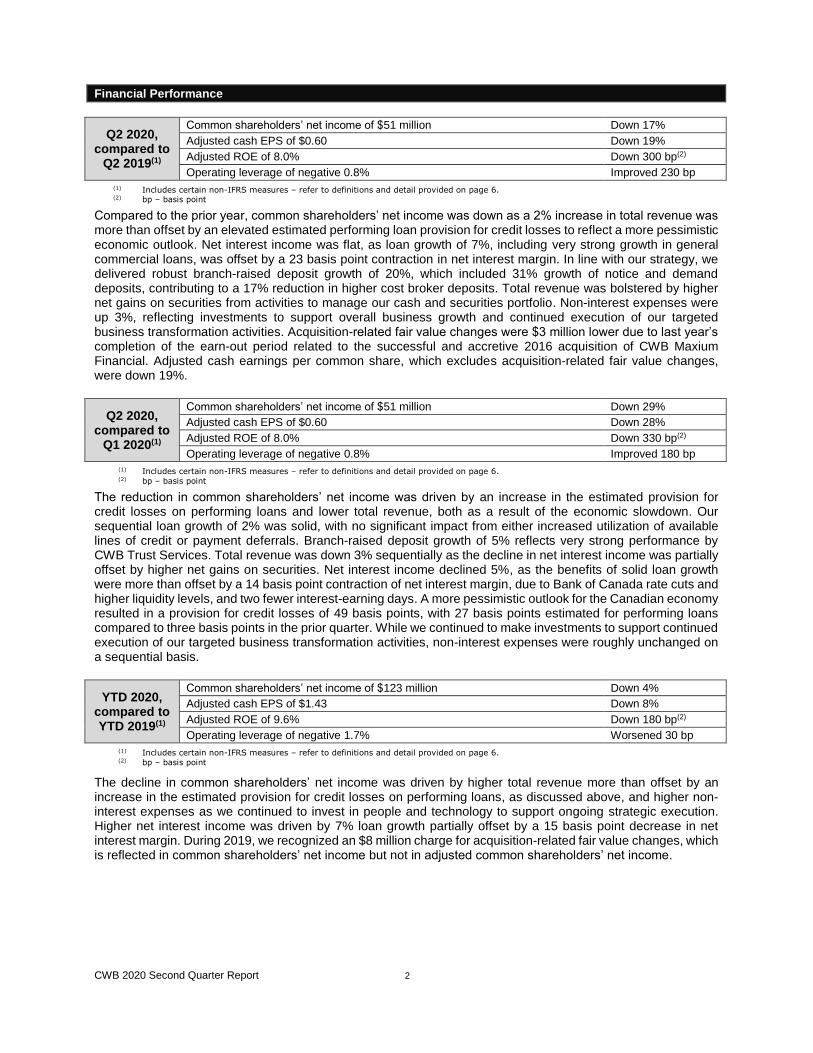
Common shareholders’ net income of $51 million Down 17%
Adjusted cash EPS of $0.60 Down 19%
Adjusted ROE of 8.0% Down 300 bp(2)
Operating leverage of negative 0.8% Improved 230 bp
(1) Includes certain non-IFRS measures – refer to definitions and detail provided on page 6. (2) bp – basis point
Compared to the prior year, common shareholders’ net income was down as a 2% increase in total revenue was more than offset by an elevated estimated performing loan provision for credit losses to reflect a more pessimistic economic outlook. Net interest income was flat, as loan growth of 7%, including very strong growth in general commercial loans, was offset by a 23 basis point contraction in net interest margin. In line with our strategy, we delivered robust branch-raised deposit growth of 20%, which included 31% growth of notice and demand deposits, contributing to a 17% reduction in higher cost broker deposits. Total revenue was bolstered by higher net gains on securities from activities to manage our cash and securities portfolio. Non-interest expenses were up 3%, reflecting investments to support overall business growth and continued execution of our targeted business transformation activities. Acquisition-related fair value changes were $3 million lower due to last year’s completion of the earn-out period related to the successful and accretive 2016 acquisition of CWB Maxium Financial. Adjusted cash earnings per common share, which excludes acquisition-related fair value changes, were down 19%.
Q2 2020, compared to
Q1 2020(1)
Common shareholders’ net income of $51 million Down 29%
Adjusted cash EPS of $0.60 Down 28%
Adjusted ROE of 8.0% Down 330 bp(2)
Operating leverage of negative 0.8% Improved 180 bp
(1) Includes certain non-IFRS measures – refer to definitions and detail provided on page 6. (2) bp – basis point
The reduction in common shareholders’ net income was driven by an increase in the estimated provision for credit losses on performing loans and lower total revenue, both as a result of the economic slowdown. Our sequential loan growth of 2% was solid, with no significant impact from either increased utilization of available lines of credit or payment deferrals. Branch-raised deposit growth of 5% reflects very strong performance by CWB Trust Services. Total revenue was down 3% sequentially as the decline in net interest income was partially offset by higher net gains on securities. Net interest income declined 5%, as the benefits of solid loan growth were more than offset by a 14 basis point contraction of net interest margin, due to Bank of Canada rate cuts and higher liquidity levels, and two fewer interest-earning days. A more pessimistic outlook for the Canadian economy resulted in a provision for credit losses of 49 basis points, with 27 basis points estimated for performing loans compared to three basis points in the prior quarter. While we continued to make investments to support continued execution of our targeted business transformation activities, non-interest expenses were roughly unchanged on a sequential basis.
YTD 2020, compared to YTD 2019(1)
Common shareholders’ net income of $123 million Down 4%
Adjusted cash EPS of $1.43 Down 8%
Adjusted ROE of 9.6% Down 180 bp(2)
Operating leverage of negative 1.7% Worsened 30 bp
(1) Includes certain non-IFRS measures – refer to definitions and detail provided on page 6. (2) bp – basis point
The decline in common shareholders’ net income was driven by higher total revenue more than offset by an increase in the estimated provision for credit losses on performing loans, as discussed above, and higher non-interest expenses as we continued to invest in people and technology to support ongoing strategic execution. Higher net interest income was driven by 7% loan growth partially offset by a 15 basis point decrease in net interest margin. During 2019, we recognized an $8 million charge for acquisition-related fair value changes, which is reflected in common shareholders’ net income but not in adjusted common shareholders’ net income.
CWB 2020 Second Quarter Report 3
Strategic Performance
The continuation of our focused business transformation and investments in digital capabilities, supported by our talented and agile teams, will enhance our differentiated full-service client experience and position us for accelerated growth as the economy stabilizes. This quarter, we:
submitted our AIRB formal application with regulatory approval expected within fiscal 2020; announced the acquisition of T.E. Wealth and Leon Frazer & Associates, leading providers of financial
planning and wealth management services targeting high-net-worth Canadian families, that is expected to close on June 1st;
made strong progress on the improvement in our digital capabilities and remained committed to achievement of key milestones despite the impacts of COVID-19; and
were recognized by Great Places to Work CanadaTM as one of the 50 Best Workplaces in Canada for 2020.
About CWB Financial Group
CWB Financial Group (CWB) is a diversified financial services organization known for a highly proactive client experience serving businesses and individuals across Canada. Operating from headquarters in Edmonton, Alberta, CWB’s key business lines include full service business and personal banking offered through branch locations of Canadian Western Bank and Internet banking services provided by Motive Financial. Highly responsive nation-wide specialized financing is delivered under the banners of CWB Optimum Mortgage, CWB Equipment Financing, CWB National Leasing, CWB Maxium Financial and CWB Franchise Finance. Trust services are offered through CWB Trust Services. Comprehensive wealth management offerings are provided through CWB Wealth Management, which includes the businesses of CWB McLean & Partners Wealth Management and Canadian Western Financial. As a public company on the Toronto Stock Exchange (TSX), CWB trades under the symbols “CWB” (common shares), “CWB.PR.B” (Series 5 preferred shares), “CWB.PR.C” (Series 7 preferred shares) and “CWB.PR.D” (Series 9 preferred shares). Learn more at www.cwb.com.
Fiscal 2020 Second Quarter Results Conference Call
CWB’s second quarter results conference call is scheduled for Friday, May 29, 2020, at 10:30 a.m. ET (8:30 a.m. MT).
CWB’s executives will comment on financial results and respond to questions from analysts.
The conference call may be accessed on a listen-only basis by dialing (416) 764-8688 (Toronto) or (888) 390-0546 (toll free) and entering passcode: 88989551. The call will also be webcast live on CWB’s website:
www.cwb.com/investor-relations/quarterly-reports.
A replay of the conference call will be available until June 5, 2020, by dialing (416) 764-8677 (Toronto) or (888) 390-0541 (toll-free) and entering passcode 989551#.
FOR FURTHER INFORMATION CONTACT:
Chris Williams, MBA AVP, Investor Relations Phone: (780) 508-8229 Email: [email protected]
Contents
Selected Financial Highlights 4
Management’s Discussion and Analysis 5
Interim Consolidated Financial Statements 25
Shareholder Information 48
CWB 2020 Second Quarter Report 4
Selected Financial Highlights(1)
For the three months ended Change from April 30
2019
For the six months ended Change from April 30
2019
(unaudited) April 30
2020(2)
January 31
2020(2)
April 30
2019
April 30
2020(2)
April 30
2019
(thousands, except per share amounts)
Results from Operations
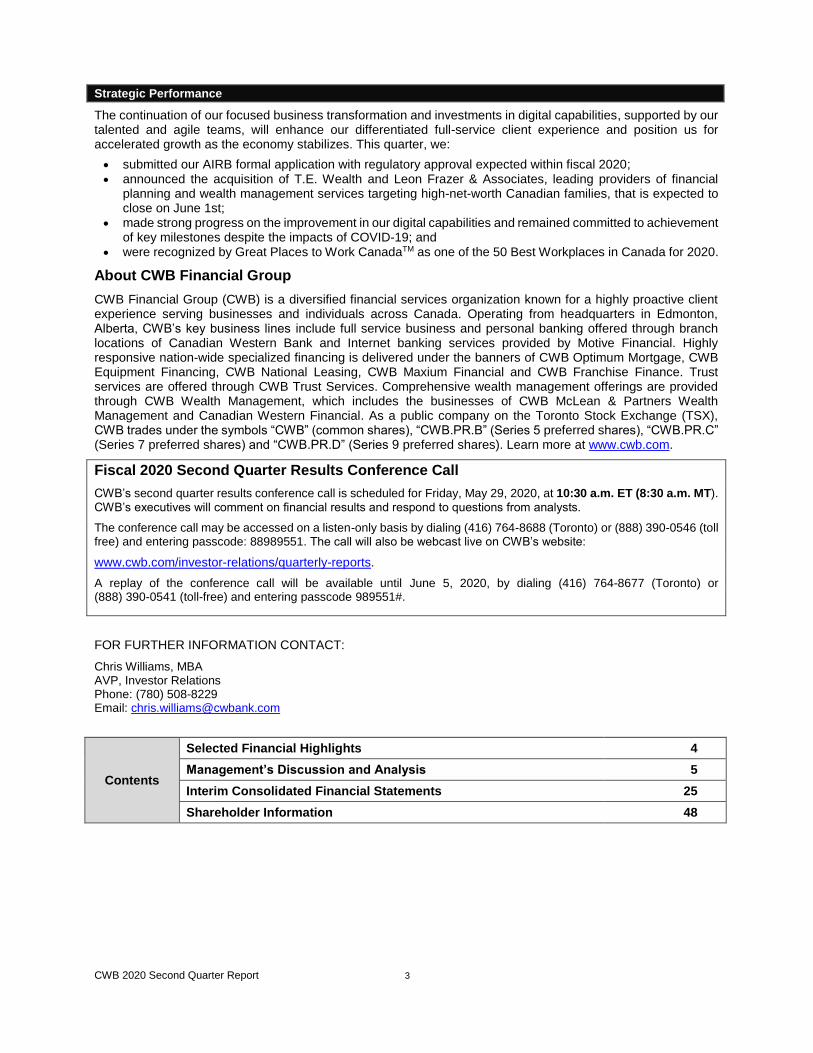
Net interest income $ 190,988 $ 201,010 $ 191,057 - % $ 391,998 $ 384,399 2 %
Non-interest income 23,376 18,962 18,771 25 42,338 37,868 12 Total revenue 214,364 219,972 209,828 2 434,336 422,267 3
Pre-tax, pre-provision income 113,314 119,788 111,692 1 233,102 229,765 1
Common shareholders’ net income 51,381 71,943 61,965 (17) 123,324 128,464 (4)
Earnings per common share Basic 0.59 0.82 0.71 (17) 1.41 1.46 (3)
Diluted 0.59 0.82 0.71 (17) 1.41 1.46 (3)
Adjusted cash 0.60 0.83 0.74 (19) 1.43 1.55 (8)
Return on common shareholders’ equity 7.9 % 11.2 % 10.5 % (260) bp(5) 9.5 % 10.8 % (130) bp(5)
Adjusted return on common shareholders’
equity 8.0 11.3 11.0 (300) 9.6 11.4 (180)
Return on assets 0.65 0.91 0.85 (20) 0.78 0.88 (10)
Efficiency ratio 47.1 45.5 46.8 30 46.3 45.6 70
Net interest margin 2.40 2.54 2.63 (23) 2.47 2.62 (15) Operating leverage (0.8) (2.6) (3.1) 230 (1.7) (1.4) (30)
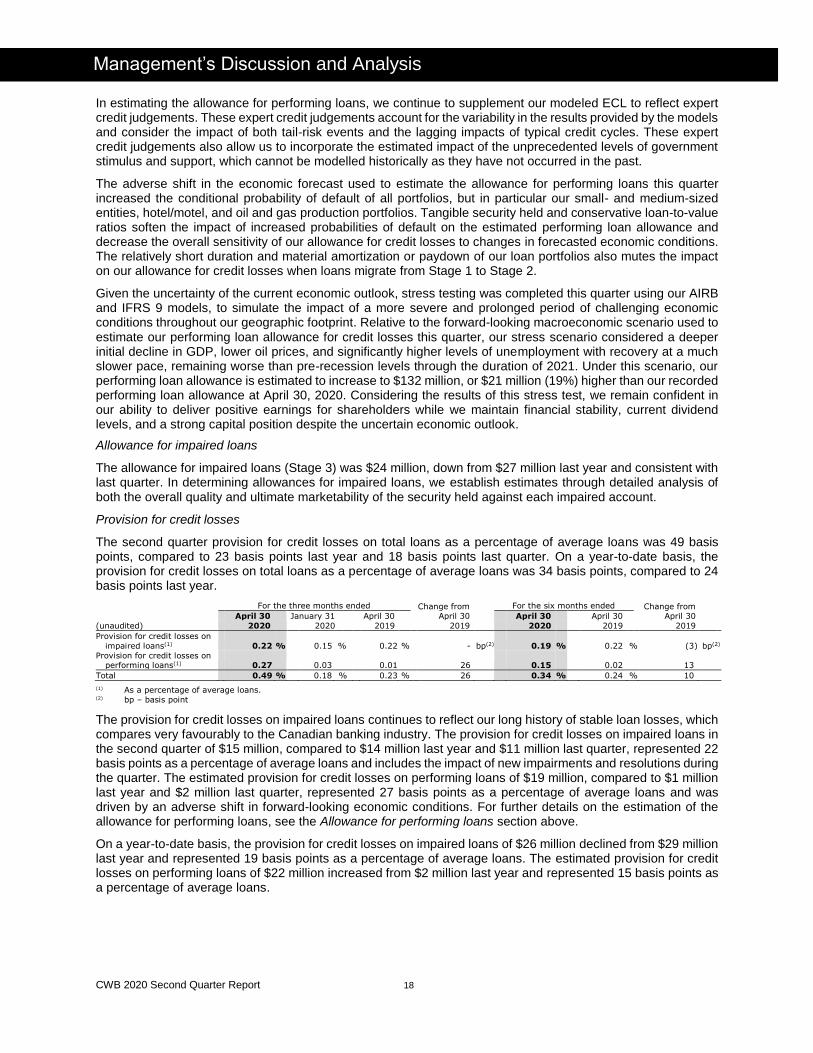
Provision for credit losses on total loans as
a percentage of average loans(3) 0.49 0.18 0.23 26 0.34 0.24 10
Provision for credit losses on impaired loans as a percentage of average loans(3) 0.22 0.15 0.22 - 0.19 0.22 (3)
Number of full-time equivalent staff 2,325 2,289 2,263 3 % 2,325 2,263 3 %
Per Common Share
Cash dividends $ 0.29 $ 0.28 $ 0.27 7 % $ 0.57 $ 0.53 8 %
Book value 31.24 29.81 28.20 11 31.24 28.20 11 Closing market value 22.03 32.72 30.04 (27) 22.03 30.04 (27)
Common shares outstanding (thousands) 87,100 87,273 87,239 - 87,100 87,239 -
Balance Sheet and Off-Balance Sheet
Summary
Assets $ 32,958,184 $ 31,571,598 $ 30,054,181 10 % Loans(4) 29,197,575 28,766,032 27,352,637 7
Deposits 26,147,086 25,640,876 24,718,173 6
Debt 2,813,882 2,243,891 1,887,541 49
Shareholders’ equity 3,110,775 2,991,732 2,850,398 9 Assets under administration 10,023,466 10,013,678 8,856,962 13
Assets under management 1,981,062 2,152,255 2,137,489 (7)
Capital Adequacy
Common equity Tier 1 ratio 9.1 % 9.1 % 9.1 % - bp(5)
Tier 1 ratio 10.5 10.6 10.7 (20) Total ratio 11.9 11.9 11.9 -
(1) Includes certain non-IFRS measures – refer to definitions and detail provided on page 6. (2) Results for periods beginning on November 1, 2019 have been prepared in accordance with IFRS 16 Leases (IFRS 16) (refer to Note 2 of the interim consolidated financial statements).
Prior year comparatives have been prepared in accordance with IAS 17 Leases (IAS 17) and have not been restated. (3) Includes provisions for credit losses on loans, committed but undrawn credit exposures and letters of credit. (4) Excludes the allowance for credit losses. (5) bp – basis point
CWB 2020 Second Quarter Report 5
Management’s Discussion and Analysis
This Management’s Discussion and Analysis (MD&A), dated May 28, 2020, should be read in conjunction with the unaudited condensed interim consolidated financial statements of Canadian Western Bank (CWB) for the period ended April 30, 2020, and the audited consolidated financial statements and MD&A for the year ended October 31, 2019, available on SEDAR at www.sedar.com and on CWB’s website at www.cwb.com.
The consolidated financial statements have been prepared in accordance with International Financial Reporting Standards (IFRS) and are presented in Canadian dollars.
Forward-looking Statements
From time to time, we make written and verbal forward-looking statements. Statements of this type are included in our Annual Report and reports to shareholders and may be included in filings with Canadian securities regulators or in other communications such as press releases and corporate presentations. Forward-looking statements include, but are not limited to, statements about our objectives and strategies, targeted and expected financial results and the outlook for CWB’s businesses or for the Canadian economy. Forward-looking statements are typically identified by the words “believe”, “expect”, “anticipate”, “intend”, “estimate”, “may increase”, “may impact”, “goal”, “focus”, “potential”, “proposed” and other similar expressions, or future or conditional verbs such as “will”, “should”, “would” and “could”.
By their very nature, forward-looking statements involve numerous assumptions and are subject to inherent risks and uncertainties, which give rise to the possibility that our predictions, forecasts, projections, expectations and conclusions will not prove to be accurate, that our assumptions may not be correct and that our strategic goals will not be achieved.
A variety of factors, many of which are beyond our control, may cause actual results to differ materially from the expectations expressed in the forward-looking statements. These factors include, but are not limited to, general business and economic conditions in Canada, including housing market conditions, the volatility and level of liquidity in financial markets, fluctuations in interest rates and currency values, the volatility and level of various commodity prices, changes in monetary policy, changes in economic and political conditions, material changes to trade agreements, legislative and regulatory developments, legal developments, the level of competition, the occurrence of natural catastrophes, outbreaks of disease or illness that affect local, national or international economies, changes in accounting standards and policies, information technology and cyber risk, the accuracy and completeness of information we receive about customers and counterparties, the ability to attract and retain key personnel, the ability to complete and integrate acquisitions, reliance on third parties to provide components of business infrastructure, changes in tax laws, technological developments, unexpected changes in consumer spending and saving habits, timely development and introduction of new products, and our ability to anticipate and manage the risks associated with these factors. It is important to note that the preceding list is not exhaustive of possible factors.
Additional information about these factors can be found in the Risk Management section of our interim and/or annual MD&A. These and other factors should be considered carefully, and readers are cautioned not to place undue reliance on these forward-looking statements as a number of important factors could cause our actual results to differ materially from the expectations expressed in such forward-looking statements. Unless required by securities law, we do not undertake to update any forward-looking statement, whether written or verbal, that may be made from time to time by us or on our behalf. The forward-looking statements contained in this document are presented for the purpose of assisting readers in understanding our financial position and results of operations as at and for the periods ended on the dates presented, as well as our strategic priorities and objectives, and may not be appropriate for other purposes.
Assumptions about the performance of the Canadian economy over the forecast horizon and how it will affect our businesses are material factors considered when setting organizational objectives and targets. In determining expectations for economic growth, we consider our own forecasts, economic data and forecasts provided by the Canadian government and its agencies, as well as certain private sector forecasts. These forecasts are subject to inherent risks and uncertainties that may be general or specific.
Where relevant, material economic assumptions underlying forward-looking statements are disclosed within the Outlook section of our annual MD&A. The emergence of COVID-19 has cast uncertainty on each of the assumptions described in our annual MD&A and we caution that they no longer remain valid. Given the continued rapid pace of change, it is premature to make further assumptions about these matters. The full extent of the impact that COVID-19, including government and regulatory responses to the outbreak, will have on the Canadian economy and our business is highly uncertain and difficult to predict at this time. See the COVID-19 and Our Response, Financial Results and Outlook, and Risk Management sections of this interim MD&A for more information.
CWB 2020 Second Quarter Report 6
Management’s Discussion and Analysis
Non-IFRS Measures
We use a number of financial measures to assess our performance against strategic initiatives and operational benchmarks. Non-IFRS measures provide readers with an enhanced understanding of how we view our ongoing performance. These measures may also provide the ability to analyze trends related to profitability and the effectiveness of our operations and strategies, and determine compliance against regulatory standards. To arrive at certain non-IFRS measures, we make adjustments to the results prepared in accordance with IFRS. Adjustments relate to items which we believe are not indicative of underlying operating performance. Some of these financial measures do not have standardized meanings prescribed by IFRS, and therefore, may not be comparable to similar measures presented by other financial institutions. The non-IFRS measures used in this MD&A are calculated as follows:
Adjusted non-interest expenses – total non-interest expenses, excluding the pre-tax amortization of acquisition-related intangible assets (see calculation below).
Adjusted common shareholders’ net income – total common shareholders’ net income, excluding the amortization of acquisition-related intangible assets and acquisition-related fair value changes, net of tax (see calculation below).
Pre-tax, pre-provision income – total revenue less adjusted non-interest expenses (see calculation below).
Adjusted cash earnings per common share – diluted earnings per common share calculated with adjusted common shareholders’ net income.
Return on common shareholders’ equity – annualized common shareholders’ net income divided by average common shareholders’ equity.
Adjusted return on common shareholders’ equity – annualized adjusted common shareholders’ net income divided by average common shareholders’ equity.
Return on assets – annualized common shareholders’ net income divided by average total assets.
Efficiency ratio – adjusted non-interest expenses divided by total revenue.
Net interest margin – annualized net interest income divided by average total assets.
Provision for credit losses on total loans as a percentage of average loans – annualized provision for credit losses on loans, committed but undrawn credit exposures and letters of credit divided by average total loans. Provisions for credit losses related to debt securities measured at fair value through other comprehensive income (FVOCI) and other financial assets are excluded.
Provision for credit losses on impaired loans as a percentage of average loans – annualized provision for credit losses on impaired loans divided by average total loans.
Provision for credit losses on performing loans as a percentage of average loans – annualized provision for credit losses on performing loans (Stage 1 and 2) divided by average total loans.
Operating leverage – growth rate of total revenue less growth rate of adjusted non-interest expenses.
Common share dividend payout ratio – common share dividends declared during the past twelve months divided by common shareholders’ net income earned over the same period.
Basel III common equity Tier 1, Tier 1, Total capital, and leverage ratios – calculated in accordance with guidelines issued by the Office of the Superintendent of Financial Institutions Canada (OSFI);
Risk-weighted assets – on and off-balance sheet assets assigned a risk weighting calculated in accordance with the Standardized approach guidelines issued by OSFI.
Average balances – average daily balances.
Adjusted Financial Measures
For the three months ended
Change from April 30
2019
For the six months ended
Change from April 30
2019
April 30
2020
January 31
2020
April 30
2019
April 30
2020
April 30
2019
(unaudited)
(thousands)
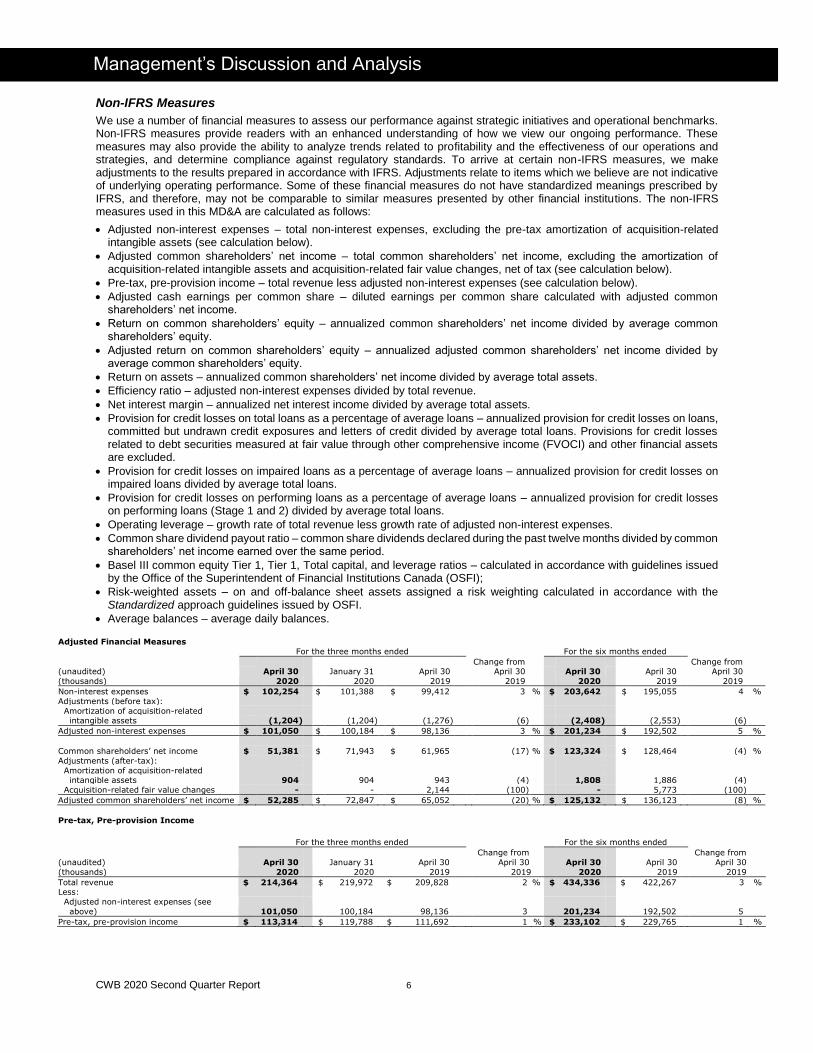
Non-interest expenses $ 102,254 $ 101,388 $ 99,412 3 % $ 203,642 $ 195,055 4 %
Adjustments (before tax):
Amortization of acquisition-related intangible assets (1,204) (1,204) (1,276) (6) (2,408) (2,553) (6)
Adjusted non-interest expenses $ 101,050 $ 100,184 $ 98,136 3 % $ 201,234 $ 192,502 5 %
Common shareholders’ net income $ 51,381 $ 71,943 $ 61,965 (17) % $ 123,324 $ 128,464 (4) %
Adjustments (after-tax):
Amortization of acquisition-related intangible assets 904 904 943 (4) 1,808 1,886 (4)
Acquisition-related fair value changes - - 2,144 (100) - 5,773 (100)
Adjusted common shareholders’ net income $ 52,285 $ 72,847 $ 65,052 (20) % $ 125,132 $ 136,123 (8) %
Pre-tax, Pre-provision Income
For the three months ended For the six months ended
April 30
2020
January 31
2020
April 30
2019
Change from
April 30
2019
April 30
2020
April 30
2019
Change from
April 30
2019
(unaudited)
(thousands)
Total revenue $ 214,364 $ 219,972 $ 209,828 2 % $ 434,336 $ 422,267 3 % Less:
Adjusted non-interest expenses (see
above) 101,050
100,184
98,136
3 201,234 192,502 5
Pre-tax, pre-provision income $ 113,314 $ 119,788 $ 111,692 1 % $ 233,102 $ 229,765 1 %
CWB 2020 Second Quarter Report 7
Management’s Discussion and Analysis
Impact of COVID-19 and our Response Beginning in mid-March, the impact of market disruption related to the global pandemic known as COVID-19 on the Canadian economy has been unprecedented and widespread. This has created a challenging operating environment for our teams and clients across all industries and provinces. Canadian federal, provincial, and municipal governments began restricting mobility and social interaction in March in an effort to limit the spread of infection, which has significantly curtailed economic activity and energy demand. The duration and magnitude of these restrictions are evolving and we continue to closely monitor developments.
These conditions have put significant downward pressure on our operating results. Our investments in digital capabilities in recent years combined with our ongoing strategic execution to diversify our business and strengthen funding sources has contributed to our resilient position. We remain confident in our ability to support our clients and people through these challenging times, while maintaining a prudent approach to lending, liquidity and capital levels.
Supporting our People
Our first priority is the well-being of our teams and clients and we continue to take measures to ensure their health and safety. In addition to adhering to the guidance of local health authorities, we have taken further precautionary measures to protect our teams and clients, and limit the spread of COVID-19. These actions include temporarily closing certain branches and reducing operating hours in others, as well as installing additional safety measures within branches that remain open. We have implemented travel restrictions and replaced in-person gatherings and events with alternative communication methods. Over 85% of our people were quickly transitioned to working remotely. Where our teams must be on-site to perform critical roles, we support social distancing protocols, have implemented enhanced cleaning and sanitization practices, and provide personal protection equipment. Beginning in late May, our temporarily closed branches have re-opened following provincial protocols and the implementation of a phased strategy, focused on the continued well-being of our people and clients, to support our teams as they return to the workplace. Our branch teams that provide essential banking services will gradually return to the workplace prior to our non-branch teams. We have delayed the opening of our first full-service branch in Mississauga, Ontario until conditions become more appropriate.
We have had no layoffs or furloughs related to the economic impact of COVID-19 as our teams have continued to proactively support our clients, maintain our normal high service levels, and advance our business transformation and digital capabilities to ensure we are well positioned for a return to strong growth emerging from this period of market disruption.
Supporting our Clients
Our teams continue to provide a full range of services to our clients – remotely, digitally and with essential branch operations, despite current disruptions to our in-person service delivery channels. Our teams were among the first in the industry to deliver payment deferrals to businesses. Under our #CWBHasYourBack program, we mobilized our teams to proactively reach out to our clients to provide individualized advice and support, and quickly put their minds more at ease by efficiently processing requests. As at April 30, 2020, we provided payment deferral options on 19,000 loans, representing over 20% of outstanding business and personal loans. Our teams continue to actively support the recently launched government lending initiatives to provide consumers and businesses with relief through this period of market disruption. As at April 30, 2020, we administered the advance of approximately $54 million of Canada Emergency Business Account loans to over 1,350 clients. These loans are funded by the federal government and not carried on our balance sheet. Subsequent to quarter-end, we began to fund loans, with partial federal government guarantees, through Export Development Canada’s Business Credit Availability Program lending program.
Financial Results and Outlook
The emergence of COVID-19, in combination with steps taken by the Bank of Canada and all levels of government in response to the ongoing disruption, negatively impacted our financial performance in the second quarter and is expected to continue to do so until economic conditions normalize.
Strong branch-raised deposit growth and capital market issuances in previous quarters, combined with our diversified funding strategy, provided a robust funding position through this market disruption. Branch-raised deposits increased 5% this quarter and 20% compared to last year, with the sequential growth driven primarily by CWB Trust Services. Beginning in March, market disruption affected the availability of capital market funding channels and the cost effectiveness of the securitization market. Access to the broker market was not impacted by ongoing market disruption, however, funding costs were slow to decline in comparison to the drop in the prime interest rate due to a higher demand for liquidity. Government programs implemented to stabilize funding
CWB 2020 Second Quarter Report 8
Management’s Discussion and Analysis
channels began to take effect in April. Several of these programs are available to us and we, along with numerous other Canadian banks, chose to access the Bank of Canada’s Standing Term Liquidity Facility (STLF). Advances under the STLF provide an additional source of liquidity while financial markets continue to normalize. During this period of market volatility and consistent with our conservative risk appetite, we prudently chose to maintain higher liquidity levels.
Loan growth was 2% this quarter, consistent with 2% growth last year and an increase from 1% last quarter, despite the negative impact of market disruption related to COVID-19. Draws on existing lines of credit and the impact of payment deferrals were not significant drivers of net loan growth during the second quarter. New funding this quarter was strong and consisted of loans in our pipeline prior to this period of disruption, which remained within our risk appetite as a result of our prudent underwriting guidelines.
The performing loan allowance for credit losses is our most significant accounting estimate, using an expected credit loss (ECL) model under IFRS 9 Financial Instruments (IFRS 9) that considers past performance and forward-looking macroeconomic variables. Our economic forecasts are calibrated to an average of the large Canadian banks’ macroeconomic forecasts and reflect a severe economic decline followed by a recovery supported by the unprecedented levels of government stimulus. Our estimated quarterly performing loan provision for credit losses increased significantly to 27 basis points as a percentage of average loans, compared to one basis point a year ago and three basis points last quarter.
Gross impaired loans increased 12% this quarter, primarily related to oil and gas service providers in Alberta that were experiencing financial hardship prior to this period of disruption. The impaired loan provision for credit losses represented 22 basis points of average loans, consistent with one year ago and up from 15 basis points last quarter. Impaired loan provisions and write-offs remain consistent with our historical experience.
The impact on our portfolio of consecutive decreases in the prime interest rate in the month of March and financial market disruption, in addition to increased liquidity levels, resulted in net interest margin compression. Non-interest expenses remained relatively flat compared to last quarter as we prudently managed expenses and delayed certain activities to promote social distancing. We maintained targeted spending to support our key strategic priorities, including submission of our Advanced Internal Ratings Based (AIRB) formal application and our digital transformation.
We maintained a strong capital position under the more conservative Standardized approach for calculating risk-weighted assets with regulatory capital ratios of 9.1% common equity Tier 1 (CET1), 10.5% Tier 1 and 11.9% Total capital at April 30, 2020.
Outlook
The economic impact of COVID-19 has resulted in a significant adverse shock to the Canadian economy, widespread curtailment of economic activity, severe weakness in labour markets, decreased business investment and increased dependence on financial assistance, temporary payment deferrals and subsidy programs. Including market expectations of an economic recovery in the second half of the year, the Canadian economy is expected to contract in calendar 2020. Although this disruption is expected to be temporary, the precise magnitude and duration of the impacts are unknown and dependent on a number of factors outside of our control, including the phased and staggered re-opening of the economy now underway across the country. In light of current circumstances, the financial performance outlook disclosed in our 2019 Annual Report related to net earnings, net interest margin, revenue growth, provision for credit losses, operating leverage, efficiency ratio and loan growth, which were developed based on an assumption of a relatively stable Canadian economy, are no longer achievable for fiscal 2020. While our original forecast anticipated double-digit loan growth, where prudent, we now expect mid-single digit loan growth for fiscal 2020 based on current conditions.
Given the uncertainty of the economic outlook, stress testing was completed this quarter using our AIRB and IFRS 9 models, to simulate the impact of a more severe and prolonged period of challenging economic conditions throughout our geographic footprint. Relative to the forward-looking macroeconomic scenario used to estimate our allowance for credit losses for performing loans this quarter, our stress scenario assumed a deeper initial decline in GDP, lower oil prices, and significantly higher levels of unemployment that recover at a much slower pace, remaining worse than pre-recession levels through the duration of 2021. Under this scenario, our performing loan allowance is estimated to increase to $132 million, or $21 million (19%) higher than our recorded performing loan allowance at April 30, 2020. Considering the results of this stress test, we remain confident in our ability to deliver positive earnings for shareholders while we maintain financial stability, our current dividend, and a strong capital position despite the uncertain economic outlook. As forecasts surrounding the impact of COVID-19 on the economy and the timing of recovery continue to evolve, we expect higher volatility in the estimated performing loan allowance and provision for credit losses, which, under IFRS 9, are sensitive to changes in forward-looking economic conditions.
CWB 2020 Second Quarter Report 9
Management’s Discussion and Analysis
Consecutive Bank of Canada rate cuts began in March and are not fully reflected in the second quarter net interest margin of 2.40%. Net interest margin for the month of April, which reflects the full impact of consecutive prime interest rate decreases, was approximately 2.30%. Net interest margin will continue to be impacted by any further Bank of Canada policy interest rate changes, competitive deposit pricing factors, changes to the cost-effectiveness or accessibility of funding channels, liquidity levels, loan growth, adjustments to loan pricing and the ability of our clients to recommence contractual payments following the completion of payment deferral periods. In assessing deposit rate pricing, benefits to net interest margin are balanced against maintenance of branch-raised deposit balances to support liquidity. Net interest margin is expected to remain compressed until interest rates rise from historically low levels and funding costs rebalance in line with market interest rates.
Targeted spending on business transformation activities and investments in digital capabilities continues, and is expected to accelerate from the current trend as market conditions stabilize. We leveraged our current online and digital capabilities to support more of our clients this quarter and continued enhancements are an integral part of our commitment to maximize shareholder value over the long-term. We remain committed to disciplined expense control, and expect reduced levels of certain expenses in light of the current operating environment. Excluding the impact of the upcoming wealth management acquisition, which will close on June 1st, we expect low single-digit non-interest expense growth in fiscal 2020.
The common share dividend declared on May 28, 2020 of $0.29 per share is consistent with the prior quarter and 7% higher than the dividend declared one year ago. In March, OSFI mandated that federally-regulated financial institutions suspend dividend increases to support the economy and the maintenance of strong capital positions. We are comfortable that our current dividend level remains appropriate given our strong capital position and the results of ongoing stress testing and scenario analyses.
Risk Management
The emergence of COVID-19 and the potential for prolonged adverse general business and economic conditions combined with a low interest rate environment has elevated certain risk factors that may impact our financial performance. We are well positioned to manage these risks. We maintain an integrated and disciplined approach to risk management, which guides us in prudent risk-taking aligned with our balanced growth strategic objectives and risk appetite. We continue to manage the evolving risks associated with COVID-19 within our existing framework. Our capital and liquidity positions remain strong and we are confident that our talented teams, supported by our strong, well-diversified balance sheet, will enable us to successfully navigate through this market disruption and maintain our focus on execution of targeted strategic initiatives. Comprehensive details on the risks that may impact our operations can be found in the Risk Management section of the annual MD&A. Significant risk impacts arising from ongoing market disruption are described below.
Credit Risk
To limit the spread of COVID-19, businesses across many industries have ceased or substantially reduced operations for an indeterminate period in response to government mandates to close non-essential businesses, resulting in employee layoffs or furloughs, with small- and medium-sized businesses particularly hard hit. Programs put in place by government agencies have provided relief to our clients, however, extended periods of curtailed economic activity, as well as resulting high levels of unemployment and existing levels of household debt may adversely impact our credit risk and could result in elevated credit loss experience in future periods. Prolonged adverse economic conditions also have the potential to impact the market value of underlying collateral securing our loans.
As we work with our clients on a case-by-case basis to consider payment deferral requests or access to government programs, we simultaneously triage our loan portfolio to assess evolving risk profiles. We have expanded our special asset management unit to support our branch teams as we work through the market disruption and economic recovery. Our exposure within industries particularly affected by the economic shutdown is well-diversified and supported by high-quality, resilient borrowers. Our strong credit risk management framework and risk appetite, including well-established underwriting standards, secured lending with conservative loan-to-value, and proactive approach to working with clients through difficult periods, has proven to be very effective, as demonstrated by customarily low write-offs measured as a percentage of total loans, including through periods of financial uncertainty.
CWB 2020 Second Quarter Report 10
Management’s Discussion and Analysis
Liquidity Risk
Market volatility and prolonged periods of economic stress impact how our clients manage their deposits and loans, which may result in deposit withdrawals and draws on lines of credit as well as loan payment deferrals. Market disruption may also impact our ability to access other funding sources on a cost effective basis.
Despite initial turmoil in funding markets, the Bank of Canada, alongside other federal bodies, was quick to react with various programs to provide system-wide liquidity. Cost of funds across our diversified funding sources continues to normalize. At this stage of the market disruption, we have seen continued robust franchise deposit growth and line of credit utilization consistent with last quarter.
Operational Risk
With over 85% of all employees working remotely, our dependence on remote access to information technology and supporting infrastructure has increased. Prior to the emergence of COVID-19, we regularly updated and tested our procedures and contingency plans for business continuity to ensure our ability to maintain critical operations through periods of business disruption. Our dedicated team and low absenteeism have supported stability within our operations and we have maintained our normal high service levels. Our Information Services team has worked diligently to ensure that all of our teams have uninterrupted remote access to required technology and infrastructure through our secure platforms. We remain vigilant regarding the effectiveness of our risk controls related to increased cyber security and fraud risks, which are typically elevated during volatile periods.
Strategy
Q2 2020 Execution Against Strategic Priorities
Our differentiated market position and transformation-focused strategy as described in the 2019 Annual Report sets the stage for CWB to be a disruptive force in Canadian financial services. While our primary focus during the latter half of the second quarter was supporting our clients and teams through challenging circumstances, we continued to execute on key strategic objectives to enable break-out growth in the years to come.
To create value for the people who choose CWB Transform our capabilities to create enhanced value for clients and strengthen client relationships
Continue to evolve our culture and our employee experience to create value for our people and become a career destination for top talent
Transform and diversify our business to create value for investors through break-out growth and enhanced profitability
Made strong progress on delivery of digital roadmap and remained committed to achievement of key milestones.
Launched #CWBHasYourBack program, providing payment deferrals to bridge our clients through the current challenges. Processed high volumes of client requests and relief applications while maintaining normal high service levels.
Maintained strong personalized service while over 85% of our team members worked remotely. Successfully transitioned more clients onto our existing online and digital service platforms.
Expanded branch and client support centre to assist our frontline teams.
For the first time, CWB recognized by Great Place to Work CanadaTM as one of the 50 Best Workplaces in Canada.
CWB Optimum Mortgage named one of the Top Mortgage Workplaces by Canadian Mortgage Professional magazine.
Enhanced the agility of our teams by fully supporting remote work arrangements while keeping our teams informed using virtual communication channels.
Submitted our AIRB formal application, with approval expected within fiscal 2020.
Announced the acquisition T.E. Wealth and Leon Frazer & Associates, leading providers of financial planning and wealth management services targeting high-net-worth Canadian families, which will close on June 1st.
Strategic Transaction
During the quarter, we announced our upcoming acquisition of iA Investment Counsel Inc., an investment counsellor operating under the brands T.E. Wealth and Leon Frazer & Associates to provide financial planning and wealth management services targeting high-net-worth Canadian families. T.E. Wealth is also one of the largest and most reputable providers of investment management and financial education services to Indigenous communities, with offerings provided under the T.E. Wealth Indigenous Services brand. As at April 30, 2020, total assets under management and advisement of $5.7 billion compares to $6.0 billion when the transaction was announced in early March. The acquisition will close on June 1st with a purchase price of approximately $85 million, subject to final closing adjustments, and is expected to reduce our regulatory capital ratios by approximately 30 basis points.
CWB 2020 Second Quarter Report 11
Management’s Discussion and Analysis
The acquisition is fully aligned to our strategic direction and will enhance our ability to provide broader and deeper investment counselling and planning capabilities, with an extended geographic footprint supporting our continued growth of strong client relationships across the country. The transaction brings our total wealth assets under management, administration and advisement to approximately $8.0 billion, an increase from $2.3 billion at April 30, 2020. The transaction is expected to increase our contribution of non-interest income to total revenue to approximately 13% in fiscal 2021 and support adjusted cash earnings per common share modestly at first, with further accretion beginning in fiscal 2022.
Financial Performance
Net Income and Profitability Ratios
Q2 2020 vs. Q2 2019
Common shareholders’ net income of $51 million and diluted earnings per common share of $0.59 were down 17% from the same quarter last year. Adjusted common shareholders’ net income of $52 million and adjusted cash earnings per common share of $0.60 declined 20% and 19%, respectively. Pre-tax, pre-provision income of $113 million was up 1%. Total revenue was up 2% reflecting stable net interest income and a 25% increase in non-interest income primarily due to net gains on securities. Net interest income remained consistent as the benefit of 7% loan growth and one additional interest-earning day related to the 2020 leap year were offset by a 23 basis point decline in net interest margin. Non-interest expenses increased 3% as continued investment in our teams and technology to support overall business growth and execution of strategic priorities was partially offset by reduced spending on certain expenses in light of the current operating environment. Our 49 basis point provision for credit losses on total loans as a percentage of average loans was 26 basis points higher than the same quarter last year due to an increase in the estimated performing loan allowance for credit losses due to an adverse shift in forward-looking economic conditions and a stable provision on impaired loans.
The smaller decline in common shareholders’ net income compared to adjusted common shareholders’ net income reflects the recognition of a $3 million charge for acquisition-related fair value changes in the second quarter last year related to the successful and accretive acquisition of CWB Maxium Financial (CWB Maxium). The earn-out period concluded in Q2 2019 and no fair value changes were recognized since.
Q2 2020 vs. Q1 2020
Compared to the prior quarter, common shareholders’ net income declined 29% and diluted earnings per common share and adjusted cash earnings per common share were each 28% lower. Pre-tax, pre-provision income was down 5%. Total revenue fell 3% as a 5% decline in net interest income, with the positive impact of 2% loan growth more than offset by a 14 basis point contraction in net interest margin and two fewer interest-earning days, was partially offset by a 23% increase in non-interest income. Non-interest expenses increased 1% primarily reflecting ongoing investment in technology infrastructure. Our provision for credit losses on total loans as a percentage of average loans of 49 basis points was 31 basis points above last quarter reflecting a 24 basis point increase in estimated provisions on performing loans and seven basis point increase in provisions on impaired loans.
YTD 2020 vs. YTD 2019
Common shareholders’ net income of $123 million and diluted earnings per common share of $1.41 were down 4% and 3%, respectively. Adjusted common shareholders’ net income of $125 million and adjusted cash earnings per common share of $1.43 were down 8%. Pre-tax, pre-provision income of $233 million was up 1%. Earnings growth reflects a 3% increase in total revenue, including 2% growth of net interest income and a 12% increase in non-interest income. Higher net interest income was driven by 7% loan growth partially offset by a 15 basis point decrease in net interest margin. Non-interest expenses were 4% higher reflecting business growth and execution of strategic priorities, partially offset by a reduction in certain expenses in light of the current operating environment. Our provision for credit losses on total loans as a percentage of average loans totaled 34 basis points, 10 basis points higher than last year reflecting a 13 basis points higher estimated provision on performing loans partially offset by three basis points lower provision on impaired loans. During 2019, we recognized an $8 million charge for acquisition-related fair value changes, which is reflected in common shareholders’ net income but not in adjusted common shareholders’ net income.

CWB 2020 Second Quarter Report 12
Management’s Discussion and Analysis
ROE and ROA
Compared to last year, the second quarter return on common shareholders’ equity (ROE) of 7.9% was 260 basis points lower and adjusted ROE of 8.0%, which primarily removes the impact of acquisition-related fair value changes, fell 300 basis points due to higher average common shareholders’ equity combined with lower earnings.
ROE and adjusted ROE were each 330 basis points lower than last quarter primarily driven by the decline in earnings.
Year-to-date ROE of 9.5% was 130 basis points lower than last year and adjusted ROE of 9.6%, which excludes the impact of acquisition-related fair value changes, declined 180 basis points due to average common shareholders’ equity growth combined with a decline in earnings.
The second quarter return on assets (ROA) of 0.65% was 20 basis points below last year and 26 basis points lower than prior quarter due to declines in common shareholders’ net income. The year-to-date ROA of 0.78% declined 10 basis points due to average assets growth combined with lower common shareholders’ net income.
Total Revenue
Second quarter total revenue of $214 million grew 2% compared to last year and declined 3% from last quarter. On a year-to-date basis, total revenue of $434 million increased 3% from last year.
Net Interest Income
Q2 2020 vs. Q2 2019
Net interest income of $191 million was consistent with last year reflecting the benefit of 7% loan growth and one additional interest-earning day offset by a 23 basis point decrease in net interest margin. Net interest margin was negatively affected by cumulative reductions in the Bank of Canada policy rate of 150 basis points in March, higher average liquidity levels held in light of ongoing market disruption and the impact of deposit pricing competition, partially offset by a favorable shift in our funding mix due to strong branch-raised deposit growth and a resulting decline in broker deposits.
Reductions in the prime interest rate, which reflect the Bank of Canada rate reductions, negatively impacts net interest margin as deposits do not reprice as quickly or by the same magnitude as our loan portfolio. In assessing deposit rate pricing, benefits to net interest margin are balanced against maintenance of branch-raised deposit balances to support liquidity. The benefit of our lower cost demand and notice deposits is significantly reduced in a very low interest rate environment.
Q2 2020 vs. Q1 2020
Net interest income declined 5% compared to last quarter as the positive impact of 2% loan growth was more than offset by a 14 basis point decrease in net interest margin and two fewer interest-earning days. The decline in net interest margin was largely the result of the same factors noted above in the comparison to the same quarter last year.
YTD 2020 vs. YTD 2019
Net interest income of $392 million was up 2%, reflecting the benefits of 7% loan growth partially offset by a 15 basis point decrease in net interest margin. The decline in net interest margin primarily reflects the same factors noted above.
Non-interest Income
Q2 2020 vs. Q2 2019
Non-interest income of $23 million increased 25% from last year due to net gains on securities related to re-balancing of our cash and securities portfolio through the market disruption that occurred this quarter, partially offset by lower foreign exchange revenue, recorded within ‘other’ non-interest income.
Q2 2020 vs. Q1 2020
Non-interest income was 23% higher than last quarter, largely reflecting higher net gains on securities, partially offset by lower foreign exchange revenue, wealth management fees, retail fees and credit related fees.
YTD 2020 vs. YTD 2019
Non-interest income of $42 million was up 12%, primarily related to net gains on securities and higher credit related fees resulting from loan growth, partially offset by decreased foreign exchange revenue.
CWB 2020 Second Quarter Report 13
Management’s Discussion and Analysis
Acquisition-related Fair Value Changes
There were no acquisition-related fair value changes this year, compared to $3 million in the second quarter and $8 million year-to-date last year, reflecting the completion of the earn-out period on February 28, 2019 for the contingent consideration related to the successful and accretive acquisition of CWB Maxium.
Non-interest Expenses
Q2 2020 vs. Q2 2019
Non-interest expenses of $102 million were up 3% ($3 million) primarily reflecting a 5% ($3 million) increase in salaries and benefits driven by hiring activity to support overall business growth and execution of strategic priorities along with annual salary increments. We remain committed to balance strong fiscal responsibility with the effective execution of our strategic focus on people, process and infrastructure to support our full-service client experience and future growth.
Q2 2020 vs. Q1 2020
Non-interest expenses were 1% ($1 million) higher primarily due to a 5% ($1 million) increase in premises and equipment expenses related to ongoing investment in technology infrastructure.
YTD 2020 vs. YTD 2019
Non-interest expenses increased 4% ($9 million) primarily due to 7% ($9 million) growth of salaries and benefits, reflecting the same factors noted above in the quarterly comparison to the same quarter last year.
Efficiency ratio and operating leverage
The second quarter efficiency ratio of 47.1%, which measures adjusted non-interest expenses divided by total revenue, increased compared to 46.8% last year and 45.5% in the previous quarter. On a year-to-date basis, the efficiency ratio of 46.3% increased from 45.6%. The increase from last year and last quarter primarily reflects constrained revenue growth in the current low interest rate environment and, sequentially, two fewer interest-earning days this quarter.
Operating leverage, calculated as the growth rate of total revenue less the growth rate of adjusted non-interest expenses over the same period last year, was negative 0.8%, compared to negative 3.1% last year and negative 2.6% last quarter. Prudent expense management partially offset the impact of lower revenue growth, resulting in an improvement in operating leverage during the quarter. On a year-to-date basis, operating leverage of negative 1.7% was generally consistent with negative 1.4% last year.
Income Taxes
The second quarter effective income tax rate was 26.2%, consistent with the prior quarter and down 50 basis points from last year. On a year-to-date basis, the effective income tax rate was 26.2%, down 40 basis points compared to last year. Decreases from last year primarily reflect the benefit of sequential 1% Alberta corporate income tax reductions effective July 1, 2019 and January 1, 2020. Further reductions of 1% will be effective on each of January 1, 2021 and 2022. The full year impact of a 1% decline in the Alberta corporate income tax rate is an approximate 60 basis point reduction in our effective tax rate.
Comprehensive Income
Comprehensive income is comprised of net income and other comprehensive income (OCI), all net of income taxes.
Q2 2020 vs. Q2 2019
Comprehensive income of $155 million was up 53% ($54 million) from last year, resulting from a $64 million increase in OCI partially offset by a $10 million decrease in net income. The increase in OCI, net of tax, was primarily driven by increases in the change in fair value of derivatives designated as cash flow hedges ($61 million) and the change in fair value of debt securities measured at FVOCI ($2 million) due to the decline in market interest rates. Our cash and securities portfolio, classified at FVOCI, is comprised primarily of debt securities issued or guaranteed by Canada, a province or a municipality. Fluctuations in value are generally attributed to changes in interest rates, movements in market credit spreads and shifts in the interest rate curve.
CWB 2020 Second Quarter Report 14
Management’s Discussion and Analysis
Q2 2020 vs. Q1 2020
Comprehensive income increased 73% ($65 million) on a sequential basis due to an $86 million increase in OCI partially offset by a $21 million decline in net income. Higher OCI, net of tax, resulted from increases in the change in fair value of derivatives designated as cash flow hedges ($76 million) and the change in fair value of debt securities measured at FVOCI ($10 million).
YTD 2020 vs. YTD 2019
Comprehensive income of $244 million was up 9% ($21 million), resulting from a $24 million increase in OCI and $3 million lower net income. Changes in OCI, net of tax, mainly resulted from a higher change in fair value of derivatives designated as cash flow hedges ($26 million), as well as equities measured at FVOCI ($12 million) due to execution of the planned divestiture of our preferred share investment portfolio, partially offset by a lower change in fair value of debt securities measured at FVOCI ($14 million).
Balance Sheet
Total assets were $33.0 billion, up 10% from a year ago and 4% from last quarter.
Cash and Securities
Our cash and securities portfolio is comprised of high quality debt instruments that are typically held until maturity. Cash, securities and securities purchased under resale agreements totaled $3.1 billion, compared to $2.3 billion last year and last quarter. Average balances of cash and securities for the three months ended April 30, 2020 of $2.7 billion were up 14% from last year and 13% from last quarter. On a year-to-date basis, average balances of cash and securities of $2.6 billion were 6% higher than last year.
Our liquidity management is based on an internal stressed cash flow model, with the level of cash and securities driven primarily by the term structure of both assets and liabilities, and the liquidity structure of liabilities. Consistent with our conservative risk appetite, we continue to maintain higher liquidity levels to augment our already strong liquidity position and manage market disruption, despite the negative impact on net interest margin.
In the second quarter, the Bank of Canada put several facilities in place to support liquidity in the financial system, several of which are available to us, including the Standing Term Liquidity Facility (STLF), the Insured Mortgage Purchase Program and the Contingent Term Repo Facility. To broaden funding access in light of recent market disruption, we, along with numerous other Canadian banks, chose to access the STLF. Under the STLF, eligible financial institutions can raise liquidity by pledging a broad set of collateral, including mortgages. Our initial advance from the Bank of Canada of $350 million was repaid on April 30, 2020 and immediately replaced by a second advance of $350 million. The outstanding advance at quarter-end has a July 29, 2020 maturity date and bears interest at 0.95% per annum.
The composition of our total liquid assets supports ongoing compliance with the OSFI Liquidity Adequacy Requirements (LAR) guideline and our own internal policies. On December 5, 2019, OSFI released the final version of Guideline B-6: Liquidity Principles (Guideline B-6), which complements the LAR guideline and sets out OSFI's expectations for how deposit-taking institutions should manage liquidity risk. Guideline B-6 was effective January 1, 2020 and the changes had no significant impact on our liquidity management.
Net unrealized gains on cash and securities recorded on the balance sheet totaled $16 million compared to net unrealized losses of $30 million last year and $1 million last quarter. During the quarter, we realized $6 million of net gains on securities related to re-balancing our cash and securities portfolio through ongoing market disruption.

CWB 2020 Second Quarter Report 15
Management’s Discussion and Analysis
Loans
Total loans, excluding the allowance for credit losses, of $29.2 billion increased 7% ($1.8 billion) from last year and 2% ($0.4 billion) from the prior quarter.
% Change from
April 30
2019
(unaudited) April 30
2020
January 31
2020
April 30
2019
(millions)
General commercial loans $ 9,548 $ 8,687 $ 8,004 19 %
Personal loans and mortgages 5,812 5,803 5,407 7
Equipment financing and leasing 5,160 5,166 4,877 6
Commercial mortgages 5,149 5,465 4,990 3
Real estate project loans 3,316 3,463 3,935 (16)
Oil and gas production loans 213 182 140 52
Total loans outstanding(1) $ 29,198 $ 28,766 $ 27,353 7 %
(1) Total loans outstanding by lending sector exclude the allowance for credit losses.
Q2 2020 vs. Q2 2019
Very strong growth in general commercial loans reflects ongoing efforts to target business owner clients to increase full-service relationships across our national footprint. General commercial loans now represent 33% of the total loan portfolio, compared to 29% one year ago.
The 7% increase within the personal loans and mortgages category primarily reflects strong “A” mortgage portfolio growth, which largely consists of residential mortgages eligible for bulk portfolio insurance, to support our participation in the National Housing Act Mortgage Backed Securities (NHA MBS) program.
Total loans of $3.0 billion within our broker-sourced residential mortgage business, CWB Optimum Mortgage (CWB Optimum), increased 1% from last year. During the past year, reduced housing market activity has resulted in increased competition in certain regions. Net growth was adversely impacted by higher than expected payout levels over the latter half of 2019 and the first quarter of 2020 due to competitive pressures and the refinement of our risk appetite within the alternative mortgage market. This refinement includes a preference for stronger borrowers. We are focused to maintain existing client relationships through client retention programs while maintaining an acceptable risk profile. Ongoing enhancements to our “A” mortgage lending capabilities and more risk-sensitive pricing with the adoption of AIRB are expected to support stronger client retention and new growth. Alternative mortgages within CWB Optimum represent approximately 50% of the personal loans and mortgages portfolio, down from 53% one year ago, and 10% of total loans, consistent with last year. Ontario continues to represent the largest geographic exposure by province within CWB Optimum’s portfolio at 53% of total, compared to 55% last year.
Equipment financing and leasing growth of 6% reflects increases across all provinces. Commercial mortgages increased 3% compared to last year reflecting new lending volumes across British Columbia (BC) and Alberta. Oil and gas production loans were up $73 million primarily due to participation in syndications with existing clients. Our exposure to oil and gas production and service businesses represent 1% and 2%, respectively, of our total loans.
Real estate project loans declined 16%, driven by successful project completions, primarily in BC. Reduced demand for condominiums and high land prices negatively impacted project starts in BC during fiscal 2019 and 2020, which have been further impacted by curtailed economic activity related to the emergence of COVID-19.
Q2 2020 vs. Q1 2020
Overall utilization of outstanding commercial and personal lines of credit has remained stable compared to last quarter and the impact of deferred loan payments did not significantly contribute to loan growth this quarter.
General commercial loans increased 10%, approximately half of which reflects a reclassification of commercial mortgages to general commercial loans during the quarter to reflect lending characteristics of certain loans primarily originated in prior years. The remainder of the growth was driven by contributions from all business lines.
Personal loans and mortgages remained consistent with last quarter as a 2% increase in alternative mortgages was offset by a slight decline in “A” mortgages. CWB Optimum mortgage growth reflects higher retention rates, which increased from 67% to 71%, and lower payouts, largely due to our focus on personalized service and competitive risk-sensitive pricing. New originations in the second quarter were driven by alternative mortgages secured via first mortgages carrying a weighted average loan-to-value at initiation of 68%. The average size of CWB Optimum mortgages originated in the first quarter was $370,000 and the average size of mortgages outstanding at April 30, 2020 was $302,000.
CWB 2020 Second Quarter Report 16
Management’s Discussion and Analysis
Commercial mortgages decreased 6% during the quarter primarily due to the reclassification of certain loans to the general commercial portfolio, partially offset by the impact of strong new lending volumes in BC.
Equipment financing and leasing remained consistent with quarter as growth in Ontario was offset by a reduction in BC and Alberta.
Real estate project loans declined 4% primarily driven by the impact of successful project completions, mainly in BC. Oil and gas production loans were up $31 million as a result of participation in syndicated facilities that remain within our risk appetite.
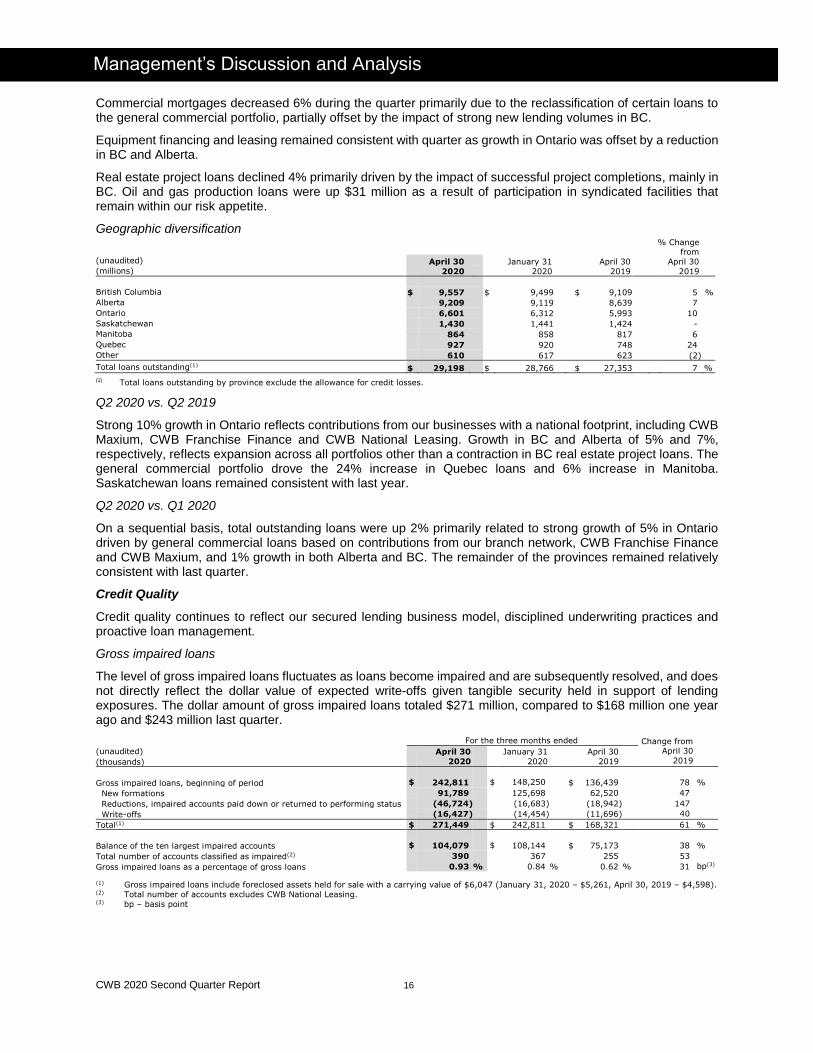
Geographic diversification % Change
from
April 30
2019
(unaudited) April 30
2020
January 31
2020
April 30
2019
(millions)
British Columbia $ 9,557 $ 9,499 $ 9,109 5 %
Alberta 9,209 9,119 8,639 7
Ontario 6,601 6,312 5,993 10
Saskatchewan 1,430 1,441 1,424 -
Manitoba 864 858 817 6
Quebec 927 920 748 24
Other 610 617 623 (2)
Total loans outstanding(1) $ 29,198 $ 28,766 $ 27,353 7 %
(1) Total loans outstanding by province exclude the allowance for credit losses.
Q2 2020 vs. Q2 2019
Strong 10% growth in Ontario reflects contributions from our businesses with a national footprint, including CWB Maxium, CWB Franchise Finance and CWB National Leasing. Growth in BC and Alberta of 5% and 7%, respectively, reflects expansion across all portfolios other than a contraction in BC real estate project loans. The general commercial portfolio drove the 24% increase in Quebec loans and 6% increase in Manitoba. Saskatchewan loans remained consistent with last year.
Q2 2020 vs. Q1 2020
On a sequential basis, total outstanding loans were up 2% primarily related to strong growth of 5% in Ontario driven by general commercial loans based on contributions from our branch network, CWB Franchise Finance and CWB Maxium, and 1% growth in both Alberta and BC. The remainder of the provinces remained relatively consistent with last quarter.
Credit Quality
Credit quality continues to reflect our secured lending business model, disciplined underwriting practices and proactive loan management.
Gross impaired loans
The level of gross impaired loans fluctuates as loans become impaired and are subsequently resolved, and does not directly reflect the dollar value of expected write-offs given tangible security held in support of lending exposures. The dollar amount of gross impaired loans totaled $271 million, compared to $168 million one year ago and $243 million last quarter.
For the three months ended Change from April 30
2019
(unaudited)
April 30
2020
January 31
2020
April 30
2019
(thousands)
Gross impaired loans, beginning of period $ 242,811 $ 148,250
125,698
(16,683)
(14,454)
242,811143,990
$ 136,439 78 %
New formations 91,789 125,698 62,520 47
Reductions, impaired accounts paid down or returned to performing status (46,724) (16,683) (18,942) 147 (
Write-offs (16,427) (14,454) (11,696) 40
Total(1) $ 271,449 $ 242,811 $ 168,321 61 %
Balance of the ten largest impaired accounts $ 104,079 $ 108,144 $ 75,173 38 %
Total number of accounts classified as impaired(2) 390 367 255 53
Gross impaired loans as a percentage of gross loans 0.93 % 0.84 % 0.62 % 31 bp(3)
(2) (1) Gross impaired loans include foreclosed assets held for sale with a carrying value of $6,047 (January 31, 2020 – $5,261, April 30, 2019 – $4,598). (2) Total number of accounts excludes CWB National Leasing. (3) bp – basis point
CWB 2020 Second Quarter Report 17
Management’s Discussion and Analysis
The dollar level of gross impaired loans represented 0.93% of gross loans, up from 0.62% last year and 0.84% in the previous quarter. The increase in impaired loans compared to last quarter was primarily related to two oil and gas service providers within the general commercial portfolio in Alberta that were experiencing financial hardship prior to this period of disruption, partially offset by the resolution of a portion of a significant Alberta-based commercial mortgage connection, impaired last quarter, with no realized credit loss.
As we work with our clients on a case-by-case basis to assess requests for payment deferrals or access to government programs, we simultaneously triage our loan portfolio to assess evolving risk profiles, with a focus on portfolios particularly affected by the economic shutdown, including real estate project loans, the hospitality industry, equipment financing, and oil and gas production and service businesses. Our exposure within these industries is well-diversified and supported by high-quality, resilient borrowers. We continue to carefully monitor the entire loan portfolio for additional signs of weakness and work closely with borrowers experiencing financial hardship. We have expanded our special asset management unit to support our branch teams as we work through the market disruption and economic recovery. Our strong credit risk management framework, including well-established underwriting standards, secured lending with conservative loan-to-value, and proactive approach to working with clients through difficult periods, has proven to be very effective, as demonstrated by customarily low write-offs measured as a percentage of total loans, including through periods of financial uncertainty.
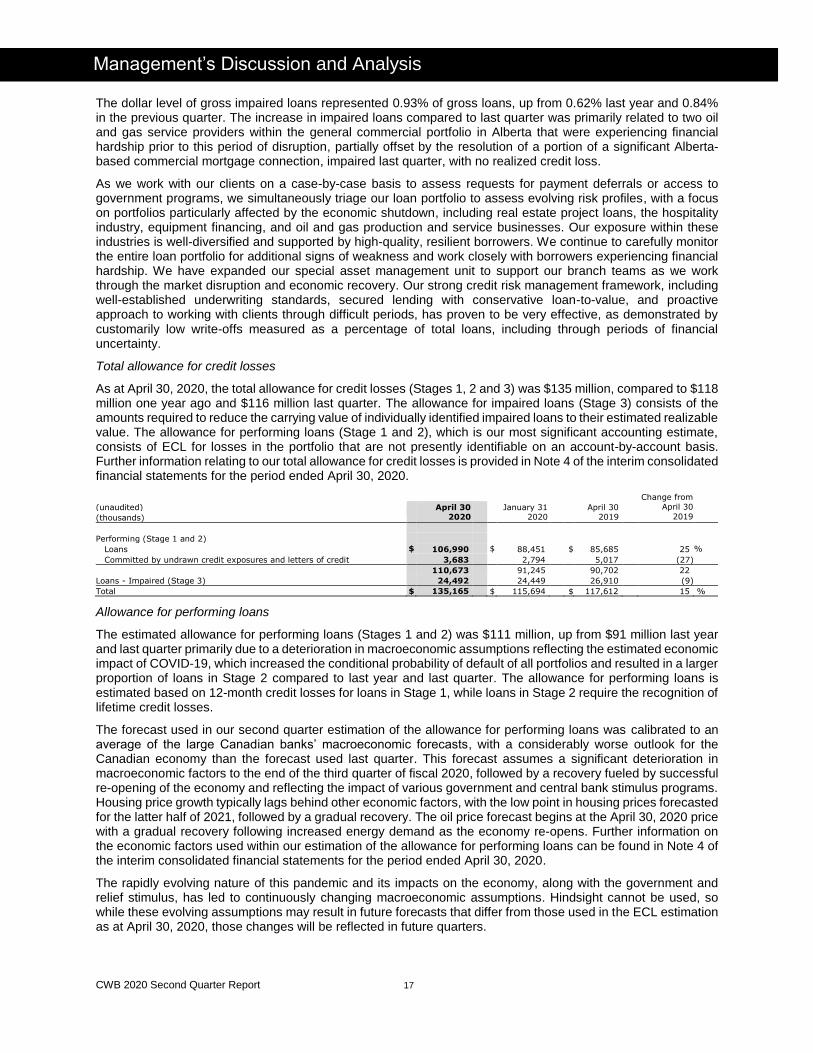
Total allowance for credit losses
As at April 30, 2020, the total allowance for credit losses (Stages 1, 2 and 3) was $135 million, compared to $118 million one year ago and $116 million last quarter. The allowance for impaired loans (Stage 3) consists of the amounts required to reduce the carrying value of individually identified impaired loans to their estimated realizable value. The allowance for performing loans (Stage 1 and 2), which is our most significant accounting estimate, consists of ECL for losses in the portfolio that are not presently identifiable on an account-by-account basis. Further information relating to our total allowance for credit losses is provided in Note 4 of the interim consolidated financial statements for the period ended April 30, 2020.
Change from
April 30
2019
(unaudited)
April 30 2020
January 31
2020
April 30 2019
(thousands)
Performing (Stage 1 and 2)
$ 9
7
,
4
34
88,451
Loans $ 106,990 $
3,
2
3
9
88,451 $ 85,685 25 %
Committed by undrawn credit exposures and letters of credit 3,683 1
0
0
,6
7
3
2,794 5,017 (27)
110,673 2
4
,
49
2
91,245 90,702 22
Loans - Impaired (Stage 3) 24,492
$
1
25
,
1
65
24,449 26,910 (9)
Total $ 135,165
$
$
9
7,
4
3
4
115,694 $ 117,612 15 %
Allowance for performing loans
The estimated allowance for performing loans (Stages 1 and 2) was $111 million, up from $91 million last year and last quarter primarily due to a deterioration in macroeconomic assumptions reflecting the estimated economic impact of COVID-19, which increased the conditional probability of default of all portfolios and resulted in a larger proportion of loans in Stage 2 compared to last year and last quarter. The allowance for performing loans is estimated based on 12-month credit losses for loans in Stage 1, while loans in Stage 2 require the recognition of lifetime credit losses.
The forecast used in our second quarter estimation of the allowance for performing loans was calibrated to an average of the large Canadian banks’ macroeconomic forecasts, with a considerably worse outlook for the Canadian economy than the forecast used last quarter. This forecast assumes a significant deterioration in macroeconomic factors to the end of the third quarter of fiscal 2020, followed by a recovery fueled by successful re-opening of the economy and reflecting the impact of various government and central bank stimulus programs. Housing price growth typically lags behind other economic factors, with the low point in housing prices forecasted for the latter half of 2021, followed by a gradual recovery. The oil price forecast begins at the April 30, 2020 price with a gradual recovery following increased energy demand as the economy re-opens. Further information on the economic factors used within our estimation of the allowance for performing loans can be found in Note 4 of the interim consolidated financial statements for the period ended April 30, 2020.
The rapidly evolving nature of this pandemic and its impacts on the economy, along with the government and relief stimulus, has led to continuously changing macroeconomic assumptions. Hindsight cannot be used, so while these evolving assumptions may result in future forecasts that differ from those used in the ECL estimation as at April 30, 2020, those changes will be reflected in future quarters.
CWB 2020 Second Quarter Report 18
Management’s Discussion and Analysis
In estimating the allowance for performing loans, we continue to supplement our modeled ECL to reflect expert credit judgements. These expert credit judgements account for the variability in the results provided by the models and consider the impact of both tail-risk events and the lagging impacts of typical credit cycles. These expert credit judgements also allow us to incorporate the estimated impact of the unprecedented levels of government stimulus and support, which cannot be modelled historically as they have not occurred in the past.
The adverse shift in the economic forecast used to estimate the allowance for performing loans this quarter increased the conditional probability of default of all portfolios, but in particular our small- and medium-sized entities, hotel/motel, and oil and gas production portfolios. Tangible security held and conservative loan-to-value ratios soften the impact of increased probabilities of default on the estimated performing loan allowance and decrease the overall sensitivity of our allowance for credit losses to changes in forecasted economic conditions. The relatively short duration and material amortization or paydown of our loan portfolios also mutes the impact on our allowance for credit losses when loans migrate from Stage 1 to Stage 2.
Given the uncertainty of the current economic outlook, stress testing was completed this quarter using our AIRB and IFRS 9 models, to simulate the impact of a more severe and prolonged period of challenging economic conditions throughout our geographic footprint. Relative to the forward-looking macroeconomic scenario used to estimate our performing loan allowance for credit losses this quarter, our stress scenario considered a deeper initial decline in GDP, lower oil prices, and significantly higher levels of unemployment with recovery at a much slower pace, remaining worse than pre-recession levels through the duration of 2021. Under this scenario, our performing loan allowance is estimated to increase to $132 million, or $21 million (19%) higher than our recorded performing loan allowance at April 30, 2020. Considering the results of this stress test, we remain confident in our ability to deliver positive earnings for shareholders while we maintain financial stability, current dividend levels, and a strong capital position despite the uncertain economic outlook.
Allowance for impaired loans
The allowance for impaired loans (Stage 3) was $24 million, down from $27 million last year and consistent with last quarter. In determining allowances for impaired loans, we establish estimates through detailed analysis of both the overall quality and ultimate marketability of the security held against each impaired account.
Provision for credit losses
The second quarter provision for credit losses on total loans as a percentage of average loans was 49 basis points, compared to 23 basis points last year and 18 basis points last quarter. On a year-to-date basis, the provision for credit losses on total loans as a percentage of average loans was 34 basis points, compared to 24 basis points last year.
For the three months ended Change from April 30
2019
For the six months ended Change from April 30
2019
April 30
2020
January 31
2020
April 30
2019
April 30
2020
April 30
2019
(unaudited)
Provision for credit losses on
impaired loans(1) 0.22 % 0.15 % 0.22 % - bp(2) 0.19 % 0.22 % (3) bp(2)
Provision for credit losses on performing loans(1) 0.27 0.03 0.01 26 0.15 0.02 13
Total 0.49 % 0.18 % 0.23 % 26 0.34 % 0.24 % 10
(1) As a percentage of average loans. (2) bp – basis point
The provision for credit losses on impaired loans continues to reflect our long history of stable loan losses, which compares very favourably to the Canadian banking industry. The provision for credit losses on impaired loans in the second quarter of $15 million, compared to $14 million last year and $11 million last quarter, represented 22 basis points as a percentage of average loans and includes the impact of new impairments and resolutions during the quarter. The estimated provision for credit losses on performing loans of $19 million, compared to $1 million last year and $2 million last quarter, represented 27 basis points as a percentage of average loans and was driven by an adverse shift in forward-looking economic conditions. For further details on the estimation of the allowance for performing loans, see the Allowance for performing loans section above.
On a year-to-date basis, the provision for credit losses on impaired loans of $26 million declined from $29 million last year and represented 19 basis points as a percentage of average loans. The estimated provision for credit losses on performing loans of $22 million increased from $2 million last year and represented 15 basis points as a percentage of average loans.
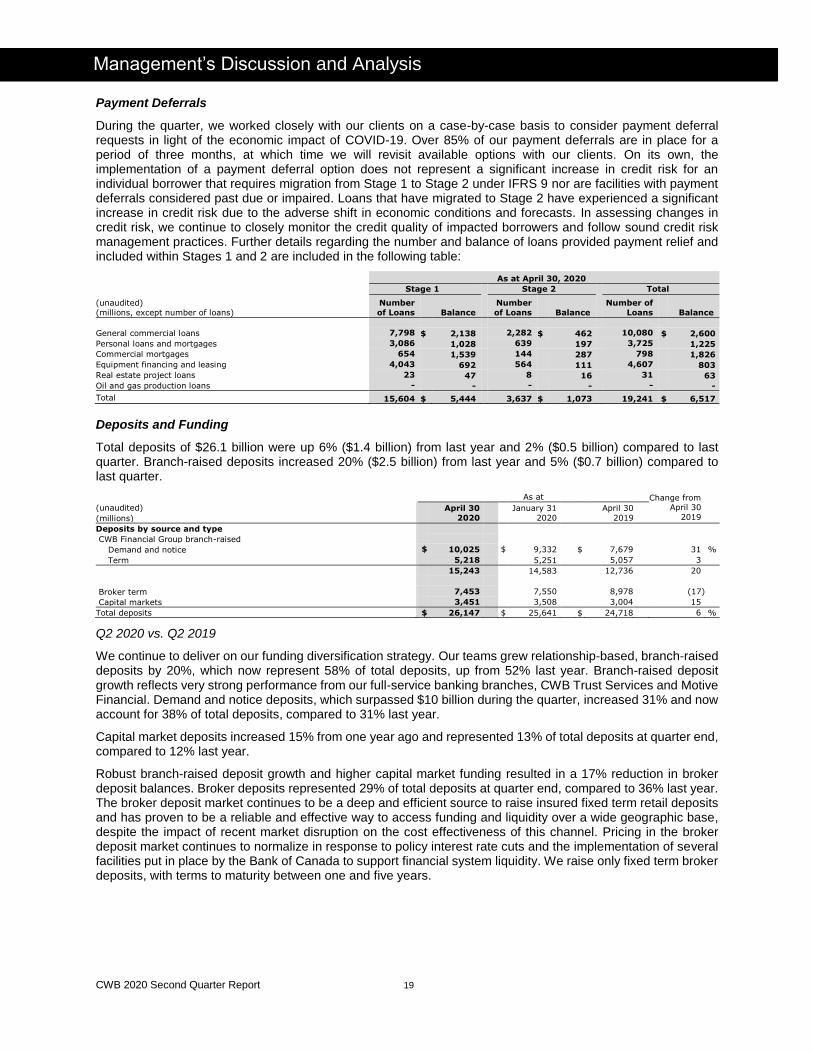
CWB 2020 Second Quarter Report 19
Management’s Discussion and Analysis
Payment Deferrals
During the quarter, we worked closely with our clients on a case-by-case basis to consider payment deferral requests in light of the economic impact of COVID-19. Over 85% of our payment deferrals are in place for a period of three months, at which time we will revisit available options with our clients. On its own, the implementation of a payment deferral option does not represent a significant increase in credit risk for an individual borrower that requires migration from Stage 1 to Stage 2 under IFRS 9 nor are facilities with payment deferrals considered past due or impaired. Loans that have migrated to Stage 2 have experienced a significant increase in credit risk due to the adverse shift in economic conditions and forecasts. In assessing changes in credit risk, we continue to closely monitor the credit quality of impacted borrowers and follow sound credit risk management practices. Further details regarding the number and balance of loans provided payment relief and included within Stages 1 and 2 are included in the following table:
As at April 30, 2020
Stage 1 Stage 2 Total
(unaudited)
(millions, except number of loans)
Number
of Loans Balance
Number
of Loans Balance
Number of
Loans Balance
General commercial loans 7,798 $ 2,138 2,282 $ 462 10,080 $ 2,600
Personal loans and mortgages 3,086 1,028 639 197 3,725 1,225
Commercial mortgages 654 1,539 144 287 798 1,826
Equipment financing and leasing 4,043 692 564 111 4,607 803
Real estate project loans 23 47 8 16 31 63
Oil and gas production loans - - - - - -
Total 15,604 $ 5,444 3,637 $ 1,073 19,241 $ 6,517
Deposits and Funding
Total deposits of $26.1 billion were up 6% ($1.4 billion) from last year and 2% ($0.5 billion) compared to last quarter. Branch-raised deposits increased 20% ($2.5 billion) from last year and 5% ($0.7 billion) compared to last quarter.
As at Change from April 30
2019
(unaudited)
April 30
2020
January 31
2020
April 30
2019
(millions)
Deposits by source and type
CWB Financial Group branch-raised
Demand and notice $ 10,025 $ 9,332 $ 7,679 31 %
Term 5,218 5,251 5,057 3
15,243 14,583 12,736 20
Broker term 7,453 7,550 8,978 (17)
Capital markets 3,451 3,508 3,004 15
Total deposits $ 26,147 $ 25,641 $ 24,718 6
%
Q2 2020 vs. Q2 2019
We continue to deliver on our funding diversification strategy. Our teams grew relationship-based, branch-raised deposits by 20%, which now represent 58% of total deposits, up from 52% last year. Branch-raised deposit growth reflects very strong performance from our full-service banking branches, CWB Trust Services and Motive Financial. Demand and notice deposits, which surpassed $10 billion during the quarter, increased 31% and now account for 38% of total deposits, compared to 31% last year.
Capital market deposits increased 15% from one year ago and represented 13% of total deposits at quarter end, compared to 12% last year.
Robust branch-raised deposit growth and higher capital market funding resulted in a 17% reduction in broker deposit balances. Broker deposits represented 29% of total deposits at quarter end, compared to 36% last year. The broker deposit market continues to be a deep and efficient source to raise insured fixed term retail deposits and has proven to be a reliable and effective way to access funding and liquidity over a wide geographic base, despite the impact of recent market disruption on the cost effectiveness of this channel. Pricing in the broker deposit market continues to normalize in response to policy interest rate cuts and the implementation of several facilities put in place by the Bank of Canada to support financial system liquidity. We raise only fixed term broker deposits, with terms to maturity between one and five years.
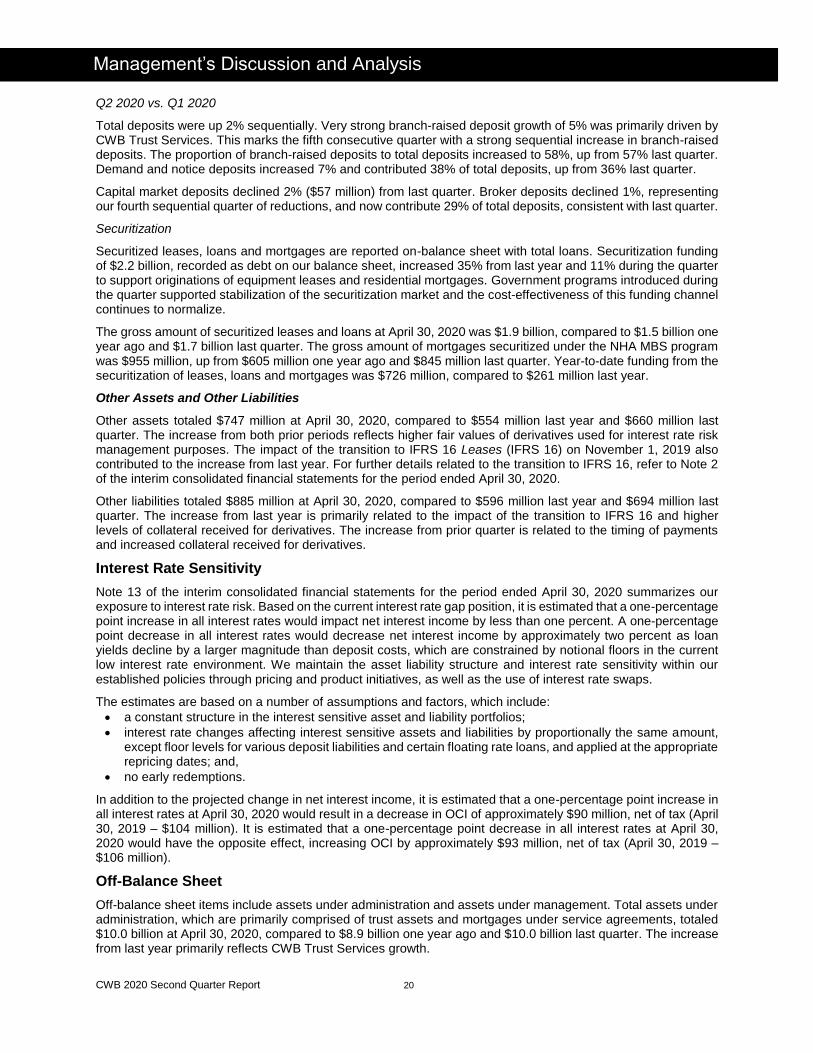
CWB 2020 Second Quarter Report 20
Management’s Discussion and Analysis
Q2 2020 vs. Q1 2020
Total deposits were up 2% sequentially. Very strong branch-raised deposit growth of 5% was primarily driven by CWB Trust Services. This marks the fifth consecutive quarter with a strong sequential increase in branch-raised deposits. The proportion of branch-raised deposits to total deposits increased to 58%, up from 57% last quarter. Demand and notice deposits increased 7% and contributed 38% of total deposits, up from 36% last quarter.
Capital market deposits declined 2% ($57 million) from last quarter. Broker deposits declined 1%, representing our fourth sequential quarter of reductions, and now contribute 29% of total deposits, consistent with last quarter.
Securitization
Securitized leases, loans and mortgages are reported on-balance sheet with total loans. Securitization funding of $2.2 billion, recorded as debt on our balance sheet, increased 35% from last year and 11% during the quarter to support originations of equipment leases and residential mortgages. Government programs introduced during the quarter supported stabilization of the securitization market and the cost-effectiveness of this funding channel continues to normalize.
The gross amount of securitized leases and loans at April 30, 2020 was $1.9 billion, compared to $1.5 billion one year ago and $1.7 billion last quarter. The gross amount of mortgages securitized under the NHA MBS program was $955 million, up from $605 million one year ago and $845 million last quarter. Year-to-date funding from the securitization of leases, loans and mortgages was $726 million, compared to $261 million last year.
Other Assets and Other Liabilities
Other assets totaled $747 million at April 30, 2020, compared to $554 million last year and $660 million last quarter. The increase from both prior periods reflects higher fair values of derivatives used for interest rate risk management purposes. The impact of the transition to IFRS 16 Leases (IFRS 16) on November 1, 2019 also contributed to the increase from last year. For further details related to the transition to IFRS 16, refer to Note 2 of the interim consolidated financial statements for the period ended April 30, 2020.
Other liabilities totaled $885 million at April 30, 2020, compared to $596 million last year and $694 million last quarter. The increase from last year is primarily related to the impact of the transition to IFRS 16 and higher levels of collateral received for derivatives. The increase from prior quarter is related to the timing of payments and increased collateral received for derivatives.
Interest Rate Sensitivity
Note 13 of the interim consolidated financial statements for the period ended April 30, 2020 summarizes our exposure to interest rate risk. Based on the current interest rate gap position, it is estimated that a one-percentage point increase in all interest rates would impact net interest income by less than one percent. A one-percentage point decrease in all interest rates would decrease net interest income by approximately two percent as loan yields decline by a larger magnitude than deposit costs, which are constrained by notional floors in the current low interest rate environment. We maintain the asset liability structure and interest rate sensitivity within our established policies through pricing and product initiatives, as well as the use of interest rate swaps.
The estimates are based on a number of assumptions and factors, which include:
a constant structure in the interest sensitive asset and liability portfolios;
interest rate changes affecting interest sensitive assets and liabilities by proportionally the same amount, except floor levels for various deposit liabilities and certain floating rate loans, and applied at the appropriate repricing dates; and,
no early redemptions.
In addition to the projected change in net interest income, it is estimated that a one-percentage point increase in all interest rates at April 30, 2020 would result in a decrease in OCI of approximately $90 million, net of tax (April 30, 2019 – $104 million). It is estimated that a one-percentage point decrease in all interest rates at April 30, 2020 would have the opposite effect, increasing OCI by approximately $93 million, net of tax (April 30, 2019 – $106 million).
Off-Balance Sheet
Off-balance sheet items include assets under administration and assets under management. Total assets under administration, which are primarily comprised of trust assets and mortgages under service agreements, totaled $10.0 billion at April 30, 2020, compared to $8.9 billion one year ago and $10.0 billion last quarter. The increase from last year primarily reflects CWB Trust Services growth.
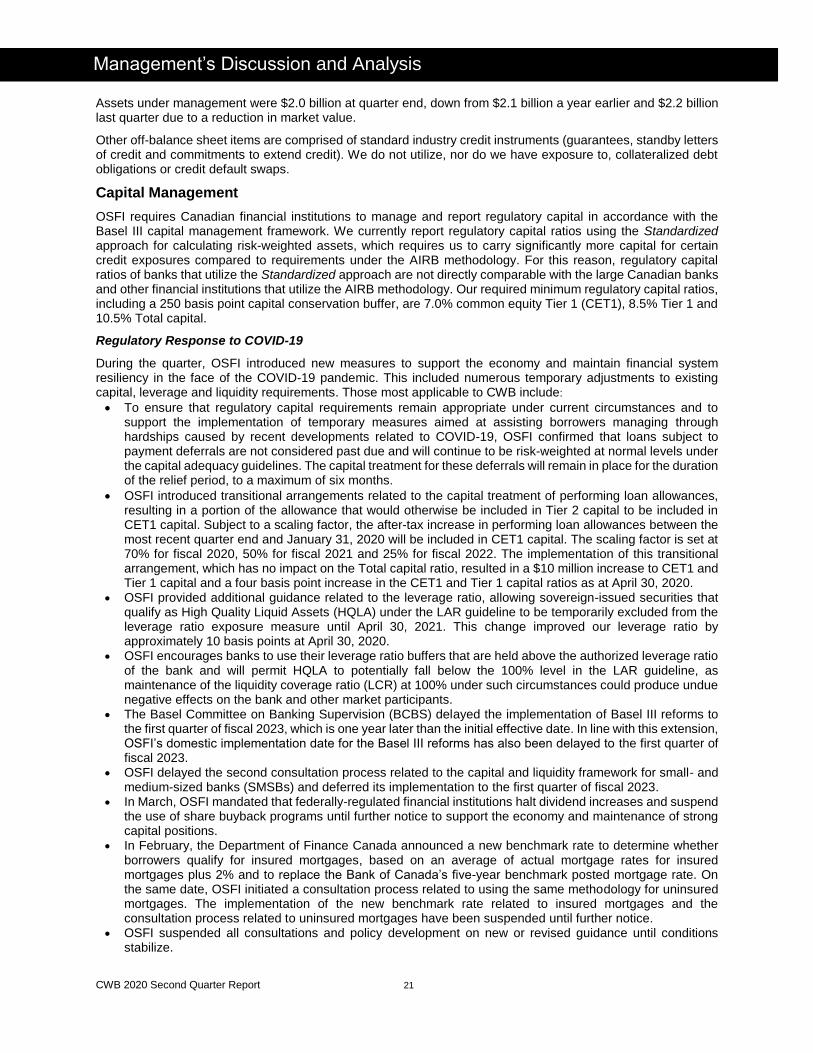
CWB 2020 Second Quarter Report 21
Management’s Discussion and Analysis
Assets under management were $2.0 billion at quarter end, down from $2.1 billion a year earlier and $2.2 billion last quarter due to a reduction in market value.
Other off-balance sheet items are comprised of standard industry credit instruments (guarantees, standby letters of credit and commitments to extend credit). We do not utilize, nor do we have exposure to, collateralized debt obligations or credit default swaps.
Capital Management
OSFI requires Canadian financial institutions to manage and report regulatory capital in accordance with the Basel III capital management framework. We currently report regulatory capital ratios using the Standardized approach for calculating risk-weighted assets, which requires us to carry significantly more capital for certain credit exposures compared to requirements under the AIRB methodology. For this reason, regulatory capital ratios of banks that utilize the Standardized approach are not directly comparable with the large Canadian banks and other financial institutions that utilize the AIRB methodology. Our required minimum regulatory capital ratios, including a 250 basis point capital conservation buffer, are 7.0% common equity Tier 1 (CET1), 8.5% Tier 1 and 10.5% Total capital.
Regulatory Response to COVID-19
During the quarter, OSFI introduced new measures to support the economy and maintain financial system resiliency in the face of the COVID-19 pandemic. This included numerous temporary adjustments to existing capital, leverage and liquidity requirements. Those most applicable to CWB include:
To ensure that regulatory capital requirements remain appropriate under current circumstances and to support the implementation of temporary measures aimed at assisting borrowers managing through hardships caused by recent developments related to COVID-19, OSFI confirmed that loans subject to payment deferrals are not considered past due and will continue to be risk-weighted at normal levels under the capital adequacy guidelines. The capital treatment for these deferrals will remain in place for the duration of the relief period, to a maximum of six months.
OSFI introduced transitional arrangements related to the capital treatment of performing loan allowances, resulting in a portion of the allowance that would otherwise be included in Tier 2 capital to be included in CET1 capital. Subject to a scaling factor, the after-tax increase in performing loan allowances between the most recent quarter end and January 31, 2020 will be included in CET1 capital. The scaling factor is set at 70% for fiscal 2020, 50% for fiscal 2021 and 25% for fiscal 2022. The implementation of this transitional arrangement, which has no impact on the Total capital ratio, resulted in a $10 million increase to CET1 and Tier 1 capital and a four basis point increase in the CET1 and Tier 1 capital ratios as at April 30, 2020.
OSFI provided additional guidance related to the leverage ratio, allowing sovereign-issued securities that qualify as High Quality Liquid Assets (HQLA) under the LAR guideline to be temporarily excluded from the leverage ratio exposure measure until April 30, 2021. This change improved our leverage ratio by approximately 10 basis points at April 30, 2020.
OSFI encourages banks to use their leverage ratio buffers that are held above the authorized leverage ratio of the bank and will permit HQLA to potentially fall below the 100% level in the LAR guideline, as maintenance of the liquidity coverage ratio (LCR) at 100% under such circumstances could produce undue negative effects on the bank and other market participants.
The Basel Committee on Banking Supervision (BCBS) delayed the implementation of Basel III reforms to the first quarter of fiscal 2023, which is one year later than the initial effective date. In line with this extension, OSFI’s domestic implementation date for the Basel III reforms has also been delayed to the first quarter of fiscal 2023.
OSFI delayed the second consultation process related to the capital and liquidity framework for small- and medium-sized banks (SMSBs) and deferred its implementation to the first quarter of fiscal 2023.
In March, OSFI mandated that federally-regulated financial institutions halt dividend increases and suspend the use of share buyback programs until further notice to support the economy and maintenance of strong capital positions.
In February, the Department of Finance Canada announced a new benchmark rate to determine whether borrowers qualify for insured mortgages, based on an average of actual mortgage rates for insured mortgages plus 2% and to replace the Bank of Canada’s five-year benchmark posted mortgage rate. On the same date, OSFI initiated a consultation process related to using the same methodology for uninsured mortgages. The implementation of the new benchmark rate related to insured mortgages and the consultation process related to uninsured mortgages have been suspended until further notice.
OSFI suspended all consultations and policy development on new or revised guidance until conditions stabilize.
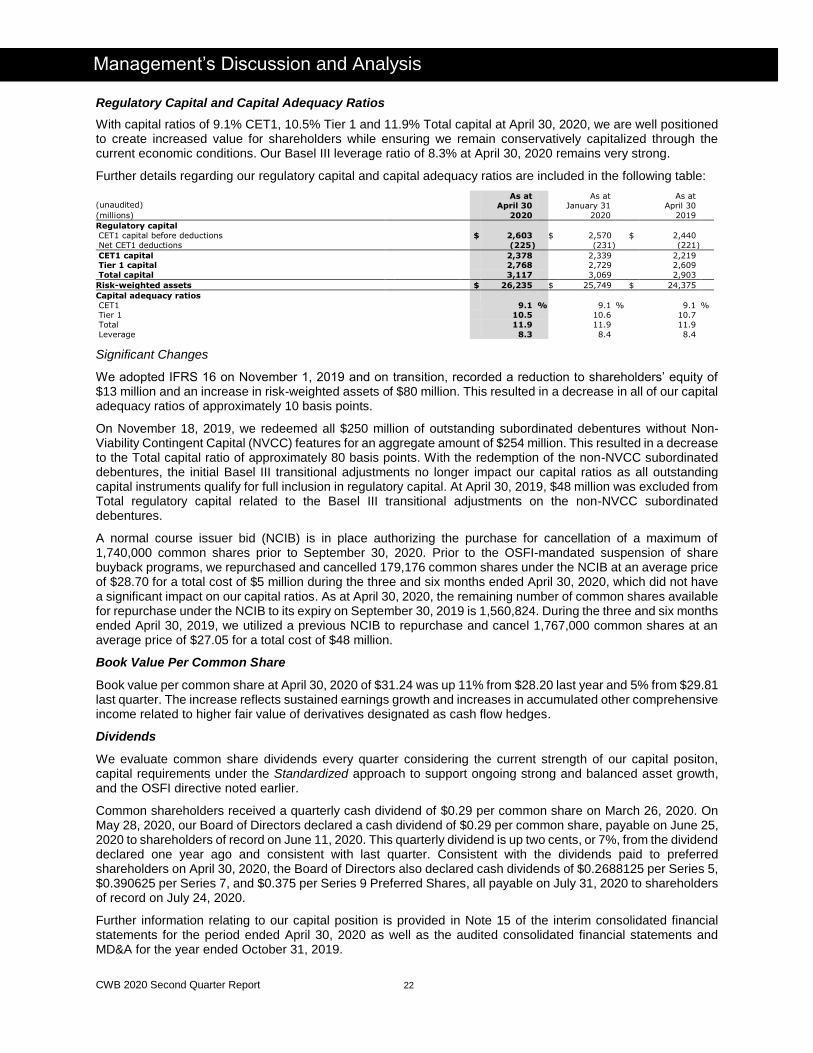
CWB 2020 Second Quarter Report 22
Management’s Discussion and Analysis
Regulatory Capital and Capital Adequacy Ratios
With capital ratios of 9.1% CET1, 10.5% Tier 1 and 11.9% Total capital at April 30, 2020, we are well positioned to create increased value for shareholders while ensuring we remain conservatively capitalized through the current economic conditions. Our Basel III leverage ratio of 8.3% at April 30, 2020 remains very strong.
Further details regarding our regulatory capital and capital adequacy ratios are included in the following table:
(unaudited)
As at April 30
2020
As at January 31
2020
As at April 30
2019 (millions)
Regulatory capital
CET1 capital before deductions $ 2,603 $ 2,570 $ 2,440
Net CET1 deductions (225) (231) (221)
CET1 capital 2,378 2,339 2,219 Tier 1 capital 2,768 2,729 2,609
Total capital 3,117 3,069 2,903
Risk-weighted assets $ 26,235 $ 25,749 $ 24,375
Capital adequacy ratios
CET1
9.1
%
9.1
%
9.1
% Tier 1 10.5 10.6 10.7
Total 11.9 11.9 11.9
Leverage 8.3 8.4 8.4
Significant Changes
We adopted IFRS 16 on November 1, 2019 and on transition, recorded a reduction to shareholders’ equity of $13 million and an increase in risk-weighted assets of $80 million. This resulted in a decrease in all of our capital adequacy ratios of approximately 10 basis points.
On November 18, 2019, we redeemed all $250 million of outstanding subordinated debentures without Non-Viability Contingent Capital (NVCC) features for an aggregate amount of $254 million. This resulted in a decrease to the Total capital ratio of approximately 80 basis points. With the redemption of the non-NVCC subordinated debentures, the initial Basel III transitional adjustments no longer impact our capital ratios as all outstanding capital instruments qualify for full inclusion in regulatory capital. At April 30, 2019, $48 million was excluded from Total regulatory capital related to the Basel III transitional adjustments on the non-NVCC subordinated debentures.
A normal course issuer bid (NCIB) is in place authorizing the purchase for cancellation of a maximum of 1,740,000 common shares prior to September 30, 2020. Prior to the OSFI-mandated suspension of share buyback programs, we repurchased and cancelled 179,176 common shares under the NCIB at an average price of $28.70 for a total cost of $5 million during the three and six months ended April 30, 2020, which did not have a significant impact on our capital ratios. As at April 30, 2020, the remaining number of common shares available for repurchase under the NCIB to its expiry on September 30, 2019 is 1,560,824. During the three and six months ended April 30, 2019, we utilized a previous NCIB to repurchase and cancel 1,767,000 common shares at an average price of $27.05 for a total cost of $48 million.
Book Value Per Common Share
Book value per common share at April 30, 2020 of $31.24 was up 11% from $28.20 last year and 5% from $29.81 last quarter. The increase reflects sustained earnings growth and increases in accumulated other comprehensive income related to higher fair value of derivatives designated as cash flow hedges.
Dividends
We evaluate common share dividends every quarter considering the current strength of our capital positon, capital requirements under the Standardized approach to support ongoing strong and balanced asset growth, and the OSFI directive noted earlier.
Common shareholders received a quarterly cash dividend of $0.29 per common share on March 26, 2020. On May 28, 2020, our Board of Directors declared a cash dividend of $0.29 per common share, payable on June 25, 2020 to shareholders of record on June 11, 2020. This quarterly dividend is up two cents, or 7%, from the dividend declared one year ago and consistent with last quarter. Consistent with the dividends paid to preferred shareholders on April 30, 2020, the Board of Directors also declared cash dividends of $0.2688125 per Series 5, $0.390625 per Series 7, and $0.375 per Series 9 Preferred Shares, all payable on July 31, 2020 to shareholders of record on July 24, 2020.
Further information relating to our capital position is provided in Note 15 of the interim consolidated financial statements for the period ended April 30, 2020 as well as the audited consolidated financial statements and MD&A for the year ended October 31, 2019.
CWB 2020 Second Quarter Report 23
Management’s Discussion and Analysis
AIRB Transition
During the second quarter, we submitted our formal application to OSFI for transition to the AIRB methodology for regulatory capital and risk management, with regulatory approval expected within fiscal 2020. This submission represents a key milestone in our iterative and conservative approach to achieve AIRB approval, which we expect to create meaningful and lasting value for shareholders. OSFI confirmed the delayed implementation of the capital and liquidity requirements for SMSBs does not affect the status of any application for a bank to use the AIRB approach.
Transition to the AIRB approach will put us on a more equal footing with our competition and increase our addressable market. Approval of our application is expected to boost our capital ratios, as risk-weighted assets will be calculated using more risk-sensitive models. The capabilities that support our formal application add risk sensitivity to our framework for capital management, increase risk quantification processes, improve risk-based pricing capabilities and economic capital estimations, improve stress testing capabilities and enhance our Internal Capital Adequacy Assessment Process (ICAAP). These improved risk management capabilities better equip us to manage through economic downturns and allocate resources to target business segments that generate the most attractive risk-adjusted returns.
Significant Changes in Accounting Policies and Financial Statement Presentation
The unaudited interim consolidated financial statements for the period ended April 30, 2020 were prepared using the same accounting policies as the audited consolidated financial statements for the year ended October 31, 2019 with the exception of the adoption of IFRS 16 on November 1, 2019.
As permitted by IFRS 16, we have not restated prior period comparative figures and have recognized an adjustment to opening retained earnings to reflect the application of the new requirements at the adoption date. The recognition of right-of-use assets and lease liabilities for premises leases on the consolidated balance sheet was the most significant change as a result of adopting IFRS 16. Under IFRS 16, interest expense on lease liabilities is recorded using the effective interest rate method and presented within interest expense in the consolidated statements of income over the remaining lease term. Prior to the adoption of IFRS 16, our leases were classified as operating leases and were not capitalized. Total costs, including free rent periods and step-rent increases, were expensed on a straight-line basis over the lease term within premises and equipment in the consolidated statements of income. For further details, refer to Note 2 of the interim consolidated financial statements for the period ended April 30, 2020.
Controls and Procedures
There were no significant changes in our disclosure controls and procedures and internal controls over financial reporting that occurred during the period ended April 30, 2020 that have materially affected, or are reasonably likely to materially affect, our disclosures of required information and internal controls over financial reporting. Prior to its release, this quarterly report to shareholders was reviewed by the Audit Committee and, on the Audit Committee’s recommendation, approved by the Board of Directors.
Third-party Credit Ratings
DBRS Morningstar (DBRS) maintains published credit ratings on CWB’s senior debt, short-term debt, NVCC subordinated debentures and preferred shares of “A (low)”, “R1 (low)”, “BBB (low)” and “Pfd-3”, respectively. All ratings were confirmed in the second quarter with a stable outlook on short-term ratings and a negative outlook on long-term ratings. Credit ratings do not consider market price or address the suitability of any financial instrument for a particular investor and are not recommendations to purchase, sell or hold securities. Ratings are subject to revision or withdrawal at any time by the rating organization. Management believes the ratings widen the base of clients and investors who can participate in CWB’s offerings, while also lowering overall funding costs and the cost of capital.
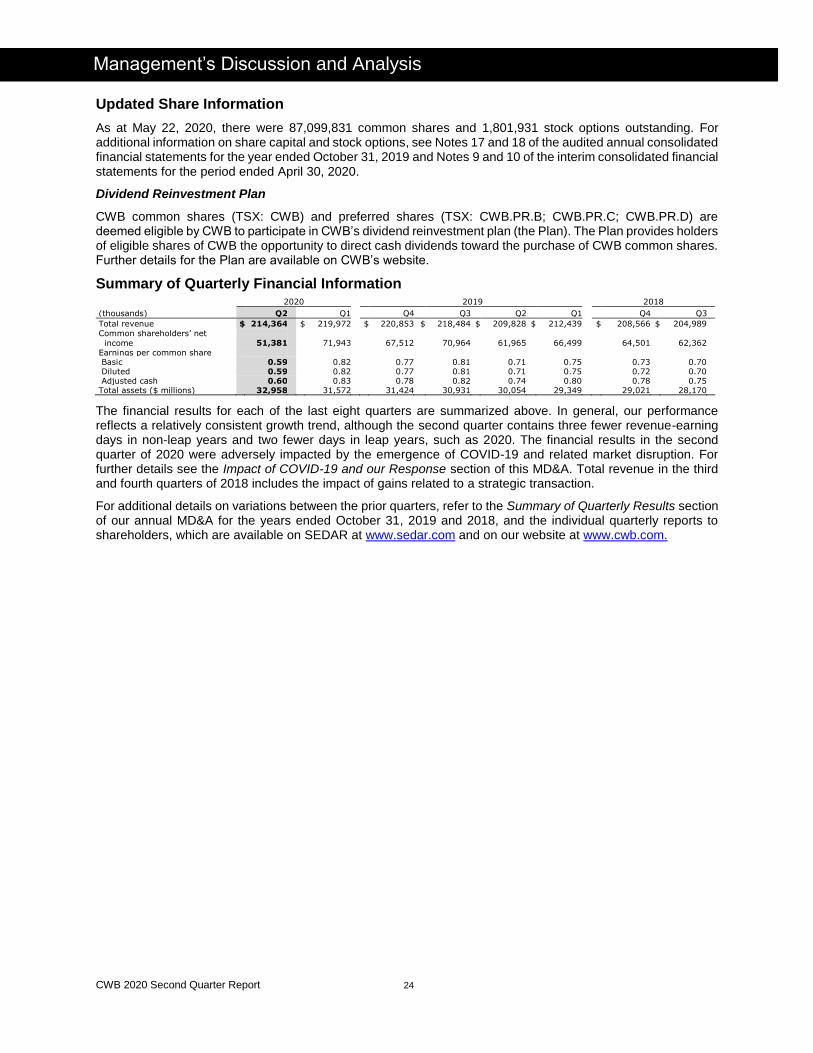
CWB 2020 Second Quarter Report 24
Management’s Discussion and Analysis
Updated Share Information
As at May 22, 2020, there were 87,099,831 common shares and 1,801,931 stock options outstanding. For additional information on share capital and stock options, see Notes 17 and 18 of the audited annual consolidated financial statements for the year ended October 31, 2019 and Notes 9 and 10 of the interim consolidated financial statements for the period ended April 30, 2020.
Dividend Reinvestment Plan
CWB common shares (TSX: CWB) and preferred shares (TSX: CWB.PR.B; CWB.PR.C; CWB.PR.D) are deemed eligible by CWB to participate in CWB’s dividend reinvestment plan (the Plan). The Plan provides holders of eligible shares of CWB the opportunity to direct cash dividends toward the purchase of CWB common shares. Further details for the Plan are available on CWB’s website.
Summary of Quarterly Financial Information 2020 2019 2018
(thousands) Q2 Q1 Q4 Q3 Q2 Q1 Q4 Q3
Total revenue $ 214,364 $ 219,972 $ 220,853 $ 218,484 $ 209,828 $ 212,439 $ 208,566 $ 204,989 Common shareholders’ net
income 51,381
71,943
6
44
67,512
70,964
61,965
66,499
64,501
62,362
Earnings per common share Basic 0.59
0
0.82 0.77 0.81 0.71 0.75 0.73 0.70 Diluted 0.59 0.82 0.77 0.81 0.71 0.75 0.72 0.70 Adjusted cash 0.60 0.83 0.78 0.82 0.74 0.80 0.78 0.75 Total assets ($ millions) 32,958 31,572 31,424 30,931 30,054 29,349 29,021 28,170
The financial results for each of the last eight quarters are summarized above. In general, our performance reflects a relatively consistent growth trend, although the second quarter contains three fewer revenue-earning days in non-leap years and two fewer days in leap years, such as 2020. The financial results in the second quarter of 2020 were adversely impacted by the emergence of COVID-19 and related market disruption. For further details see the Impact of COVID-19 and our Response section of this MD&A. Total revenue in the third and fourth quarters of 2018 includes the impact of gains related to a strategic transaction.
For additional details on variations between the prior quarters, refer to the Summary of Quarterly Results section of our annual MD&A for the years ended October 31, 2019 and 2018, and the individual quarterly reports to shareholders, which are available on SEDAR at www.sedar.com and on our website at www.cwb.com.

CWB 2020 Second Quarter Report 25
Consolidated Balance Sheets
As at
April 30 2020(1)
As at
January 31 2020(1)
As at
October 31 2019
As at
April 30 2019
Change from
April 30 2019
(unaudited) ($ thousands)
Assets
Cash Resources
Cash and non-interest bearing deposits with financial institutions $ 93,237 $ 126,270 $ 116,963 $ 91,394 2 %
Interest bearing deposits with regulated financial institutions (Note 3) 321,531 250,660 293,856 366,635 (12) Cheques and other items in transit - 1,120 5,023 4,967 (100)
414,768 378,050 415,842 462,996 (10)
Securities (Note 3)
Issued or guaranteed by Canada 1,304,910 1,110,488 1,341,326 1,006,225 30
Issued or guaranteed by a province or municipality 885,278 371,199 468,671 479,944 84 Other debt securities 513,521 396,659 191,046 150,412 241
Preferred shares 1,960 1,955 18,164 43,134 (95)
2,705,669 1,880,301 2,019,207 1,679,715 61
Securities Purchased under Resale Agreements 24,999 - 40,366 116,936 (79)
Loans (Note 4)
Personal 5,811,759 5,802,990 5,689,833 5,407,492 7
Business 23,385,816 22,963,042 22,786,894 21,945,145 7
29,197,575 28,766,032 28,476,727 27,352,637 7
Allowance for credit losses (131,482) (112,900) (110,834) (112,595) 17
29,066,093 28,653,132 28,365,893 27,240,042 7
Other
Property and equipment 136,526 137,674 63,166 57,731 136
Goodwill 85,557 85,557 85,392 85,280 - Intangible assets 178,651 173,991 173,748 164,590 9
Derivatives 144,666 54,762 47,815 45,437 218
Other assets 201,255 208,131 212,806 201,454 -
746,655 660,115 582,927 554,492 35
Total Assets $ 32,958,184 $ 31,571,598 $ 31,424,235 $ 30,054,181 10 %
Liabilities and Equity Deposits (Note 5)
Personal $ 15,657,504 $ 15,169,895 $ 15,300,505 $ 15,512,802 1 %
Business and government 10,489,582 10,470,981 10,050,856 9,205,371 14
26,147,086 25,640,876 25,351,361 24,718,173 6
Other Cheques and other items in transit 41,484 23,813 22,532 29,260 42
Securities sold under repurchase agreements (Note 6) - 49,891 29,965 - -
Derivatives 19,138 9,623 14,016 18,981 1
Other liabilities (Note 2) 824,673 610,709 646,386 548,035 50
885,295 694,036 712,899 596,276 48
Debt Debt related to securitization activities (Note 6) 2,214,944 1,995,317 1,913,799 1,637,541 35
Secured liquidity facility (Note 7) 350,284 - - - 100
Subordinated debentures (Note 8) 248,654 248,574 498,494 250,000 (1)
2,813,882 2,243,891 2,412,293 1,887,541 49
Equity
Preferred shares (Note 9) 390,000 390,000 390,000 390,000 - Common shares (Note 9) 730,846 732,257 731,970 731,339 -
Retained earnings 1,835,601 1,813,124 1,785,273 1,705,712 8
Share-based payment reserve 24,893 24,470 24,309 24,664 1
Accumulated other comprehensive income (loss) 129,435 31,881 14,258 (1,317) nm
Total Shareholders’ Equity 3,110,775 2,991,732 2,945,810 2,850,398 9 Non-controlling interests 1,146 1,063 1,872 1,793 (36)
Total Equity 3,111,921 2,992,795 2,947,682 2,852,191 9
Total Liabilities and Equity $ 32,958,184 $ 31,571,598 $ 31,424,235 $ 30,054,181 10 %
(1) Periods beginning November 1, 2019 have been prepared in accordance with IFRS 16 Leases (IFRS 16) (refer to Note 2). Prior period comparatives have been prepared in
accordance with IAS 17 Leases (IAS 17) and have not been restated.
nm – not meaningful
The accompanying notes are an integral part of the interim consolidated financial statements.
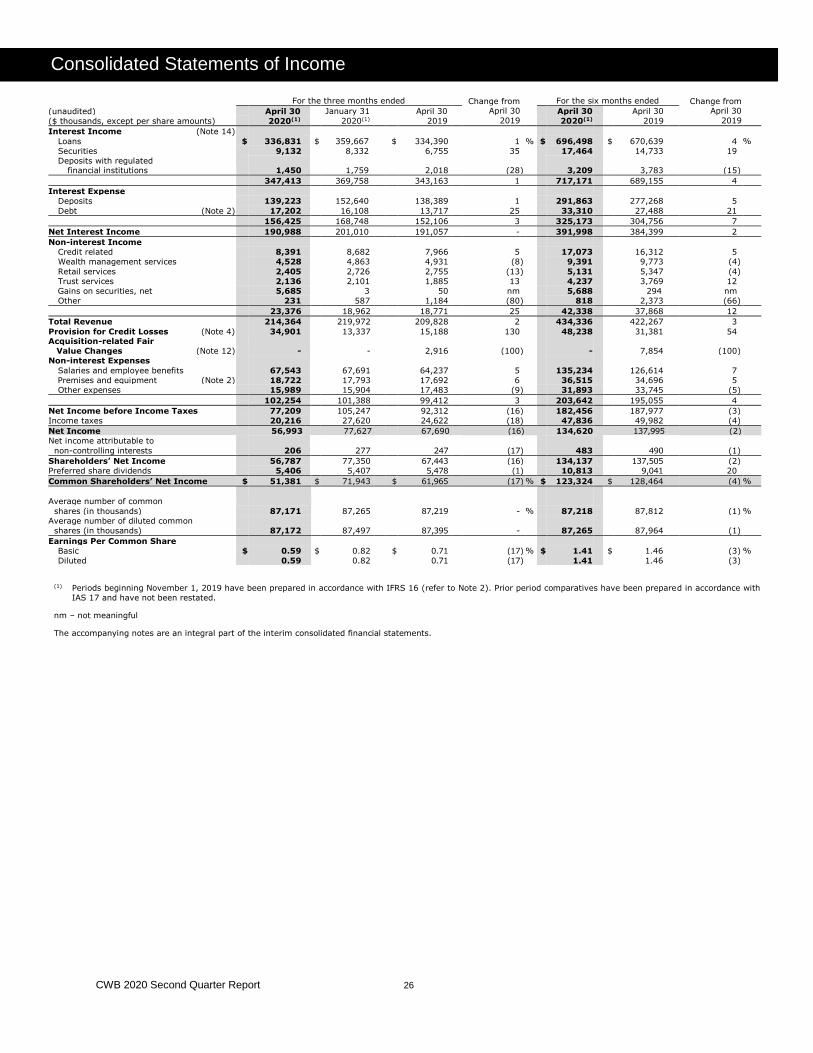
CWB 2020 Second Quarter Report 26
Consolidated Statements of Income
For the three months ended Change from April 30
2019
For the six months ended Change from April 30
2019
(unaudited) April 30
2020(1)
January 31
2020(1)
April 30
2019
April 30
2020(1)
April 30
2019
($ thousands, except per share amounts)
Interest Income (Note 14)
Loans $ 336,831 $ 359,667 $ 334,390 1 % $ 696,498 $ 670,639 4 %
Securities 9,132 8,332 6,755 35 17,464 14,733 19
Deposits with regulated financial institutions
1,450
1,759
2,018
(28)
3,209
3,783
(15)
347,413 369,758 343,163 1 717,171 689,155 4
Interest Expense
Deposits 139,223 152,640 138,389 1 291,863 277,268 5
Debt (Note 2) 17,202 16,108 13,717 25 33,310 27,488 21
156,425 168,748 152,106 3 325,173 304,756 7
Net Interest Income 190,988 201,010 191,057 - 391,998 384,399 2
Non-interest Income
Credit related 8,391 8,682 7,966 5 17,073 16,312 5
Wealth management services 4,528 4,863 4,931 (8) 9,391 9,773 (4)
Retail services 2,405 2,726 2,755 (13) 5,131 5,347 (4)
Trust services 2,136 2,101 1,885 13 4,237 3,769 12
Gains on securities, net 5,685 3 50 nm 5,688 294 nm
Other 231 587 1,184 (80) 818 2,373 (66)
23,376 18,962 18,771 25 42,338 37,868 12
Total Revenue 214,364 219,972 209,828 2 434,336 422,267 3
Provision for Credit Losses (Note 4) 34,901 13,337 15,188 130 48,238 31,381 54
Acquisition-related Fair
Value Changes (Note 12)
-
-
2,916
(100)
-
7,854
(100)
Non-interest Expenses
Salaries and employee benefits 67,543 67,691 64,237 5 135,234 126,614 7
Premises and equipment (Note 2) 18,722 17,793 17,692 6 36,515 34,696 5
Other expenses 15,989 15,904 17,483 (9) 31,893 33,745 (5)
102,254 101,388 99,412 3 203,642 195,055 4
Net Income before Income Taxes 77,209 105,247 92,312 (16) 182,456 187,977 (3)
Income taxes 20,216 27,620 24,622 (18) 47,836 49,982 (4)
Net Income 56,993 77,627 67,690 (16) 134,620 137,995 (2)
Net income attributable to
non-controlling interests 206 277 247 (17) 483 490 (1)
Shareholders’ Net Income 56,787 77,350 67,443 (16) 134,137 137,505 (2)
Preferred share dividends 5,406 5,407 5,478 (1) 10,813 9,041 20
Common Shareholders’ Net Income $ 51,381 $ 71,943 $ 61,965 (17) % $ 123,324 $ 128,464 (4) %
Average number of common
shares (in thousands) 87,171 87,265 87,219 - % 87,218 87,812 (1) %
Average number of diluted common
shares (in thousands) 87,172 87,497 87,395 - 87,265 87,964 (1)
Earnings Per Common Share
Basic $ 0.59 $ 0.82 $ 0.71 (17) % $ 1.41 $ 1.46 (3) %
Diluted 0.59 0.82 0.71 (17) 1.41 1.46 (3)
(1) Periods beginning November 1, 2019 have been prepared in accordance with IFRS 16 (refer to Note 2). Prior period comparatives have been prepared in accordance with
IAS 17 and have not been restated.
nm – not meaningful
The accompanying notes are an integral part of the interim consolidated financial statements.
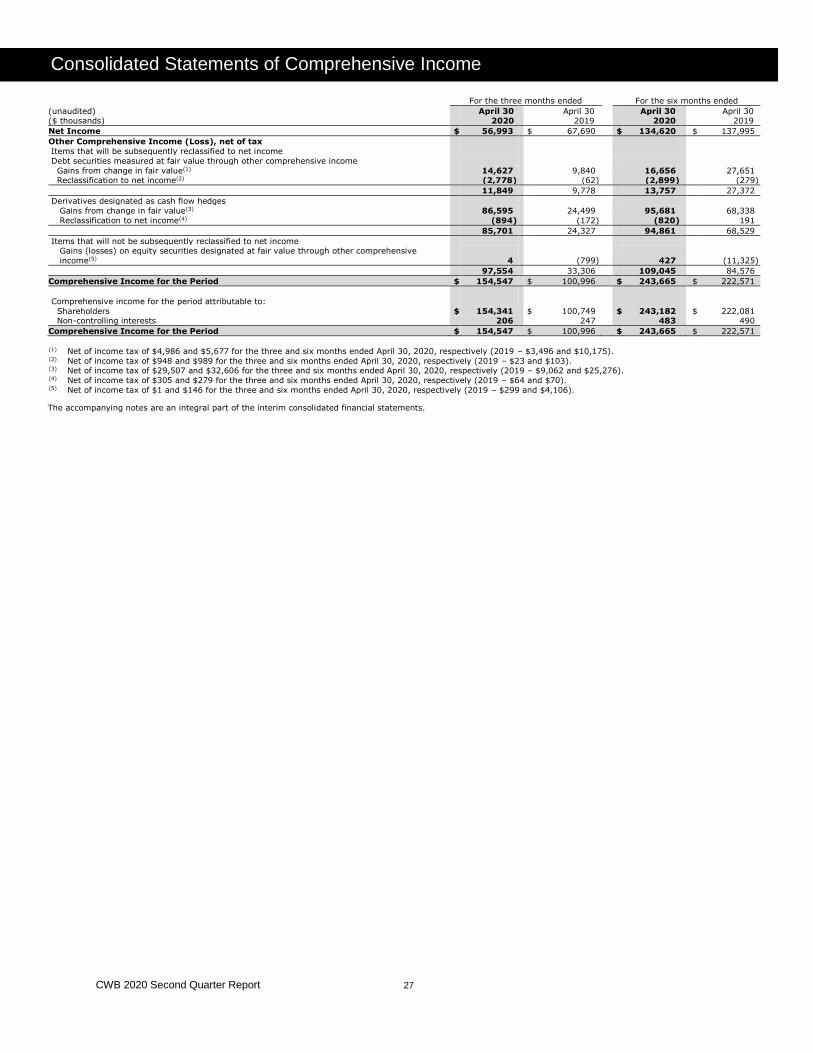
CWB 2020 Second Quarter Report 27
Consolidated Statements of Comprehensive Income
For the three months ended For the six months ended
(unaudited) ($ thousands)
April 30 2020
April 30 2019
April 30 2020
April 30 2019
Net Income $ 56,993 $ 67,690 $ 134,620 $ 137,995
Other Comprehensive Income (Loss), net of tax
Items that will be subsequently reclassified to net income
Debt securities measured at fair value through other comprehensive income
Gains from change in fair value(1) 14,627 9,840 16,656 27,651 Reclassification to net income(2) (2,778) (62) (2,899) (279)
11,849 9,778 13,757 27,372
Derivatives designated as cash flow hedges
Gains from change in fair value(3) 86,595 24,499 95,681 68,338
Reclassification to net income(4) (894) (172) (820) 191
85,701 24,327 94,861 68,529
Items that will not be subsequently reclassified to net income Gains (losses) on equity securities designated at fair value through other comprehensive
income(5)
4 (799) 427 (11,325)
97,554 33,306 109,045 84,576
Comprehensive Income for the Period $ 154,547 $ 100,996 $ 243,665 $ 222,571
Comprehensive income for the period attributable to:
Shareholders $ 154,341 $ 100,749 $ 243,182 $ 222,081 Non-controlling interests 206 247 483 490
Comprehensive Income for the Period $ 154,547 $ 100,996 $ 243,665 $ 222,571
(1) Net of income tax of $4,986 and $5,677 for the three and six months ended April 30, 2020, respectively (2019 – $3,496 and $10,175). (2) Net of income tax of $948 and $989 for the three and six months ended April 30, 2020, respectively (2019 – $23 and $103). (3) Net of income tax of $29,507 and $32,606 for the three and six months ended April 30, 2020, respectively (2019 – $9,062 and $25,276). (4) Net of income tax of $305 and $279 for the three and six months ended April 30, 2020, respectively (2019 – $64 and $70). (5) Net of income tax of $1 and $146 for the three and six months ended April 30, 2020, respectively (2019 – $299 and $4,106).
The accompanying notes are an integral part of the interim consolidated financial statements.
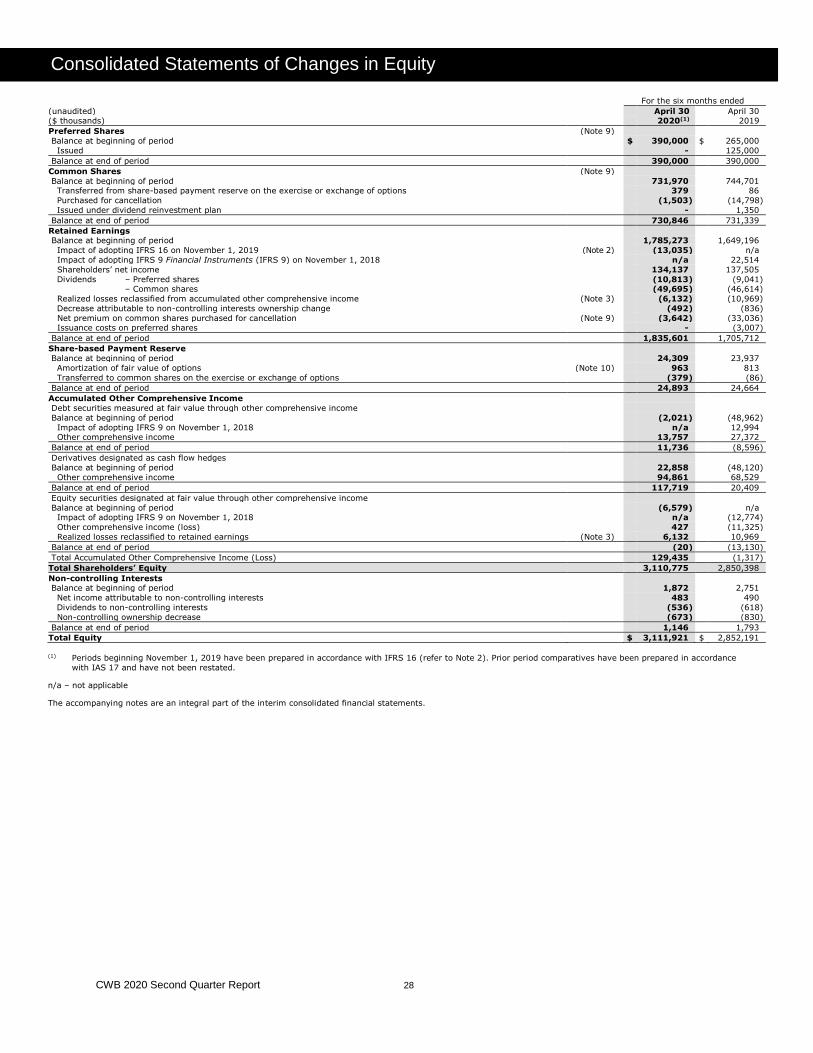
CWB 2020 Second Quarter Report 28
Consolidated Statements of Changes in Equity
For the six months ended
(unaudited) April 30 2020(1)
April 30 2019 ($ thousands)
Preferred Shares (Note 9)
Balance at beginning of period $ 390,000 $ 265,000
Issued - 125,000
Balance at end of period 390,000 390,000
Common Shares (Note 9)
Balance at beginning of period 731,970 744,701 Transferred from share-based payment reserve on the exercise or exchange of options 379 86
Purchased for cancellation (1,503) (14,798)
Issued under dividend reinvestment plan - 1,350
Balance at end of period 730,846 731,339
Retained Earnings Balance at beginning of period 1,785,273 1,649,196
Impact of adopting IFRS 16 on November 1, 2019 (Note 2) (13,035) n/a
Impact of adopting IFRS 9 Financial Instruments (IFRS 9) on November 1, 2018 n/a 22,514
Shareholders’ net income 134,137 137,505
Dividends – Preferred shares (10,813) (9,041) – Common shares (49,695) (46,614)
Realized losses reclassified from accumulated other comprehensive income (Note 3) (6,132) (10,969)
Decrease attributable to non-controlling interests ownership change (492) (836)
Net premium on common shares purchased for cancellation (Note 9) (3,642) (33,036) Issuance costs on preferred shares - (3,007)
Balance at end of period 1,835,601 1,705,712
Share-based Payment Reserve
Balance at beginning of period 24,309 23,937
Amortization of fair value of options (Note 10) 963 813
Transferred to common shares on the exercise or exchange of options (379) (86)
Balance at end of period 24,893 24,664
Accumulated Other Comprehensive Income
Debt securities measured at fair value through other comprehensive income
Balance at beginning of period (2,021) (48,962)
Impact of adopting IFRS 9 on November 1, 2018 n/a 12,994 Other comprehensive income 13,757 27,372
Balance at end of period 11,736 (8,596)
Derivatives designated as cash flow hedges
Balance at beginning of period 22,858 (48,120)
Other comprehensive income 94,861 68,529
Balance at end of period 117,719 20,409
Equity securities designated at fair value through other comprehensive income
Balance at beginning of period (6,579) n/a Impact of adopting IFRS 9 on November 1, 2018 n/a (12,774)
Other comprehensive income (loss) 427 (11,325)
Realized losses reclassified to retained earnings (Note 3) 6,132 10,969
Balance at end of period (20) (13,130)
Total Accumulated Other Comprehensive Income (Loss) 129,435 (1,317)
Total Shareholders’ Equity 3,110,775 2,850,398
Non-controlling Interests Balance at beginning of period 1,872 2,751
Net income attributable to non-controlling interests 483 490
Dividends to non-controlling interests (536) (618)
Non-controlling ownership decrease (673) (830)
Balance at end of period 1,146 1,793
Total Equity $ 3,111,921 $ 2,852,191
(1) Periods beginning November 1, 2019 have been prepared in accordance with IFRS 16 (refer to Note 2). Prior period comparatives have been prepared in accordance
with IAS 17 and have not been restated.
n/a – not applicable
The accompanying notes are an integral part of the interim consolidated financial statements.
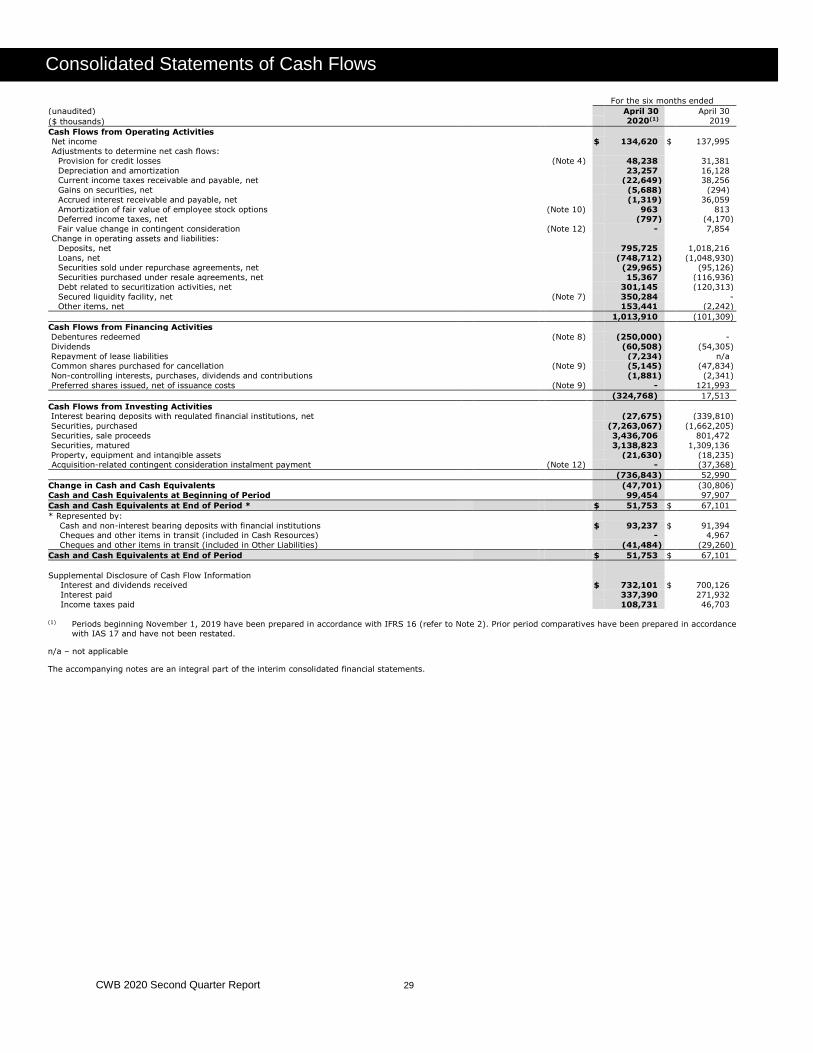
CWB 2020 Second Quarter Report 29
Consolidated Statements of Cash Flows
For the six months ended
(unaudited) April 30 2020(1)
April 30 2019 ($ thousands)
Cash Flows from Operating Activities Net income $ 134,620 $ 137,995
Adjustments to determine net cash flows:
Provision for credit losses (Note 4) 48,238 31,381
Depreciation and amortization 23,257 16,128 Current income taxes receivable and payable, net (22,649) 38,256
Gains on securities, net (5,688) (294)
Accrued interest receivable and payable, net (1,319) 36,059
Amortization of fair value of employee stock options (Note 10) 963 813 Deferred income taxes, net (797) (4,170)
Fair value change in contingent consideration (Note 12) - 7,854
Change in operating assets and liabilities:
Deposits, net 795,725 1,018,216
Loans, net (748,712) (1,048,930) Securities sold under repurchase agreements, net (29,965) (95,126)
Securities purchased under resale agreements, net 15,367 (116,936)
Debt related to securitization activities, net 301,145 (120,313)
Secured liquidity facility, net (Note 7) 350,284 - Other items, net 153,441 (2,242)
1,013,910 (101,309)
Cash Flows from Financing Activities
Debentures redeemed (Note 8) (250,000) -
Dividends (60,508) (54,305)
Repayment of lease liabilities (7,234) n/a Common shares purchased for cancellation (Note 9) (5,145) (47,834)
Non-controlling interests, purchases, dividends and contributions (1,881) (2,341)
Preferred shares issued, net of issuance costs (Note 9) - 121,993
(324,768) 17,513
Cash Flows from Investing Activities Interest bearing deposits with regulated financial institutions, net (27,675) (339,810)
Securities, purchased (7,263,067) (1,662,205)
Securities, sale proceeds 3,436,706 801,472
Securities, matured 3,138,823 1,309,136
Property, equipment and intangible assets (21,630) (18,235) Acquisition-related contingent consideration instalment payment (Note 12) - (37,368)
(736,843) 52,990
Change in Cash and Cash Equivalents (47,701) (30,806)
Cash and Cash Equivalents at Beginning of Period 99,454 97,907
Cash and Cash Equivalents at End of Period * $ 51,753 $ 67,101
* Represented by:
Cash and non-interest bearing deposits with financial institutions $ 93,237 $ 91,394 Cheques and other items in transit (included in Cash Resources) - 4,967
Cheques and other items in transit (included in Other Liabilities) (41,484) (29,260)
Cash and Cash Equivalents at End of Period $ 51,753 $ 67,101
Supplemental Disclosure of Cash Flow Information Interest and dividends received $ 732,101 $ 700,126
Interest paid 337,390 271,932
Income taxes paid 108,731 46,703
(1) Periods beginning November 1, 2019 have been prepared in accordance with IFRS 16 (refer to Note 2). Prior period comparatives have been prepared in accordance
with IAS 17 and have not been restated.
n/a – not applicable
The accompanying notes are an integral part of the interim consolidated financial statements.
CWB 2020 Second Quarter Report 30
Notes to Interim Consolidated Financial Statements
(unaudited) ($ thousands, unless otherwise noted)
1. Basis of Presentation and Significant Accounting Policies
These unaudited condensed interim consolidated financial statements of Canadian Western Bank (CWB) have been prepared in accordance with International Accounting Standard (IAS) 34 Interim Financial Reporting as issued by the International Accounting Standards Board (IASB) using the same accounting policies as the audited consolidated financial statements for the year ended October 31, 2019, with the exception of the adoption of International Financial Reporting Standard (IFRS) 16 Leases (IFRS 16) as discussed in Note 2. These interim consolidated financial statements of CWB, domiciled in Canada, have also been prepared in accordance with subsection 308 (4) of the Bank Act and the accounting requirements of the Office of the Superintendent of Financial Institutions Canada (OSFI). Under IFRS, additional disclosures are required in annual financial statements and accordingly, these unaudited interim consolidated financial statements should be read in conjunction with the audited consolidated financial statements for the year ended October 31, 2019.
The interim consolidated financial statements were authorized for issue by the Board of Directors on May 28, 2020.
COVID-19 Pandemic Considerations
During the second quarter of 2020, the Canadian economy experienced significant disruption and market volatility related to the global COVID-19 pandemic. The overall impact of the pandemic is uncertain and dependent on actions
taken by Canadian governments, businesses and individuals to limit spread of the COVID-19 virus, as well as government economic response and support efforts.
As described in Note 1 of the audited consolidated financial statements for the year ended October 31, 2019, we make estimates and assumptions in preparing the consolidated financial statements. For the quarter ended April 30, 2020, these estimates and assumptions consider the economic impact of the COVID-19 pandemic and the significant economic volatility and uncertainty it has created. Actual results could differ materially from these estimates, in which case the impact would be recognized in the consolidated financial statements in future periods.
Information on critical judgements impacted by the COVID-19 pandemic that have the most significant effect on the amounts recognized in the interim consolidated financial statements is described in Note 4 Loans, Impaired Loans and Allowance for Credit Losses.
Additional information about the impact of COVID-19 on our risk management practices, as described in Note 29 of the audited consolidated financial statements for the year ended October 31, 2019, is provided in the Risk Management section in the 2020 Second Quarter Management’s Discussion and Analysis.
2. Changes in Accounting Policies
(a) IFRS 16 Leases
We adopted IFRS 16 effective November 1, 2019, which replaces IAS 17 Leases (IAS 17). This standard provides principles for the recognition, measurement, presentation and disclosure of leases. The standard sets out a single lessee accounting model for all leases and eliminates the distinction between operating and financing leases. Lessor accounting remains substantially unchanged.
We elected to adopt IFRS 16 using the modified retrospective approach, in which we recognized the cumulative effect on initial application in retained earnings as of November 1, 2019. Prior period comparatives were not restated. At November 1, 2019, lease liabilities were measured at the present value of the remaining lease payments discounted at our weighted average incremental borrowing rate on that date of 3.01%. Right-of-use assets have generally been measured at an amount equal to the lease liability and adjusted by any prepaid or accrued lease payments. As permitted under IFRS 16, for select leases, we measured right-of-use assets retrospectively as if the standard had been applied since the commencement date of the lease, discounted using our November 1, 2019 incremental borrowing rate. On adoption, we applied the following recognition exemptions and practical expedients. We
did not apply the requirements of IFRS 16 to short-term and low value leases; treated existing operating leases with a remaining term of less than 12 months at November 1, 2019 as
short-term leases; applied a single discount rate to a portfolio of leases with reasonably similar characteristics; excluded initial direct costs related to existing leases from the measurement of the right-of-use assets; relied on previous assessments of whether leases were onerous in accordance with IAS 37 Provisions,
Contingent Liabilities and Contingent Assets immediately before the date of application as an alternative to performing an impairment review; and
used hindsight to determine the lease term where our lease contracts contain options to extend or terminate the lease.
CWB 2020 Second Quarter Report 31
Notes to Interim Consolidated Financial Statements
The adoption of IFRS 16 resulted in the recognition of right-of-use assets of $79,874 within property and equipment and lease liabilities of $98,863 within other liabilities, primarily related to premises leases previously classified as operating leases. A transition adjustment of $13,035, net of taxes, reduced retained earnings primarily representing the difference between the right-of-use assets and lease liabilities recognized.
The following table reconciles our operating lease commitments, disclosed in Note 20 of the audited consolidated financial statements for the year ended October 31, 2019, to the lease obligations recognized on initial application of IFRS 16 at November 1, 2019:
Lease commitments at October 31, 2019 $ 92,584
Short-term leases – transition exemption (216) Low-value leases – transition exemption (13)
Extension and termination options reasonably certain to be exercised 28,470
Le Commitments for leases that have not yet commenced (7,045)
Undiscounted lease payments 113,780
Discount effect at November 1, 2019 (14,917)
Lease Liabilities Recognized as at November 1, 2019 $ 98,863
Accounting Policies for Leases under IFRS 16
As a lessee, new arrangements are assessed to determine whether a contract is or contains a lease in accordance with IFRS 16. A contract is or contains a lease if, in return for consideration, the contract conveys the right to obtain substantially all of the economic benefits from and direct the use of an identified asset for a period of time. If the arrangement meets this definition, we initially record a right-of-use-asset and corresponding lease liability at the date the leased asset is available for use, subject to certain adjustments.
Lease liabilities are initially measured at the present value of contractual lease payments, discounted using the interest rate implicit in the lease, if that rate can be readily determined. In instances where we cannot determine the implicit lease rate, we use our incremental borrowing rate. In determining the lease term, we assess whether it is reasonably certain we will exercise the extension or termination options. This assessment considers all relevant facts and circumstances that create an economic incentive to exercise these options. Reassessment occurs if there is a significant change in circumstances. Where we are reasonably certain to exercise extension and termination options, they are included in the expected lease term. Interest expense on the lease liability is recorded using the effective interest rate method and presented within interest expense in the consolidated statements of income over the remaining lease term. Lease liabilities are remeasured when a modification to the lease contract occurs, which may include adjustments to future lease payments, or changes in assumptions related to the exercise of purchase, extension, or termination options.
Right-of-use assets are initially measured based on the amount of the related lease liabilities, adjusted for initial direct costs incurred and an estimate of costs to dismantle, remove, or restore the asset, less any lease incentives received. Right-of-use assets are generally depreciated on a straight-line basis over the earlier of the lease term and the expected life. If ownership will transfer to us or we are reasonably certain to exercise a purchase option at the end of the lease term, the expected life of the right-of-use asset is used. Right-of-use-asset depreciation is recognized in premises and equipment in the consolidated statements of income. Right-of-use assets are subsequently measured at cost less accumulated depreciation and any related accumulated impairments.
We apply IAS 36 Impairment of Assets to determine whether a right-of-use asset is impaired and account for any impairment loss as described in the premises and equipment accounting policies in Note 10 of the audited consolidated financial statements for the year ended October 31, 2019.
We have elected not to recognize right-of-use assets and lease liabilities for lease contracts where the total term of the respective lease contract is less than or equal to 12 months or for low value lease contracts. Payments for short-term leases and low-value asset leases are recognized as an expense on a straight-line basis within premises and equipment in the consolidated statements of income.
Accounting Policies for Leases under IAS 17
The following accounting policies were applied to comparative information prior to November 1, 2019, as prior
periods were not restated upon adoption of IFRS 16.
As lessees, we previously classified leases as either a finance or operating lease depending on whether substantially all the risks and rewards of ownership of the asset were transferred. Leases that transferred substantially all of the benefits and risks of ownership of property were classified as finance leases. All other arrangements that were determined to contain a lease were classified as operating leases.
Our leases, primarily branches and office premises, were previously classified as operating leases and were not capitalized. Total costs, including free rent periods and step-rent increases, were expensed on a straight-line basis within premises and equipment in the consolidated statements of income over the lease term.
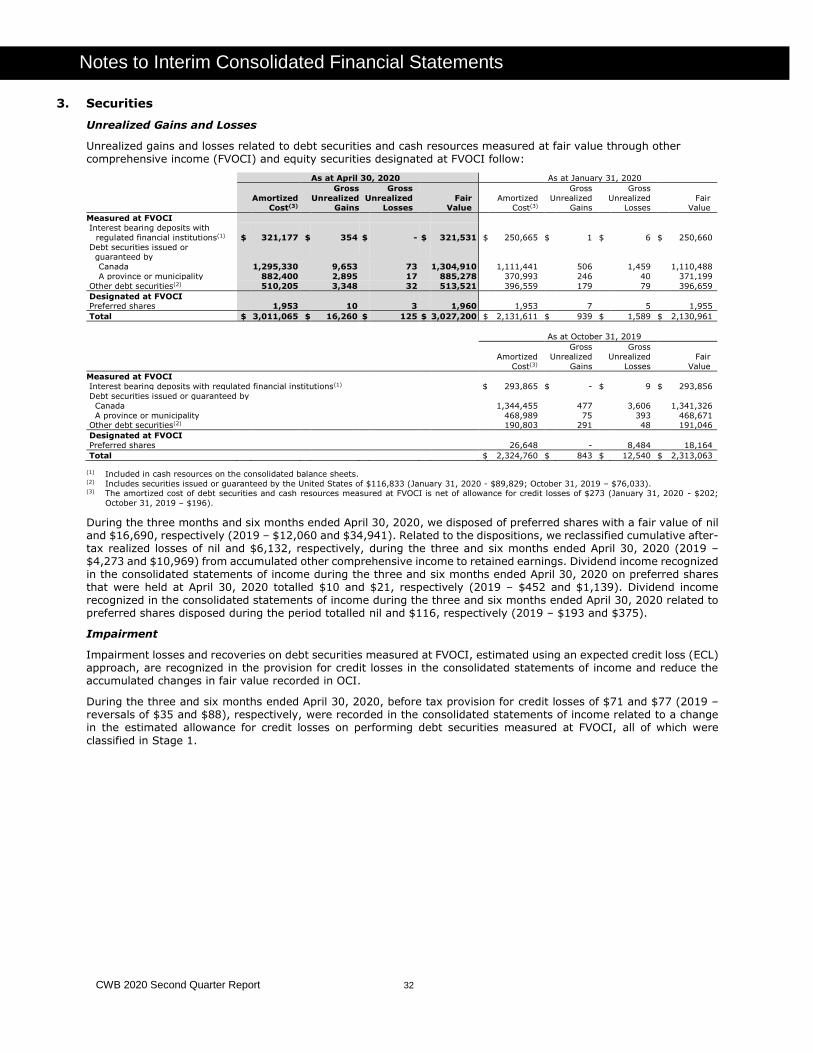
CWB 2020 Second Quarter Report 32
Notes to Interim Consolidated Financial Statements
3. Securities
Unrealized Gains and Losses
Unrealized gains and losses related to debt securities and cash resources measured at fair value through other comprehensive income (FVOCI) and equity securities designated at FVOCI follow:
As at April 30, 2020 As at January 31, 2020
Amortized
Cost(3)
Gross
Unrealized Gains
Gross
Unrealized Losses
Fair Value
Amortized Cost(3)
Gross
Unrealized Gains
Gross
Unrealized Losses
Fair Value
Measured at FVOCI
Interest bearing deposits with
regulated financial institutions(1) $ 321,177 $ 354 $ - $ 321,531 $ 250,665 $ 1 $ 6 $ 250,660
Debt securities issued or guaranteed by
Canada 1,295,330 9,653 73 1,304,910 1,111,441 506 1,459 1,110,488
A province or municipality 882,400 2,895 17 885,278 370,993 246 40 371,199
Other debt securities(2) 510,205 3,348 32 513,521 396,559 179 79 396,659
Designated at FVOCI Preferred shares 1,953 10 3 1,960 1,953 7 5 1,955
Total $ 3,011,065 $ 16,260 $ 125 $ 3,027,200 $ 2,131,611 $ 939 $ 1,589 $ 2,130,961
As at October 31, 2019
Amortized
Cost(3)
Gross
Unrealized
Gains
Gross
Unrealized
Losses
Fair
Value
Measured at FVOCI
Interest bearing deposits with regulated financial institutions(1) $ 293,865 $ - $ 9 $ 293,856
Debt securities issued or guaranteed by
Canada 1,344,455 477 3,606 1,341,326
A province or municipality 468,989 75 393 468,671 Other debt securities(2) 190,803 291 48 191,046
Designated at FVOCI
Preferred shares 26,648 - 8,484 18,164
Total $ 2,324,760 $ 843 $ 12,540 $ 2,313,063
(1) Included in cash resources on the consolidated balance sheets. (2) Includes securities issued or guaranteed by the United States of $116,833 (January 31, 2020 - $89,829; October 31, 2019 – $76,033). (3) The amortized cost of debt securities and cash resources measured at FVOCI is net of allowance for credit losses of $273 (January 31, 2020 - $202;
October 31, 2019 – $196).
During the three months and six months ended April 30, 2020, we disposed of preferred shares with a fair value of nil and $16,690, respectively (2019 – $12,060 and $34,941). Related to the dispositions, we reclassified cumulative after-tax realized losses of nil and $6,132, respectively, during the three and six months ended April 30, 2020 (2019 – $4,273 and $10,969) from accumulated other comprehensive income to retained earnings. Dividend income recognized in the consolidated statements of income during the three and six months ended April 30, 2020 on preferred shares that were held at April 30, 2020 totalled $10 and $21, respectively (2019 – $452 and $1,139). Dividend income recognized in the consolidated statements of income during the three and six months ended April 30, 2020 related to preferred shares disposed during the period totalled nil and $116, respectively (2019 – $193 and $375).
Impairment
Impairment losses and recoveries on debt securities measured at FVOCI, estimated using an expected credit loss (ECL) approach, are recognized in the provision for credit losses in the consolidated statements of income and reduce the accumulated changes in fair value recorded in OCI.
During the three and six months ended April 30, 2020, before tax provision for credit losses of $71 and $77 (2019 – reversals of $35 and $88), respectively, were recorded in the consolidated statements of income related to a change in the estimated allowance for credit losses on performing debt securities measured at FVOCI, all of which were
classified in Stage 1.
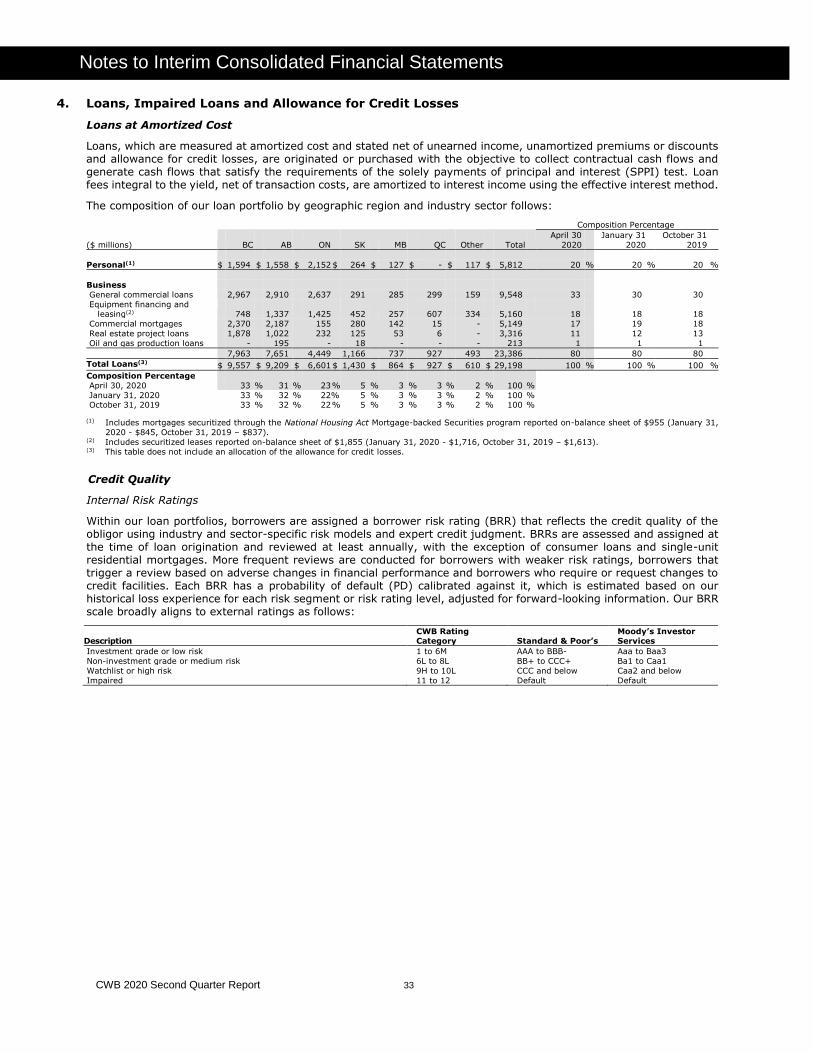
CWB 2020 Second Quarter Report 33
Notes to Interim Consolidated Financial Statements
4. Loans, Impaired Loans and Allowance for Credit Losses
Loans at Amortized Cost
Loans, which are measured at amortized cost and stated net of unearned income, unamortized premiums or discounts and allowance for credit losses, are originated or purchased with the objective to collect contractual cash flows and generate cash flows that satisfy the requirements of the solely payments of principal and interest (SPPI) test. Loan fees integral to the yield, net of transaction costs, are amortized to interest income using the effective interest method.
The composition of our loan portfolio by geographic region and industry sector follows:
Composition Percentage
($ millions) BC AB ON SK
MB
QC Other Total
April 30
2020
January 31
2020
October 31
2019
Personal(1) $ 1,594 $ 1,558 $ 2,152 $ 264 $ 127 $ - $ 117 $ 5,812 20 % 20 % 20 %
Business
General commercial loans 2,967 2,910 2,637 291 285 299 159 9,548 33 30 30
Equipment financing and leasing(2) 748 1,337 1,425 452
257
607 334 5,160 18 18 18
Commercial mortgages 2,370 2,187 155 280 142 15 - 5,149 17 19 18
Real estate project loans 1,878 1,022 232 125 53 6 - 3,316 11 12 13
Oil and gas production loans - 195 - 18 - - - 213 1 1 1
7,963 7,651 4,449 1,166 737 927 493 23,386 80 80 80
Total Loans(3) $ 9,557 $ 9,209 $ 6,601 $ 1,430 $ 864 $ 927 $ 610 $ 29,198 100 % 100 % 100 %
Composition Percentage
April 30, 2020 33 % 31 % 23 % 5 % 3 % 3 % 2 % 100 %
January 31, 2020 33 % 32 % 22 % 5 % 3 % 3 % 2 % 100 % October 31, 2019 33 % 32 % 22 % 5 % 3 % 3 % 2 % 100 %
(1) Includes mortgages securitized through the National Housing Act Mortgage-backed Securities program reported on-balance sheet of $955 (January 31,
2020 - $845, October 31, 2019 – $837). (2) Includes securitized leases reported on-balance sheet of $1,855 (January 31, 2020 - $1,716, October 31, 2019 – $1,613). (3) This table does not include an allocation of the allowance for credit losses.
Credit Quality
Internal Risk Ratings
Within our loan portfolios, borrowers are assigned a borrower risk rating (BRR) that reflects the credit quality of the obligor using industry and sector-specific risk models and expert credit judgment. BRRs are assessed and assigned at the time of loan origination and reviewed at least annually, with the exception of consumer loans and single-unit residential mortgages. More frequent reviews are conducted for borrowers with weaker risk ratings, borrowers that trigger a review based on adverse changes in financial performance and borrowers who require or request changes to credit facilities. Each BRR has a probability of default (PD) calibrated against it, which is estimated based on our historical loss experience for each risk segment or risk rating level, adjusted for forward-looking information. Our BRR scale broadly aligns to external ratings as follows:
Description
CWB Rating Category
Standard & Poor’s
Moody’s Investor Services
Investment grade or low risk 1 to 6M AAA to BBB- Aaa to Baa3
Non-investment grade or medium risk 6L to 8L BB+ to CCC+ Ba1 to Caa1
Watchlist or high risk 9H to 10L CCC and below Caa2 and below
Impaired 11 to 12 Default Default
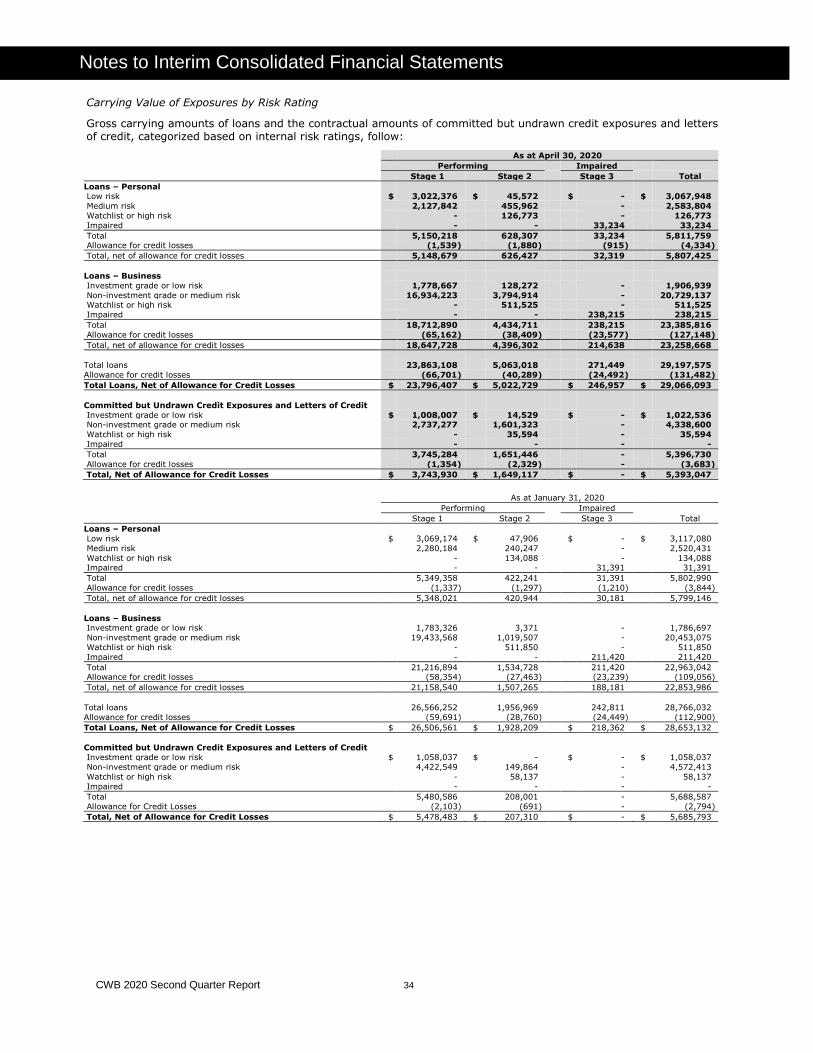
CWB 2020 Second Quarter Report 34
Notes to Interim Consolidated Financial Statements
Carrying Value of Exposures by Risk Rating
Gross carrying amounts of loans and the contractual amounts of committed but undrawn credit exposures and letters of credit, categorized based on internal risk ratings, follow:
As at April 30, 2020
Performing Impaired
Stage 1 Stage 2 Stage 3 Total
Loans – Personal Low risk $ 3,022,376 $ 45,572 $ - $ 3,067,948
Medium risk 2,127,842 455,962 - 2,583,804
Watchlist or high risk - 126,773 - 126,773
Impaired - - 33,234 33,234
Total 5,150,218 628,307 33,234 5,811,759 Allowance for credit losses (1,539) (1,880) (915) (4,334)
Total, net of allowance for credit losses 5,148,679 626,427 32,319 5,807,425
Loans – Business
Investment grade or low risk 1,778,667 128,272 - 1,906,939
Non-investment grade or medium risk 16,934,223 3,794,914 - 20,729,137 Watchlist or high risk - 511,525 - 511,525
Impaired - - 238,215 238,215
Total 18,712,890 4,434,711 238,215 23,385,816
Allowance for credit losses (65,162) (38,409) (23,577) (127,148)
Total, net of allowance for credit losses 18,647,728 4,396,302 214,638 23,258,668
Total loans 23,863,108 5,063,018 271,449 29,197,575
Allowance for credit losses (66,701) (40,289) (24,492) (131,482)
Total Loans, Net of Allowance for Credit Losses $ 23,796,407 $ 5,022,729 $ 246,957 $ 29,066,093
Committed but Undrawn Credit Exposures and Letters of Credit
Investment grade or low risk $ 1,008,007 $ 14,529 $ - $ 1,022,536 Non-investment grade or medium risk 2,737,277 1,601,323 - 4,338,600
Watchlist or high risk - 35,594 - 35,594
Impaired - - - -
Total 3,745,284 1,651,446 - 5,396,730
Allowance for credit losses (1,354) (2,329) - (3,683)
Total, Net of Allowance for Credit Losses $ 3,743,930 $ 1,649,117 $ - $ 5,393,047
As at January 31, 2020
Performing Impaired
Stage 1 Stage 2 Stage 3 Total
Loans – Personal
Low risk $ 3,069,174 $ 47,906 $ - $ 3,117,080
Medium risk 2,280,184 240,247 - 2,520,431
Watchlist or high risk - 134,088 - 134,088 Impaired - - 31,391 31,391
Total 5,349,358 422,241 31,391 5,802,990
Allowance for credit losses (1,337) (1,297) (1,210) (3,844)
Total, net of allowance for credit losses 5,348,021 420,944 30,181 5,799,146
Loans – Business Investment grade or low risk 1,783,326 3,371 - 1,786,697
Non-investment grade or medium risk 19,433,568 1,019,507 - 20,453,075
Watchlist or high risk - 511,850 - 511,850
Impaired - - 211,420 211,420
Total 21,216,894 1,534,728 211,420 22,963,042 Allowance for credit losses (58,354) (27,463) (23,239) (109,056)
Total, net of allowance for credit losses 21,158,540 1,507,265 188,181 22,853,986
Total loans 26,566,252 1,956,969 242,811 28,766,032
Allowance for credit losses (59,691) (28,760) (24,449) (112,900)
Total Loans, Net of Allowance for Credit Losses $ 26,506,561 $ 1,928,209 $ 218,362 $ 28,653,132
Committed but Undrawn Credit Exposures and Letters of Credit
Investment grade or low risk $ 1,058,037 $ - $ - $ 1,058,037
Non-investment grade or medium risk 4,422,549 149,864 - 4,572,413
Watchlist or high risk - 58,137 - 58,137
Impaired - - - -
Total 5,480,586 208,001 - 5,688,587
Allowance for Credit Losses (2,103) (691) - (2,794)
Total, Net of Allowance for Credit Losses $ 5,478,483 $ 207,310 $ - $ 5,685,793
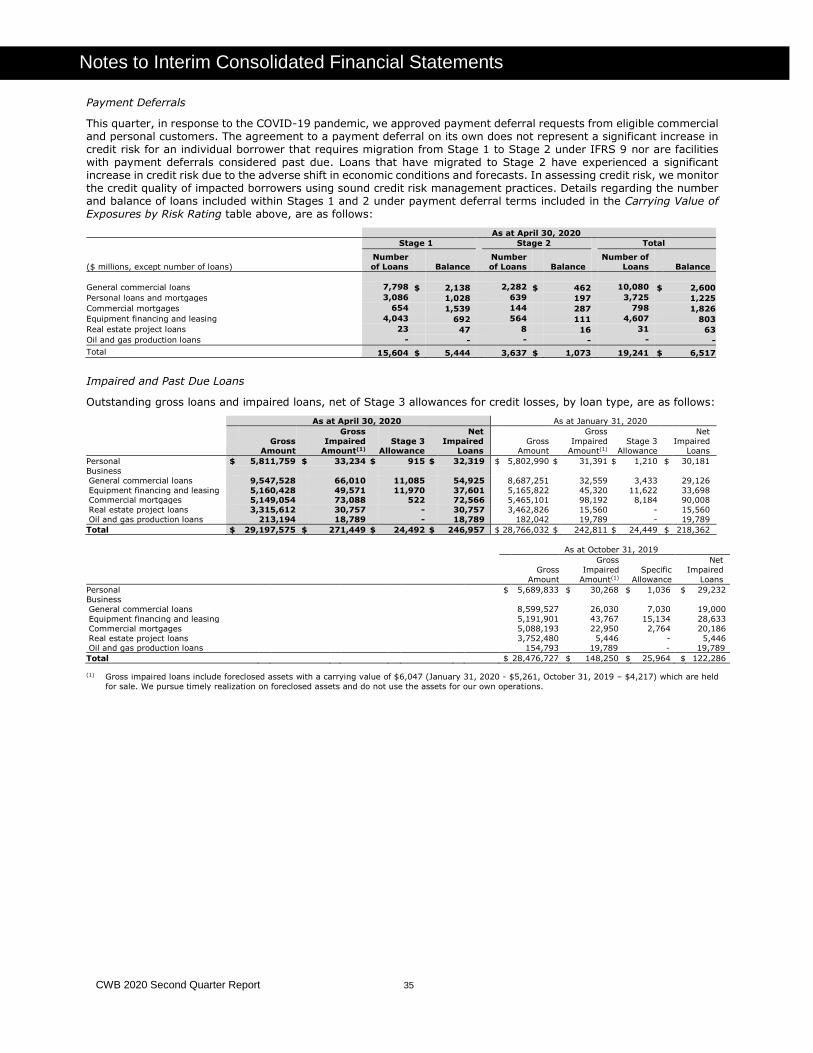
CWB 2020 Second Quarter Report 35
Notes to Interim Consolidated Financial Statements
Payment Deferrals
This quarter, in response to the COVID-19 pandemic, we approved payment deferral requests from eligible commercial and personal customers. The agreement to a payment deferral on its own does not represent a significant increase in credit risk for an individual borrower that requires migration from Stage 1 to Stage 2 under IFRS 9 nor are facilities with payment deferrals considered past due. Loans that have migrated to Stage 2 have experienced a significant increase in credit risk due to the adverse shift in economic conditions and forecasts. In assessing credit risk, we monitor the credit quality of impacted borrowers using sound credit risk management practices. Details regarding the number and balance of loans included within Stages 1 and 2 under payment deferral terms included in the Carrying Value of Exposures by Risk Rating table above, are as follows:
As at April 30, 2020
Stage 1 Stage 2 Total
($ millions, except number of loans)
Number
of Loans Balance
Number
of Loans Balance
Number of
Loans Balance
General commercial loans 7,798 $ 2,138 2,282 $ 462 10,080 $ 2,600
Personal loans and mortgages 3,086 1,028 639 197 3,725 1,225
Commercial mortgages 654 1,539 144 287 798 1,826
Equipment financing and leasing 4,043 692 564 111 4,607 803
Real estate project loans 23 47 8 16 31 63
Oil and gas production loans - - - - - -
Total 15,604 $ 5,444 3,637 $ 1,073 19,241 $ 6,517
Impaired and Past Due Loans
Outstanding gross loans and impaired loans, net of Stage 3 allowances for credit losses, by loan type, are as follows:
As at April 30, 2020 As at January 31, 2020
Gross
Amount
Gross
Impaired Amount(1)
Stage 3 Allowance
Net
Impaired Loans
Gross Amount
Gross
Impaired Amount(1)
Stage 3 Allowance
Net
Impaired Loans
Personal $ 5,811,759 $ 33,234 $ 915 $ 32,319 $ 5,802,990 $ 31,391 $ 1,210 $ 30,181
Business
General commercial loans 9,547,528 66,010 11,085 54,925 8,687,251 32,559 3,433 29,126
Equipment financing and leasing 5,160,428 49,571 11,970 37,601 5,165,822 45,320 11,622 33,698 Commercial mortgages 5,149,054 73,088 522 72,566 5,465,101 98,192 8,184 90,008
Real estate project loans 3,315,612 30,757 - 30,757 3,462,826 15,560 - 15,560
Oil and gas production loans 213,194 18,789 - 18,789 182,042 19,789 - 19,789
Total $ 29,197,575 $ 271,449 $ 24,492 $ 246,957 $ 28,766,032 $ 242,811 $ 24,449 $ 218,362
As at October 31, 2019
Gross
Amount
Gross
Impaired
Amount(1)
Specific
Allowance
Net
Impaired
Loans
Personal $ 5,689,833 $ 30,268 $ 1,036 $ 29,232 Business
General commercial loans 8,599,527 26,030 7,030 19,000
Equipment financing and leasing 5,191,901 43,767 15,134 28,633
Commercial mortgages 5,088,193 22,950 2,764 20,186
Real estate project loans 3,752,480 5,446 - 5,446 Oil and gas production loans 154,793 19,789 - 19,789
Total $ 28,476,727 $ 148,250 $ 25,964 $ 122,286
(1) Gross impaired loans include foreclosed assets with a carrying value of $6,047 (January 31, 2020 - $5,261, October 31, 2019 – $4,217) which are held
for sale. We pursue timely realization on foreclosed assets and do not use the assets for our own operations.
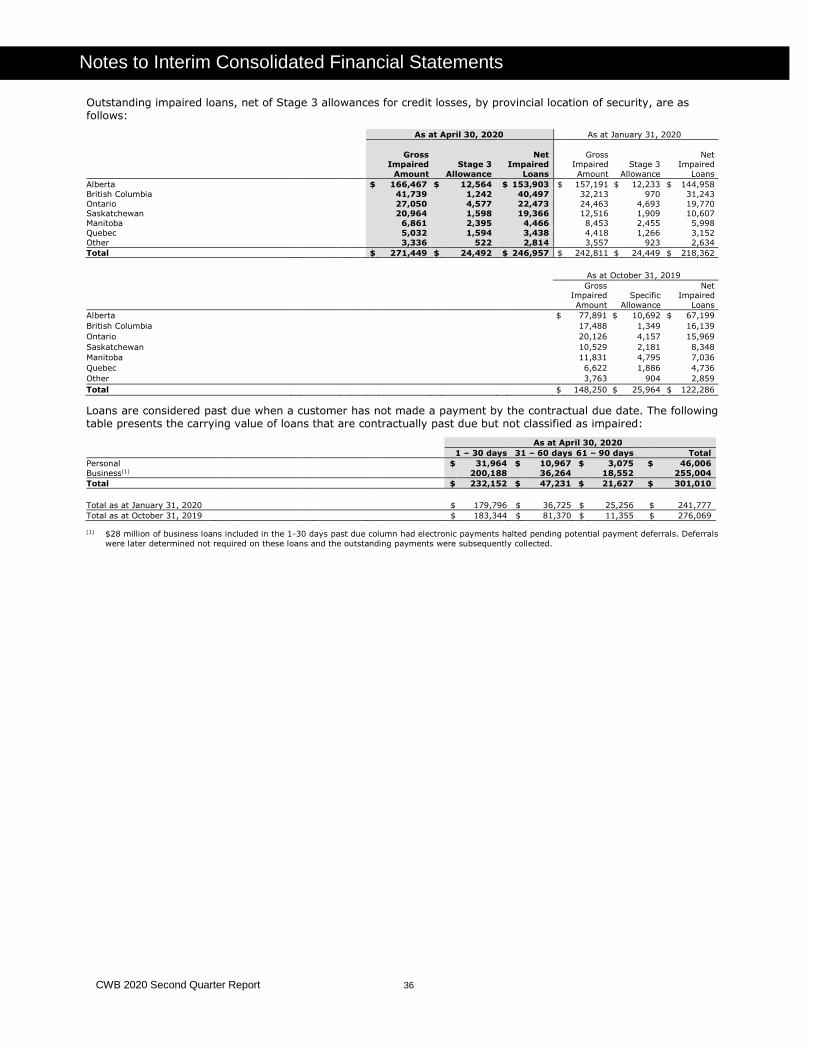
CWB 2020 Second Quarter Report 36
Notes to Interim Consolidated Financial Statements
Outstanding impaired loans, net of Stage 3 allowances for credit losses, by provincial location of security, are as follows:
As at April 30, 2020 As at January 31, 2020
Gross Impaired
Amount
Stage 3
Allowance
Net Impaired
Loans
Gross Impaired
Amount
Stage 3
Allowance
Net Impaired
Loans
Alberta $ 166,467 $ 12,564 $ 153,903 $ 157,191 $ 12,233 $ 144,958
British Columbia 41,739 1,242 40,497 32,213 970 31,243
Ontario 27,050 4,577 22,473 24,463 4,693 19,770 Saskatchewan 20,964 1,598 19,366 12,516 1,909 10,607
Manitoba 6,861 2,395 4,466 8,453 2,455 5,998
Quebec 5,032 1,594 3,438 4,418 1,266 3,152
Other 3,336 522 2,814 3,557 923 2,634
Total $ 271,449 $ 24,492 $ 246,957 $ 242,811 $ 24,449 $ 218,362
As at October 31, 2019
Gross Impaired
Amount
Specific
Allowance
Net Impaired
Loans
Alberta $ 77,891 $ 10,692 $ 67,199
British Columbia 17,488 1,349 16,139
Ontario 20,126 4,157 15,969
Saskatchewan 10,529 2,181 8,348
Manitoba 11,831 4,795 7,036
Quebec 6,622 1,886 4,736
Other 3,763 904 2,859
Total $ 148,250 $ 25,964 $ 122,286
Loans are considered past due when a customer has not made a payment by the contractual due date. The following table presents the carrying value of loans that are contractually past due but not classified as impaired:
As at April 30, 2020
1 – 30 days 31 – 60 days 61 – 90 days Total
Personal $ 31,964 $ 10,967 $ 3,075 $ 46,006
Business(1) 200,188 36,264 18,552 255,004
Total $ 232,152 $ 47,231 $ 21,627 $ 301,010
Total as at January 31, 2020 $ 179,796 $ 36,725 $ 25,256 $ 241,777
Total as at October 31, 2019 $ 183,344 $ 81,370 $ 11,355 $ 276,069
(1) $28 million of business loans included in the 1-30 days past due column had electronic payments halted pending potential payment deferrals. Deferrals
were later determined not required on these loans and the outstanding payments were subsequently collected.
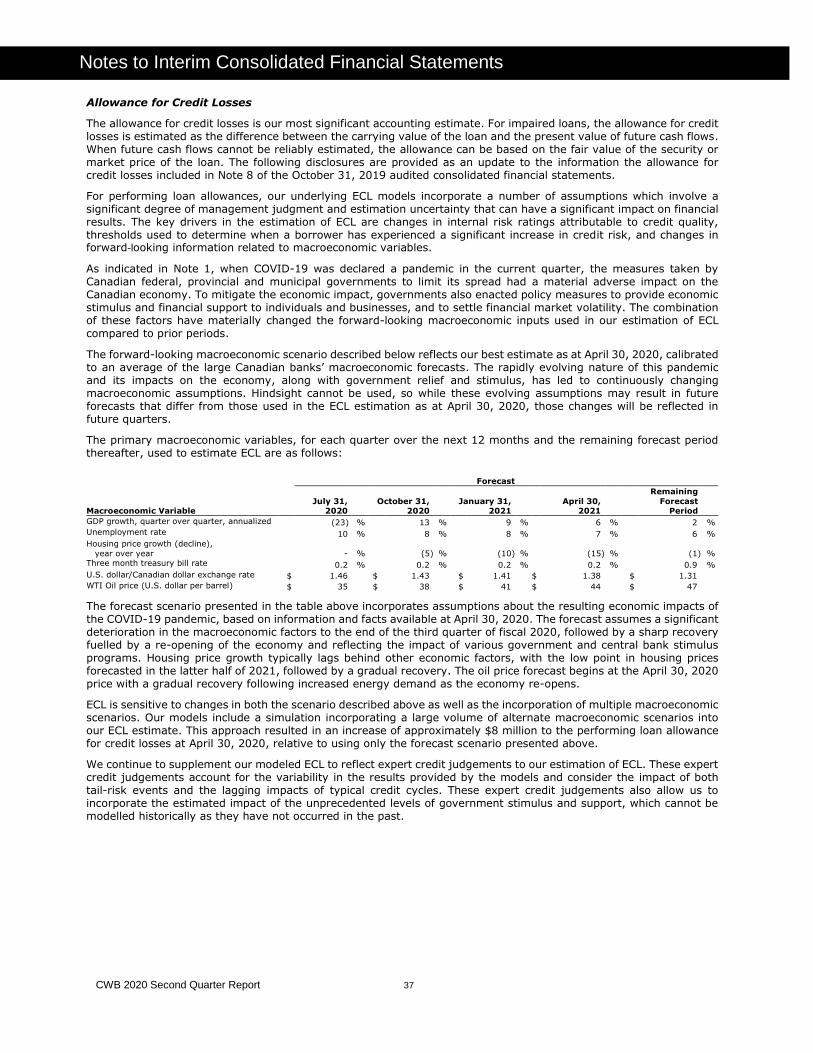
CWB 2020 Second Quarter Report 37
Notes to Interim Consolidated Financial Statements
Allowance for Credit Losses
The allowance for credit losses is our most significant accounting estimate. For impaired loans, the allowance for credit losses is estimated as the difference between the carrying value of the loan and the present value of future cash flows. When future cash flows cannot be reliably estimated, the allowance can be based on the fair value of the security or market price of the loan. The following disclosures are provided as an update to the information the allowance for credit losses included in Note 8 of the October 31, 2019 audited consolidated financial statements.
For performing loan allowances, our underlying ECL models incorporate a number of assumptions which involve a significant degree of management judgment and estimation uncertainty that can have a significant impact on financial results. The key drivers in the estimation of ECL are changes in internal risk ratings attributable to credit quality, thresholds used to determine when a borrower has experienced a significant increase in credit risk, and changes in forward-looking information related to macroeconomic variables.
As indicated in Note 1, when COVID-19 was declared a pandemic in the current quarter, the measures taken by Canadian federal, provincial and municipal governments to limit its spread had a material adverse impact on the Canadian economy. To mitigate the economic impact, governments also enacted policy measures to provide economic stimulus and financial support to individuals and businesses, and to settle financial market volatility. The combination of these factors have materially changed the forward-looking macroeconomic inputs used in our estimation of ECL compared to prior periods.
The forward-looking macroeconomic scenario described below reflects our best estimate as at April 30, 2020, calibrated to an average of the large Canadian banks’ macroeconomic forecasts. The rapidly evolving nature of this pandemic and its impacts on the economy, along with government relief and stimulus, has led to continuously changing macroeconomic assumptions. Hindsight cannot be used, so while these evolving assumptions may result in future forecasts that differ from those used in the ECL estimation as at April 30, 2020, those changes will be reflected in future quarters.
The primary macroeconomic variables, for each quarter over the next 12 months and the remaining forecast period thereafter, used to estimate ECL are as follows:
Forecast
Macroeconomic Variable July 31,
2020 October 31,
2020 January 31,
2021 April 30,
2021
Remaining
Forecast Period
GDP growth, quarter over quarter, annualized (23) % 13 % 9 % 6 % 2 % Unemployment rate 10 % 8 % 8 % 7 % 6 %
Housing price growth (decline),
year over year - % (5) % (10) % (15) % (1) % Three month treasury bill rate 0.2 % 0.2 % 0.2 % 0.2 % 0.9 %
U.S. dollar/Canadian dollar exchange rate $ 1.46 $ 1.43 $ 1.41 $ 1.38 $ 1.31
WTI Oil price (U.S. dollar per barrel) $ 35 $ 38 $ 41 $ 44 $ 47
The forecast scenario presented in the table above incorporates assumptions about the resulting economic impacts of the COVID-19 pandemic, based on information and facts available at April 30, 2020. The forecast assumes a significant deterioration in the macroeconomic factors to the end of the third quarter of fiscal 2020, followed by a sharp recovery fuelled by a re-opening of the economy and reflecting the impact of various government and central bank stimulus programs. Housing price growth typically lags behind other economic factors, with the low point in housing prices forecasted in the latter half of 2021, followed by a gradual recovery. The oil price forecast begins at the April 30, 2020 price with a gradual recovery following increased energy demand as the economy re-opens.
ECL is sensitive to changes in both the scenario described above as well as the incorporation of multiple macroeconomic scenarios. Our models include a simulation incorporating a large volume of alternate macroeconomic scenarios into our ECL estimate. This approach resulted in an increase of approximately $8 million to the performing loan allowance for credit losses at April 30, 2020, relative to using only the forecast scenario presented above.
We continue to supplement our modeled ECL to reflect expert credit judgements to our estimation of ECL. These expert credit judgements account for the variability in the results provided by the models and consider the impact of both tail-risk events and the lagging impacts of typical credit cycles. These expert credit judgements also allow us to incorporate the estimated impact of the unprecedented levels of government stimulus and support, which cannot be modelled historically as they have not occurred in the past.
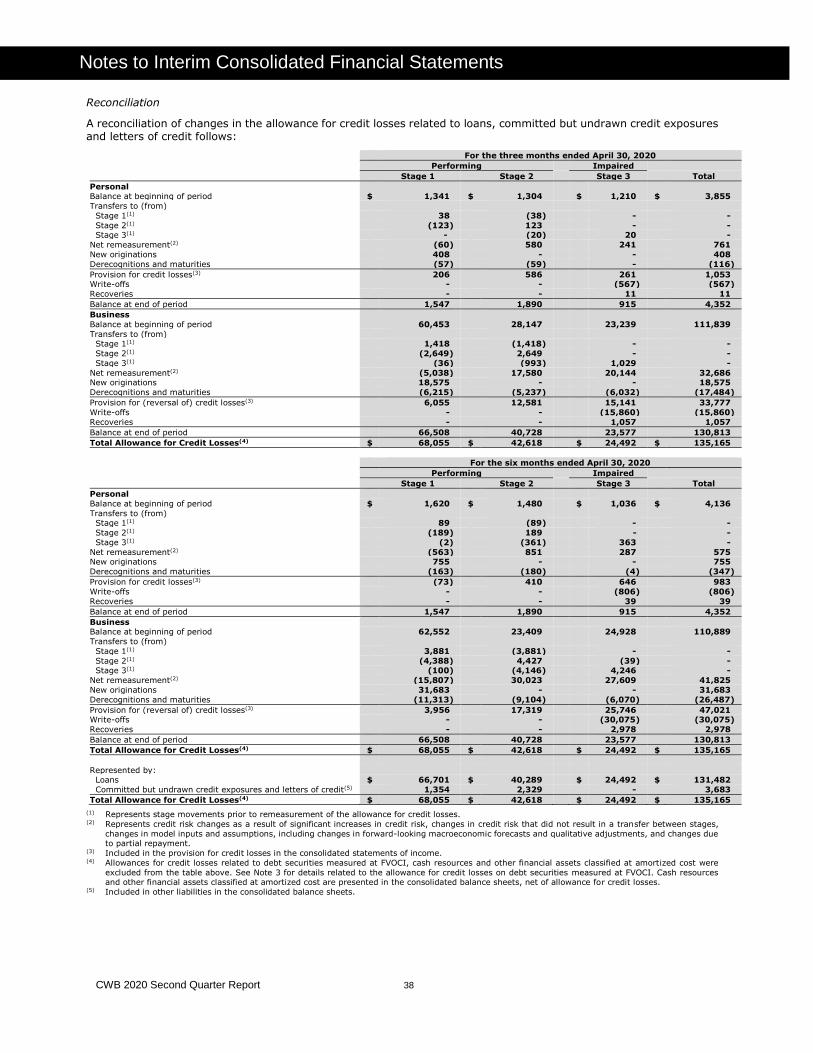
CWB 2020 Second Quarter Report 38
Notes to Interim Consolidated Financial Statements
Reconciliation
A reconciliation of changes in the allowance for credit losses related to loans, committed but undrawn credit exposures and letters of credit follows:
For the three months ended April 30, 2020
Performing Impaired
Stage 1 Stage 2 Stage 3 Total
Personal Balance at beginning of period $ 1,341 $ 1,304 $ 1,210 $ 3,855
Transfers to (from)
Stage 1(1) 38 (38) - -
Stage 2(1) (123) 123 - - Stage 3(1) - (20) 20 -
Net remeasurement(2) (60) 580 241 761
New originations 408 - - 408
Derecognitions and maturities (57) (59) - (116)
Provision for credit losses(3) 206 586 261 1,053 Write-offs - - (567) (567)
Recoveries - - 11 11
Balance at end of period 1,547 1,890 915 4,352
Business
Balance at beginning of period 60,453 28,147 23,239 111,839
Transfers to (from) Stage 1(1) 1,418 (1,418) - -
Stage 2(1) (2,649) 2,649 - -
Stage 3(1) (36) (993) 1,029 -
Net remeasurement(2) (5,038) 17,580 20,144 32,686 New originations 18,575 - - 18,575
Derecognitions and maturities (6,215) (5,237) (6,032) (17,484)
Provision for (reversal of) credit losses(3) 6,055 12,581 15,141 33,777
Write-offs - - (15,860) (15,860)
Recoveries - - 1,057 1,057
Balance at end of period 66,508 40,728 23,577 130,813
Total Allowance for Credit Losses(4) $ 68,055 $ 42,618 $ 24,492 $ 135,165
For the six months ended April 30, 2020
Performing Impaired
Stage 1 Stage 2 Stage 3 Total
Personal
Balance at beginning of period $ 1,620 $ 1,480 $ 1,036 $ 4,136
Transfers to (from) Stage 1(1) 89 (89) - -
Stage 2(1) (189) 189 - -
Stage 3(1) (2) (361) 363 -
Net remeasurement(2) (563) 851 287 575 New originations 755 - - 755
Derecognitions and maturities (163) (180) (4) (347)
Provision for credit losses(3) (73) 410 646 983
Write-offs - - (806) (806)
Recoveries - - 39 39
Balance at end of period 1,547 1,890 915 4,352
Business Balance at beginning of period 62,552 23,409 24,928 110,889
Transfers to (from)
Stage 1(1) 3,881 (3,881) - -
Stage 2(1) (4,388) 4,427 (39) - Stage 3(1) (100) (4,146) 4,246 -
Net remeasurement(2) (15,807) 30,023 27,609 41,825
New originations 31,683 - - 31,683
Derecognitions and maturities (11,313) (9,104) (6,070) (26,487)
Provision for (reversal of) credit losses(3) 3,956 17,319 25,746 47,021 Write-offs - - (30,075) (30,075)
Recoveries - - 2,978 2,978
Balance at end of period 66,508 40,728 23,577 130,813
Total Allowance for Credit Losses(4) $ 68,055 $ 42,618 $ 24,492 $ 135,165
Represented by: Loans $ 66,701 $ 40,289 $ 24,492 $ 131,482
Committed but undrawn credit exposures and letters of credit(5) 1,354 2,329 - 3,683
Total Allowance for Credit Losses(4) $ 68,055 $ 42,618 $ 24,492 $ 135,165
(1) Represents stage movements prior to remeasurement of the allowance for credit losses. (2) Represents credit risk changes as a result of significant increases in credit risk, changes in credit risk that did not result in a transfer between stages,
changes in model inputs and assumptions, including changes in forward-looking macroeconomic forecasts and qualitative adjustments, and changes due to partial repayment.
(3) Included in the provision for credit losses in the consolidated statements of income. (4) Allowances for credit losses related to debt securities measured at FVOCI, cash resources and other financial assets classified at amortized cost were
excluded from the table above. See Note 3 for details related to the allowance for credit losses on debt securities measured at FVOCI. Cash resources and other financial assets classified at amortized cost are presented in the consolidated balance sheets, net of allowance for credit losses.
(5) Included in other liabilities in the consolidated balance sheets.
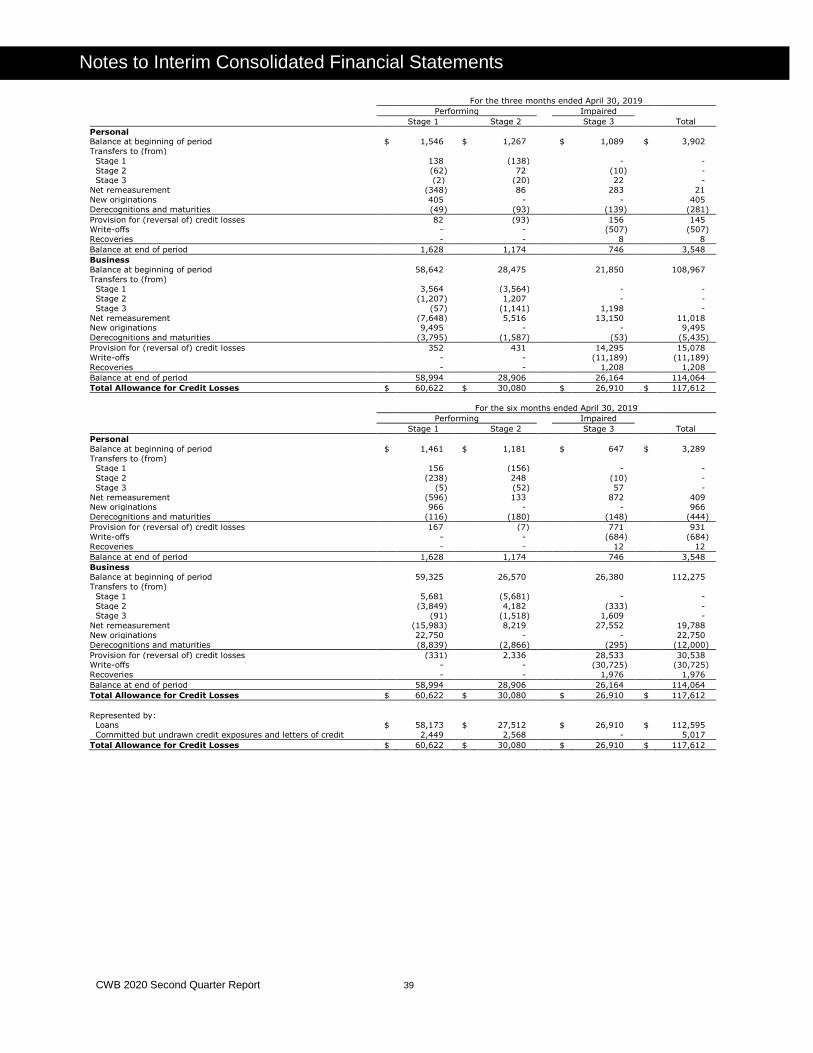
CWB 2020 Second Quarter Report 39
Notes to Interim Consolidated Financial Statements
For the three months ended April 30, 2019
Performing Impaired
Stage 1 Stage 2 Stage 3 Total
Personal Balance at beginning of period $ 1,546 $ 1,267 $ 1,089 $ 3,902
Transfers to (from)
Stage 1 138 (138) - -
Stage 2 (62) 72 (10) - Stage 3 (2) (20) 22 -
Net remeasurement (348) 86 283 21
New originations 405 - - 405
Derecognitions and maturities (49) (93) (139) (281)
Provision for (reversal of) credit losses 82 (93) 156 145 Write-offs - - (507) (507)
Recoveries - - 8 8
Balance at end of period 1,628 1,174 746 3,548
Business
Balance at beginning of period 58,642 28,475 21,850 108,967
Transfers to (from) Stage 1 3,564 (3,564) - -
Stage 2 (1,207) 1,207 - -
Stage 3 (57) (1,141) 1,198 -
Net remeasurement (7,648) 5,516 13,150 11,018 New originations 9,495 - - 9,495
Derecognitions and maturities (3,795) (1,587) (53) (5,435)
Provision for (reversal of) credit losses 352 431 14,295 15,078
Write-offs - - (11,189) (11,189)
Recoveries - - 1,208 1,208
Balance at end of period 58,994 28,906 26,164 114,064
Total Allowance for Credit Losses $ 60,622 $ 30,080 $ 26,910 $ 117,612
For the six months ended April 30, 2019
Performing Impaired
Stage 1 Stage 2 Stage 3 Total
Personal
Balance at beginning of period $ 1,461 $ 1,181 $ 647 $ 3,289
Transfers to (from) Stage 1 156 (156) - -
Stage 2 (238) 248 (10) -
Stage 3 (5) (52) 57 -
Net remeasurement (596) 133 872 409 New originations 966 - - 966
Derecognitions and maturities (116) (180) (148) (444)
Provision for (reversal of) credit losses 167 (7) 771 931
Write-offs - - (684) (684)
Recoveries - - 12 12
Balance at end of period 1,628 1,174 746 3,548
Business
Balance at beginning of period 59,325 26,570 26,380 112,275
Transfers to (from)
Stage 1 5,681 (5,681) - -
Stage 2 (3,849) 4,182 (333) - Stage 3 (91) (1,518) 1,609 -
Net remeasurement (15,983) 8,219 27,552 19,788
New originations 22,750 - - 22,750
Derecognitions and maturities (8,839) (2,866) (295) (12,000)
Provision for (reversal of) credit losses (331) 2,336 28,533 30,538 Write-offs - - (30,725) (30,725)
Recoveries - - 1,976 1,976
Balance at end of period 58,994 28,906 26,164 114,064
Total Allowance for Credit Losses $ 60,622 $ 30,080 $ 26,910 $ 117,612
Represented by: Loans $ 58,173 $ 27,512 $ 26,910 $ 112,595
Committed but undrawn credit exposures and letters of credit 2,449 2,568 - 5,017
Total Allowance for Credit Losses $ 60,622 $ 30,080 $ 26,910 $ 117,612
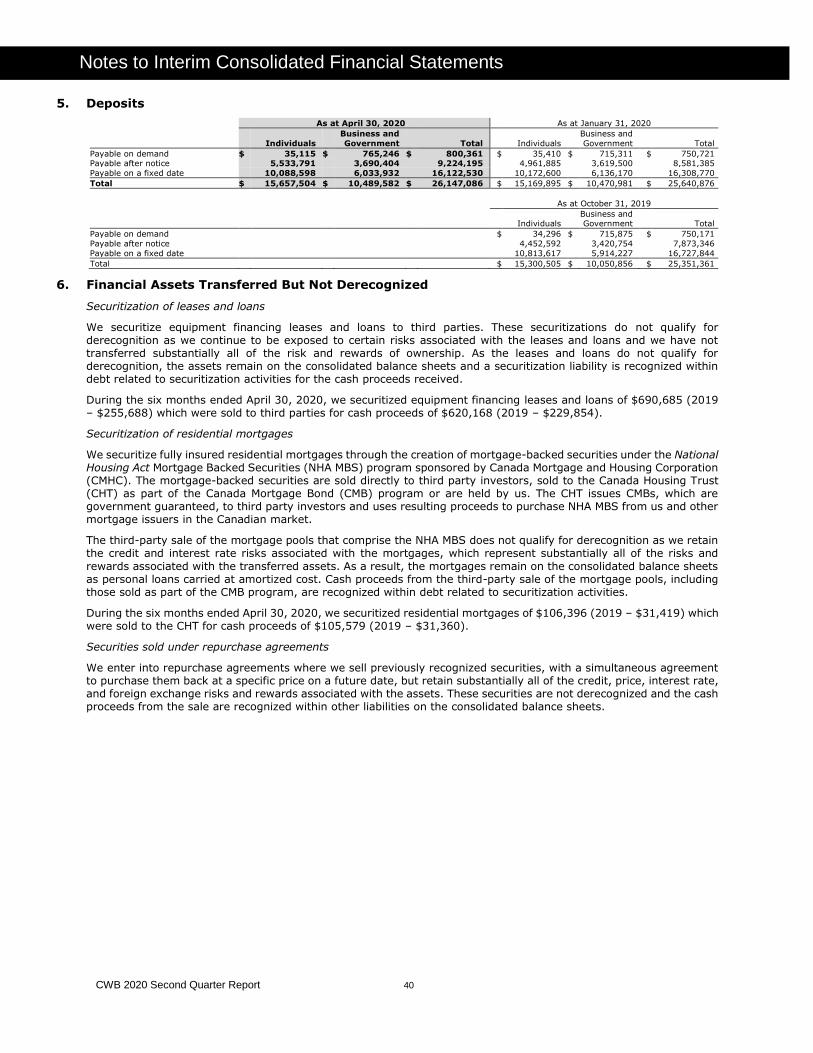
CWB 2020 Second Quarter Report 40
Notes to Interim Consolidated Financial Statements
5. Deposits
As at April 30, 2020 As at January 31, 2020
Individuals
Business and
Government Total Individuals
Business and
Government Total
Payable on demand $ 35,115 $ 765,246 $ 800,361 $ 35,410 $ 715,311 $ 750,721 Payable after notice 5,533,791 3,690,404 9,224,195 4,961,885 3,619,500 8,581,385
Payable on a fixed date 10,088,598 6,033,932 16,122,530 10,172,600 6,136,170 16,308,770
Total $ 15,657,504 $ 10,489,582 $ 26,147,086 $ 15,169,895 $ 10,470,981 $ 25,640,876
As at October 31, 2019
Individuals Business and Government Total
Payable on demand $ 34,296 $ 715,875 $ 750,171
Payable after notice 4,452,592 3,420,754 7,873,346
Payable on a fixed date 10,813,617 5,914,227 16,727,844
Total $ 15,300,505 $ 10,050,856 $ 25,351,361
6. Financial Assets Transferred But Not Derecognized
Securitization of leases and loans
We securitize equipment financing leases and loans to third parties. These securitizations do not qualify for derecognition as we continue to be exposed to certain risks associated with the leases and loans and we have not transferred substantially all of the risk and rewards of ownership. As the leases and loans do not qualify for derecognition, the assets remain on the consolidated balance sheets and a securitization liability is recognized within debt related to securitization activities for the cash proceeds received.
During the six months ended April 30, 2020, we securitized equipment financing leases and loans of $690,685 (2019 – $255,688) which were sold to third parties for cash proceeds of $620,168 (2019 – $229,854).
Securitization of residential mortgages
We securitize fully insured residential mortgages through the creation of mortgage-backed securities under the National Housing Act Mortgage Backed Securities (NHA MBS) program sponsored by Canada Mortgage and Housing Corporation (CMHC). The mortgage-backed securities are sold directly to third party investors, sold to the Canada Housing Trust (CHT) as part of the Canada Mortgage Bond (CMB) program or are held by us. The CHT issues CMBs, which are government guaranteed, to third party investors and uses resulting proceeds to purchase NHA MBS from us and other mortgage issuers in the Canadian market.
The third-party sale of the mortgage pools that comprise the NHA MBS does not qualify for derecognition as we retain the credit and interest rate risks associated with the mortgages, which represent substantially all of the risks and
rewards associated with the transferred assets. As a result, the mortgages remain on the consolidated balance sheets as personal loans carried at amortized cost. Cash proceeds from the third-party sale of the mortgage pools, including those sold as part of the CMB program, are recognized within debt related to securitization activities.
During the six months ended April 30, 2020, we securitized residential mortgages of $106,396 (2019 – $31,419) which were sold to the CHT for cash proceeds of $105,579 (2019 – $31,360).
Securities sold under repurchase agreements
We enter into repurchase agreements where we sell previously recognized securities, with a simultaneous agreement to purchase them back at a specific price on a future date, but retain substantially all of the credit, price, interest rate, and foreign exchange risks and rewards associated with the assets. These securities are not derecognized and the cash proceeds from the sale are recognized within other liabilities on the consolidated balance sheets.
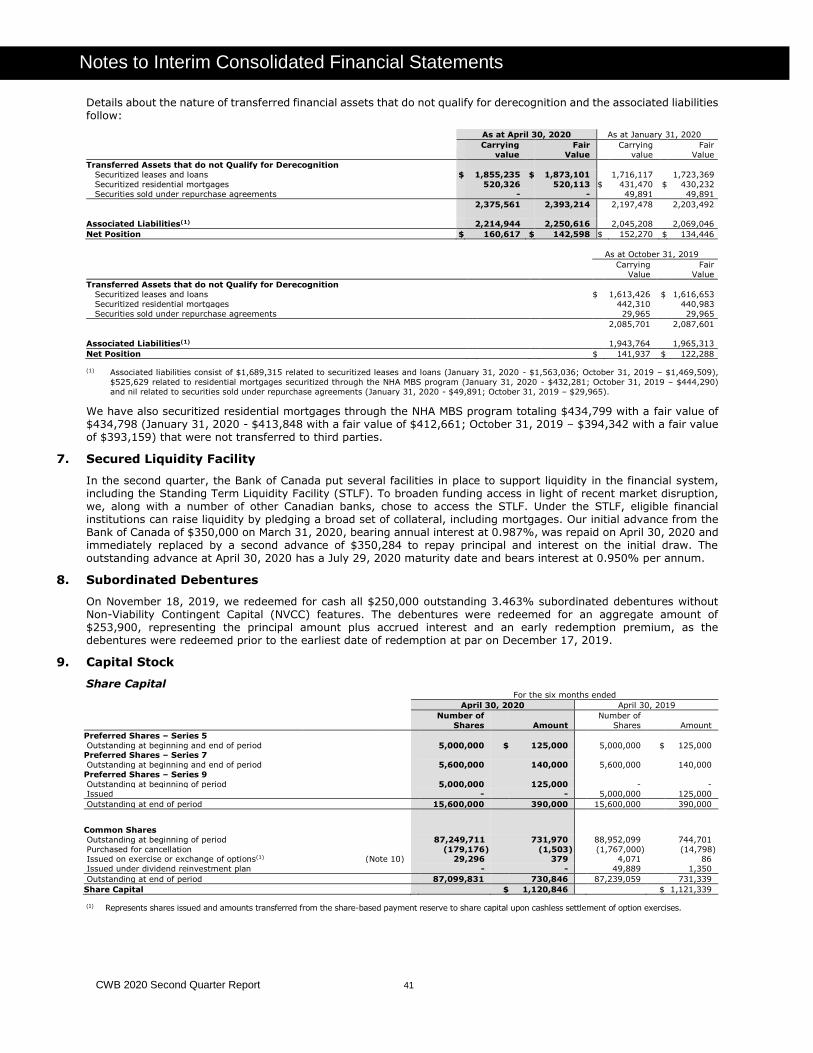
CWB 2020 Second Quarter Report 41
Notes to Interim Consolidated Financial Statements
Details about the nature of transferred financial assets that do not qualify for derecognition and the associated liabilities follow:
As at April 30, 2020 As at January 31, 2020
Carrying
value
Fair
Value
Carrying
value
Fair
Value
Transferred Assets that do not Qualify for Derecognition
Securitized leases and loans $ 1,855,235 $ 1,873,101 1,716,117 1,723,369
Securitized residential mortgages 520,326 520,113 $ 431,470 $ 430,232
Securities sold under repurchase agreements - - 49,891 49,891
2,375,561 2,393,214 2,197,478 2,203,492
Associated Liabilities(1) 2,214,944 2,250,616 2,045,208 2,069,046
Net Position $ 160,617 $ 142,598 $ 152,270 $ 134,446
As at October 31, 2019
Carrying
Value
Fair
Value
Transferred Assets that do not Qualify for Derecognition
Securitized leases and loans $ 1,613,426 $ 1,616,653
Securitized residential mortgages 442,310 440,983
Securities sold under repurchase agreements 29,965 29,965
2,085,701 2,087,601
Associated Liabilities(1) 1,943,764 1,965,313
Net Position $ 141,937 $ 122,288
(1) Associated liabilities consist of $1,689,315 related to securitized leases and loans (January 31, 2020 - $1,563,036; October 31, 2019 – $1,469,509),
$525,629 related to residential mortgages securitized through the NHA MBS program (January 31, 2020 - $432,281; October 31, 2019 – $444,290)
and nil related to securities sold under repurchase agreements (January 31, 2020 - $49,891; October 31, 2019 – $29,965).
We have also securitized residential mortgages through the NHA MBS program totaling $434,799 with a fair value of $434,798 (January 31, 2020 - $413,848 with a fair value of $412,661; October 31, 2019 – $394,342 with a fair value of $393,159) that were not transferred to third parties.
7. Secured Liquidity Facility
In the second quarter, the Bank of Canada put several facilities in place to support liquidity in the financial system, including the Standing Term Liquidity Facility (STLF). To broaden funding access in light of recent market disruption, we, along with a number of other Canadian banks, chose to access the STLF. Under the STLF, eligible financial institutions can raise liquidity by pledging a broad set of collateral, including mortgages. Our initial advance from the Bank of Canada of $350,000 on March 31, 2020, bearing annual interest at 0.987%, was repaid on April 30, 2020 and immediately replaced by a second advance of $350,284 to repay principal and interest on the initial draw. The outstanding advance at April 30, 2020 has a July 29, 2020 maturity date and bears interest at 0.950% per annum.
8. Subordinated Debentures
On November 18, 2019, we redeemed for cash all $250,000 outstanding 3.463% subordinated debentures without Non-Viability Contingent Capital (NVCC) features. The debentures were redeemed for an aggregate amount of $253,900, representing the principal amount plus accrued interest and an early redemption premium, as the debentures were redeemed prior to the earliest date of redemption at par on December 17, 2019.
9. Capital Stock
Share Capital For the six months ended
April 30, 2020 April 30, 2019
Number of
Shares Amount
Number of
Shares Amount
Preferred Shares – Series 5
Outstanding at beginning and end of period 5,000,000 $ 125,000 5,000,000 $ 125,000 Preferred Shares – Series 7
Outstanding at beginning and end of period 5,600,000 140,000 5,600,000 140,000
Preferred Shares – Series 9
Outstanding at beginning of period 5,000,000 125,000 - - Issued - - 5,000,000 125,000
Outstanding at end of period 15,600,000 390,000 15,600,000 390,000
Common Shares
Outstanding at beginning of period 87,249,711 731,970 88,952,099 744,701
Purchased for cancellation (179,176) (1,503) (1,767,000) (14,798) Issued on exercise or exchange of options(1) (Note 10) 29,296 379 4,071 86
Issued under dividend reinvestment plan - - 49,889 1,350
Outstanding at end of period 87,099,831 730,846 87,239,059 731,339
Share Capital $ 1,120,846 $ 1,121,339
(1) Represents shares issued and amounts transferred from the share-based payment reserve to share capital upon cashless settlement of option exercises.
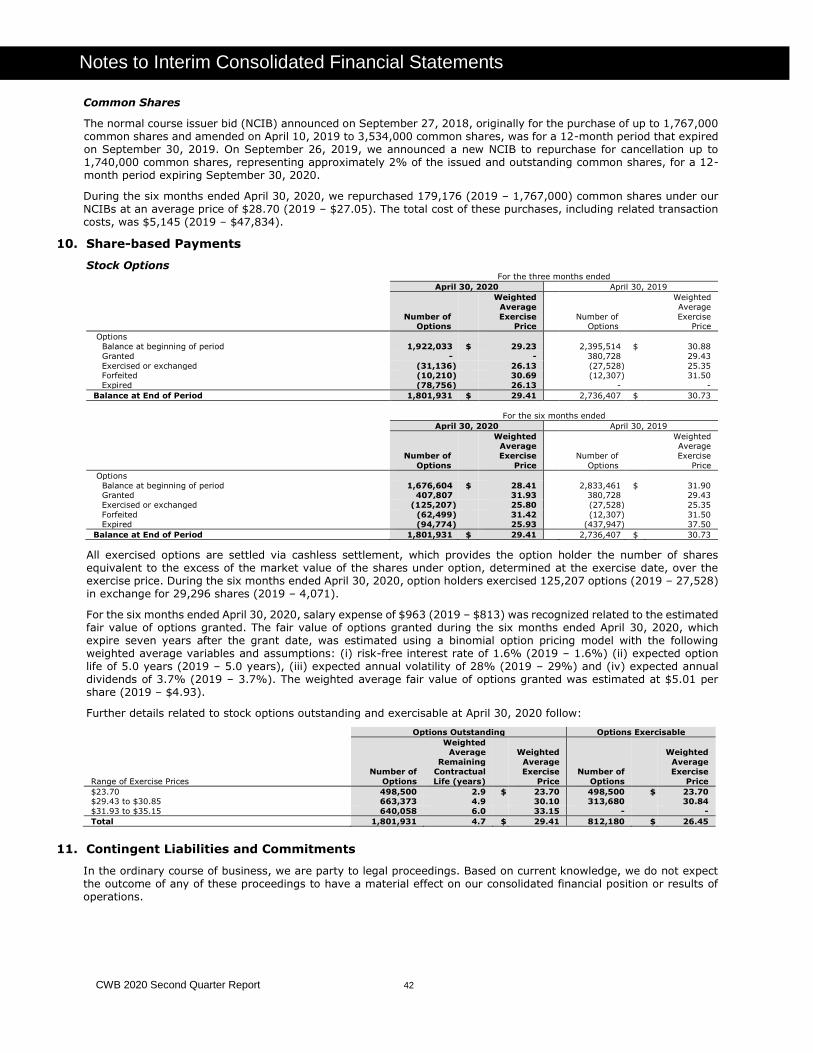
CWB 2020 Second Quarter Report 42
Notes to Interim Consolidated Financial Statements
Common Shares
The normal course issuer bid (NCIB) announced on September 27, 2018, originally for the purchase of up to 1,767,000 common shares and amended on April 10, 2019 to 3,534,000 common shares, was for a 12-month period that expired on September 30, 2019. On September 26, 2019, we announced a new NCIB to repurchase for cancellation up to 1,740,000 common shares, representing approximately 2% of the issued and outstanding common shares, for a 12-month period expiring September 30, 2020.
During the six months ended April 30, 2020, we repurchased 179,176 (2019 – 1,767,000) common shares under our NCIBs at an average price of $28.70 (2019 – $27.05). The total cost of these purchases, including related transaction costs, was $5,145 (2019 – $47,834).
10. Share-based Payments
Stock Options For the three months ended
April 30, 2020 April 30, 2019
Number of Options
Weighted
Average
Exercise Price
Number of Options
Weighted
Average
Exercise Price
Options
Balance at beginning of period 1,922,033 $ 29.23 2,395,514 $ 30.88
Granted - - 380,728 29.43
Exercised or exchanged (31,136) 26.13 (27,528) 25.35 Forfeited (10,210) 30.69 (12,307) 31.50
Expired (78,756) 26.13 - -
Balance at End of Period 1,801,931 $ 29.41 2,736,407 $ 30.73
For the six months ended
April 30, 2020 April 30, 2019
Number of
Options
Weighted Average
Exercise
Price
Number of
Options
Weighted Average
Exercise
Price
Options
Balance at beginning of period 1,676,604 $ 28.41 2,833,461 $ 31.90 Granted 407,807 31.93 380,728 29.43
Exercised or exchanged (125,207) 25.80 (27,528) 25.35
Forfeited (62,499) 31.42 (12,307) 31.50
Expired (94,774) 25.93 (437,947) 37.50
Balance at End of Period 1,801,931 $ 29.41 2,736,407 $ 30.73
All exercised options are settled via cashless settlement, which provides the option holder the number of shares equivalent to the excess of the market value of the shares under option, determined at the exercise date, over the exercise price. During the six months ended April 30, 2020, option holders exercised 125,207 options (2019 – 27,528) in exchange for 29,296 shares (2019 – 4,071).
For the six months ended April 30, 2020, salary expense of $963 (2019 – $813) was recognized related to the estimated fair value of options granted. The fair value of options granted during the six months ended April 30, 2020, which expire seven years after the grant date, was estimated using a binomial option pricing model with the following weighted average variables and assumptions: (i) risk-free interest rate of 1.6% (2019 – 1.6%) (ii) expected option life of 5.0 years (2019 – 5.0 years), (iii) expected annual volatility of 28% (2019 – 29%) and (iv) expected annual dividends of 3.7% (2019 – 3.7%). The weighted average fair value of options granted was estimated at $5.01 per share (2019 – $4.93).
Further details related to stock options outstanding and exercisable at April 30, 2020 follow:
Options Outstanding Options Exercisable
Range of Exercise Prices
Number of
Options
Weighted Average
Remaining
Contractual
Life (years)
Weighted
Average
Exercise
Price
Number of
Options
Weighted
Average
Exercise
Price
$23.70 498,500 2.9 $ 23.70 498,500 $ 23.70 $29.43 to $30.85 663,373 4.9 30.10 313,680 30.84
$31.93 to $35.15 640,058 6.0 33.15 - -
Total 1,801,931 4.7 $ 29.41 812,180 $ 26.45
11. Contingent Liabilities and Commitments
In the ordinary course of business, we are party to legal proceedings. Based on current knowledge, we do not expect the outcome of any of these proceedings to have a material effect on our consolidated financial position or results of operations.
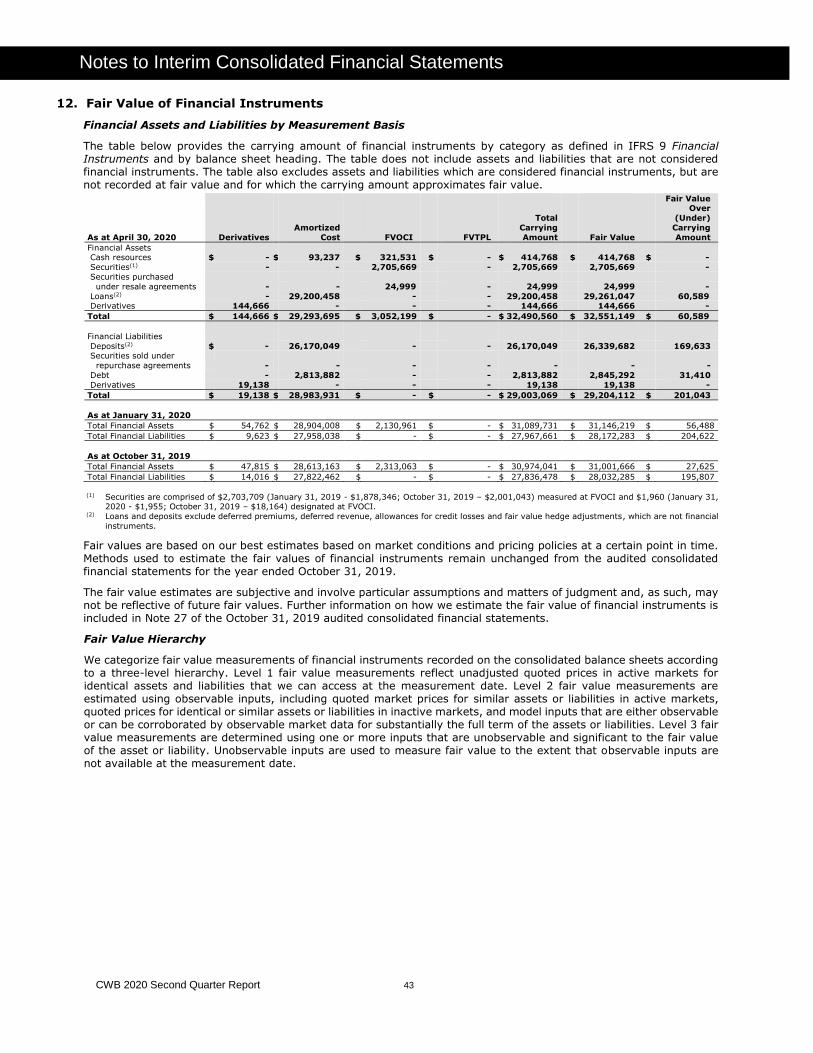
CWB 2020 Second Quarter Report 43
Notes to Interim Consolidated Financial Statements
12. Fair Value of Financial Instruments
Financial Assets and Liabilities by Measurement Basis
The table below provides the carrying amount of financial instruments by category as defined in IFRS 9 Financial Instruments and by balance sheet heading. The table does not include assets and liabilities that are not considered financial instruments. The table also excludes assets and liabilities which are considered financial instruments, but are not recorded at fair value and for which the carrying amount approximates fair value.
As at April 30, 2020
Derivatives
Amortized
Cost
FVOCI
FVTPL
Total
Carrying
Amount
Fair Value
Fair Value Over
(Under)
Carrying
Amount
Financial Assets Cash resources $ - $ 93,237 $ 321,531 $ - $ 414,768 $ 414,768 $ -
Securities(1) - - 2,705,669 - 2,705,669 2,705,669 -
Securities purchased
under resale agreements - - 24,999 - 24,999 24,999 -
Loans(2) - 29,200,458 - - 29,200,458 29,261,047 60,589 Derivatives 144,666 - - - 144,666 144,666 -
Total $ 144,666 $ 29,293,695 $ 3,052,199 $ - $ 32,490,560 $ 32,551,149 $ 60,589
Financial Liabilities
Deposits(2) $ - 26,170,049 - - 26,170,049 26,339,682 169,633 Securities sold under
repurchase agreements
-
-
-
-
-
-
-
Debt - 2,813,882 - - 2,813,882 2,845,292 31,410
Derivatives 19,138 - - - 19,138 19,138 -
Total $ 19,138 $ 28,983,931 $ - $ - $ 29,003,069 $ 29,204,112 $ 201,043
As at January 31, 2020
Total Financial Assets $ 54,762 $ 28,904,008 $ 2,130,961 $ - $ 31,089,731 $ 31,146,219 $ 56,488
Total Financial Liabilities $ 9,623 $ 27,958,038 $ - $ - $ 27,967,661 $ 28,172,283 $ 204,622
As at October 31, 2019
Total Financial Assets $ 47,815 $ 28,613,163 $ 2,313,063 $ - $ 30,974,041 $ 31,001,666 $ 27,625
Total Financial Liabilities $ 14,016 $ 27,822,462 $ - $ - $ 27,836,478 $ 28,032,285 $ 195,807
(1) Securities are comprised of $2,703,709 (January 31, 2019 - $1,878,346; October 31, 2019 – $2,001,043) measured at FVOCI and $1,960 (January 31,
2020 - $1,955; October 31, 2019 – $18,164) designated at FVOCI. (2) Loans and deposits exclude deferred premiums, deferred revenue, allowances for credit losses and fair value hedge adjustments, which are not financial
instruments.
Fair values are based on our best estimates based on market conditions and pricing policies at a certain point in time. Methods used to estimate the fair values of financial instruments remain unchanged from the audited consolidated financial statements for the year ended October 31, 2019.
The fair value estimates are subjective and involve particular assumptions and matters of judgment and, as such, may not be reflective of future fair values. Further information on how we estimate the fair value of financial instruments is included in Note 27 of the October 31, 2019 audited consolidated financial statements.
Fair Value Hierarchy
We categorize fair value measurements of financial instruments recorded on the consolidated balance sheets according to a three-level hierarchy. Level 1 fair value measurements reflect unadjusted quoted prices in active markets for identical assets and liabilities that we can access at the measurement date. Level 2 fair value measurements are estimated using observable inputs, including quoted market prices for similar assets or liabilities in active markets, quoted prices for identical or similar assets or liabilities in inactive markets, and model inputs that are either observable or can be corroborated by observable market data for substantially the full term of the assets or liabilities. Level 3 fair value measurements are determined using one or more inputs that are unobservable and significant to the fair value of the asset or liability. Unobservable inputs are used to measure fair value to the extent that observable inputs are not available at the measurement date.
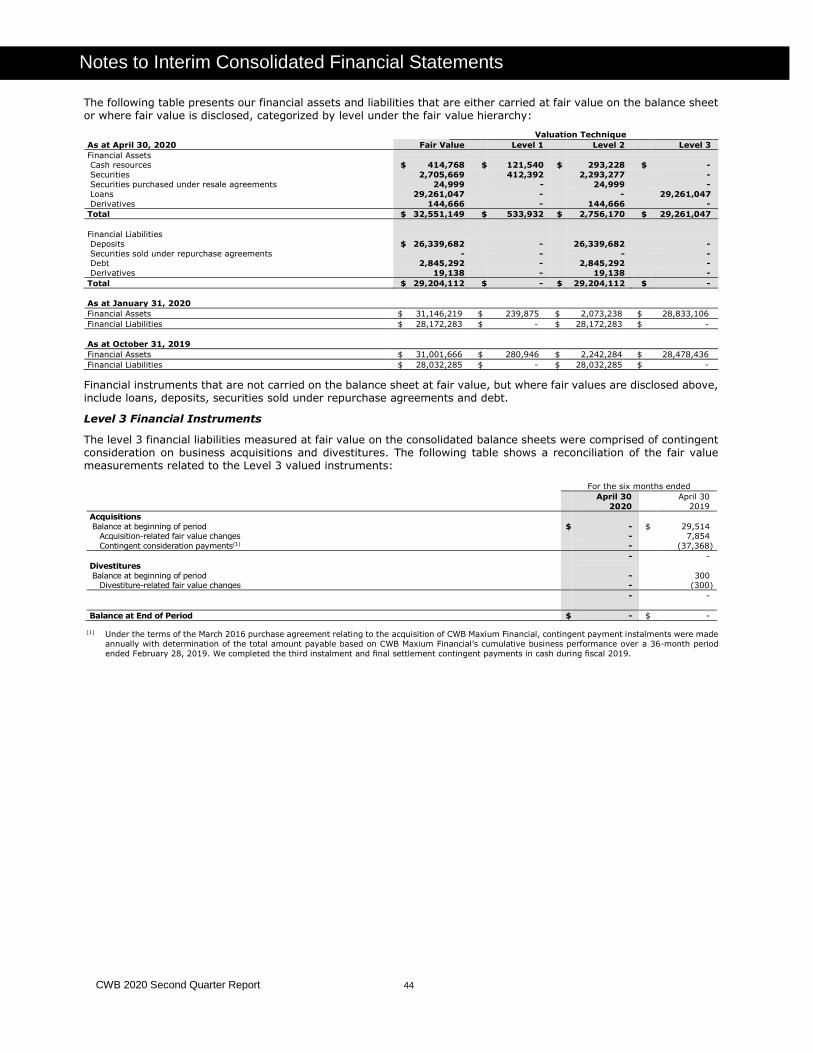
CWB 2020 Second Quarter Report 44
Notes to Interim Consolidated Financial Statements
The following table presents our financial assets and liabilities that are either carried at fair value on the balance sheet or where fair value is disclosed, categorized by level under the fair value hierarchy:
Valuation Technique
As at April 30, 2020 Fair Value Level 1 Level 2 Level 3
Financial Assets Cash resources $ 414,768 $ 121,540 $ 293,228 $ -
Securities 2,705,669 412,392 2,293,277 -
Securities purchased under resale agreements 24,999 - 24,999 -
Loans 29,261,047 - - 29,261,047
Derivatives 144,666 - 144,666 -
Total $ 32,551,149 $ 533,932 $ 2,756,170 $ 29,261,047
Financial Liabilities
Deposits $ 26,339,682 - 26,339,682 -
Securities sold under repurchase agreements - - - - Debt 2,845,292 - 2,845,292 -
Derivatives 19,138 - 19,138 -
Total $ 29,204,112 $ - $ 29,204,112 $ -
As at January 31, 2020
Financial Assets $ 31,146,219 $ 239,875 $ 2,073,238 $ 28,833,106
Financial Liabilities $ 28,172,283 $ - $ 28,172,283 $ -
As at October 31, 2019
Financial Assets $ 31,001,666 $ 280,946 $ 2,242,284 $ 28,478,436
Financial Liabilities $ 28,032,285 $ - $ 28,032,285 $ -
Financial instruments that are not carried on the balance sheet at fair value, but where fair values are disclosed above, include loans, deposits, securities sold under repurchase agreements and debt.
Level 3 Financial Instruments
The level 3 financial liabilities measured at fair value on the consolidated balance sheets were comprised of contingent consideration on business acquisitions and divestitures. The following table shows a reconciliation of the fair value measurements related to the Level 3 valued instruments:
For the six months ended
April 30
2020
April 30
2019
Acquisitions
Balance at beginning of period $ - $ 29,514 Acquisition-related fair value changes - 7,854
Contingent consideration payments(1) - (37,368)
- -
Divestitures
Balance at beginning of period - 300 Divestiture-related fair value changes - (300)
- -
Balance at End of Period $ - $ -
(1) Under the terms of the March 2016 purchase agreement relating to the acquisition of CWB Maxium Financial, contingent payment instalments were made
annually with determination of the total amount payable based on CWB Maxium Financial’s cumulative business performance over a 36-month period
ended February 28, 2019. We completed the third instalment and final settlement contingent payments in cash during fiscal 2019.
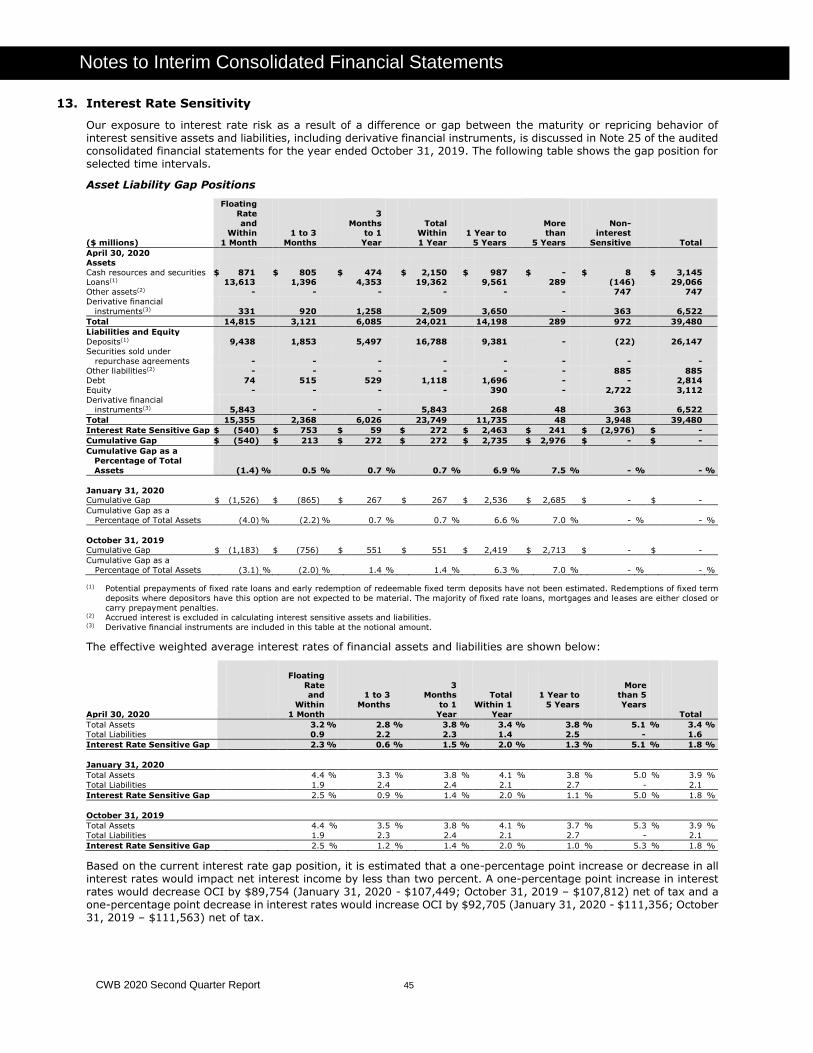
CWB 2020 Second Quarter Report 45
Notes to Interim Consolidated Financial Statements
13. Interest Rate Sensitivity
Our exposure to interest rate risk as a result of a difference or gap between the maturity or repricing behavior of interest sensitive assets and liabilities, including derivative financial instruments, is discussed in Note 25 of the audited consolidated financial statements for the year ended October 31, 2019. The following table shows the gap position for selected time intervals.
Asset Liability Gap Positions
($ millions)
Floating
Rate
and Within
1 Month
1 to 3
Months
3
Months to 1
Year
Total Within
1 Year
1 Year to
5 Years
More than
5 Years
Non-interest
Sensitive
Total
April 30, 2020
Assets
Cash resources and securities $ 871 $ 805 $ 474 $ 2,150 $ 987 $ - $ 8 $ 3,145 Loans(1) 13,613 1,396 4,353 19,362 9,561 289 (146) 29,066
Other assets(2) - - - - - - 747 747
Derivative financial
instruments(3) 331 920 1,258 2,509 3,650 - 363 6,522
Total 14,815 3,121 6,085 24,021 14,198 289 972 39,480
Liabilities and Equity
Deposits(1) 9,438 1,853 5,497 16,788 9,381 - (22) 26,147
Securities sold under
repurchase agreements - - - - - - - -
Other liabilities(2) - - - - - - 885 885 Debt 74 515 529 1,118 1,696 - - 2,814
Equity - - - - 390 - 2,722 3,112
Derivative financial
instruments(3) 5,843 - - 5,843 268 48 363 6,522
Total 15,355 2,368 6,026 23,749 11,735 48 3,948 39,480
Interest Rate Sensitive Gap $ (540) $ 753 $ 59 $ 272 $ 2,463 $ 241 $ (2,976) $ -
Cumulative Gap $ (540) $ 213 $ 272 $ 272 $ 2,735 $ 2,976 $ - $ -
Cumulative Gap as a
Percentage of Total
Assets (1.4) % 0.5 % 0.7 % 0.7 % 6.9 % 7.5 % - % - %
January 31, 2020 Cumulative Gap $ (1,526) $ (865) $ 267 $ 267 $ 2,536 $ 2,685 $ - $ -
Cumulative Gap as a
Percentage of Total Assets (4.0)
% (2.2)
% 0.7 % 0.7
% 6.6 % 7.0
% -
% -
%
October 31, 2019
Cumulative Gap $ (1,183) $ (756) $ 551 $ 551 $ 2,419 $ 2,713 $ - $ -
Cumulative Gap as a
Percentage of Total Assets (3.1)
% (2.0)
% 1.4 % 1.4
% 6.3 % 7.0
% -
% -
%
(1) Potential prepayments of fixed rate loans and early redemption of redeemable fixed term deposits have not been estimated. Redemptions of fixed term
deposits where depositors have this option are not expected to be material. The majority of fixed rate loans, mortgages and leases are either closed or
carry prepayment penalties. (2) Accrued interest is excluded in calculating interest sensitive assets and liabilities. (3) Derivative financial instruments are included in this table at the notional amount.
The effective weighted average interest rates of financial assets and liabilities are shown below:
April 30, 2020
Floating
Rate and
Within
1 Month
1 to 3
Months
3 Months
to 1
Year
Total
Within 1
Year
1 Year to
5 Years
More than 5
Years
Total
Total Assets 3.2 % 2.8 % 3.8 % 3.4 % 3.8 % 5.1 % 3.4 %
Total Liabilities 0.9 2.2 2.3 1.4 2.5 - 1.6
Interest Rate Sensitive Gap 2.3 % 0.6 % 1.5 % 2.0 % 1.3 % 5.1 % 1.8 %
January 31, 2020
Total Assets 4.4 % 3.3 % 3.8 % 4.1 % 3.8 % 5.0 % 3.9 %
Total Liabilities 1.9 2.4 2.4 2.1 2.7 - 2.1
Interest Rate Sensitive Gap 2.5 % 0.9 % 1.4 % 2.0 % 1.1 % 5.0 % 1.8 %
October 31, 2019
Total Assets 4.4 % 3.5 % 3.8 % 4.1 % 3.7 % 5.3 % 3.9 %
Total Liabilities 1.9 2.3 2.4 2.1 2.7 - 2.1
Interest Rate Sensitive Gap 2.5 % 1.2 % 1.4 % 2.0 % 1.0 % 5.3 % 1.8 %
Based on the current interest rate gap position, it is estimated that a one-percentage point increase or decrease in all interest rates would impact net interest income by less than two percent. A one-percentage point increase in interest rates would decrease OCI by $89,754 (January 31, 2020 - $107,449; October 31, 2019 – $107,812) net of tax and a one-percentage point decrease in interest rates would increase OCI by $92,705 (January 31, 2020 - $111,356; October 31, 2019 – $111,563) net of tax.
s to Interim Consolidated Financial Statements
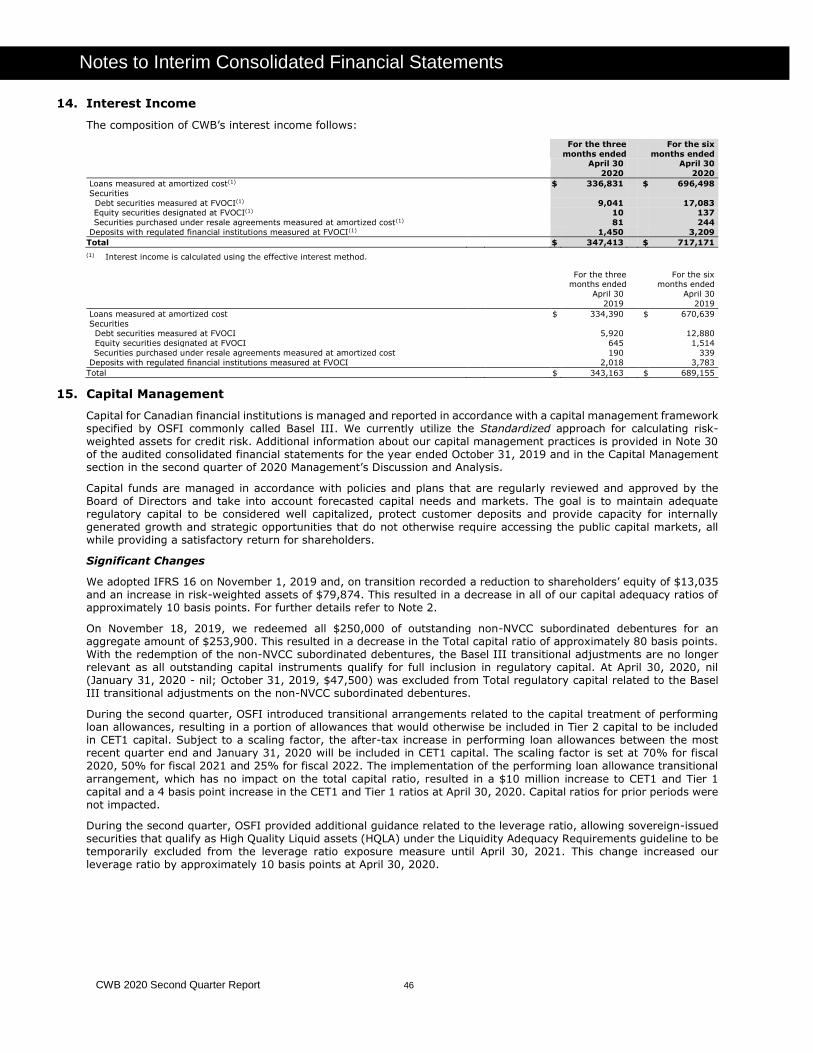
CWB 2020 Second Quarter Report 46
Notes to Interim Consolidated Financial Statements
14. Interest Income
The composition of CWB’s interest income follows:
For the three
months ended
For the six
months ended
April 30
2020
April 30
2020
Loans measured at amortized cost(1) $ 336,831 $ 696,498
Securities
Debt securities measured at FVOCI(1) 9,041 17,083 Equity securities designated at FVOCI(1) 10 137
Securities purchased under resale agreements measured at amortized cost(1) 81 244
Deposits with regulated financial institutions measured at FVOCI(1) 1,450 3,209
Total $ 347,413 $ 717,171
(1) Interest income is calculated using the effective interest method.
For the three
months ended For the six
months ended
April 30
2019
April 30
2019
Loans measured at amortized cost $ 334,390 $ 670,639
Securities Debt securities measured at FVOCI 5,920 12,880
Equity securities designated at FVOCI 645 1,514
Securities purchased under resale agreements measured at amortized cost 190 339
Deposits with regulated financial institutions measured at FVOCI 2,018 3,783
Total $ 343,163 $ 689,155
15. Capital Management
Capital for Canadian financial institutions is managed and reported in accordance with a capital management framework specified by OSFI commonly called Basel III. We currently utilize the Standardized approach for calculating risk-weighted assets for credit risk. Additional information about our capital management practices is provided in Note 30 of the audited consolidated financial statements for the year ended October 31, 2019 and in the Capital Management section in the second quarter of 2020 Management’s Discussion and Analysis.
Capital funds are managed in accordance with policies and plans that are regularly reviewed and approved by the Board of Directors and take into account forecasted capital needs and markets. The goal is to maintain adequate regulatory capital to be considered well capitalized, protect customer deposits and provide capacity for internally generated growth and strategic opportunities that do not otherwise require accessing the public capital markets, all while providing a satisfactory return for shareholders.
Significant Changes
We adopted IFRS 16 on November 1, 2019 and, on transition recorded a reduction to shareholders’ equity of $13,035 and an increase in risk-weighted assets of $79,874. This resulted in a decrease in all of our capital adequacy ratios of approximately 10 basis points. For further details refer to Note 2.
On November 18, 2019, we redeemed all $250,000 of outstanding non-NVCC subordinated debentures for an aggregate amount of $253,900. This resulted in a decrease in the Total capital ratio of approximately 80 basis points. With the redemption of the non-NVCC subordinated debentures, the Basel III transitional adjustments are no longer relevant as all outstanding capital instruments qualify for full inclusion in regulatory capital. At April 30, 2020, nil (January 31, 2020 - nil; October 31, 2019, $47,500) was excluded from Total regulatory capital related to the Basel III transitional adjustments on the non-NVCC subordinated debentures.
During the second quarter, OSFI introduced transitional arrangements related to the capital treatment of performing loan allowances, resulting in a portion of allowances that would otherwise be included in Tier 2 capital to be included in CET1 capital. Subject to a scaling factor, the after-tax increase in performing loan allowances between the most recent quarter end and January 31, 2020 will be included in CET1 capital. The scaling factor is set at 70% for fiscal 2020, 50% for fiscal 2021 and 25% for fiscal 2022. The implementation of the performing loan allowance transitional
arrangement, which has no impact on the total capital ratio, resulted in a $10 million increase to CET1 and Tier 1 capital and a 4 basis point increase in the CET1 and Tier 1 ratios at April 30, 2020. Capital ratios for prior periods were not impacted.
During the second quarter, OSFI provided additional guidance related to the leverage ratio, allowing sovereign-issued securities that qualify as High Quality Liquid assets (HQLA) under the Liquidity Adequacy Requirements guideline to be temporarily excluded from the leverage ratio exposure measure until April 30, 2021. This change increased our leverage ratio by approximately 10 basis points at April 30, 2020.
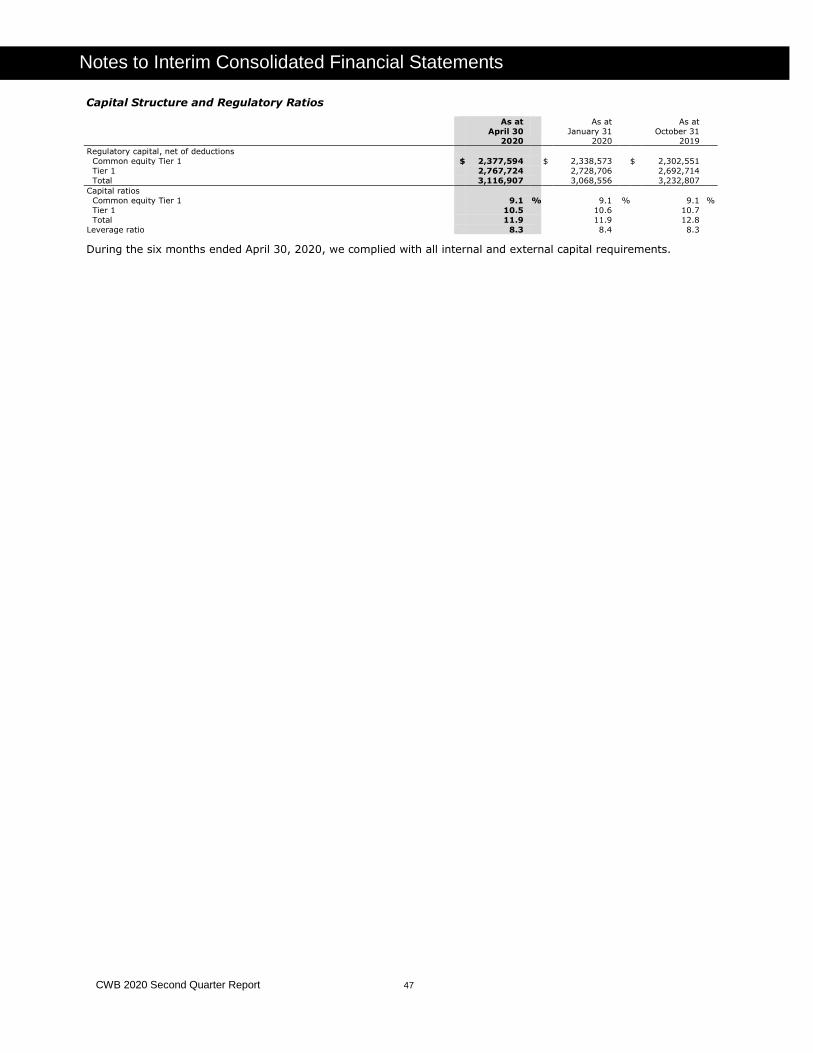
CWB 2020 Second Quarter Report 47
Notes to Interim Consolidated Financial Statements
Capital Structure and Regulatory Ratios
As at
April 30 2020
As at
January 31 2020
As at
October 31 2019
Regulatory capital, net of deductions
Common equity Tier 1 $ 2,377,594 $ 2,338,573 $ 2,302,551
Tier 1 2,767,724 2,728,706 2,692,714
Total 3,116,907 3,068,556 3,232,807
Capital ratios
Common equity Tier 1 9.1 % 9.1 % 9.1 %
Tier 1 10.5 10.6 10.7
Total 11.9 11.9 12.8
Leverage ratio 8.3 8.4 8.3
During the six months ended April 30, 2020, we complied with all internal and external capital requirements.
CWB 2020 Second Quarter Report 48
Shareholder Information
CWB Financial Group Corporate Headquarters
Suite 3000, 10303 Jasper Avenue NW CWB Place Edmonton, AB T5J 3X6 Telephone: (780) 423-8888 Fax: (780) 423-8897 cwb.com
Contact Information
CWB National Leasing Inc. 1525 Buffalo Place Winnipeg, MB R3T 1L9 Telephone: (204) 954-9000 Toll-free: (800) 665-1326 cwbnationalleasing.com
CWB Maxium Financial Inc. 30 Vogell Road, Suite 1 Richmond Hill, ON L4B 3K6 Telephone: (905) 780-6150 Toll-free: (800) 379-5888 cwbmaxium.com CWB Optimum Mortgage Suite 1010, 10303 Jasper Avenue NW CWB Place Edmonton, AB T5J 3X6 Telephone: (780) 423-9748 Toll-free: (866) 441-3775 optimummortgage.ca CWB Trust Services Suite 300, 750 Cambie Street Vancouver, BC V6B 0A2 Telephone: (604) 685-2081 Toll-free: (800) 663-1124
cwt.ca CWB Wealth Management Ltd. Suite 1250, 10303 Jasper Avenue NW CWB Place Edmonton, AB T5J 3X6 Telephone: (780) 429-3500 Toll-free: (855) 292-9655 cwbwealth.com
CWB McLean & Partners Wealth Management Ltd. 801 10th Avenue SW Calgary, AB T2R 0B4 Telephone: (403) 234-0005 Toll-free: (888) 665-0005 cwbmcleanpartners.com
Stock Exchange Listings The Toronto Stock Exchange (TSX) Common Shares: CWB Series 5 Preferred Shares: CWB.PR.B Series 7 Preferred Shares: CWB.PR.C Series 9 Preferred Shares: CWB.PR.D
Transfer Agent and Registrar Computershare 100 University Avenue, 8th Floor Toronto, ON M5J 2Y1 Telephone: (416) 263-9200 Toll-free: (800) 564-6253 Fax: (888) 453-0330 Website: www.computershare.com
Eligible Dividends Designation
CWB designates all common and preferred share dividends paid to Canadian residents as “eligible dividends”, as defined in the Income Tax Act (Canada), unless otherwise noted.
Dividend Reinvestment Plan
CWB’s dividend reinvestment plan allows common and preferred shareholders to purchase additional common shares by reinvesting their cash dividend without incurring brokerage and commission fees. For information about participation in the plan, please contact the Transfer Agent and Registrar.
Investor Relations Department
CWB Financial Group Suite 3000, 10303 Jasper Avenue NW CWB Place Edmonton, AB T5J 3X6 Telephone: (780) 508-8229 Toll-free: (800) 836-1886 Email: [email protected] More comprehensive investor information - including supplemental financial reports, quarterly financial releases, corporate presentations, corporate fact sheets and frequently asked questions - is available in the Investor Relations section at cwb.com. Filings are available on the Canadian Securities Administrators' website at sedar.com.
Quarterly Conference Call and Webcast
CWB’s quarterly conference call and live audio webcast will take place on May 29, 2020 at 10:30 a.m. ET. The webcast will be archived on CWB’s website at cwb.com for sixty days. A replay of the conference call will be available until June 5, 2020, by dialing (888) 390-0541 and entering passcode 989551#.