Embed Size (px)
Citation preview
Core Welfare Indicators QuestionnaireCWIQ
A simple tool thatproduces rapidresults for Africancountries
Key socialindicatorsfor populationsub-groups
An instrument formonitoring changein key socialindicators
Core Welfare Indicators Questionnaire
The CWIQ is still being developed and has been tested in two African countries
on a pilot basis. The first pilot was carried out in Kenya in March 1996 with
the assistance of the Central Bureau of Statistics on a sample of 700 households.
The second test, incorporating a number of refinements, was carried out in July
1996 in Ghana on a slightly larger sample. Following these pilot exercises, both
Kenya and Ghana have launched versions of the CWIQ on a national scale as
part of their welfare monitoring program. The Ghana national CWIQ was
carried out by the Ghana Statistical Service on a sample of 15,000 households.
Preliminary results for the whole country were produced three months after the
fieldwork had started.
For more information on the CWIQ contact:Knowledge Management and Learning Center
Africa RegionThe World Bank
1818 H Street, N.W.Washington D.C. 20433, U.S.A.
e-mail: [email protected]
Developed jointly by the World Bank with UNDP and UNICEF the Core WelfareIndicators Questionnaire (CWIQ) is designed to monitor social indicators in Africaon an annual basis. The CWIQ is developed to show who is, and who is not, ben-efiting from actions designed to improve social and economic conditions. The CWIQcollects (i) indicators of household well-being; and, (ii) indicators of access, usageand satisfaction with community and other basic services.
Objectives
The CWIQ will:
• provide key social indicators for different population subgroups — withinand across countries.
• be an instrument for monitoring changes in key social indicators over time.
• provide countries with a simple tool that produces rapid results.
CWIQCore Welfare Indicators Questionnaire
CWIQ Features
■■ Simple reporting of results
■■ Easy data collection, single visit
■■ Short, scannable questionnaire
■■ Quick data entry
■■ Pre-programmed validation andediting checks
■■ Packaged off-the-shelf system
Core Welfare Indicators QuestionnaireCWIQ
The CWIQ is designed to complement rather than replace other surveys. It is implemented as an
annual “core” questionnaire in what could be a core and rotating module survey program. As such,
the CWIQ is just one of the components of a country’s overall monitoring package.
National statistical offices should be able to
implement a CWIQ easily each year and add
special modules if desired, such as a labor
force module or a crop forecasting module.
The CWIQ draws extensively from market
research practices and past household survey
experiences as well as recent developments
in data entry and processing. As a result, it is
a relatively high-tech instrument, but one
which requires little in terms of high-tech
equipment or training.
Project managementand evaluation
The CWIQ has been developed as a national
survey, but can also be used for project
monitoring and evaluation. It does not
attempt to measure issues such as “are people
healthier, wealthier or more self-sufficient
as a result of a project or program?”, but
focuses on who are and who are not, project
beneficiaries. For example, measuring the
impact of an agricultural extension project could involve trying to measure whether yields, and
consequently agricultural incomes, have improved. The CWIQ however would concentrate on the
more easily measured indicators of adoption rates, e.g., who is using extension recommendations.
What sort of indicators?
The CWIQ focuses on simple indicators of
• usage • access • satisfaction
It also collects a few indicators of household well-being: percent reporting diminishing or increasing
assets (land and livestock); percent of literate adults; percent of children malnourished; housing
(quality and mean number of persons per room); percent of adults unemployed in the past
4 weeks, etc.
What the CWIQ will NOT do...
■■ Not a survey to measure changesin income and expenditure
■■ Will not capture seasonality
■■ Will not capture the intricaciesof intra-household resource allocations
■■ Does not capture agriculturalproduction and activities
Short questionnaire
The questionnaire is four pages long (8 sides),
yet covers a range of topics
• Household Roster (list of all de jure
household members)
• Children Roster (less than or equal to
5 years old)
• Household and other amenities
• Assets
• Consumption correlates
Quick data entry and validation
The questionnaire uses multiple choice questions, and is “scannable.” In Ghana, scanners have
made it possible to clean the data of more than 300 households a day.
Basic validation checks are carried out at the same time as data are entered, after which predefined
tables and graphs are automatically generated.
Packaged “off-the-shelf” system
The CWIQ incorporates scannable questionnaires, pre-written validation procedures, and automated
output features, all with the objective of providing a rapid information system. In so doing, it has to
make a number of trade-offs in terms of the flexibility of the instrument and the opportunity for
making in-country modifications. The way around these trade-offs is to distinguish between the
“core” element of the CWIQ (i.e., the standard questionnaire), which allows for only very limited
in-country customization, and special “modules” which can be enumerated alongside the core element
and which can cater to specific country needs.
Capacity-building
There are several reasons for believing that countries will quickly assume ownership of the CWIQ.
• Indicators are “standard.”
• The “demonstration effect” of providing rapid and simple monitoring indicators should stimulate
national demand.
• National institutions will appreciate the optical reader technology as a way of relieving data
processing bottlenecks and may use it for other activities, such as crop forecasting and price
reporting.
• The survey’s iterative nature will lead to low recurrent costs more easily covered under government
budgets.
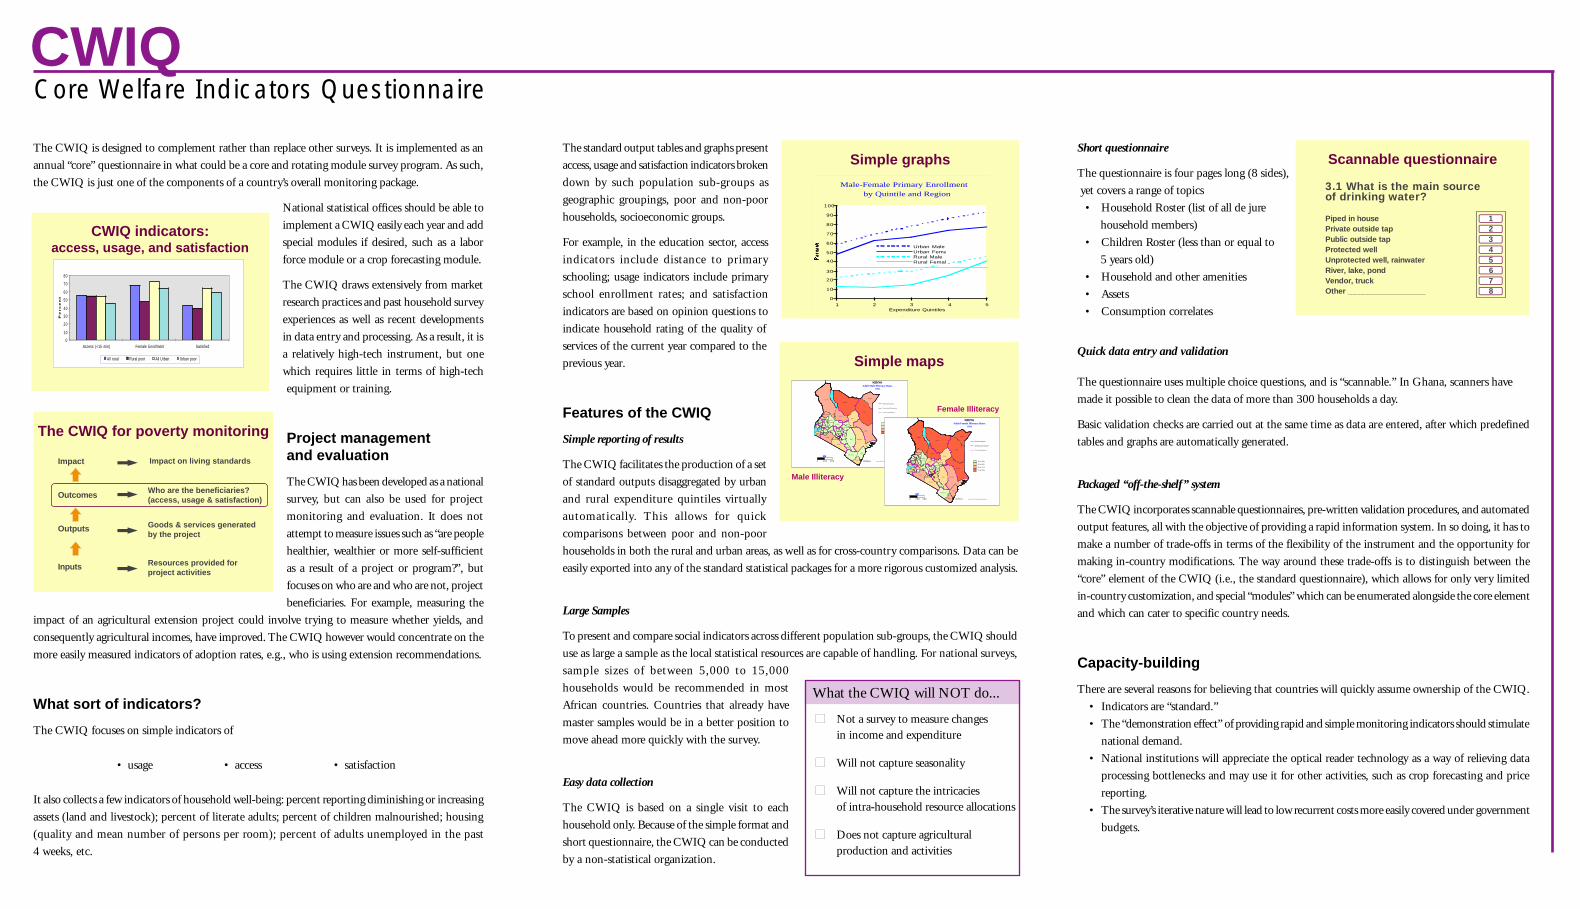
The standard output tables and graphs present
access, usage and satisfaction indicators broken
down by such population sub-groups as
geographic groupings, poor and non-poor
households, socioeconomic groups.
For example, in the education sector, access
indicators include distance to primary
schooling; usage indicators include primary
school enrollment rates; and satisfaction
indicators are based on opinion questions to
indicate household rating of the quality of
services of the current year compared to the
previous year.
Features of the CWIQ
Simple reporting of results
The CWIQ facilitates the production of a set
of standard outputs disaggregated by urban
and rural expenditure quintiles virtually
automatically. This allows for quick
comparisons between poor and non-poor
households in both the rural and urban areas, as well as for cross-country comparisons. Data can be
easily exported into any of the standard statistical packages for a more rigorous customized analysis.
Large Samples
To present and compare social indicators across different population sub-groups, the CWIQ should
use as large a sample as the local statistical resources are capable of handling. For national surveys,
sample sizes of between 5,000 to 15,000
households would be recommended in most
African countries. Countries that already have
master samples would be in a better position to
move ahead more quickly with the survey.
Easy data collection
The CWIQ is based on a single visit to each
household only. Because of the simple format and
short questionnaire, the CWIQ can be conducted
by a non-statistical organization.
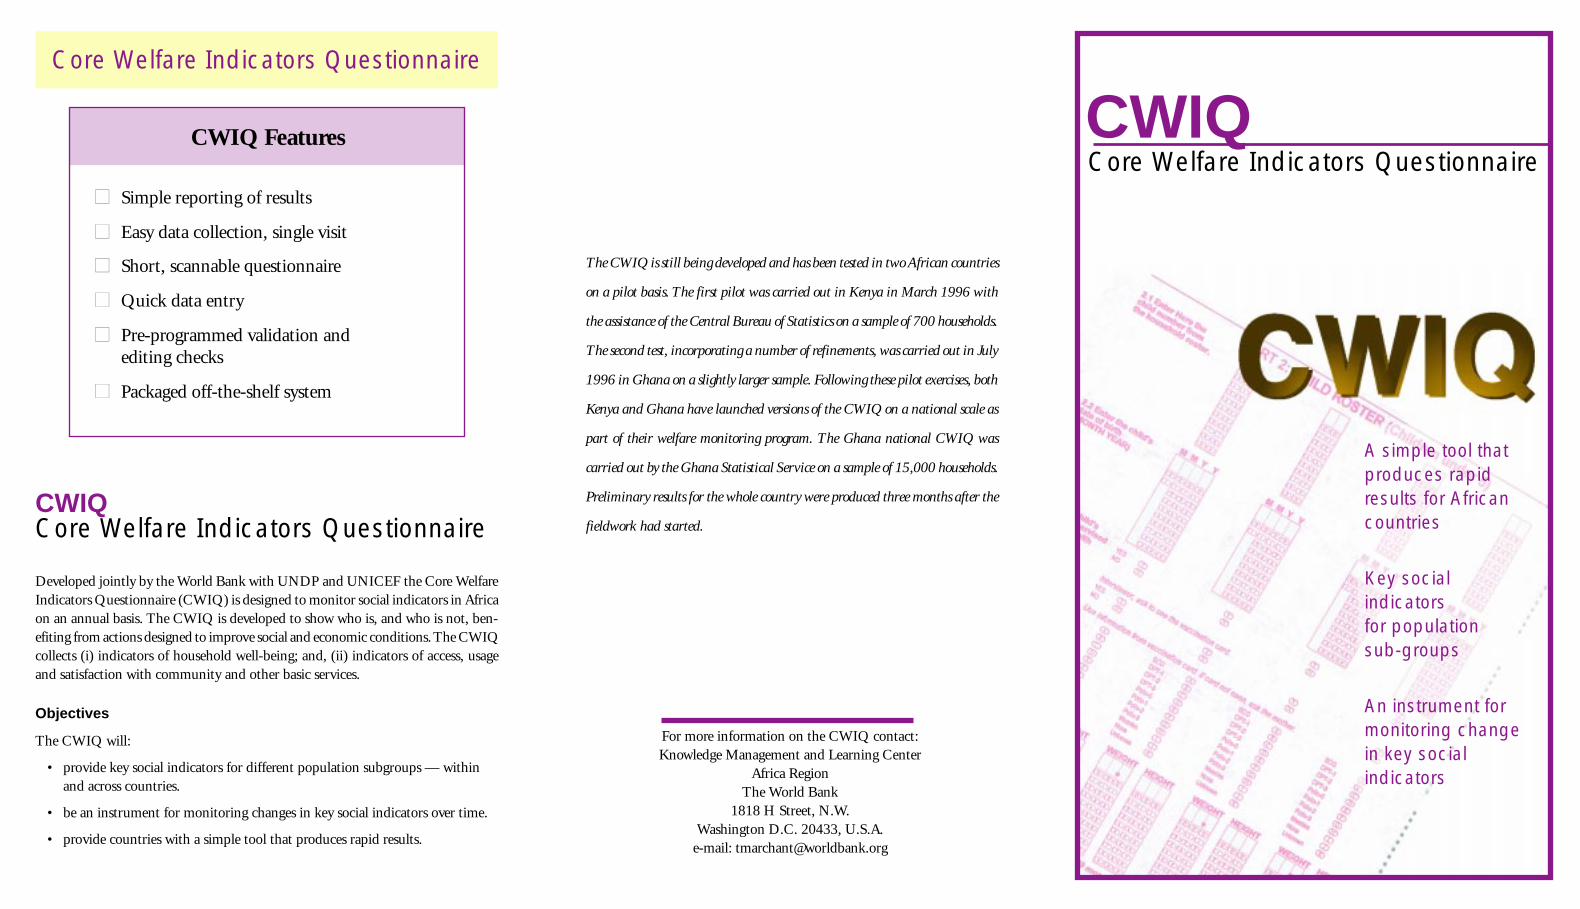
CWIQ indicators:access, usage, and satisfaction
Rural UrbanAll rural Rural poor All Urban Urban poor
Access (<15 min) 5 6 5 5 5 5 4 6Female Enrollment 6 8 4 8 7 3 6 5Satisfied 4 3 4 0 6 5 5 9
Access to, use of and satisfaction with with primary schools
0
10
20
30
40
50
60
70
80
Access (<15 min) Female Enrollment Satisfied
Pe
rc
en
t
All rural Rural poor All Urban Urban poor
The CWIQ for poverty monitoring
Outcomes Who are the beneficiaries? (access, usage & satisfaction)
Impact Impact on living standards
Outputs Goods & services generated by the project
Inputs Resources provided for project activities
Simple graphs
Male-Female Primary Enrollment by Quintile and Region
0
10
20
30
40
50
60
70
80
90
100
1 2 3 4 5Expenditure Quintiles
Urban MaleUrban FemaRural MaleRural Female
Simple maps
Kajiado
Siaya
KisiiHoma Bay
Narok
Migori
Kisumu
Bomet
Nakuru
Nyamira
Kericho
Trans Nzoia
KakamegaBusia
Vihiga
Turkana
Bungoma Elgeyo Marakwet
Uasin Gishu
Nandi
Baringo
West Pokot
Garissa
Kitui
Taita-Taveta
Machakos
Makueni
Kilifi
Kwale
Tana River
Lamu
Isiolo
NyeriNyandarua
Kiambu
Muranga
Laikipia
Marsabit
Samburu
Meru
Kirinyaga
Tharaka Nithi
Embu
Wajir
Mandera
MOMBASA
NAIROBI
20 to 45%
45 to 60%
60 to 75%
75 to 85%
District Boundaries
International Boundaries
Province Boundaries
KM
2001000
KENYAAdult Male Illiteracy Rates
1994
Source: 1994 Welfare Monitoring Survey
Kajiado
Siaya
KisiiHoma Bay
Narok
Migori
Kisumu
Bomet
NakuruNyamira
Kericho
Trans Nzoia
KakamegaBusia
Vihiga
Turkana
Bungoma Elgeyo Marakwet
Uasin Gishu
Nandi
Baringo
West Pokot
Garissa
Kitui
Taita-Taveta
Machakos
Makueni
Kilifi
Kwale
Tana River
Lamu
Isiolo
NyeriNyandarua
Kiambu
Muranga
Laikipia
Marsabit
Samburu
Meru
Kirinyaga
Tharaka Nithi
Embu
Wajir
Mandera
MOMBASA
NAIROBI
25 to 45%
45 to 60%
60 to 75%
75 to 95%
District Boundaries
International Boundaries
Province Boundaries
KM
2001000
KENYAAdult Female Illiteracy Rates
1994
Source: 1994 Welfare Monitoring Survey
Male Illiteracy
Female Illiteracy
Scannable questionnaire
3.1 What is the main source of drinking water?
Piped in house 1Private outside tap 2Public outside tap 3Protected well 4Unprotected well, rainwater 5River, lake, pond 6Vendor, truck 7Other ____________________ 8