Embed Size (px)
Citation preview
HELCOM Baltic Sea Environment Fact Sheet 2017
Cyanobacteria biomass, 1990-2016
Information from the Phytoplankton Expert Group (PEG)
Authors: Norbert Wasmund1, Susanne Busch1, Jeanette Göbel2, Sławomira Gromisz3, Helena Höglander4, Siv Huseby5, Andres Jaanus6, Hans Henrik Jakobsen7, Marie Johansen8, Iveta Jurgensone9, Janina Kownacka3, Wojciech Kraśniewski10, Sirpa Lehtinen11, Irina Olenina12, Mario v. Weber13
Key Message
The different areas of the Baltic Sea are characterized by different magnitudes of biomass of the nitrogen-fixing (diazotrophic) cyanobacteria genera Aphanizomenon, Nodularia and Dolichospermum. The highest biomass (for the studied months June-August, during the study period from year 1990 to 2016) occurs in the Gulf of Finland, whereas no or low biomass of nitrogen-fixing cyanobacteria appears in the Bothnian Bay and the Kiel Bay/Kattegat area.
Biomass of nitrogen-fixing cyanobacteria may show opposing trends between different sea areas. For example, some years with extremely low biomass in the Arkona Basin and Bornholm Basin (2004, 2005) showed high biomass in the neighbouring Eastern Gotland Basin. This confirms that the sea areas have to be evaluated separately.
The year-to-year variability in the biomass of bloom-forming cyanobacteria is high. Tendencies of decreasing cyanobacteria biomass in the Gulf of Riga and the Arkona Basin (1990-2014) were interrupted by high biomass values in 2015 and 2016. Cyanobacteria biomass is increasing in the Bothnian Sea since the mid of the 1990s.
The genus Nodularia, known for producing surface accumulations, is more common in the central and southern part of the Baltic Sea compared to the northern part where the genus Aphanizomenon dominates.
Results and Assessment
Relevance of the indicator for describing developments in the environment Nitrogen-fixing (diazotrophic) cyanobacteria are an important component of the ecosystem. By their ability to fix molecular nitrogen, the bloom-forming cyanobacteria of the genera Aphanizomenon, Nodularia and Dolichospermum prevent severe nitrogen shortage and resulting starvation in all trophic levels of the ecosystem in the summer. However, human activity has imported a surplus of nutrients into the water for decades which turned the originally indispensable cyanobacteria into a nuisance because their nitrogen fixation counteracts the measures to reduce eutrophication, as specified in the following section. According to Wasmund (1997), nitrogen-fixing cyanobacteria may be considered as “blooms” at a biomass concentration of about 200 µg/L in the mixed upper 10 m of the water. If this biomass is floating and enriched at the water surface it becomes visible and is also clearly perceived from satellites (Kahru & Elmgren 2014).
HELCOM Baltic Sea Environment Fact Sheet 2017
Policy relevance and policy references
The biomass of nitrogen-fixing cyanobacteria seems to have increased at least since the 1960s (Finni et al. 2001, Funkey et al. 2014). If these cyanobacteria occur in large blooms, they contribute to eutrophication, oxygen depletion in deep waters and toxic effects. The displeasing view of the coloured surface scum alone may impair the touristic use of the coasts in summer. The changes in cyanobacteria biomass and composition represent changes in the ecosystem with far-reaching consequences. Their trends are of high relevance and interest. This Baltic Sea Environment Fact Sheet (BSEFS) “Cyanobacteria Biomass” serves the long-term documentation of the nitrogen-fixing cyanobacteria biomass development. An Indicator Fact Sheet on a “Cyanobacteria bloom index” covering semi-quantitative rank data from year 1999 to 2007 was presented by Kaitala and Hällfors (2008). Information about the spatial extension of the bloom during summer based on satellite data is available (BSEFS “Cyanobacterial blooms in the Baltic Sea”, Öberg 2016). In contrast to semi-quantitative rank data and satellite image data, our BSEFS presents quantitative biomass data and gives additional information about the species composition in the water column. The species composition is relevant also because Nodularia and Dolichospermum have the potential to be toxic whereas toxicity of Aphanizomenon has not been confirmed in the Baltic Sea. Owing to the high ecological importance of cyanobacterial blooms, they may serve as indicators in the sense of the EU-Marine Strategy Framework Directive (European Union 2008). A new core eutrophication indicator for cyanobacterial blooms is implemented (HELCOM 2017). It combines satellite data with the biomass data delivered by the HELCOM-Phytoplankton Expert Group (PEG); they are identical with the data used for this Baltic Sea Environment Fact Sheet.
Assessment
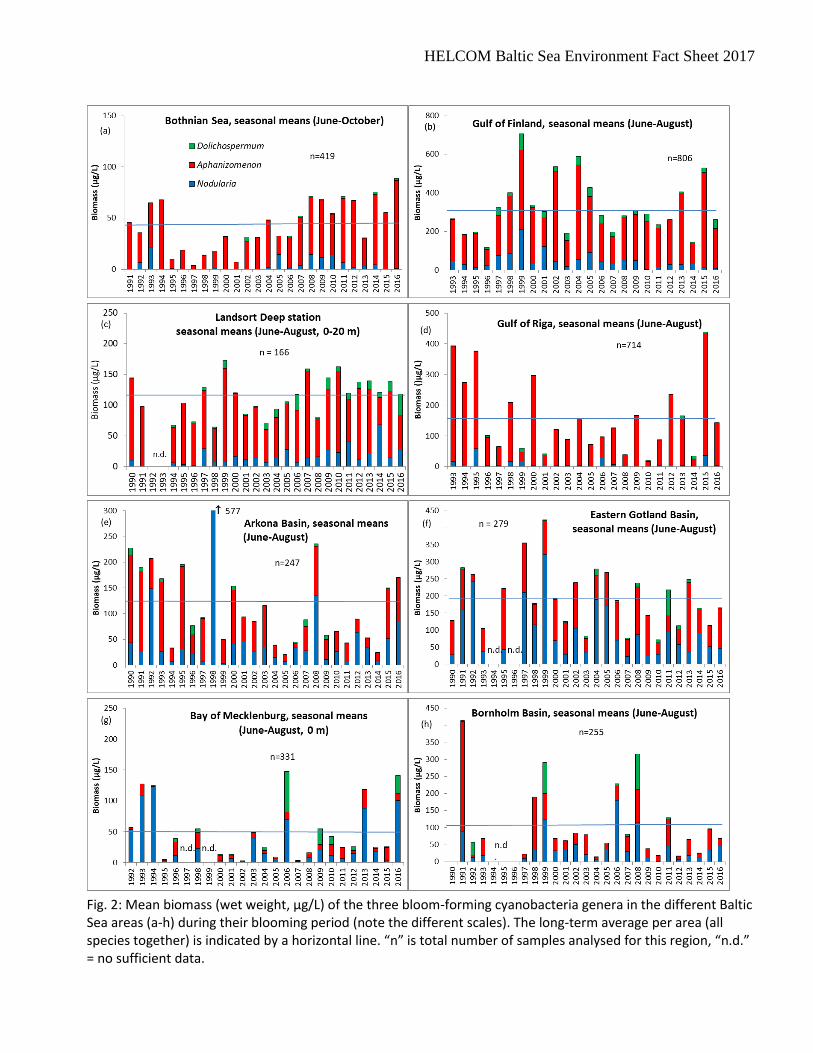
The first Baltic Sea Environment Fact Sheet on the cyanobacteria biomass was published in 2011. Just like the earlier Indicator Fact Sheet on a “Cyanobacteria bloom index”, it concentrates on the open sea. However, owing to the COMBINE strategy, also coastal stations are considered. The situation near the coast may be different from that in the open sea. Therefore, clusters of coastal stations have been kept apart from open sea stations if they were separated by a long distance (> 70 km). Such separated stations from the Latvian, Lithuanian and Polish coast did not meet the quality criteria of one sampling per month at least (cf. section “technical information”, point 5) and are therefore neglected in this report. However, if coastal and open sea stations were close to each other (e.g. Gulf of Riga), differentiation between them is difficult. We combined the data from the coastal and open sea areas if the coastal stations were near to the central open sea stations (< 70 km). Stations were pooled by sea area (Fig. 1) in order to get representative data. This pooling also included stations which are rarely sampled (in the Bornholm Basin and the southern parts of the Eastern Gotland Basin), but which are not specified in Fig.1. The data were treated as explained in the technical information below. The seasonal means of the total biomass of the nitrogen-fixing filamentous cyanobacteria in the summer period (June-August) are presented in Fig.1. In the Bothnian Sea, cyanobacteria bloom may extend up to October; therefore the season is defined in this area from June to October. Recently, blooms may extend to September in some other areas. In order to keep consistency with earlier reports, we still considered only the period from June to August. As shown in an earlier Indicator Fact Sheet of PEG, phytoplankton trends may be even opposite in the different sea areas (Jaanus et al. 2007). Therefore, separate diagrams for the most relevant sea areas were produced. In this BSEFS on Cyanobacteria biomass, only nitrogen-fixing species of the genera Aphanizomenon, Nodularia and Dolichospermum are considered, since these are the main genera that form blooms in the Baltic Sea. Specific information on these three cyanobacteria genera Aphanizomenon, Nodularia and Dolichospermum is shown in Fig. 2.
HELCOM Baltic Sea Environment Fact Sheet 2017
In the Bothnian Bay, the cyanobacteria biomass is usually low (< 40 µg/L). Only two exceptions occurred: Station RA1 on 3.8.2005 (127 µg/L Aphanizomenon), leading to a monthly average of 50 µg/L, and Station RA1 on 30.7.2014 (106 µg/L Aphanizomenon) leading to a monthly average of 25 µg/L. Because of the generally low cyanobacteria biomass, we did not present the results from the Bothnian Bay in a figure. In the Bothnian Sea, nitrogen-fixing cyanobacteria are more relevant than in the Bothnian Bay. One extreme value from 25.7.2006 (966 µg/L Aphanizomenon) is treated as an outlier. In some years (1992, 1998, 2002, 2003), data from June were not available. Thus, we re-analyzed data by omitting June completely from the calculation of the seasonal means in the Bothnian Sea, because cyanobacteria biomass data in June were generally low in the first years considered. However, in recent years we got samples of rather high cyanobacteria biomass already in June, i.e. in 2007 (83 µg/L), 2008 (194 µg/L), 2010 (104 µg/L), 2011 (77 µg/L) and 2014 (173 µg/L). Obviously, there is a tendency of earlier bloom start in the Bothnian Sea (cf. Kahru and Elmgren 2014), but high cyanobacteria biomass was still found in autumn (e.g. 1.9.2016: 162 µg/L). Therefore we kept the period from June to October as before. Starting with very low cyanobacteria biomass in the mid of the 1990s, biomass has increased more or less continuously. In the Gulf of Finland, the highest biomass of the whole Baltic Sea occurred with single peak values in 1998 (2900 µg/L), 1999 (3460 µg/L), 2001 (3282 µg/L), 2002 (3670 µg/L), 2004 (7470 µg/L), 2009 (4410 µg/L), 2013 (5892 µg/L), 2014 (2244µg/L), 2015 (2851 µg/L) and 2016 (1651 µg/L). The Finnish coastal station “Nau 2361 Seili intens” was the only station situated in the Archipelago Sea. As it could not be combined with other stations, its data gaps could not be filled and the data could not fulfil the requirements explained in the Metadata section “Methodology and frequency of data collection”. Thus, data for Archipelago Sea is not represented. In the Gulf of Riga, high cyanobacteria biomass values occurred occasionally even in September (in 1996, 1999 and 2011), sometimes even in November (6.11.2015, coastal Stat. 170: 247 µg/L at still high water temperature of about 11 °C with a quite low DIN:DIP ratio of 6.8:1). Nevertheless, we restricted the period considered to the summer season from June to August in order to keep the comparability to the neighbouring areas, as in the other regions blooms are noticed only from June to August (cf. seasonal pattern presented by Kaitala and Hällfors 2008). The very high biomass value of the year 2015 was mainly based on peak values from 4.8.2015 (1981 µg/L). In 2016, the highest biomass was recorded on 22.8.2016 of Aphanizomenon in the inner Pärnu Bay (1804 µg/L at station K5). The cyanobacteria biomass at the Landsort Deep station (BMP H3) appears relatively low for methodological reasons: This was the only station where the upper 20 m were sampled in contrast to 10 m in the other open sea regions. As cyanobacteria prefer the upper water layers, the inclusion of the lower layer of the euphotic zone reduces the depth-integrated average. The cyanobacteria biomass per m³ might be double, especially for the strongly buoyant Nodularia, if only the upper 0-10 m water layer would be considered. In 2016, the peak biomass (219 µg/L) was found on 1 August, exceptionally dominated by Dolichospermum spp. Data from the Eastern Gotland Basin were contributed by Finland, Germany, Lithuania, Poland and Sweden. Nevertheless, the data basis is rather poor. The years 1994 and 1996 had to be excluded because they contained only data from August. However, data from 1993, 1995 and 1997 were included despite lacking July data. The biomass peak of the genera considered was recorded on 14.6.2016 (462 µg/L). The data from the Bornholm Basin had a gap from 1994 to 1996 (1994 and 1995 only August data available; 1996 no data). Cyanobacteria biomass was generally rather low in comparison with the northern regions of the Baltic Proper, and it did not reach bloom concentrations in 2016.
HELCOM Baltic Sea Environment Fact Sheet 2017
From the Arkona Basin, also some coastal data are available that are not included yet because they originate from the surface and should not be mixed with the data from 0-10 m depth. Inclusion of the coastal data would raise the mean values. Data from the Bay of Mecklenburg and Kiel Bight were considered for the first time in the report of 2015. Data were delivered by State Agencies (Footnote 2 and 13) and from the coastal monitoring of the IOW (station Heiligendamm = “HD”; https://www.io-warnemuende.de/algal-blooms-at-heiligendamm-2016.html). All these data originated from surface samples (about 1 m depth); the few samples from 0-10 m depth were excluded from the analysis in order to prevent mixing of different methods. In the Bay of Mecklenburg, blooms are not usual, but big blooms may reach the coasts occasionally, e.g. in 2003 and 2006, when beaches had to be closed because of nuisance cyanobacteria blooms. Differences occurred between samplings from 0-10 m depth and samplings from the surface only. Samplings of the upper 10 m in the open sea revealed cyanobacterial biomass exceeding 100 µg/L in the years 2006, 2010 and 2011 in the series from 2004 to 2013 presented by Schneider et al. (2015). The surface samples from coastal and open sea stations showed biomass peaks in 1993, 1994, 2006 and 2013 (Fig. 2 g). Also 2016 was a year with a strong Nodularia bloom near the Mecklenburg coast occurring around the 23/24 August. The biomass data from Kiel Bight, starting in 2000, were generally low and are thus not represented in a figure. Monthly means exceeding 100 µg/L occurred only in June 2012 (172 µg/L) and July 2012 (326 µg/l), leading to a summer average of 167 µg/L in 2012. They were almost exclusively made up of Dolichospermum. Also Kattegat data are not presented because they are generally low and indicated that heavy cyanobacteria blooms did not occur. Only at the end of July 2008, a bloom with peaks of up to 400 µg/L occurred at the two Kattegat stations, but monthly and seasonal means were of course much lower. Because of the high variability, no clear trend is visible in most areas. A decrease in cyanobacteria biomass was noticed in the Gulf of Riga and Arkona Basin until 2014, but this trend was interrupted by high biomass values in 2015. An increasing trend seems to establish in the Bothnian Sea.Trend analyses by Wasmund et al. (2011) with data from 1979 to 2005 revealed decreasing trends in summer cyanobacteria in the Bornholm Basin and Arkona Basin but not in the Eastern Gotland Basin. Concerning class Cyanophyceae, i.e. all cyanobacterial taxa including also the non-nitrogen-fixing taxa, increasing trends in late summer biomass in the northern Baltic Proper, the Gulf of Finland, and the Åland Sea from year 1979 to 2011 have been reported by Suikkanen et al. (2013). Trend analyses by Lehtinen et al. (2016) with data from 1979 to 2014 showed increasing trends in late summer biomass of class Cyanophyceae in the Bothnian Sea, the Åland Sea, and the Gulf of Finland. Large variations between different areas may occur. For example, the cyanobacteria biomass was exceptionally low in the Arkona Basin and Bornholm Basin in 2004 and 2005, but high in the Eastern Gotland Basin at the same time. The basin-wide differences in bloom distribution are also known from satellite images (Öberg 2016). This stresses the importance of dividing the Baltic Sea into sub-regions and treating them separately. Although the satellite images give valuable information on the spatial differences in cyanobacteria abundances, numerous discrepancies between satellite images and ship-based biomass data exist. For example, the high biomass in the Arkona Basin in 1998 and 2008 is not reflected in the number of days with cyanobacteria observed in the satellite images (Öberg 2016). Also at station Landsort Deep there is only little systematic correlation between actual cyanobacteria biomass and satellite surface data, probably because of deep maxima of Aphanizomenon which cannot be adequately recorded by satellites. Satellites may detect the blooms only under specific weather conditions (clear sky) whereas ship-based measurements are not so selective. As shown in Fig. 2, Aphanizomenon is dominating in the northern regions of the Baltic Sea whereas Nodularia is mostly dominating in the southern Baltic Sea. The question is whether this reflects (1) a north-south salinity
HELCOM Baltic Sea Environment Fact Sheet 2017
gradient or (2) a coastal versus open sea gradient as most stations in the north are situated near the coast whereas those in the south are mainly remote of the coast. Aphanizomenon seems to prefer lower salinity than Nodularia irrespective of the coasts. Nodularia has a higher temperature optimum (20-25 °C) than Aphanizomenon (16-22 °C) according to Lehtimäki et al. (1997). Dolichospermum is of less quantitative importance.
References European Union, 2008: Marine Strategy Framework Directive. Directive 2008/56/EC of the European Parliament and of the Council of 17 June 2008: Establishing a Framework for Community Action in the field of Marine Environmental Policy. – Official Journal of the European Union, L 164, 19-39. Finni, T., Kononen, K., Olsonen, R., Wallström, K., 2001: The history of cyanobacterial blooms in the Baltic Sea. Ambio 30, 172-178. Funkey, C.P., Conley, D.J, Reuss, N.S, Humborg,C, Jilbert, T., Slomp, C.P., 2014: Hypoxia Sustains Cyanobacteria Blooms in the Baltic Sea. Environ. Sci. Technol. 48: 2598−2602. Griniene, E., Daunys, D., Olenina, I., Höglander, H., Wasmund, N., 2013: Phytoplankton ring test 2013. Counting of Rhodomonas sp. and Nodularia spumigena using different counting strategies and sedimentation chamber volumes. Report to HELCOM, November 2013. HELCOM, 2017: Monitoring of phytoplankton species composition, abundance and biomass – proposed update of HELCOM monitoring guidelines. http://www.helcom.fi/Documents/Action%20areas/Monitoring%20and%20assessment/Manuals%20and%20Guidelines/Guidelines%20for%20monitoring%20phytoplankton%20species%20composition,%20abundance%20and%20biomass.pdf HELCOM (2017): Cyanobacterial Bloom Index (CyaBI). HELCOM pre-core indicator report. July 2017. http://www.helcom.fi/Core%20Indicators/Cyanobacterial%20bloom%20index%20-%20precore%20indicators%20-%20HOLAS%20II%20component.pdf Jaanus, A., Andersson, A., Hajdu, S., Huseby, S., Jurgensone, I., Olenina, I., Wasmund, N., Toming, K., 2007: Shifts in the Baltic Sea summer phytoplankton communities in 1992-2006. HELCOM Indicator Fact Sheet. Online. http://www.helcom.fi/baltic-sea-trends/environment-fact-sheets/eutrophication/shifts-in-the-baltic-sea-summer-phytoplankton-communities-in-1992-2006/ Kahru, M., Elmgren, R., 2014: Multidecadal time series of satellite-detected accumulations of cyanobacteria in the Baltic Sea. Biogeosciences, 11:3619–3633. Kaitala, S., Hällfors, S., 2008: Cyanobacteria bloom index. HELCOM Indicator Fact Sheets 2008. Lehtimäki, J., Moisander, P., Sivonen, K., and Kononen, K., 1997: Growth, nitrogen fixation, and nodularin production by two Baltic Sea cyanobacteria. Applied and Environmental Microbiology 63(5), 1647-1656. Lehtinen, S., Suikkanen, S., Hällfors, H., Kauppila, P., Lehtiniemi, M., Tuimala, J., Uusitalo, L., Kuosa, H., 2016: Approach for supporting food web assessments with multi-decadal phytoplankton community analyses –case Baltic Sea. Front. Mar. Sci. 3:220. doi: 10.3389/fmars.2016.00220
HELCOM Baltic Sea Environment Fact Sheet 2017
Öberg, J., 2016: Cyanobacterial blooms in the Baltic Sea in 2015. HELCOM Baltic Sea Environment Fact Sheets 2016. Online. http://www.helcom.fi/baltic-sea-trends/environment-fact-sheets/eutrophication/cyanobacterial-blooms-in-the-baltic-sea/ Olenina, I., Hajdu, S., Andersson, A., Edler, L., Wasmund, N., Busch, S., Göbel, J., Gromisz, S., Huseby, S., Huttunen, M., Jaanus, A., Kokkonen, P., Ledaine, I., Niemkiewicz, E., 2006: Biovolumes and size-classes of phytoplankton in the Baltic Sea. Baltic Sea Environment Proceedings 106, 144pp. http://www.helcom.fi/Lists/Publications/BSEP106.pdf, with updated Appendix available at http://www.ices.dk/marine-data/Documents/ENV/PEG_BVOL.zip. Schneider, B., Bücker, S., Kaitala, S., Maunula, P., Wasmund, N., 2015: Characteristics of the spring/summer production in the Mecklenburg Bight (Baltic Sea) as revealed by long-term pCO2 data. Oceanologia 57, 375-385. DOI: 10.1016/j.oceano.2015.07.001 Suikkanen, S., Pulina, S., Engström-Öst, J., Lehtiniemi, M., Lehtinen, S., and Brutemark, A., 2013: Climate change and eutrophication induced shifts in Northern Summer plankton communities. PLoSONE 8:e66475.doi: 10.1371/journal.pone.0066475 Wasmund, N., 1997: Occurrence of cyanobacterial blooms in the Baltic Sea in relation to environmental conditions. Int Rev Gesamten Hydrobiol 82, 169-184. Wasmund, N., Tuimala, J., Suikkanen, S., Vandepitte, L., Kraberg, A., 2011: Long-term trends in phytoplankton composition in the western and central Baltic Sea. Journal of Marine Systems 87: 145–159. DOI: 10.1016/j.jmarsys.2011.03.010
HELCOM Baltic Sea Environment Fact Sheet 2017
Data
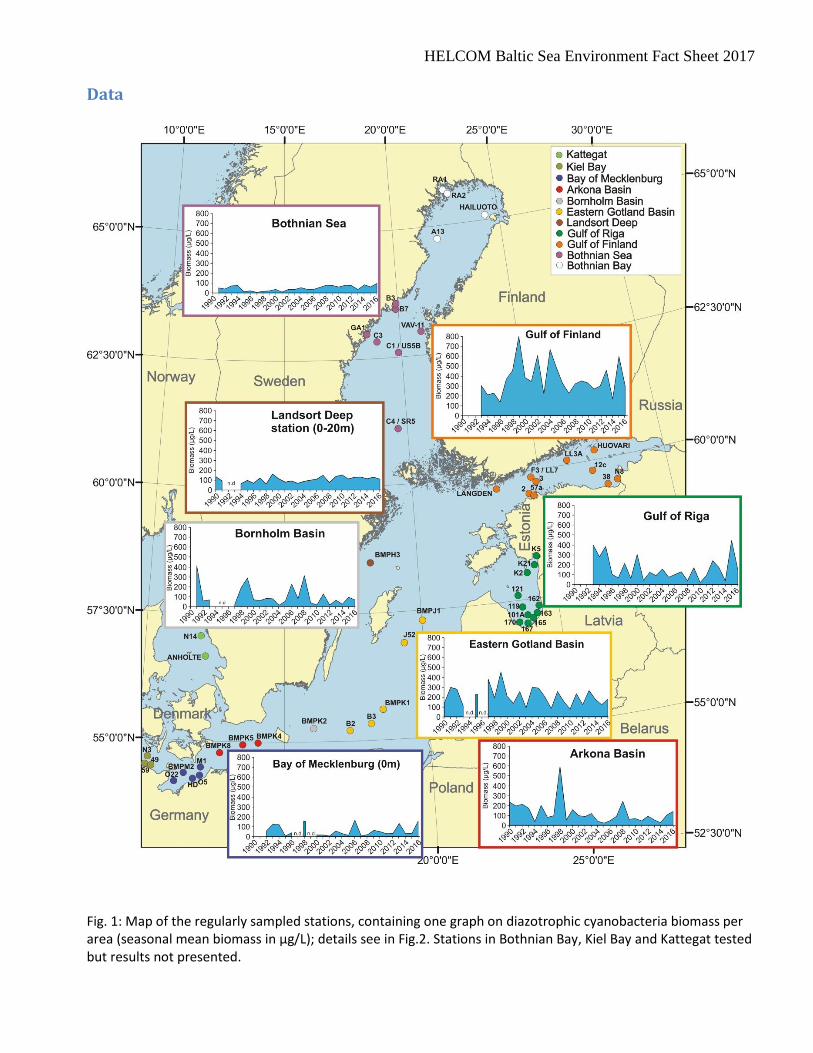
Fig. 1: Map of the regularly sampled stations, containing one graph on diazotrophic cyanobacteria biomass per area (seasonal mean biomass in µg/L); details see in Fig.2. Stations in Bothnian Bay, Kiel Bay and Kattegat tested but results not presented.
HELCOM Baltic Sea Environment Fact Sheet 2017
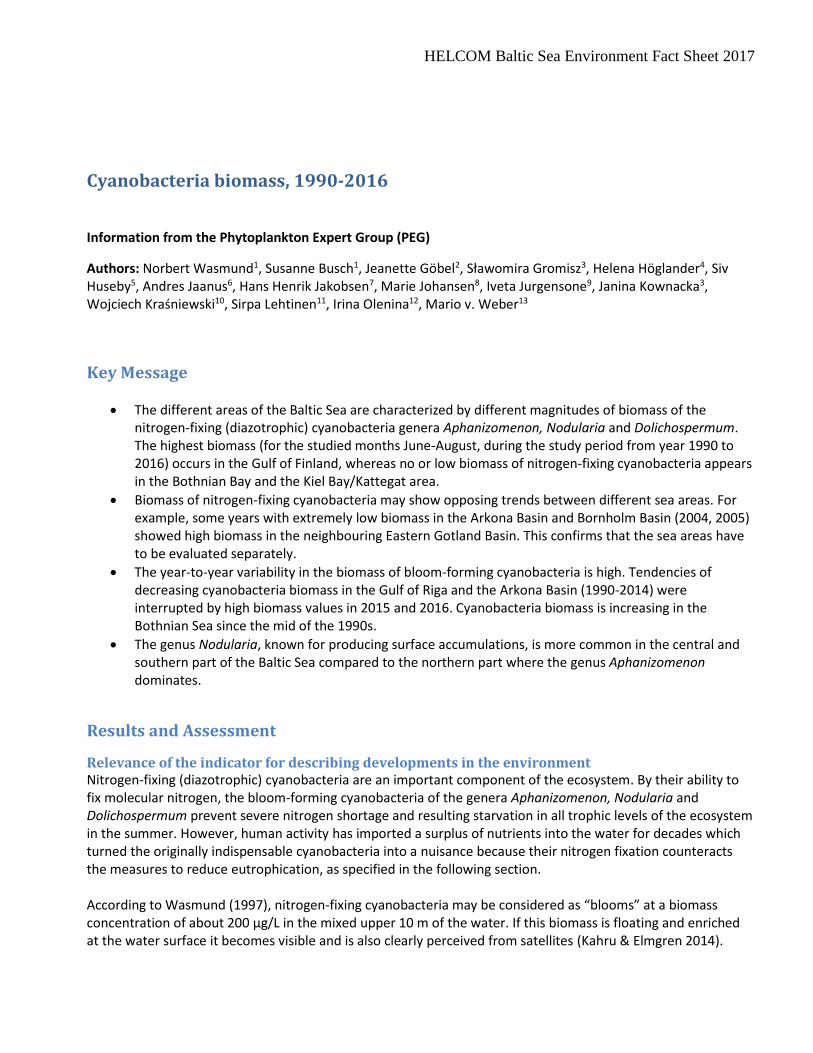
Fig. 2: Mean biomass (wet weight, µg/L) of the three bloom-forming cyanobacteria genera in the different Baltic Sea areas (a-h) during their blooming period (note the different scales). The long-term average per area (all species together) is indicated by a horizontal line. “n” is total number of samples analysed for this region, “n.d.” = no sufficient data.

HELCOM Baltic Sea Environment Fact Sheet 2017
Metadata
Technical information
1. Data source: Danish, Estonian, Finnish, German, Latvian, Lithuanian, Polish and Swedish national monitoring data (see list of authors and Footnotes). Main sampling locations are presented in Fig. 1. Original purpose of the data: Phytoplankton monitoring programs in the frame of HELCOM COMBINE.
2. Description of data: Biomass data (wet weight in µg/L) in integrated samples (0-10 m; 0-20 m at the Landsort Deep; surface = 0-1 m in Bay of Mecklenburg). Sampling at the Finnish high-frequency coastal stations “Hailuodon ed int.asema”, “Suomenl Huovari Kyvy-8A”, “UUS-23 Längden” and “Vav-11 V-4” reached from surface to the depth of 2x Secchi depth (usually 0-8 m); they could be integrated into the existing data series without problems. Genera included in index: Nodularia, Aphanizomenon and Dolichospermum (previously Anabaena).
3. Geographical coverage: Entire Baltic Sea (see Fig. 1).
4. Temporal coverage: Summer 1990-2016 (June-August, in the Bothnian Sea June-October). Note that the years 1992-1993 are missing from the Landsort Deep station, 1994 and 1996 from the Eastern Gotland Basin, 1994-1996 from the Bornholm Basin and 1997 and 1999 from the Bay of Mecklenburg. Even if data from one month were available, they were excluded because only one month was not representative for the investigation period. Some time series started later, e.g. from Gulfs of Finland and Riga in 1993.
5. Methodology and frequency of data collection: Information based on national monitoring samples analysed and identified by phytoplankton experts, using the mandatory HELCOM methods (HELCOM 2017). Additional explanation on the counting procedure in size classes was given by Olenina et al. (2006). Sampling frequency was variable in dependency of the national monitoring cruises. At least one sample per month has to be available to allow the calculation of the seasonal average. This precondition could also be fulfilled by pooling nearby stations. Only in a few exceptions, mentioned in the Assessment section, data are presented despite missing data from one month out of three. The total number of samples is indicated in each diagram in Fig. 2. 6. Methodology of data manipulation: The precondition of at least one sample per month could be fulfilled in the representative open sea stations by combining the different national monitoring data. In coastal areas under the responsibility of only one country, many data (from Lithuania and Poland) had to be rejected because of too low sampling frequency. Other coastal data (from Gulfs of Bothnia, Finland and Riga, see Fig. 1) are included, as they were close to the open sea stations and their sampling frequency was high (Fig. 2). From the single data, monthly means were calculated, which served as basis for calculation of seasonal mean values.
Quality information
1. Strength and weakness (at data level): The main strength is the availability of comparable multi-decadal genus-specific biomass data. The main weaknesses are the low number of sampling stations and the low seasonal coverage in the sampling frequency. Monitoring cruises into the open Baltic Sea are expensive and can be conducted only a few times per year by the countries involved. This undersampling problem, occurring generally at ship-based sampling, is dramatic if high patchiness occurs. Especially the buoyant cyanobacteria are inhomogeneous in their horizontal and vertical distribution. The vertical inhomogeneity is tackled by the integrated sampling down to 10 m, or at specific stations down to 20 m depth (Landsort Deep) or 2 times Secchi depth (Finnish coastal stations). The equipment is however not designed for representative sampling of surface scums. The combining of the different national data taken at the central HELCOM stations improves the total sampling frequency to reach the minimum requirements.
HELCOM Baltic Sea Environment Fact Sheet 2017
2. Reliability, accuracy, robustness, uncertainty (at data level): Data on the reliability and precision are not available. A ring test of HELCOM-PEG, conducted in 2012, gave information on the precision of Nodularia countings in dependence of the counting procedure (Griniene et al. 2013). The uncertainties concerning sampling are discussed above; they have natural reasons. The microscopical counting is a robust method of high accuracy. In contrast to indirect methods (satellites, pigments etc.), the objects can directly be recognized, counted and measured. Moreover, the contribution of the different species can be evaluated. The calculation of biomass from the counting results is highly reliable since common biovolume formulas (Olenina et al. 2006) and a regularly updated biovolume file (http://www.ices.dk/marine-data/Documents/ENV/PEG_BVOL.zip) are used.
3. Further work required (for data level and indicator level): In order to assure a sufficient sampling frequency, the combined efforts of different countries to sample at least the central key station in each sea area have to be maintained or better to be extended. This is especially important when these data will be used to follow up the Baltic Sea Action Plan, the Marine Strategic Framework Directive and the Water Framework Directive. The basic data for this Environment Fact Sheet will be integrated into a Cyanobacteria indicator, called “CyaBl”, for the implementation of the Marine Strategic Framework Directive. In order to be able to utilize the ICES database for the long-term trend analyses, the database should be updated annually, and kept harmonized concerning taxonomy and biovolume calculation formulae since the beginning of the study period (since year 1990). At the moment, data for this BSEFS has been collected yearly from the national PEG representatives.
FOOTNOTES 1 Leibniz Institute for Baltic Sea Research, Seestr. 15, D-18119 Warnemünde, Germany 2 State Agency for Agriculture, Environment and Rural Areas Schleswig-Holstein, Hamburger Chaussee 25, D-24220 Flintbek, Germany 3 National Marine Fisheries Research Institute (NMFRI), ul. Kołłataja 1, 81-332 Gdynia, Poland 4 Department of Ecology, Environment and Plant Sciences, Stockholm University, SE-106 91 Stockholm, Sweden 5 Umeå Marine Science Center, Norrbyn SE-90571 Hörnefors, Sweden 6 Estonian Marine Institute, Tartu University, Mäealuse 14, 12618 Tallinn, Estonia 7 Aarhus University, Faculty of Science and Technology, Department of Bioscience, Frederiksborgvej 399, PO Box 358, DK-4000 Roskilde, Denmark 8 Swedish Meteorological and Hydrological Institute, Oceanographic Unit, Sven Källfelts gata 15, SE-426 71 Västra Frölunda, Sweden 9 Latvian Institute of Aquatic Ecology, Department of Marine Monitoring, Voleru īela 4, LV-1007, Riga, Latvia 10 Institute of Meteorology and Water Management, Maritime Branch, ul. Waszyngtona 42, 81-342 Gdynia, Poland 11 Finnish Environment Institute (SYKE), Marine Research Centre, Erik Palménin Aukio 1,P.O. Box 140, 00251 Helsinki, Finland 12 Environmental Protection Agency, Department of Marine Research, Taikos str 26, LT-91149, Klaipeda, Lithuania 13 State Agency for Environment, Nature Conservation and Geology Mecklenburg-Vorpommern, Goldberger Strasse 12, D-18273 Güstrow, Germany For reference purposes, please cite this indicator fact sheet as follows: Wasmund, N., Busch, S., Göbel, J., Gromisz, S., Höglander, H., Huseby, S., Jaanus, A., Jakobsen, H.H., Johansen,
M., Jurgensone, I., Kownacka, J., Kraśniewski, W., Lehtinen, S., Olenina, I., v.Weber, M., 2017. Cyanobacteria
biomass 1990-2016. HELCOM Baltic Sea Environment Fact Sheets 2017. Online. [Date Viewed],
http://www.helcom.fi/baltic-sea-trends/environment-fact-sheets/eutrophication/cyanobacteria-biomass/