Embed Size (px)
Citation preview
Journal of Information Security, 2017, 8, 91-105 http://www.scirp.org/journal/jis
ISSN Online: 2153-1242 ISSN Print: 2153-1234
DOI: 10.4236/jis.2017.82007 April 28, 2017
Cybersecurity: A Stochastic Predictive Model to Determine Overall Network Security Risk Using Markovian Process
Nawa Raj Pokhrel, Chris P. Tsokos
Department of Mathematics and Statistics, University of South Florida, Tampa, USA
Abstract There are several security metrics developed to protect the computer net-works. In general, common security metrics focus on qualitative and subjec-tive aspects of networks lacking formal statistical models. In the present study, we propose a stochastic model to quantify the risk associated with the overall network using Markovian process in conjunction with Common Vulnerability Scoring System (CVSS) framework. The model we developed uses host access graph to represent the network environment. Utilizing the developed model, one can filter the large amount of information available by making a priority list of vulnerable nodes existing in the network. Once a priority list is pre-pared, network administrators can make software patch decisions. Gaining in depth understanding of the risk and priority level of each host helps individu-als to implement decisions like deployment of security products and to design network topologies.
Keywords Vulnerability, Attack Graph, Markov Model, Exploitability, CVSS, FIRST, NVD, IDS
1. Introduction
Computer networks are undoubtedly vulnerable no matter what level of hard ware, software or a combination of both types of security parameters are incor-porated. As long as the network servers provide services on different host servers, they depend on the server software that may have security holes which makes them susceptible to malicious attacks. To detect and/or prevent the network ac-cessible resources from suspicious attacks, various commercial Intrusion Detec-tion Systems (IDSs) [1] /Prevention Systems are available in the market. These
How to cite this paper: Pokhrel, N.R. and Tsokos C.P. (2017) Cybersecurity: A Sto-chastic Predictive Model to Determine Overall Network Security Risk Using Mar-kovian Process. Journal of Information Security, 8, 91-105. https://doi.org/10.4236/jis.2017.82007 Received: March 3, 2017 Accepted: April 25, 2017 Published: April 28, 2017 Copyright © 2017 by authors and Scientific Research Publishing Inc. This work is licensed under the Creative Commons Attribution-NonCommercial International License (CC BY-NC 4.0). http://creativecommons.org/licenses/by-nc/4.0/
Open Access
N. R. Pokhrel, C. P. Tsokos
92
intrusion detection/prevention based tools provides some sort of a signal that alerts the network administrator and provides them a partial picture of the net-work [2]. One of the most important challenges on today’s networks is to devel-op the mechanism to aggregate the security risk of all systems in a network to evaluate the overall security risk.
In order to evaluate the security risk of a large scale enterprise, an adminis-trator must consider not only single vulnerability exploit but also the multi-stage and the multi-host vulnerability attack used by the attackers. To incorporate this fact, an attack graph is built to find out the logical relationship between multiple exploits. However, when size and complexity of the network increases, two ma-jor problems occur. First, the attack graph grows exponentially when the size of the network and algorithm complexity increase. Secondly, comprehending the information conveyed by the graph becomes difficult. Therefore, the attack graph that addresses the issues mentioned earlier were chosen and we will ex-plain further in the next section.
Very little has been done in scientific and research community to develop sta-tistical model that quantify the overall network security risk. Most of the work focuses on qualitative and subjective aspect of networks without having formal statistical model. To get rid of this problem, we introduce the statistical model that uses Markov chains in conjunction with CVSS framework metrics to ana-lyze risks associated with structures of various networks. The model can be used to identify critical nodes in the host access graph where attackers may be most likely to focus. Based on that information, a network administrator can make appropriate, prioritized decisions for system patching. Further, a flexible risk ranking technique is described, where the decisions made by an attacker can be adjusted using a bias factor. The model can be generalized for use with compli-cated network environments.
In recent studies, S.M. Rajasooriya [3] and P.K. Kaluarachchi [4] have devel-oped a very interesting and useful statistical model that predicts the expected path length and evaluation of the security risk under different vulnerabilities by utilizing CVSS framework with Markovian process.
In the present study, we are proposing a stochastic model for the security risk evaluation for the entire network based on the Exploitability sub-score and Impact sub-score. We are considering a realistic network topology having three host servers and each host consists of one vulnerability. Based on the network architecture and given firewall rules, a host access graph is constructed. From the host access graph one state transition probability matrix is computed by uti-lizing Exploitability sub-score and Impact sub-score. By using the Markovian random walk, we can prioritize the risk associated with each node via ranking.
Finally, summing up the risk associated with all the nodes presents in the net-work, we determine the overall network security risk. This quantitative value can be taken as a security metric to determine the risk of an entire network. Finally, the schematic network topology in our study represents a typical security system that is in operation. Thus, our proposed statistical model and methodology can be ap-plied to a specific security system that is in place for a given company.
N. R. Pokhrel, C. P. Tsokos
93
2. Background and Terminologies of Cybersecurity
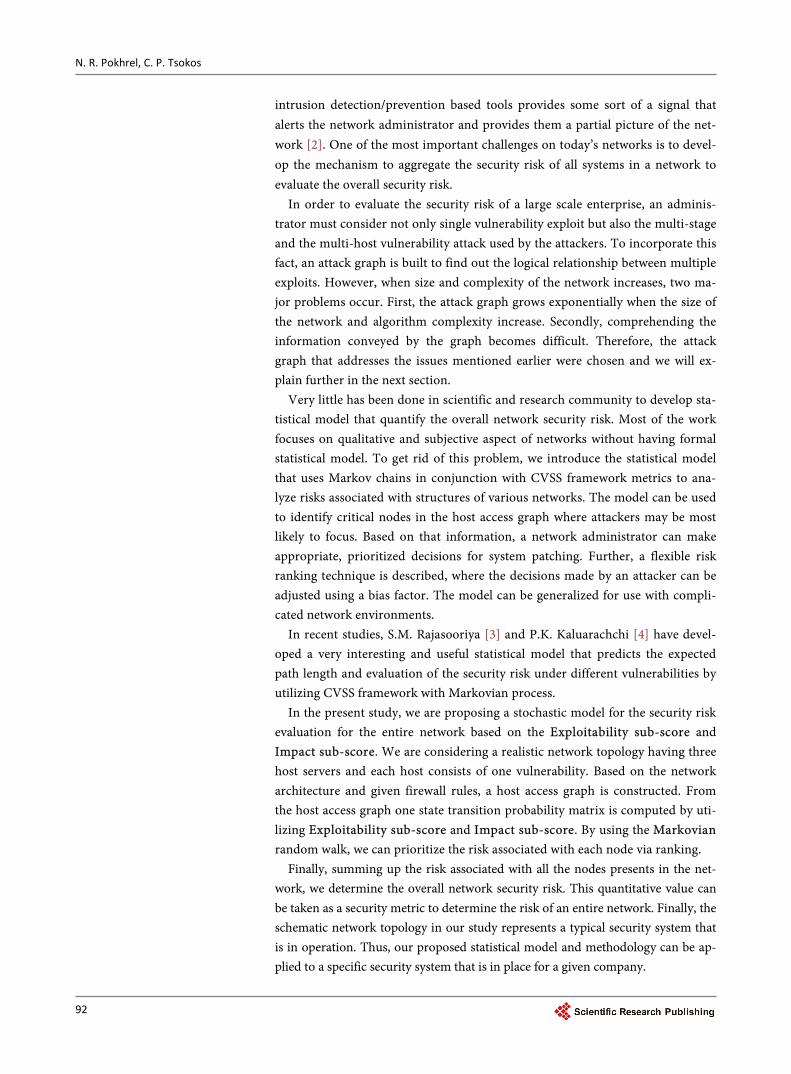
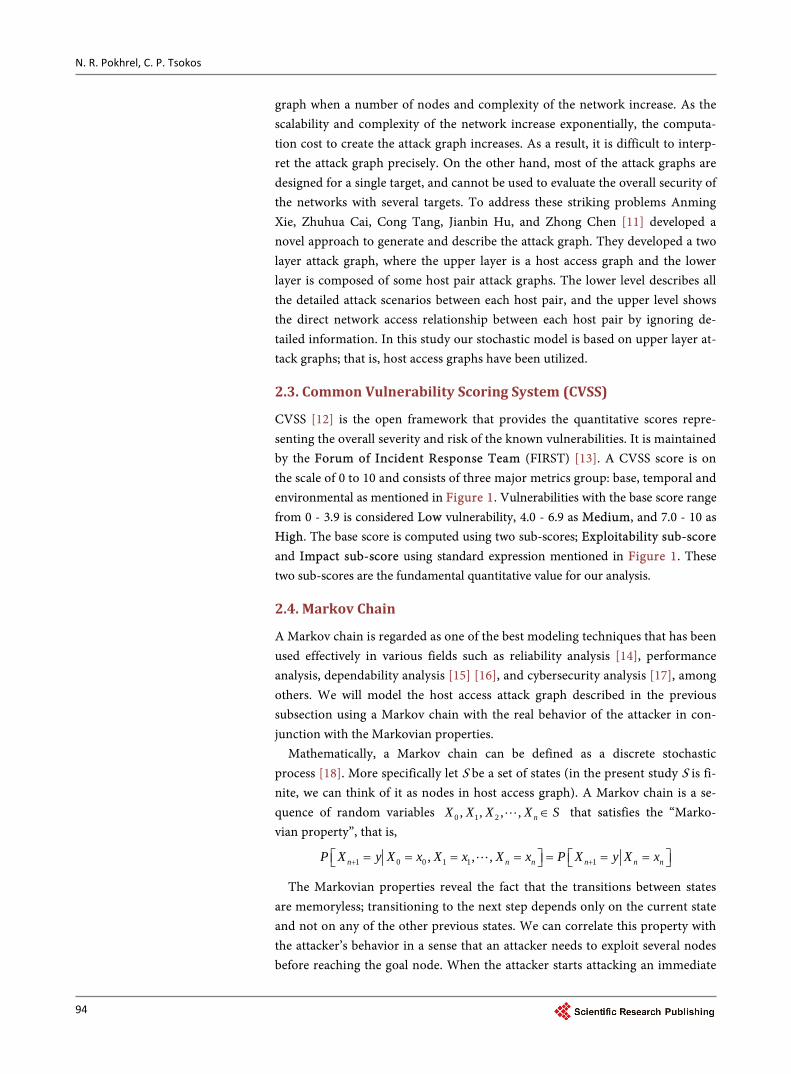
In this section, we have defined some of the basic terminology related with cyber security. We also explain the basic idea of the Markov chain process that is im-plemented to develop the stochastic model to achieve our objective. Figure 1 provides the schematic presentation of the CVSS framework, [5] and vividly re-veals the holistic idea to compute the base score along with Exploitability sub- score and Impact sub-score.
2.1. Vulnerabilities
A vulnerability is a flaw that exists in computer resources or control that can be exploited by one or more threats. A software vulnerability [6] is an instance of an error in the specification, development, or configuration of software such that its execution can violate the security policy. Attackers normally use the known vulnerabilities which are listed publicly on National Vulnerability Database (NVD) [7] to penetrate the system. Sometimes attackers may use a vulnerability that has not been disclosed publicly which is called zero day vulnerability. There is almost no defense against a zero day attack [8]. Zero day vulnerability remains unknown to vendors; thus information about the new vulnerabilities gives the attackers a free pass to attack any target host. The zero day attack has not been used in this study.
2.2. Attack Graphs
Attackers usually penetrate any type of computer network via a chain of exploits where each exploit in the chain creates the foundation for upcoming exploits. A combination of such exploits make the chain called attack path; a collection of such attack paths develop the attack graph. An attack graph is a succinct repre-sentation of all paths through a system that ends in a state where an intruder has successfully achieved its goal [9] [10]. There are many algorithms that have been developed in the scientific and research community to construct the attack graphs. However, it is very difficult to analyze the network via attack
Figure 1. Common vulnerability system for base metric calculation model.
N. R. Pokhrel, C. P. Tsokos
94
graph when a number of nodes and complexity of the network increase. As the scalability and complexity of the network increase exponentially, the computa-tion cost to create the attack graph increases. As a result, it is difficult to interp-ret the attack graph precisely. On the other hand, most of the attack graphs are designed for a single target, and cannot be used to evaluate the overall security of the networks with several targets. To address these striking problems Anming Xie, Zhuhua Cai, Cong Tang, Jianbin Hu, and Zhong Chen [11] developed a novel approach to generate and describe the attack graph. They developed a two layer attack graph, where the upper layer is a host access graph and the lower layer is composed of some host pair attack graphs. The lower level describes all the detailed attack scenarios between each host pair, and the upper level shows the direct network access relationship between each host pair by ignoring de-tailed information. In this study our stochastic model is based on upper layer at-tack graphs; that is, host access graphs have been utilized.
2.3. Common Vulnerability Scoring System (CVSS)
CVSS [12] is the open framework that provides the quantitative scores repre- senting the overall severity and risk of the known vulnerabilities. It is maintained by the Forum of Incident Response Team (FIRST) [13]. A CVSS score is on the scale of 0 to 10 and consists of three major metrics group: base, temporal and environmental as mentioned in Figure 1. Vulnerabilities with the base score range from 0 - 3.9 is considered Low vulnerability, 4.0 - 6.9 as Medium, and 7.0 - 10 as High. The base score is computed using two sub-scores; Exploitability sub-score and Impact sub-score using standard expression mentioned in Figure 1. These two sub-scores are the fundamental quantitative value for our analysis.
2.4. Markov Chain
A Markov chain is regarded as one of the best modeling techniques that has been used effectively in various fields such as reliability analysis [14], performance analysis, dependability analysis [15] [16], and cybersecurity analysis [17], among others. We will model the host access attack graph described in the previous subsection using a Markov chain with the real behavior of the attacker in con-junction with the Markovian properties.
Mathematically, a Markov chain can be defined as a discrete stochastic process [18]. More specifically let S be a set of states (in the present study S is fi-nite, we can think of it as nodes in host access graph). A Markov chain is a se-quence of random variables 0 1 2, , , , nX X X X S∈ that satisfies the “Marko-vian property”, that is,
1 0 0 1 1 1, , ,n n n n n nP X y X x X x X x P X y X x+ + = = = = = = =
The Markovian properties reveal the fact that the transitions between states are memoryless; transitioning to the next step depends only on the current state and not on any of the other previous states. We can correlate this property with the attacker’s behavior in a sense that an attacker needs to exploit several nodes before reaching the goal node. When the attacker starts attacking an immediate
N. R. Pokhrel, C. P. Tsokos
95
node to reach the goal node, there are many nodes available before reaching the goal node called intermediate node. When an attacker reaches any intermediate node, there is no memory of previous node. The attacker launches further at-tacks until the goal node is found. To advance the attack, the attacker should move from one intermediate node to another/several intermediate node/s. In the present study, we have assumed that selection of the best intermediate node depends on three parameters, namely Exploitability sub-score, Impact sub-score, and an individual skill of the attacker called Bias factor.
Without loss of generality, transition states are independent of time. Mathe-matically, there exists some transition probability matrix, P(x, y) such that
( ) 1, n nP x y P X y X x+ = = = , for all n.
We can create a new set of states S × [n], having a different set of states asso-ciated with each timestep. In the present study, P(x,y) represents the transition probability matrix. To simulate the Markov chain, a stochastic transition probabil-ity matrix P and the initial probability distribution is required. In the present study, initial risk associated with each nodes in the host access graph is considered as ini-tial probability distribution which will be explained further in Section 4. Once we have the stochastic matrix P and the initial risk, then utilizing the basic properties of Markovian process, we can determine the risk of the entire network.
3. Cyber Security Analytical Framework
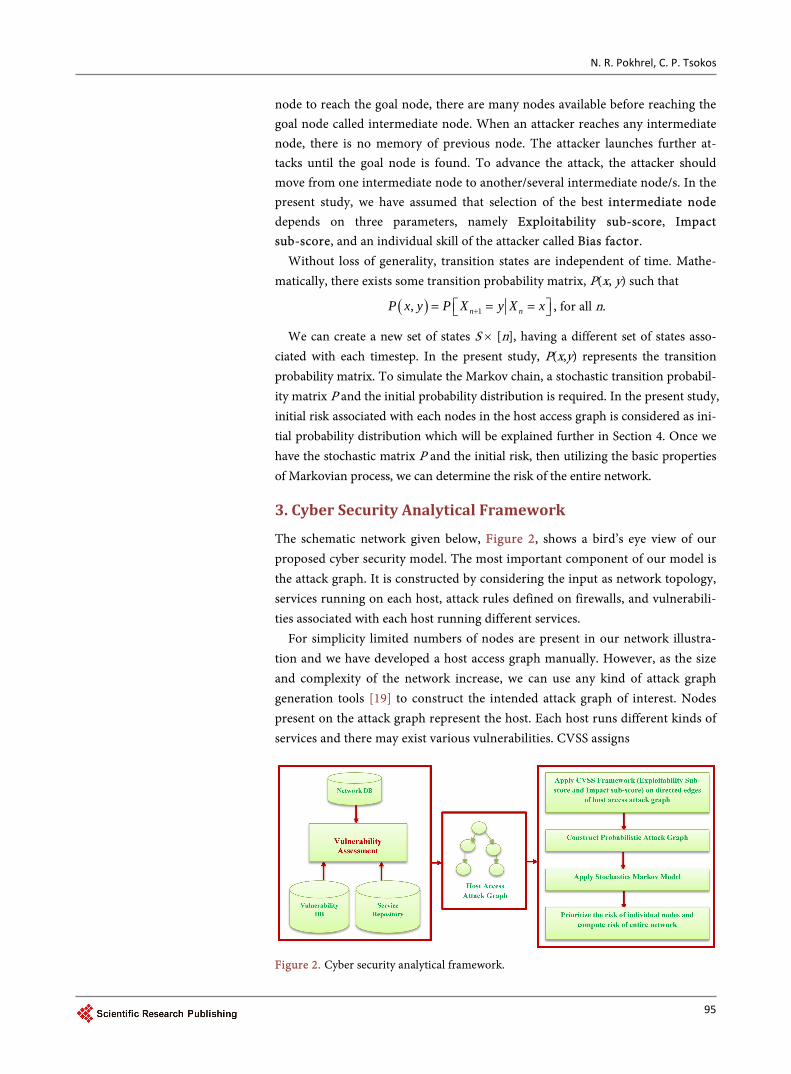
The schematic network given below, Figure 2, shows a bird’s eye view of our proposed cyber security model. The most important component of our model is the attack graph. It is constructed by considering the input as network topology, services running on each host, attack rules defined on firewalls, and vulnerabili-ties associated with each host running different services.
For simplicity limited numbers of nodes are present in our network illustra-tion and we have developed a host access graph manually. However, as the size and complexity of the network increase, we can use any kind of attack graph generation tools [19] to construct the intended attack graph of interest. Nodes present on the attack graph represent the host. Each host runs different kinds of services and there may exist various vulnerabilities. CVSS assigns
Figure 2. Cyber security analytical framework.
N. R. Pokhrel, C. P. Tsokos
96
severity scores for each vulnerability. The score is computed based on the stan-dard expressions. The standard expression depends on several matrices that provide a quantitative score to approximate ease and impact of exploit. In the present study, we have applied both scores to determine whether it is beneficial to move from one node to another node from the attacker’s perspective. These two scores, that is, Exploitability sub-score and Impact sub-score, are combined to provide the basis of assigning the edges of attack graphs to represent the val-ues of the probability distribution. This probability represents the possibility of a vulnerability to be exploited by an attacker. While implementing our stochastic model, the behavior of the attacker is another concern. In this study, we assume that the attacker will choose the vulnerability that maximizes the chances of succeeding in compromising the goal state. Due to any reason, if the attacker terminates attacking, then the attacker will move to the initial state. Finally, uti-lizing the properties of Markov chain, the risk of the individual node is com-puted. Nodes are prioritized based on computed risk. Then, we sum the risks of all the nodes that will give us the total security risk present in the network.
4. Model Representation
The central component of the proposed stochastic model exclusively depends on the host access graph mentioned in the previous section. Before delving into the modeling approach, let us formally explain the host access graph as shown below by Figure 3.
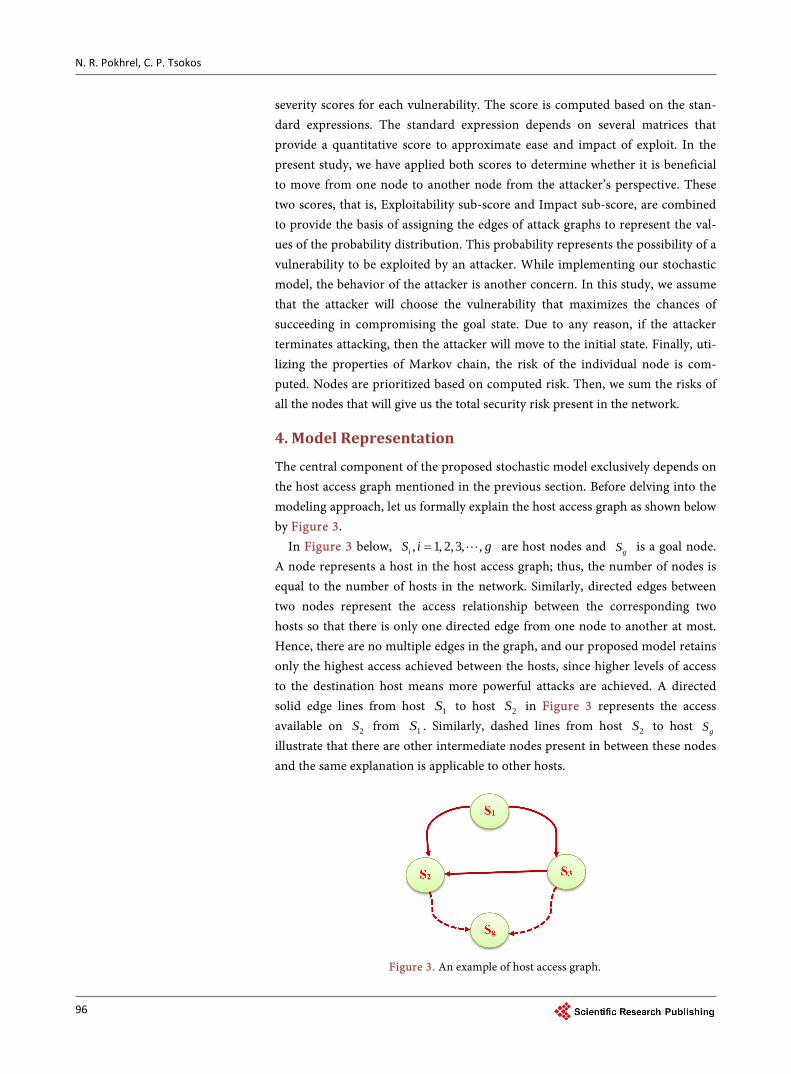
In Figure 3 below, , 1, 2,3, ,iS i g= are host nodes and gS is a goal node. A node represents a host in the host access graph; thus, the number of nodes is equal to the number of hosts in the network. Similarly, directed edges between two nodes represent the access relationship between the corresponding two hosts so that there is only one directed edge from one node to another at most. Hence, there are no multiple edges in the graph, and our proposed model retains only the highest access achieved between the hosts, since higher levels of access to the destination host means more powerful attacks are achieved. A directed solid edge lines from host 1S to host 2S in Figure 3 represents the access available on 2S from 1S . Similarly, dashed lines from host 2S to host gS illustrate that there are other intermediate nodes present in between these nodes and the same explanation is applicable to other hosts.
Figure 3. An example of host access graph.
N. R. Pokhrel, C. P. Tsokos
97
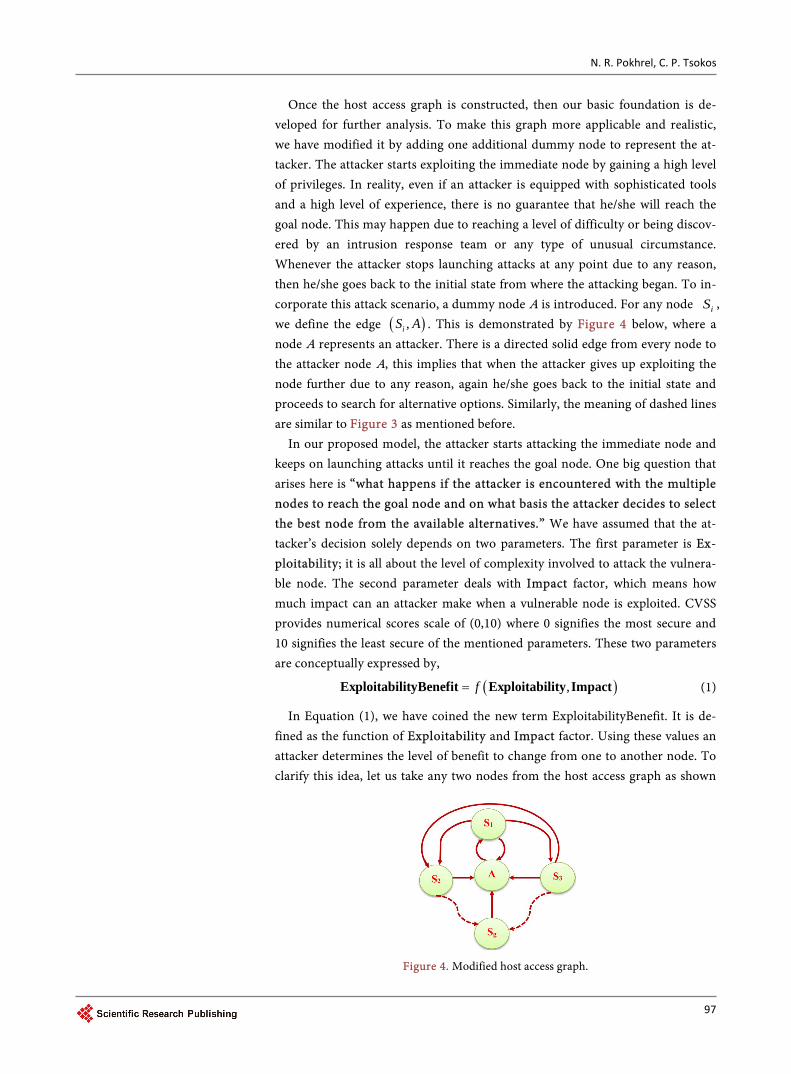
Once the host access graph is constructed, then our basic foundation is de-veloped for further analysis. To make this graph more applicable and realistic, we have modified it by adding one additional dummy node to represent the at-tacker. The attacker starts exploiting the immediate node by gaining a high level of privileges. In reality, even if an attacker is equipped with sophisticated tools and a high level of experience, there is no guarantee that he/she will reach the goal node. This may happen due to reaching a level of difficulty or being discov-ered by an intrusion response team or any type of unusual circumstance. Whenever the attacker stops launching attacks at any point due to any reason, then he/she goes back to the initial state from where the attacking began. To in-corporate this attack scenario, a dummy node A is introduced. For any node iS , we define the edge ( ),iS A . This is demonstrated by Figure 4 below, where a node A represents an attacker. There is a directed solid edge from every node to the attacker node A, this implies that when the attacker gives up exploiting the node further due to any reason, again he/she goes back to the initial state and proceeds to search for alternative options. Similarly, the meaning of dashed lines are similar to Figure 3 as mentioned before.
In our proposed model, the attacker starts attacking the immediate node and keeps on launching attacks until it reaches the goal node. One big question that arises here is “what happens if the attacker is encountered with the multiple nodes to reach the goal node and on what basis the attacker decides to select the best node from the available alternatives.” We have assumed that the at-tacker’s decision solely depends on two parameters. The first parameter is Ex-ploitability; it is all about the level of complexity involved to attack the vulnera-ble node. The second parameter deals with Impact factor, which means how much impact can an attacker make when a vulnerable node is exploited. CVSS provides numerical scores scale of (0,10) where 0 signifies the most secure and 10 signifies the least secure of the mentioned parameters. These two parameters are conceptually expressed by,
( ),f=ExploitabilityBenefit Exploitability Impact (1)
In Equation (1), we have coined the new term ExploitabilityBenefit. It is de-fined as the function of Exploitability and Impact factor. Using these values an attacker determines the level of benefit to change from one to another node. To clarify this idea, let us take any two nodes from the host access graph as shown
Figure 4. Modified host access graph.
N. R. Pokhrel, C. P. Tsokos
98
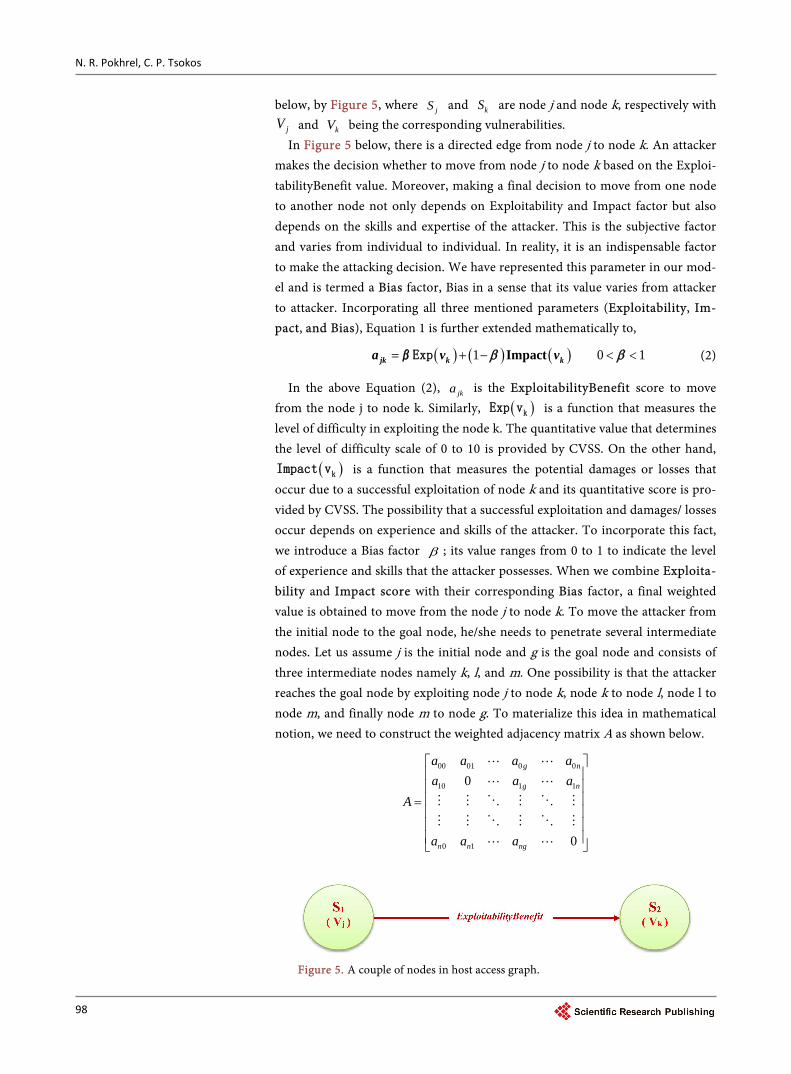
below, by Figure 5, where jS and kS are node j and node k, respectively with
jV and kV being the corresponding vulnerabilities. In Figure 5 below, there is a directed edge from node j to node k. An attacker
makes the decision whether to move from node j to node k based on the Exploi-tabilityBenefit value. Moreover, making a final decision to move from one node to another node not only depends on Exploitability and Impact factor but also depends on the skills and expertise of the attacker. This is the subjective factor and varies from individual to individual. In reality, it is an indispensable factor to make the attacking decision. We have represented this parameter in our mod-el and is termed a Bias factor, Bias in a sense that its value varies from attacker to attacker. Incorporating all three mentioned parameters (Exploitability, Im-pact, and Bias), Equation 1 is further extended mathematically to,
( ) ( ) ( )1 0 1= + − < <Impactjk k ka v vβExp β β (2)
In the above Equation (2), jka is the ExploitabilityBenefit score to move from the node j to node k. Similarly, ( )kExp v is a function that measures the level of difficulty in exploiting the node k. The quantitative value that determines the level of difficulty scale of 0 to 10 is provided by CVSS. On the other hand,
( )kImpact v is a function that measures the potential damages or losses that occur due to a successful exploitation of node k and its quantitative score is pro-vided by CVSS. The possibility that a successful exploitation and damages/ losses occur depends on experience and skills of the attacker. To incorporate this fact, we introduce a Bias factor β ; its value ranges from 0 to 1 to indicate the level of experience and skills that the attacker possesses. When we combine Exploita-bility and Impact score with their corresponding Bias factor, a final weighted value is obtained to move from the node j to node k. To move the attacker from the initial node to the goal node, he/she needs to penetrate several intermediate nodes. Let us assume j is the initial node and g is the goal node and consists of three intermediate nodes namely k, l, and m. One possibility is that the attacker reaches the goal node by exploiting node j to node k, node k to node l, node l to node m, and finally node m to node g. To materialize this idea in mathematical notion, we need to construct the weighted adjacency matrix A as shown below.
00 01 0 0
10 1 1
0 1
0
0
g n
g n
n n ng
a a a aa a a
A
a a a
=
Figure 5. A couple of nodes in host access graph.
N. R. Pokhrel, C. P. Tsokos
99
Each element of the adjacency matrix is computed using Equation (2). Diagonal values of the adjacency matrix are all zero because no cost is in-
volved to move from the current node to the node itself. Elements of the matrix A are not normalized, thus, the non normalized values are converted into prob-abilities using Equation (3). This equation reveals the fact that in each step the attacker goes from node j to k with probability given by
( )( )∑jk
i
A j,kp =
A j,i (3)
Writing Equation (3) in matrix form we have,
P = DA (4)
where, A is the weighted adjacency matrix. P is the transition matrix that pro-vides the transition probability that the attacker moves from one state to another state and D is the diagonal matrix computed using Equation (5) below,
( )
∑jk i
1if j = k
A j,iD =
0 Otherwise
(5)
Finally, we have constructed the transition matrix (using Equation (4)) representing transitions probability that an attacker moves from one state to another state, that is, from state j to state k.
5. The Risk Based on Ranking
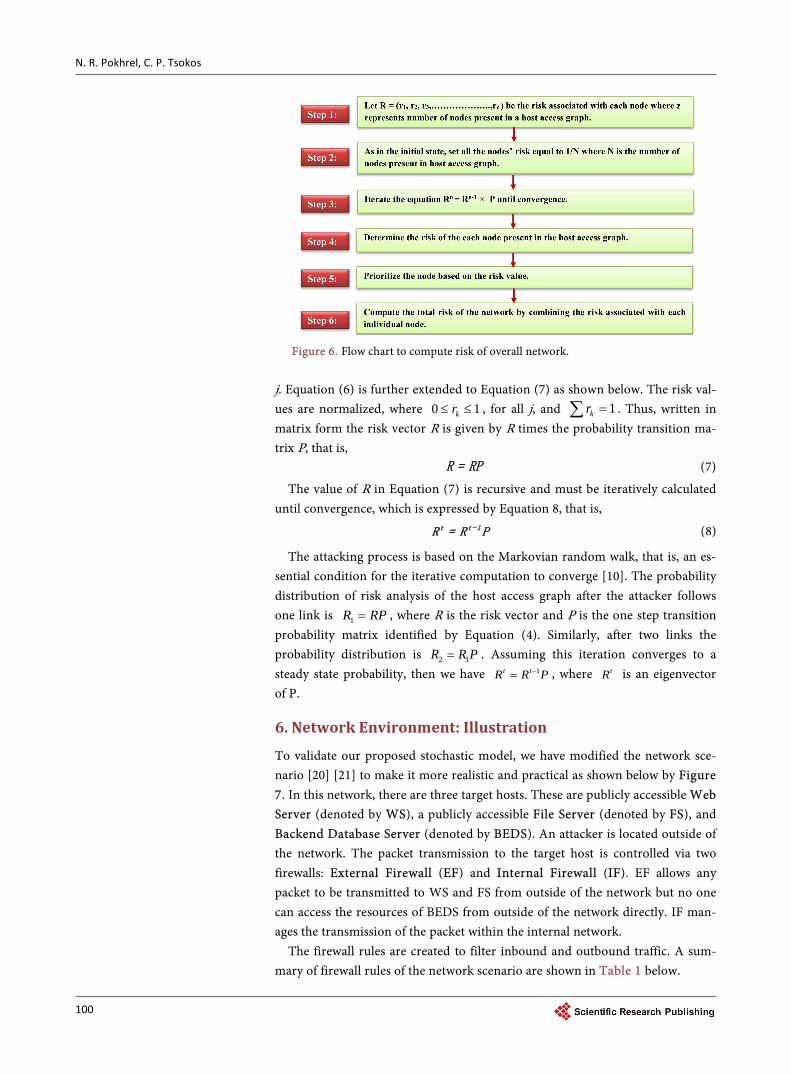
Consider an attacker starts attacking from the initial node to the goal node. The attacker must obtain a user level or root level of privilege on the intermediate node to advance the attack further to reach to the goal node. In reality the at-tacker should try to obtain the highest level of privilege. Host access graphs are created based on the philosophy of gaining high level of privilege. Nodes of the host access graph are treated as OR nodes, which can be satisfied if any of the child node is true. The risk analysis is based on the relative rank value for every node of the host access graph. R is the risk vector and its initial risk value is computed based on the number of hosts present in the host access graph. Suppose there exist N nodes in the host access graph; then simply set all the node ranks equal to 1/N. This initial risk is first injected by the starting node of an attacker. This risk value flows level by level until convergence. The complete risk ranking algorithm is described by the schematic diagram given below by Figure 6.
The risk value of kr for a node k depends upon the rank of its parents. The risk value of the node set by the initial node represents the starting node of the attacker. When the ranking process is started then intermediate risk value is computed via iteration. The intermediate value will flow level by level until a steady state is achieved. Mathematically, suppose kr is the risk of node k given in the host access graph; then the risk of node k is computed using Equation 6, given by,
∑k k jkr = r p (6)
Suppose, ( )1 2 3, , , , zR r r r r= is the risk vector, where jr is the rank of node
N. R. Pokhrel, C. P. Tsokos
100
Figure 6. Flow chart to compute risk of overall network.
j. Equation (6) is further extended to Equation (7) as shown below. The risk val-ues are normalized, where 0 1kr≤ ≤ , for all j, and 1kr =∑ . Thus, written in matrix form the risk vector R is given by R times the probability transition ma-trix P, that is,
R = RP (7)
The value of R in Equation (7) is recursive and must be iteratively calculated until convergence, which is expressed by Equation 8, that is,
t t-1R = R P (8)
The attacking process is based on the Markovian random walk, that is, an es-sential condition for the iterative computation to converge [10]. The probability distribution of risk analysis of the host access graph after the attacker follows one link is 1R RP= , where R is the risk vector and P is the one step transition probability matrix identified by Equation (4). Similarly, after two links the probability distribution is 2 1R R P= . Assuming this iteration converges to a steady state probability, then we have 1t tR R P−= , where tR is an eigenvector of P.
6. Network Environment: Illustration
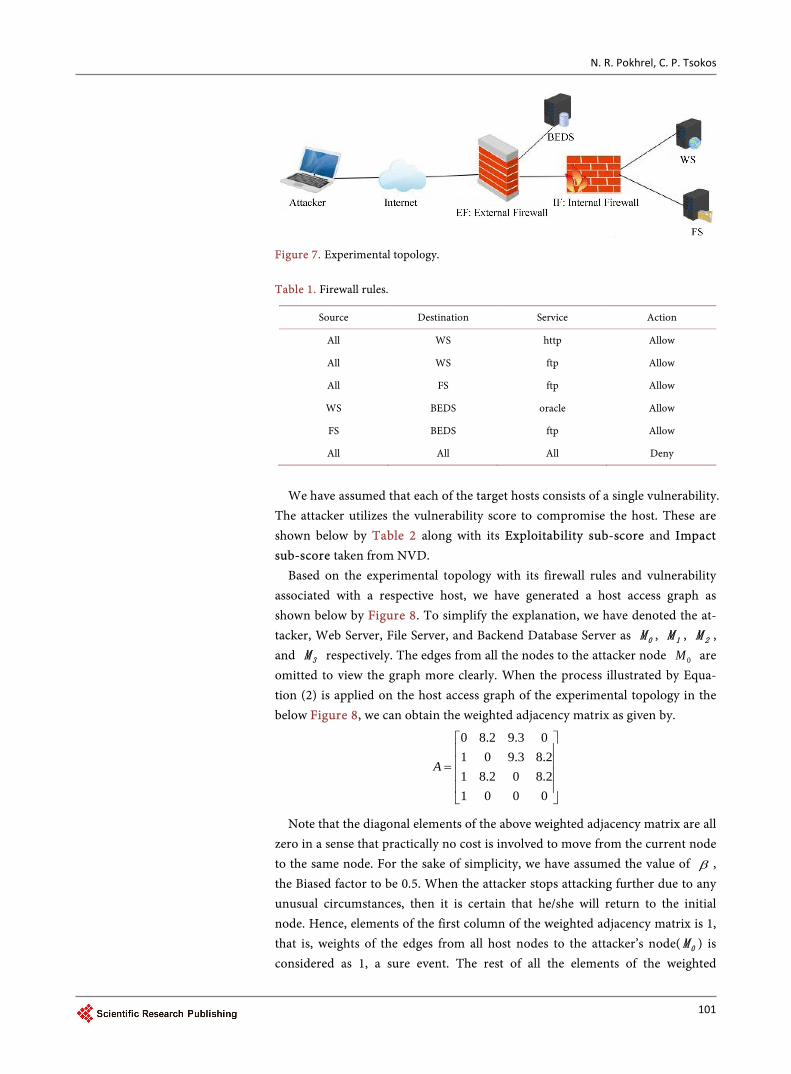
To validate our proposed stochastic model, we have modified the network sce-nario [20] [21] to make it more realistic and practical as shown below by Figure 7. In this network, there are three target hosts. These are publicly accessible Web Server (denoted by WS), a publicly accessible File Server (denoted by FS), and Backend Database Server (denoted by BEDS). An attacker is located outside of the network. The packet transmission to the target host is controlled via two firewalls: External Firewall (EF) and Internal Firewall (IF). EF allows any packet to be transmitted to WS and FS from outside of the network but no one can access the resources of BEDS from outside of the network directly. IF man-ages the transmission of the packet within the internal network.
The firewall rules are created to filter inbound and outbound traffic. A sum-mary of firewall rules of the network scenario are shown in Table 1 below.
N. R. Pokhrel, C. P. Tsokos
101
Figure 7. Experimental topology. Table 1. Firewall rules.
Source Destination Service Action
All WS http Allow
All WS ftp Allow
All FS ftp Allow
WS BEDS oracle Allow
FS BEDS ftp Allow
All All All Deny
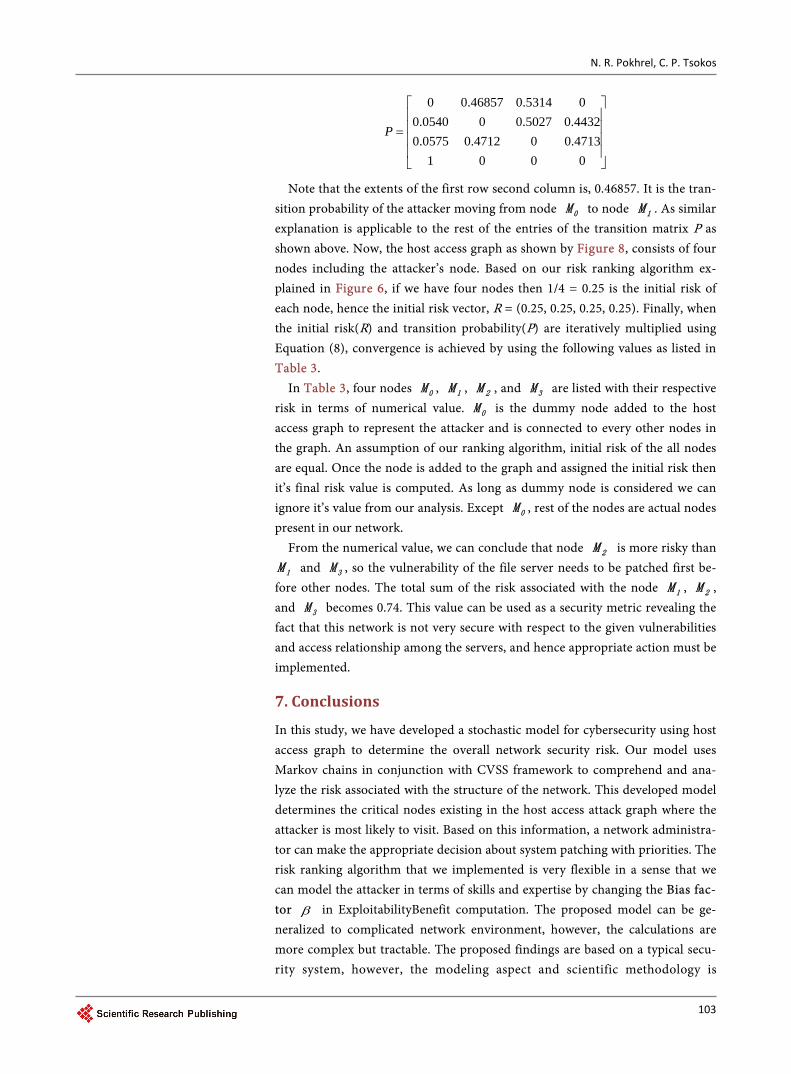
We have assumed that each of the target hosts consists of a single vulnerability.
The attacker utilizes the vulnerability score to compromise the host. These are shown below by Table 2 along with its Exploitability sub-score and Impact sub-score taken from NVD.
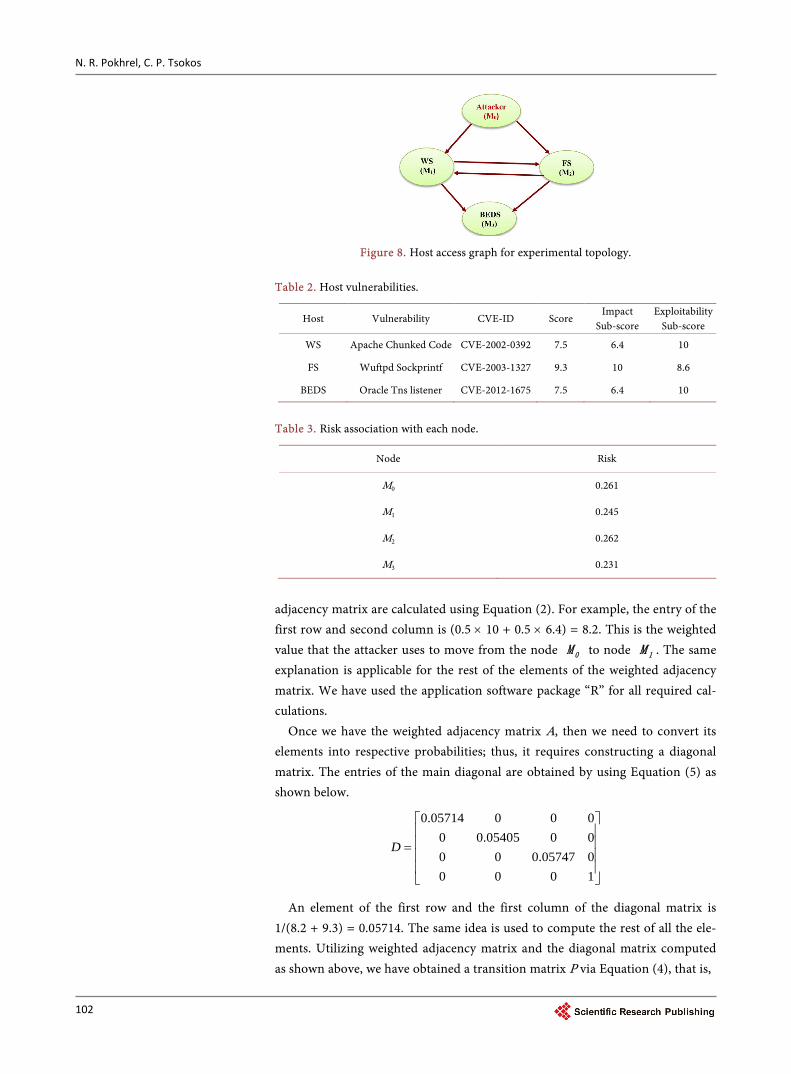
Based on the experimental topology with its firewall rules and vulnerability associated with a respective host, we have generated a host access graph as shown below by Figure 8. To simplify the explanation, we have denoted the at-tacker, Web Server, File Server, and Backend Database Server as 0M , 1M , 2M , and 3M respectively. The edges from all the nodes to the attacker node 0M are omitted to view the graph more clearly. When the process illustrated by Equa-tion (2) is applied on the host access graph of the experimental topology in the below Figure 8, we can obtain the weighted adjacency matrix as given by.
0 8.2 9.3 01 0 9.3 8.21 8.2 0 8.21 0 0 0
A
=
Note that the diagonal elements of the above weighted adjacency matrix are all zero in a sense that practically no cost is involved to move from the current node to the same node. For the sake of simplicity, we have assumed the value of β , the Biased factor to be 0.5. When the attacker stops attacking further due to any unusual circumstances, then it is certain that he/she will return to the initial node. Hence, elements of the first column of the weighted adjacency matrix is 1, that is, weights of the edges from all host nodes to the attacker’s node( 0M ) is considered as 1, a sure event. The rest of all the elements of the weighted
N. R. Pokhrel, C. P. Tsokos
102
Figure 8. Host access graph for experimental topology.
Table 2. Host vulnerabilities.
Host Vulnerability CVE-ID Score Impact
Sub-score Exploitability
Sub-score
WS Apache Chunked Code CVE-2002-0392 7.5 6.4 10
FS Wuftpd Sockprintf CVE-2003-1327 9.3 10 8.6
BEDS Oracle Tns listener CVE-2012-1675 7.5 6.4 10
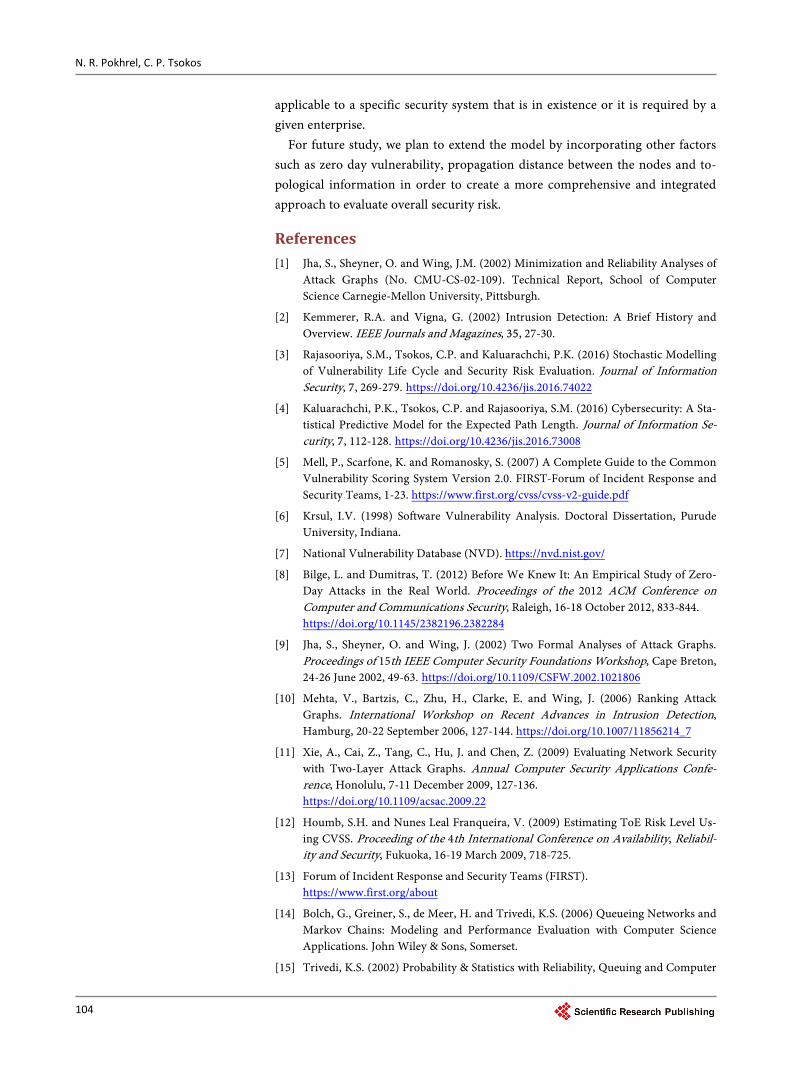
Table 3. Risk association with each node.
Node Risk
M0 0.261
M1 0.245
M2 0.262
M3 0.231
adjacency matrix are calculated using Equation (2). For example, the entry of the first row and second column is (0.5 × 10 + 0.5 × 6.4) = 8.2. This is the weighted value that the attacker uses to move from the node 0M to node 1M . The same explanation is applicable for the rest of the elements of the weighted adjacency matrix. We have used the application software package “R” for all required cal-culations.
Once we have the weighted adjacency matrix A, then we need to convert its elements into respective probabilities; thus, it requires constructing a diagonal matrix. The entries of the main diagonal are obtained by using Equation (5) as shown below.
0.05714 0 0 00 0.05405 0 00 0 0.05747 00 0 0 1
D
=
An element of the first row and the first column of the diagonal matrix is 1/(8.2 + 9.3) = 0.05714. The same idea is used to compute the rest of all the ele-ments. Utilizing weighted adjacency matrix and the diagonal matrix computed as shown above, we have obtained a transition matrix P via Equation (4), that is,
N. R. Pokhrel, C. P. Tsokos
103
0 0.46857 0.5314 00.0540 0 0.5027 0.44320.0575 0.4712 0 0.4713
1 0 0 0
P
=
Note that the extents of the first row second column is, 0.46857. It is the tran-sition probability of the attacker moving from node 0M to node 1M . As similar explanation is applicable to the rest of the entries of the transition matrix P as shown above. Now, the host access graph as shown by Figure 8, consists of four nodes including the attacker’s node. Based on our risk ranking algorithm ex-plained in Figure 6, if we have four nodes then 1/4 = 0.25 is the initial risk of each node, hence the initial risk vector, R = (0.25, 0.25, 0.25, 0.25). Finally, when the initial risk(R) and transition probability(P) are iteratively multiplied using Equation (8), convergence is achieved by using the following values as listed in Table 3.
In Table 3, four nodes 0M , 1M , 2M , and 3M are listed with their respective risk in terms of numerical value. 0M is the dummy node added to the host access graph to represent the attacker and is connected to every other nodes in the graph. An assumption of our ranking algorithm, initial risk of the all nodes are equal. Once the node is added to the graph and assigned the initial risk then it’s final risk value is computed. As long as dummy node is considered we can ignore it’s value from our analysis. Except 0M , rest of the nodes are actual nodes present in our network.
From the numerical value, we can conclude that node 2M is more risky than
1M and 3M , so the vulnerability of the file server needs to be patched first be-fore other nodes. The total sum of the risk associated with the node 1M , 2M , and 3M becomes 0.74. This value can be used as a security metric revealing the fact that this network is not very secure with respect to the given vulnerabilities and access relationship among the servers, and hence appropriate action must be implemented.
7. Conclusions
In this study, we have developed a stochastic model for cybersecurity using host access graph to determine the overall network security risk. Our model uses Markov chains in conjunction with CVSS framework to comprehend and ana-lyze the risk associated with the structure of the network. This developed model determines the critical nodes existing in the host access attack graph where the attacker is most likely to visit. Based on this information, a network administra-tor can make the appropriate decision about system patching with priorities. The risk ranking algorithm that we implemented is very flexible in a sense that we can model the attacker in terms of skills and expertise by changing the Bias fac-tor β in ExploitabilityBenefit computation. The proposed model can be ge-neralized to complicated network environment, however, the calculations are more complex but tractable. The proposed findings are based on a typical secu-rity system, however, the modeling aspect and scientific methodology is
N. R. Pokhrel, C. P. Tsokos
104
applicable to a specific security system that is in existence or it is required by a given enterprise.
For future study, we plan to extend the model by incorporating other factors such as zero day vulnerability, propagation distance between the nodes and to-pological information in order to create a more comprehensive and integrated approach to evaluate overall security risk.
References [1] Jha, S., Sheyner, O. and Wing, J.M. (2002) Minimization and Reliability Analyses of
Attack Graphs (No. CMU-CS-02-109). Technical Report, School of Computer Science Carnegie-Mellon University, Pittsburgh.
[2] Kemmerer, R.A. and Vigna, G. (2002) Intrusion Detection: A Brief History and Overview. IEEE Journals and Magazines, 35, 27-30.
[3] Rajasooriya, S.M., Tsokos, C.P. and Kaluarachchi, P.K. (2016) Stochastic Modelling of Vulnerability Life Cycle and Security Risk Evaluation. Journal of Information Security, 7, 269-279. https://doi.org/10.4236/jis.2016.74022
[4] Kaluarachchi, P.K., Tsokos, C.P. and Rajasooriya, S.M. (2016) Cybersecurity: A Sta-tistical Predictive Model for the Expected Path Length. Journal of Information Se-curity, 7, 112-128. https://doi.org/10.4236/jis.2016.73008
[5] Mell, P., Scarfone, K. and Romanosky, S. (2007) A Complete Guide to the Common Vulnerability Scoring System Version 2.0. FIRST-Forum of Incident Response and Security Teams, 1-23. https://www.first.org/cvss/cvss-v2-guide.pdf
[6] Krsul, I.V. (1998) Software Vulnerability Analysis. Doctoral Dissertation, Purude University, Indiana.
[7] National Vulnerability Database (NVD). https://nvd.nist.gov/
[8] Bilge, L. and Dumitras, T. (2012) Before We Knew It: An Empirical Study of Zero- Day Attacks in the Real World. Proceedings of the 2012 ACM Conference on Computer and Communications Security, Raleigh, 16-18 October 2012, 833-844. https://doi.org/10.1145/2382196.2382284
[9] Jha, S., Sheyner, O. and Wing, J. (2002) Two Formal Analyses of Attack Graphs. Proceedings of 15th IEEE Computer Security Foundations Workshop, Cape Breton, 24-26 June 2002, 49-63. https://doi.org/10.1109/CSFW.2002.1021806
[10] Mehta, V., Bartzis, C., Zhu, H., Clarke, E. and Wing, J. (2006) Ranking Attack Graphs. International Workshop on Recent Advances in Intrusion Detection, Hamburg, 20-22 September 2006, 127-144. https://doi.org/10.1007/11856214_7
[11] Xie, A., Cai, Z., Tang, C., Hu, J. and Chen, Z. (2009) Evaluating Network Security with Two-Layer Attack Graphs. Annual Computer Security Applications Confe-rence, Honolulu, 7-11 December 2009, 127-136. https://doi.org/10.1109/acsac.2009.22
[12] Houmb, S.H. and Nunes Leal Franqueira, V. (2009) Estimating ToE Risk Level Us-ing CVSS. Proceeding of the 4th International Conference on Availability, Reliabil-ity and Security, Fukuoka, 16-19 March 2009, 718-725.
[13] Forum of Incident Response and Security Teams (FIRST). https://www.first.org/about
[14] Bolch, G., Greiner, S., de Meer, H. and Trivedi, K.S. (2006) Queueing Networks and Markov Chains: Modeling and Performance Evaluation with Computer Science Applications. John Wiley & Sons, Somerset.
[15] Trivedi, K.S. (2002) Probability & Statistics with Reliability, Queuing and Computer
N. R. Pokhrel, C. P. Tsokos
105
Science Applications. John Wiley & Sons, New Work.
[16] Sahner, R.A., Trivedi, K. and Puliafito, A. (2012) Performance and Reliability Anal-ysis of Computer Systems: An Example-Based Approach Using the SHARPE Soft-ware Package. Springer Science & Business Media, Berlin.
[17] Abraham, S. and Nair, S. (2014) Cyber Security Analytics: A Stochastic Model for Security Quantification Using Absorbing Markov Chains. Journal of Communica-tions, 9, 899-907. https://doi.org/10.12720/jcm.9.12.899-907
[18] Lawler, G.F. (2006) Introduction to Stochastic Processes. CRC Press, Boca Raton.
[19] Sheyner, O. and Wing, J. (2003) Tools for Generating and Analyzing Attack Graphs. International Symposium on Formal Methods for Components and Objects, Leiden, 4-7 November 2003, 344-371.
[20] Hewett, R. and Kijsanayothin, P. (2008) Host-Centric Model Checking for Network Vulnerability Analysis. Computer Security Applications Conference, Washington DC, 8-12 December 2008, 225-234. https://doi.org/10.1109/acsac.2008.15
[21] Ammann, P., Pamula, J., Ritchey, R. and Street, J.D. (2005) A Host-Based Approach to Network Attack Chaining Analysis. Computer Security Applications Conference, Tucson, 5-9 December 2005, 72-84.
Nomenclature A Adjacency MatrixBEDS Backend Database ServerCVE ID Common Vulnerabilitiesand Exposures IdentifierD Diagonal MatrixEF External Firewall
−
FIRST Forum of Incident Response TeamFS File ServerI Initial RiskIDS Intrusion Detection SystemsNVD National Vulnerability DatabaseP Transition Matrix/Probability
Bias Facβ tor

Submit or recommend next manuscript to SCIRP and we will provide best service for you:
Accepting pre-submission inquiries through Email, Facebook, LinkedIn, Twitter, etc. A wide selection of journals (inclusive of 9 subjects, more than 200 journals) Providing 24-hour high-quality service User-friendly online submission system Fair and swift peer-review system Efficient typesetting and proofreading procedure Display of the result of downloads and visits, as well as the number of cited articles Maximum dissemination of your research work
Submit your manuscript at: http://papersubmission.scirp.org/ Or contact [email protected]