Embed Size (px)
Citation preview
Available online at www.sciencedirect.com
www.elsevier.com/locate/rvsc
Research in Veterinary Science 85 (2008) 80–85
Cytochrome P450 3A, NADPH cytochrome P450 reductaseand cytochrome b5 in the upper airways in horse
E. Tyden *, L. Olsen, J. Tallkvist, H. Tjalve, P. Larsson
Department of Biomedical Sciences and Veterinary Public Health, Division of Pathology, Pharmacology and Toxicology,
Swedish University of Agricultural Sciences, Box 7028, Uppsala, S-750 07, Sweden
Accepted 16 September 2007
Abstract
Gene and protein expression as well as catalytic activity of cytochrome P450 (CYP) 3A were studied in the nasal olfactory and respi-ratory mucosa and the tracheal mucosa of the horse. We also examined the activity of NADPH cytochrome P450 reductase (NADPHP450 reductase), the amount of cytochrome b5 and the total CYP content in these tissues. Comparative values for the above wereobtained using liver as a control. The CYP3A related catalytic activity in the tissues of the upper airways was considerably higher thanin the liver. The CYP3A gene and protein expression, on the other hand, was higher in the liver than in the upper airway tissues. Thus,the pattern of CYP3A metabolic activity does not correlate with the CYP3A gene and protein expression. Our results showed that theactivity of NADPH P450 reductase and the level of cytochrome b5 in the relation to the gene and protein expression of CYP3A werehigher in the tissues of the upper airways than in the liver. It is concluded that CYP3A related metabolism in horse is not solely depen-dent on the expression of the enzyme but also on adequate levels of NADPH P450 reductase and cytochrome b5.� 2007 Elsevier Ltd. All rights reserved.
Keywords: Cytochrome P450; CYP3A; Extrahepatic metabolism; Cytochrome b5; NADPH P450 reductase; Horse
1. Introduction
The cytochrome P450 (CYP) enzymes catalyze the oxi-dative biotransformation of various endogenous as wellas exogenous materials, including drugs and pesticides,food and environmental contaminants (Guengerich, 1999;Raunio et al., 2005; Rodriguez-Antona et al., 2000; Yama-zaki et al., 1996). In addition to the liver CYP-enzymes arepresent in many extrahepatic tissues, such as the mucosa ofthe intestines, trachea, bronchi and bronchioli, and theolfactory and respiratory nasal mucosa (Ding and Kamin-sky, 2003; Gonzalez, 1988).
The CYP-enzymes have mainly been studied in man andlaboratory animals, whereas little is known about the CYP-enzymes in domestic animals. In particular there are few
0034-5288/$ - see front matter � 2007 Elsevier Ltd. All rights reserved.
doi:10.1016/j.rvsc.2007.09.012
* Corresponding author. Tel.: +46 18 673171; fax: +46 18 504144.E-mail address: [email protected] (E. Tyden).
reports on the presence and catalytic activity of CYP-enzymes in extrahepatic tissues of domestic animals.
As concerns the horse, we have previously shownCYP3A4 and CYP2A6/2B6 immunoreactivity in some cellsof the nasal olfactory, nasal respiratory, tracheal, bronchialand bronchiolar mucosa (Larsson et al., 2003). In vitrometabolic experiments with microsomal preparations alsodemonstrated that these tissues have a high capacity toform tissue-bound metabolites of the mycotoxin aflatoxinB1(AFB1), which is known to be bioactivated by CYP-enzymes, including CYP3A4 and CYP2A6 (Larssonet al., 2003). In another study we have examined mRNAexpression, catalytic activity and immunohistochemicallocalization of CYP3A in the intestinal enterocytes in horse(Tyden et al., 2004). The highest levels of these parameterswere observed in the proximal parts of the intestines, withdecreasing amounts towards the distal parts of the intesti-nal tract. CYP3A is an important CYP-form with widesubstrate specificity. CYP3A-mediated metabolism in the
E. Tyden et al. / Research in Veterinary Science 85 (2008) 80–85 81
intestinal epithelial cells may reduce the amounts of drugsor chemicals available for absorption and thus limit theirpositive or negative effects.
In the present study we have examined the gene and pro-tein expression and the catalytic activity of CYP3A in thenasal olfactory and respiratory mucosa and in the trachealmucosa in horse. At these sites CYP3A may have a localfunction as a first line of defence against inhaled xenobiot-ics. CYP3A may also be important in tissue-specific bioac-tivation of xenobiotics in these tissues. In horses theolfactory and respiratory tissues may be exposed to myco-toxins and other xenobiotics via inhalation of contami-nated feed-dust particles (Burg and Shotwell, 1984;Sorenson et al., 1981) and for substances that are bioacti-vated to toxic metabolites noxious effects may then beinduced.
In this study the CYP3A related metabolism in the tis-sues of the upper airways in horse was examined usingthe selective fluorescent probe 3-(3,4-difluorobenzyloxy)-5,5-dimethyl-4-(4-methylsulfonylphenyl)-5H-furan-2-one(DFB). CYP3A has been shown to play a major role in themetabolism of DFB (Chauret et al., 1999). Thus, DFB ismainly metabolized by CYP3A4 and in addition to a lowextent by CYP3A5. The DFB-metabolizing capacity ofother CYP-isoenzymes, such as CYP1A1, CYP1A2,CYP2A6, CYP2B6, CYP2D6, CYP2E1, CYP2C8,CYP2C9 and CYP2C19, was found to be very low or unde-tectable (Chauret et al., 1999).
It is known that the provision of electrons by NADPHcytochrome P450 reductase (NADPH P450 reductase)and cytochrome b5 is rate limiting in the catalytic CYP-cycle (Nakajima et al., 2002; Schenkman and Jansson,2003; Yamazaki et al., 1996). We therefore also examinedthe activity of NADPH P450 reductase and the amountof cytochrome b5 in the upper airway tissues in horse. Inaddition we examined the total CYP content in these tis-sues. To obtain comparative data experiments were per-formed with the liver.
2. Materials and methods
2.1. Chemicals and reagents
TRIzol� reagent was obtained from Invitrogen AB,Sweden. Ribogreen and Picogreen were from MolecularProbes Inc., Eugene, OR, USA. QuantiTect� SYBR�
Green RT-PCR Kit was from Qiagen, Inc., Valencia,CA, USA. Primers were custom-synthesized by Cybergene,Huddinge, Sweden. Strataprep� PCR Purification Kit wasfrom Stratagen, La Jolla, CA, USA. 3-(3,4-difluorobenzyl-oxy)-5,5-dimethyl-4-(4-methylsulfonylphenyl)-5H-furan-2-one (DFB) and 3-hydroxy-5,5-dimethyl-4-(4-methylsulfo-nylphenyl)-5H-furan-2-one (DFH) were generous giftsfrom Merck Frosst Centre for Therapeutic Research, Que-bec, Canada. Primary rabbit anti-human CYP3A4-anti-body was obtained from Chemicon International, Inc.,Temecula, CA, USA. Recombinant human CYP3A4 pro-
tein was purchased from BD Biosciences, Inc, San Jose,CA, USA. SDS–PAGE and nitrocellulose membranes werefrom, Bio-Rad, CA, USA. ECL western blotting detectionreagents and the secondary antibody (donkey anti-rabbitIG) conjugated with horseradish peroxidase were fromAmersham Biosciences, Uppsala, Sweden. Cytochrome cReductase (NADPH) Assay Kit was from Sigma–Aldrich,Inc., Saint Louis, Missouri, USA. Complete proteaseinhibitor cocktail tablets and Titan� One Tube RT-PCRKit were from Roche Molecular Chemicals, Basel, Switzer-land. Other chemicals were obtained from regular commer-cial sources.
2.2. Animals and sample collection
Tissues from healthy Swedish standard bred trotters(n = 12) were collected at a local slaughterhouse. Thehorses were 3–9 years old and of both sexes. Sampleswere collected from nasal olfactory mucosa, nasal respi-ratory mucosa, tracheal mucosa and liver (Larssonet al., 1989). For preparation of RNA the mucosal sur-faces were scraped smoothly with a scalpel, collected inRNase free plastic tubes and snap-frozen at �78 �C inhexane and dry ice, as described previously (Tydenet al., 2004). Liver-tissue RNA was prepared in the sameway. For preparation of microsomes the various tissueswere collected in 0.9% NaCl (4 �C) before transport tothe laboratory.
2.3. RNA preparation and real-time RT-PCR
Total RNA was prepared with TRIzol according tothe manufacturer’s recommendation. The resulting RNApellet was suspended in 50 ll diethyl pyrocarbonate trea-ted-water. The RNA-purity and approximate concentra-tion were determined spectrophotometrically bymeasuring the absorbance at 260 and 280 nm after dilu-tion of the sample 1:500 in H2O. Only samples with260/280 nm ratio exceeding 1.8 were selected. Visualiza-tion of the 28 S and 18 S ribosomal RNA was used tocheck the integrity of the RNA. RNA samples wererun on an ethidium bromide-stained 1% agarose gel con-taining 18% formaldehyde at 60 V for 2 h. The RNAsamples were stored at �80 �C before use. The CYP3Asequence was quantified by real-time RT-PCR, asdescribed by Tyden et al. (2004), applying followingprimers: 5 0-CAG CCT GGT GCT CCT CTA TC-3 0 (for-ward) and 5 0-TCA ACA CCC TTA CGG TAG CC-3 0
(reverse). These primers were designed based on con-served regions of the CYP3A4 cDNA sequences fromhuman, pig and rat (Tyden et al., 2004). The length ofthe generated PCR-product was 164 bp.
The RNA samples were pretreated with DNase priorto the real-time RT-PCR reaction according to themethod of (Huang et al., 1996). The exact RNA-concen-tration was measured with Ribogreen (molecular probes)using a microplate reader (Wallac 1420 VICTOR2, soft-
82 E. Tyden et al. / Research in Veterinary Science 85 (2008) 80–85
ware version 2.0, Turku, Finland). The real-time RT-PCR reaction was carried out using the Rotor-Gene3000 (Corbett Research, Mortlake, Australia). The Onestep QuantiTect� SYBR� Green RT-PCR Kit was usedaccording to the specifications of the manufacturer.
2.4. Microsomal preparation
The mucosal surfaces of the trachea and the nasalolfactory and respiratory cavities were scraped smoothlywith a scalpel. The samples were homogenized in0.05 M Tris–HCl buffer, pH 7.4 with 0.15 M KCl. Thehomogenates were sedimented at 10,000g for 20 min at4 �C. To obtain microsomes the resulting supernatantswere centrifuged at 10,5000g for 60 min at 4 �C. Themicrosomal pellets were washed in the Tris–HCl buffer,and recentrifuged at 105,000g for 60 min at 4 �C beforeresuspension in the same buffer and storage at �70 �Cuntil used. Preparation of liver microsomes was done asdescribed above. Protein contents of the microsomes wereassayed by the method of (McKie et al., 2000).
2.5. Western blot analysis of CYP3A4
Microsomal proteins were diluted in sample loadingbuffer to a final concentration of 20 lg/50 ll for the liverand the nasal olfactory mucosa, and 100 lg/50 ll for thenasal respiratory mucosa and the tracheal mucosa.Recombinant human CYP3A4 (5 lg/50 ll) was run inparallel with the microsomes. Samples were heated for5 min at 95 �C and the microsomal proteins were sepa-rated by 10% SDS–PAGE for 1 h at 30 mA. After theseparation the proteins were transferred to nitrocellulosemembrane (0.45 lm) for 1.5 h at 400 mA. To verify aneven transfer of the proteins the membranes were stainedwith Ponceau S. The membranes were then rinsed in dis-tilled water and thereafter stored in blocking buffer (5%non-fat dry milk in 0.1% PBST) overnight at 4 �C. Thefollowing morning the membranes were rinsed for3 · 15 min in 0.1% PBST and then incubated for 1 h inroom temperature with the primary CYP3A4-antibody(1:1500). The membranes were thereafter rinsed as abovefollowed by incubation for 1 h at room temperature withthe secondary antibody, diluted 1:20,000. The membraneswere rinsed a final time as above and the proteins werevisualised with ECL Western Blotting DetectionReagents, according to manufacturer’s instruction.
2.6. CYP3A4 enzyme assay
CYP3A activity was assayed using the CYP3A specificsubstate DFB as a probe. The protocol was adopted from(Chauret et al., 1999) and modified according to (Tydenet al., 2004). In this assay DFB is metabolized to the fluo-rescent metabolite DFH by CYP3A.
2.7. Spectral measurement of total content of CYP and
cytochrome b5
Total CYP and cytochrome b5 contents were determinedspectrophotometrically according to the methods ofOmura and Sato (1964) and (Rutten et al., 1987).
2.8. NADPH P450 reductase enzyme assay
NADPH P450 reductase activity was measured inmicrosomal preparations, using cytochrome c as electronacceptor, with Cytochrome c Reductase (NADPH) AssayKit. Unit definition for this assay is that one unit willreduce 1.0 lmol of oxidized cytochrome c in the presenceof 100 lM NADPH per minute at pH 7.8, 25 �C. The assaywas performed according to the manufacturer‘s protocolbut with some adjustments. Briefly, a 96-well polystyreneplate was used and to each well 190 ll 300 mM potassiumbuffer (pH 7.8), containing 0.1 mM EDTA, 0.11 mg cyto-chrome c, 5 lg microsomal protein, 4 ll 50 mM potassiumcyanide and 20 ll NADPH (40 mg/ml) were added to reacha final volume of 224 ll. The increase of absorbance at550 nm was measured in a microplate reader every 10thsecond during 5 min at 25 �C. As a blank, microsomal pro-tein from each tissue was incubated as described above butwithout NADPH. In this assay kit the absorption coeffi-cient for cytochrome c is 21.1 mM�1 cm�1, which was cor-rected to 14.14 mM�1 cm�1for the microplate reader,which has a path length of 0.67 cm at this reaction volumein the wells.
2.9. Statistical analysis
Data are expressed as mean ± standard deviation (SD).Statistical analysis was performed using a F-test with a p-value of <0.05 considered to be statistically significant.The software was Microsoft Excel.
3. Results
3.1. Quantification of CYP3A4 gene expression
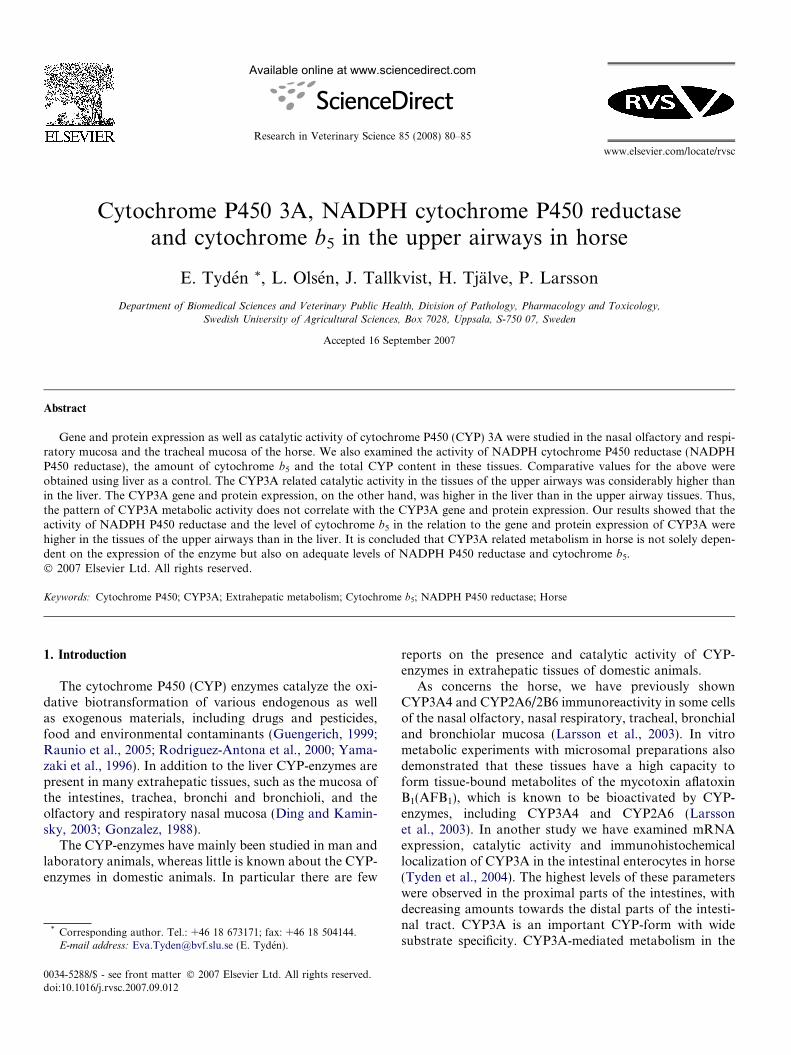
Our data indicate that the CYP3A gene expression inthe nasal olfactory mucosa is more abundant than in thenasal respiratory mucosa, whereas the level in the latter issimilar to that in the tracheal mucosa (Fig. 1a). The geneexpression in the liver was much higher compared to theother tissues. The melt curve analysis (Fig. 1a) showed thatthe real-time RT-PCR cycling generated PCR-productswith identical melts-points for all tissues, indicating thatthe PCR-products amplified are the same in the varioustissues.
3.2. Western blot
The protein expression of CYP3A showed the samequantitative pattern as observed for the CYP3A mRNA
1000
800
600
10
liver nasal nasal trachealrespiratory olfactory mucosamucosa mucosa
CY
P3A
4 ge
ne-e
xpre
ssio
n(p
g/m
g to
tal R
NA
)
*
*
Threshold50 55 60 65 70 75 80 85 90 95 deg.
3
1
0
dF/dT
2.5
1.5
0.5
-0.5
2
Fig. 1. (a) CYP3A gene expression in nasal respiratory and olfactorymucosa, tracheal mucosa and liver in horse. For each horse and tissue(n = 12) two separate real-time RT-PCR reactions were run in triplicate. Astatistical evaluation (F-test) shows that the levels in the olfactory mucosaand the liver were statistically different from the other tissues (this ismarked with * in the figure). No statistical difference was observedbetween the tracheal mucosa and the nasal respiratory mucosa. The meltcurve analysis of the RT-PCR-products is shown in the upper right corner;(b) Western blot of CYP3A in the nasal respiratory and olfactory mucosa,tracheal mucosa and liver in horse. As a control human recombinantCYP3A4 was run in parallel. A final concentration of 20 lg/50 ll for theliver and the nasal olfactory mucosa, 100 lg/50 ll for the nasal respiratorymucosa and the tracheal mucosa and 5 lg/50 ll for the recombinanthuman CYP3A4 were loaded. Legends; L, liver; R, nasal respiratorymucosa; O, nasal olfactory mucosa; Tr, tracheal mucosa; HCYP, humanrecombinant CYP3A4.
0
5
10
15
20
25
DF
H-f
orm
atio
n (n
mol
/(m
in*m
g pr
otei
n)
liver nasal nasal trachealrespiratory olfactory mucosamucosa mucosa
*
*
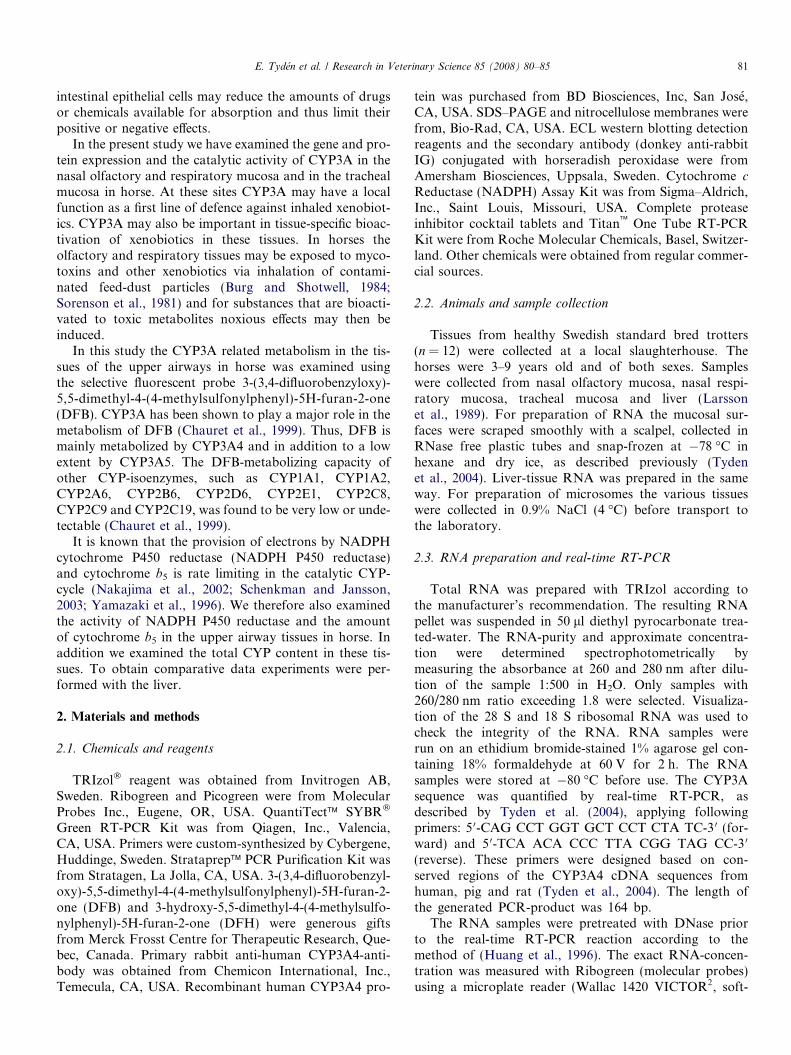
Fig. 2. CYP3A-dependent formation of DFH by microsomes of the nasalrespiratory and olfactory mucosa, tracheal mucosa and liver in horse. Foreach horse and tissue (n = 12) 3–5 separate incubations were run intriplicate. A statistical evaluation (F-test) shows that the tracheal mucosaand the liver were statistically different from the other tissues (this ismarked with * in the figure). No statistical difference was observed for thenasal olfactory mucosa or the nasal respiratory mucosa.
E. Tyden et al. / Research in Veterinary Science 85 (2008) 80–85 83
expression (Fig. 1b). Thus, the liver had highest expressionof the CYP3A protein, followed by the nasal olfactorymucosa, the nasal respiratory mucosa and the trachealmucosa. The recombinant human CYP3A4 protein, runin parallel with the examined horse tissues, showed thatthe migration distance was exactly the same as for theCYP3A protein in the horse tissues.
Table 1NADPH P450 reductase activity, contents of cytochrome b5 and totalCYP content in microsomal preparations in of the nasal respiratory andolfactory mucosa, tracheal mucosa and liver of horse (mean ± SD; n = 5)
Tissues NADPH P450reductase
Cytochromeb5 (nmol/mg
Total CYP(nmol/mg
3.3. DFB-metabolism
The rate of CYP3A-dependent DFH-formation washighest in the tracheal mucosa, followed by the nasal olfac-tory mucosa and the nasal respiratory mucosa. All thesetissues showed a higher metabolic activity compared tothe liver (Fig. 2).
(nmol/mg, min) protein) protein)
Liver 15.2 ± 4.0 0.34 ± 0.08a 0.94 ± 0.56b
Nasal respiratory mucosa 7.1 ± 2.4 0.05 ± 0.02 –Nasal olfactory mucosa 21.3 ± 10.7 0.13 ± 0.01a 0.19 ± 0.10b
Tracheal mucosa 7.9 ± 2.6 0.04 ± 0.02 0.02 ± 0.01
– Below detection limit.a Significantly different values from the other cytochrome b5 values.b Significantly different values from the total CYP values.
3.4. NADPH P450 reductase activity and cytochrome b5 and
CYP content
The highest NADPH P450 reductase activity was foundin the nasal olfactory mucosa followed by the liver, the tra-cheal mucosa and the nasal respiratory mucosa (Table 1).
The content of cytochrome b5 was highest in the liverfollowed by the nasal olfactory mucosa, the nasal respira-tory mucosa and the tracheal mucosa (Table 1).
The total amount of CYP in the nasal olfactory mucosawas about one fourth of the level found in the liver. In thetracheal mucosa the CYP content was about one tenth ofthe level in the nasal olfactory mucosa (Table 1). TheCYP-difference spectra of the nasal respiratory mucosashowed a small peak at 450 nm, but the level was too smallfor a quantitative calculation.
Estimation of the ratio between the NADPH P450reductase activity and the gene expression of CYP3Ashowed the highest value for the tracheal mucosa, followedby the nasal olfactory mucosa and the nasal respiratorymucosa. The ratio was much lower in the liver than inthe extrahepatic tissues. The ratio between NADPH P450reductase activity and the total CYP content showedthe highest value for the tracheal mucosa, followed bythe nasal olfactory mucosa and the liver. The ratio of theamount of cytochrome b5in the relation to the gene expres-

Table 2Ratios of the mean values of NADPH P450 reductase activity versus CYP3A gene expression, NADPH P450 reductase activity versus total CYP content,cytochrome b5 content versus CYP3A gene expression and cytochrome b5 content versus total P450 content in nasal respiratory and olfactory mucosa,tracheal mucosa and liver in horse
Tissues NADPH P450 reductaseactivity: CYP3A expression
NADPH P450 reductaseactivity: total CYP content
Cytochrome b5 content:CYP3A expression
Cytochrome b5 content:total CYP content
Liver 24 16 0.5 0.4Nasal respiratory mucosa 2840 – 20 –Nasal olfactory mucosa 4020 112 25 0.7Tracheal mucosa 5270 395 29 2.0
84 E. Tyden et al. / Research in Veterinary Science 85 (2008) 80–85
sion of CYP3A was higher in the tracheal mucosa, thenasal olfactory mucosa and the nasal respiratory mucosathan the liver. The ratio of cytochrome b5 content to thetotal CYP content was higher in the tracheal mucosa thanin the nasal olfactory mucosa and the liver (see Table 2).
4. Discussion
During the course of the present study the horse genomewas published. In connection to this the sequence ofthe horse CYP3A-enzyme (designated CYP3A89/NM_001101651/) was presented at the NCBI website (inAugust 2007). This enzyme is an orthologue to humanCYP3A4. By comparing our generated PCR-product withsequences at the NCBI website (using Basic Local Align-ment Search Tool/BLAST/and ClustalW/European Bioin-formatics Institute, EBI, UK/) it was found that CYP3A89produced the highest significant alignment (E-value = 7 ·10�36, at the position 159–323 of the gene).
It can be noted that when BLASTing the horseCYP3A89 sequence at the NCBI website a sequence homol-ogy of 82% was found for human CYP3A4 (NM_017460.3),84% for dog CYP3A12 (NM_001003338.1) and 82% for pigCYP3A29 (NM_214423.1). Thus, it appears that thisCYP3A-isoform is highly conserved between these mam-malian species.
Our results showed that the CYP3A related catalyticactivity in the tissues of the upper airways was considerablyhigher than in the liver. The CYP3A gene and proteinexpression, on the other hand, was found to be muchhigher in the liver than in the other tissues. It thus appearsthat the pattern of CYP3A metabolic activity does not cor-relate with the CYP3A gene and protein expression.
It is well known that NADPH P450 reductase is a nec-essary component in the monooxygenase cycle and thathigh levels of the reductase promotes the catalytic activityof CYP-enzymes by supplying electrons to the CYP-cycle(Nakajima et al., 2002; Schenkman and Jansson, 2003;Wu et al., 2005). In addition, it is known that cytochromeb5 can enhance the metabolic activity by facilitating theelectron transfer to the CYP-cycle (Nakajima et al., 2002;Yamazaki et al., 1996). Cytochrome b5 may also improvethe turnover rate of the CYP-cycle without being directlyinvolved in the electron transfer (Nakajima et al., 2002;Schenkman and Jansson, 2003; Yamazaki et al., 1996).The results of the present study show that both the activity
of NADPH P450 reductase and the amount of cytochromeb5 in the relation to the CYP3A gene and protein expres-sion and the total CYP content are higher in the extrahe-patic tissues than in the liver. These data indicate that thehigh levels of these co-factors may explain the high cata-lytic activity of CYP3A in the tissues of the upper airwaysin horse. In all instances the highest ratios were observedfor the tracheal mucosa. It is possible that this may explainwhy the highest metabolic activity was observed in thistissue.
Studies in several other species, such as cattle, sheep,swine, hamster, rat and mouse have shown high CYP-dependent bioactivation of various xenobiotics in theupper airways (Larsson et al., 1989; Marini et al., 1998;Reed et al., 1986; Tjalve, 1991). As concern hamster andcattle both the activity of NADPH P450 reductase andthe amount of cytochrome b5 in relation to the CYP con-tent were reported to be higher in the extrahepatic tissuesthan in the liver (Larsson et al., 1989; Reed et al., 1986).
Horses fed with poor quality fodder or living in bad sta-ble environments may inhale compounds, such as myco-toxins, that are bioactivated by the CYP-enzymes locatedin the upper airway tissues. Chronic obstructive pulmonarydisease (COPD) is a commonly occurring disorder in horse.The disease is considered to be related to poor quality fod-der and bedding (McPherson et al., 1979; Robinsson et al.,1995). It is possible that inhalation of xenobiotics, whichare bioactivated by CYP-enzymes in the epithelial liningsof the respiratory pathways, may play a role in the etiologyof this disease.
High levels of the carcinogenic mycotoxin AFB1, whichis bioactivated by CYP3A4 and some other CYP-enzymes,can be present in respiratory grain dust particles (Selimet al., 1998; Sorenson et al., 1981). Domestic animals,which are exposed to AFB1 via heavily contaminated feedand thus may inhale high amounts of the mycotoxin, haveshown increased incidence of tumours originating from theolfactory mucosa (Pospischil et al., 1979; Rajan et al., 1972;Sreekumaran and Rajan, 1983). There are older reports ofendemic nasal tumours in horse in Scandinavia (Head andDixon, 1999). However, in recent years nasal tumours arerelatively uncommon in horse in Western Europe (Headand Dixon, 1999). As mentioned in Section 1, AFB1 is bio-activated to a high extent in the nasal olfactory mucosa inhorse (Larsson et al., 2003). Further studies would be ofinterest to explore the possible role of bioactivation of
E. Tyden et al. / Research in Veterinary Science 85 (2008) 80–85 85
AFB1 or other carcinogenic xenobiotics in the etiology ofnasal olfactory tumours in horse.
In conclusion our results show higher catalytic activityof CYP3A in the tissues of the upper airways than in theliver in horse. In spite of that, the gene and protein expres-sion of CYP3A are higher in the liver than in the tissues ofthe upper airways. The high metabolic activity may beexplained by the finding that the activity of NADPHP450 reductase and the level of cytochrome b5 in the rela-tion to the gene and protein expression of CYP3A arehigher in the tissues of the upper airways than in the liver.
Acknowledgements
The study was supported by the Swedish ResearchCouncil for Environmental, Agricultural Sciences and Spa-tial Planning (FORMAS) and by the Swedish Foundationfor Equine Research.
References
Burg, W., Shotwell, O.L., 1984. Aflatoxin levels in airborn dust generatedfrom contaminated corn during harvest and at an elevator in 1980. J.Assoc. Off. Anal. Chem. 67, 309–312.
Chauret, N., Tremblay, N., Lackman, R.L., Gauthier, J.Y., Silva, J.M.,Marois, J., Yergey, J.A., Nicoll-Griffith, D.A., 1999. Description of a96-well plate assay to measure cytochrome P4503A inhibition inhuman liver microsomes using a selective fluorescent probe. Anal.Biochem. 276, 215–226.
Ding, X., Kaminsky, L.S., 2003. Human extrahepatic cytochromes P450:function in xenobiotic metabolism and tissue-selective chemicaltoxicity in the respiratory and gastrointestinal tracts. Ann. Rev.Pharmacol. Toxicol. 43, 149–173.
Gonzalez, F.J., 1988. The molecular biology of cytochrome P450s.Pharmacol. Rev. 40, 243–288.
Guengerich, F.P., 1999. Cytochrome P-450 3A4: regulation and role indrug metabolism. Ann. Rev. Pharmacol. Toxicol. 39, 1–17.
Head, K.W., Dixon, P.M., 1999. Equine nasal and paranasal sinustumours. Part 1: Review of the literature and tumour classification.Vet. J. 157, 261–278.
Huang, Z., Fasco, M.J., Kaminsky, L.S., 1996. Optimization of Dnase Iremoval of contaminating DNA from RNA for use in quantitativeRNA-PCR. Biotechniques 20, 1012–1020.
Larsson, P., Pettersson, H., Tjalve, H., 1989. Metabolism of aflatoxin B1in the bovine olfactory mucosa. Carcinogenesis 10, 1113–1118.
Larsson, P., Persson, E., Tyden, E., Tjalve, H., 2003. Cell-specificactivation of aflatoxin B1 correlates with presence of some cytochromeP450 enzymes in olfactory and respiratory tissues in horse. Res. Vet.Sci. 74, 227–233.
Marini, S., Longo, V., Mazzaccaro, A., Gervasi, P.G., 1998. Xenobiotic-metabolizing enzymes in pig nasal and hepatic tissues. Xenobiotica 28,923–935.
McKie, A.T., Marciani, P., Rolfs, A., Brennan, K., Wehr, K., Barrow, D.,Miret, S., Bomford, A., Peters, T.J., Farzaneh, F., Hediger, M.A.,Hentze, M.W., Simpson, R.J., 2000. A novel duodenal iron-regulatedtransporter, IREG1, implicated in the basolateral transfer of iron tothe circulation. Mol. Cell. 5, 299–309.
McPherson, E.A., Lawson, G.H., Murphy, J.R., Nicholson, J.M., Breeze,R.G., Pirie, H.M., 1979. Chronic obstructive pulmonary disease(COPD) in horses: aetiological studies: responses to intradermal andinhalation antigenic challenge. Equine Vet. J. 11, 159–166.
Nakajima, M., Tane, K., Nakamura, S., Shimada, N., Yamazaki, H.,Yokoi, T., 2002. Evaluation of approach to predict the contribution ofmultiple cytochrome P450s in drug metabolism using relative activityfactor: effects of the differences in expression levels of NADPH-cytochrome P450 reductase and cytochrome b(5) in the expressionsystem and the differences in the marker activities. J. Pharm. Sci. 91,952–963.
Omura, T., Sato, R., 1964. The carbone Monoxide-binding pigment ofliver microsomes. I. Evidence for its hemoprotein nature. J. Biol.Chem. 239, 2370–2378.
Pospischil, A., Haenichen, T., Schaeffler, H., 1979. Histological andelectron microscopic studies of endemic ethmoidal carcinomas incattle. Vet. Pathol. 16, 180–190.
Rajan, A., Sividas, C.G., Krisnan Nair, M., Maryamma, K.I., 1972.Incidence and Pathology of tumours of the paranasal sinuses indomestic animals. Kerala Journal of Veterinary Sciences 3, 89–101.
Raunio, H., Hakkola, J., Pelkonen, O., 2005. Regulation of CYP3A genesin the human respiratory tract. Chem. Biol. Interact. 151, 53–62.
Reed, C.J., Lock, E.A., De Matteis, F., 1986. NADPH: cytochrome P-450reductase in olfactory epithelium. Relevance to cytochrome P-450-dependent reactions. Biochem. J. 240, 585–592.
Robinsson, N.E., Deksen, F.J., Olszeweski, M.A., Beuchner-Maxwell,V.A., 1995. The pathogenesis of chronic pulmonary disease of horse.Brit. Vet. J. 152, 238–306.
Rodriguez-Antona, C., Jover, R., Gomez-Lechon, M.J., Castell, J.V.,2000. Quantitative RT-PCR measurement of human cytochrome P-450s: application to drug induction studies. Arch. Biochem. Biophys.376, 109–116.
Rutten, A.A., Falke, H.E., Catsburg, J.F., Topp, R., Blaauboer, B.J., vanHolsteijn, I., Doorn, L., van Leeuwen, F.X., 1987. Interlaboratorycomparison of total cytochrome P-450 and protein determinations inrat liver microsomes. Reinvestigation of assay conditions. Arch.Toxicol. 61, 27–33.
Schenkman, J.B., Jansson, I., 2003. The many roles of cytochrome b5.Pharmacol. Ther. 97, 139–152.
Selim, M.I., Juchems, A.M., Popendorf, W., 1998. Assessing airborneaflatoxin B1 during on-farm grain handling activities. Am. Ind. Hyg.Assoc. J. 59, 252–256.
Sorenson, W.G., Simpson, J.P., Peach 3rd, M.J., Thedell, T.D., Olen-chock, S.A., 1981. Aflatoxin in respirable corn dust particles. J.Toxicol. Environ. Health 7, 669–672.
Sreekumaran, T., Rajan, A., 1983. Epidemiology of ethmoid carcinoma inbovines. Indian J. Cancer 20, 5–9.
Tjalve, H., 1991. The tissue distribution and the tissue specificity ofbioactivation of some tobacco-specific and some other N-nitrosamines.Crit. Rev. Toxicol. 21, 265–294.
Tyden, E., Olsen, L., Tallkvist, J., Larsson, P., Tjalve, H., 2004. CYP3A inhorse intestines. Toxicol. Appl. Pharmacol. 201, 112–119.
Wu, L., Gu, J., Cui, H., Zhang, Q.Y., Behr, M., Fang, C., Weng, Y.,Kluetzman, K., Swiatek, P.J., Yang, W., Kaminsky, L., Ding, X.,2005. Transgenic mice with a hypomorphic NADPH-cytochrome P450reductase gene: effects on development, reproduction, and microsomalcytochrome P450. J. Pharmacol. Exp. Ther. 312, 35–43.
Yamazaki, H., Nakano, M., Imai, Y., Ueng, Y.F., Guengerich, F.P.,Shimada, T., 1996. Roles of cytochrome b5 in the oxidation oftestosterone and nifedipine by recombinant cytochrome P450 3A4 andby human liver microsomes. Arch. Biochem. Biophys. 325, 174–182.