Embed Size (px)
Citation preview
1
D2N2 COVID-19 Economic Recovery Analytical Group – Employment Risks Analysis of impact on local occupations and skills Dr Eugene Michaels, University of Derby Vladimir Epuri, D2N2 Local Enterprise Partnership Contents Key Findings ............................................................................................................................... 2
1. Introduction ........................................................................................................................ 3
2. Local occupations’ exposure to COVID-19 ......................................................................... 3
3. Local occupations suitability for remote working (teleworkability) .................................. 6
3.1 Teleworkability and local skills ..................................................................................... 9
3.2 Teleworkability and gender ........................................................................................ 10
4. Occupations at high risk in the local economy ................................................................. 11
5. Conclusions ....................................................................................................................... 18
References ............................................................................................................................... 18
2
Key Findings
• A very large majority of local occupations are susceptible to be affected by virus containment measures. Elementary, skilled trades and sales and customer service and operative occupations stand out as more at risk than others.
• We estimate that 42% of D2N2 occupations (approximatively 415 thousand
jobs) can potentially be done from home (are teleworkable).
• However, we also find that 40% of D2N2 occupations (approximatively 394 thousand jobs) are in occupations with little or no capability to be done from home - sales and customer service, skilled trades, elementary and operative occupations.
• Teleworkability varies by local authority – the share of jobs feasible to be done
via remote working ranges from 51% in Rushcliffe to 36% of jobs in Amber Valley.
• The distributions of the proportions of teleworkable jobs in the professional,
sales and customer service and skilled trades occupation groups by local authority show the largest variations within D2N2.
• Nearly 50% of all D2N2 jobs (490k jobs) are in occupations associated with
education levels below NVQ level 2 that have a below-average proportion of teleworkability.
• Within the top 50 largest occupations, to women tend to hold jobs that are not
teleworkable and that earn less than the national average.
• We estimate that at least 20% of all D2N2 jobs (152k jobs) are at high risk to be affected by pandemic containment measures, occupations that are non-essential and non-teleworkable at the same time.
• We further estimate that 88% of high-risk jobs are found in the skilled trades
occupations, elementary occupations and process, process, plant and machine operatives occupations.
• Approximatively 37% of all D2N2 jobs identified as high-risk are found in
Nottingham and Derby.
3
1. Introduction In this briefing paper we present an initial ex-ante evaluation of the impact of the COVID-19 on the D2N2 local labour market, focusing primarily on occupations and skills. The purpose of this briefing is to inform the D2N2 COVID-19 Economic Recovery Analytical Group on the level of vulnerability of the local employment to infection risk and containment measures. To this end we adopt some of the methodologies emerging from the current literature and apply them to the local employment data. On exposure to infection we follow the approach introduced Gamio (2020) and later implemented by the ONS at national level (ONS, 2020a). We use O*NET measurements on exposure and proximity based on the US Standard Occupational Classification codes (US SOC) and apply them via a crosswalk derived from Bakhshi et al. (2017). On remote working (teleworkability) we adopt the (now established) feasibility measures popularised by Dingel and Neiman (2020a) based on O*NET SOC codes and US Bureau of Labor Statistics and apply them to local UK SOC. We further match those occupations with data from the EMSI database on the education level and median wages associated with them. On the identification of the high-risk occupations we follow the approach of Sanchez et al. (2020) and use Emsi data, the ONS’s experimental development of ‘key worker’ definitions (ONS, 2020b) and the teleworkable measurements from Dingel and Neiman (2020a). The interactive data analysis tool developed for this briefing is available here.
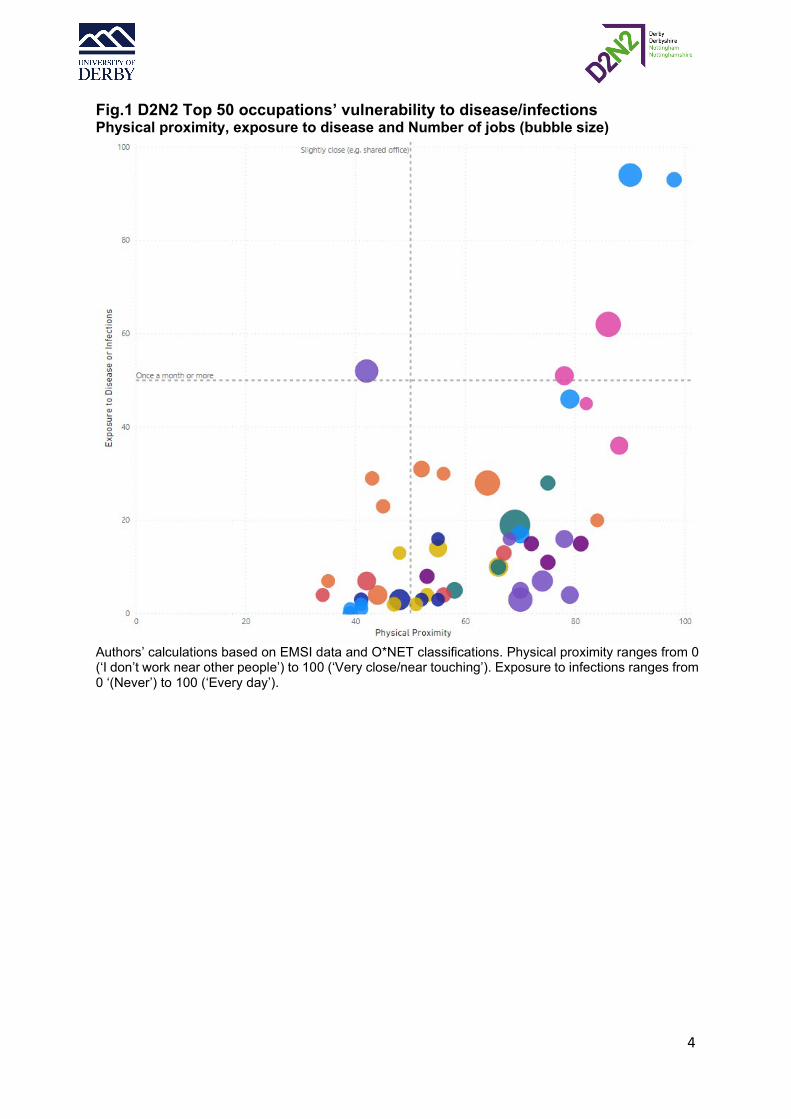
2. Local occupations’ exposure to COVID-19 We start by looking at the initial impact of the virus in terms of exposure to infection and physical proximity required for UK Standard Occupational Classifications (UK SOC). The vulnerability of certain occupations to contracting and spreading the virus makes them likely to be affected by containment measures (quarantine/lockdown and social distancing). For simplicity of illustration, Fig 1 shows the top 50 occupations in the local economy (accounting for 534 thousand jobs in the total 988 thousand in D2N2). It is clear that, while relatively few occupations are directly exposed to infection and may become a vector in spreading it (top right corner of chart – very frequent exposure and very close proximity to others), the majority of occupations in the region are vulnerable to containment measures such as lockdown and social distancing (bottom right of the chart – infrequent exposure and close to very close proximity to others). Unsurprisingly, healthcare workers (nurses, doctors, carers etc.) are most at risk to contract and spread the virus. Given their role in fighting the virus, the impact here on employment is directly in terms of sickness (and death). While there is significant variation within the major occupational groups charted, elementary, skilled trades and sales and customer service and operative occupations (more than a 1/3 of D2N2 employment) stand out as most at risk to be affected by lockdown and social distancing measures.
4
Fig.1 D2N2 Top 50 occupations’ vulnerability to disease/infections Physical proximity, exposure to disease and Number of jobs (bubble size)
Authors’ calculations based on EMSI data and O*NET classifications. Physical proximity ranges from 0 (‘I don’t work near other people’) to 100 (‘Very close/near touching’). Exposure to infections ranges from 0 ‘(Never’) to 100 (‘Every day’).
5
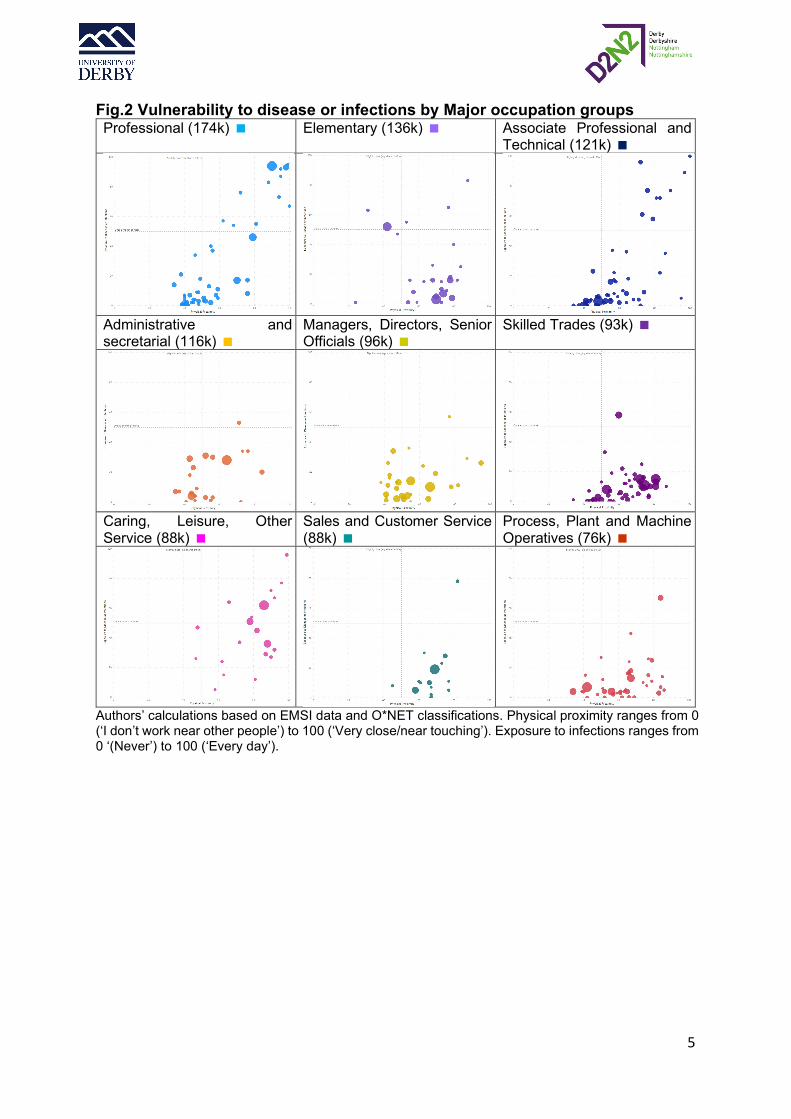
Fig.2 Vulnerability to disease or infections by Major occupation groups Professional (174k) Elementary (136k) Associate Professional and
Technical (121k)
Administrative and secretarial (116k)
Managers, Directors, Senior Officials (96k)
Skilled Trades (93k)
Caring, Leisure, Other Service (88k)
Sales and Customer Service (88k)
Process, Plant and Machine Operatives (76k)
Authors’ calculations based on EMSI data and O*NET classifications. Physical proximity ranges from 0 (‘I don’t work near other people’) to 100 (‘Very close/near touching’). Exposure to infections ranges from 0 ‘(Never’) to 100 (‘Every day’).
6
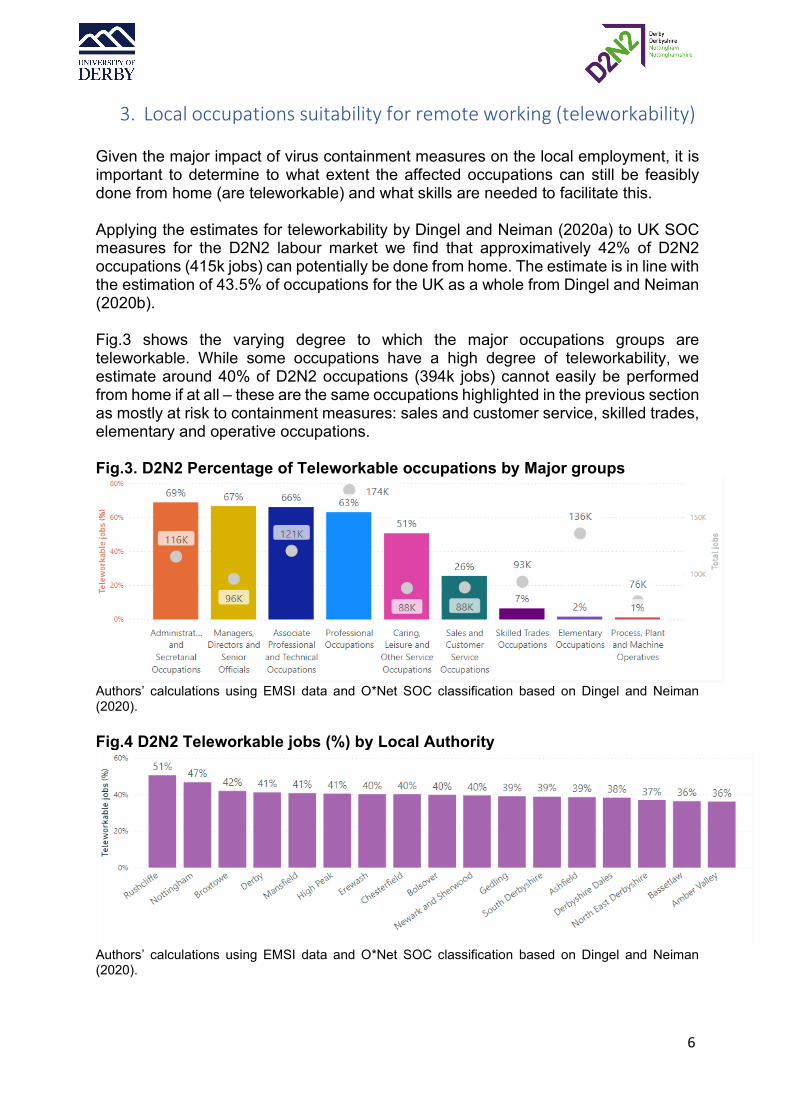
3. Local occupations suitability for remote working (teleworkability) Given the major impact of virus containment measures on the local employment, it is important to determine to what extent the affected occupations can still be feasibly done from home (are teleworkable) and what skills are needed to facilitate this. Applying the estimates for teleworkability by Dingel and Neiman (2020a) to UK SOC measures for the D2N2 labour market we find that approximatively 42% of D2N2 occupations (415k jobs) can potentially be done from home. The estimate is in line with the estimation of 43.5% of occupations for the UK as a whole from Dingel and Neiman (2020b). Fig.3 shows the varying degree to which the major occupations groups are teleworkable. While some occupations have a high degree of teleworkability, we estimate around 40% of D2N2 occupations (394k jobs) cannot easily be performed from home if at all – these are the same occupations highlighted in the previous section as mostly at risk to containment measures: sales and customer service, skilled trades, elementary and operative occupations. Fig.3. D2N2 Percentage of Teleworkable occupations by Major groups
Authors’ calculations using EMSI data and O*Net SOC classification based on Dingel and Neiman (2020). Fig.4 D2N2 Teleworkable jobs (%) by Local Authority
Authors’ calculations using EMSI data and O*Net SOC classification based on Dingel and Neiman (2020).
7
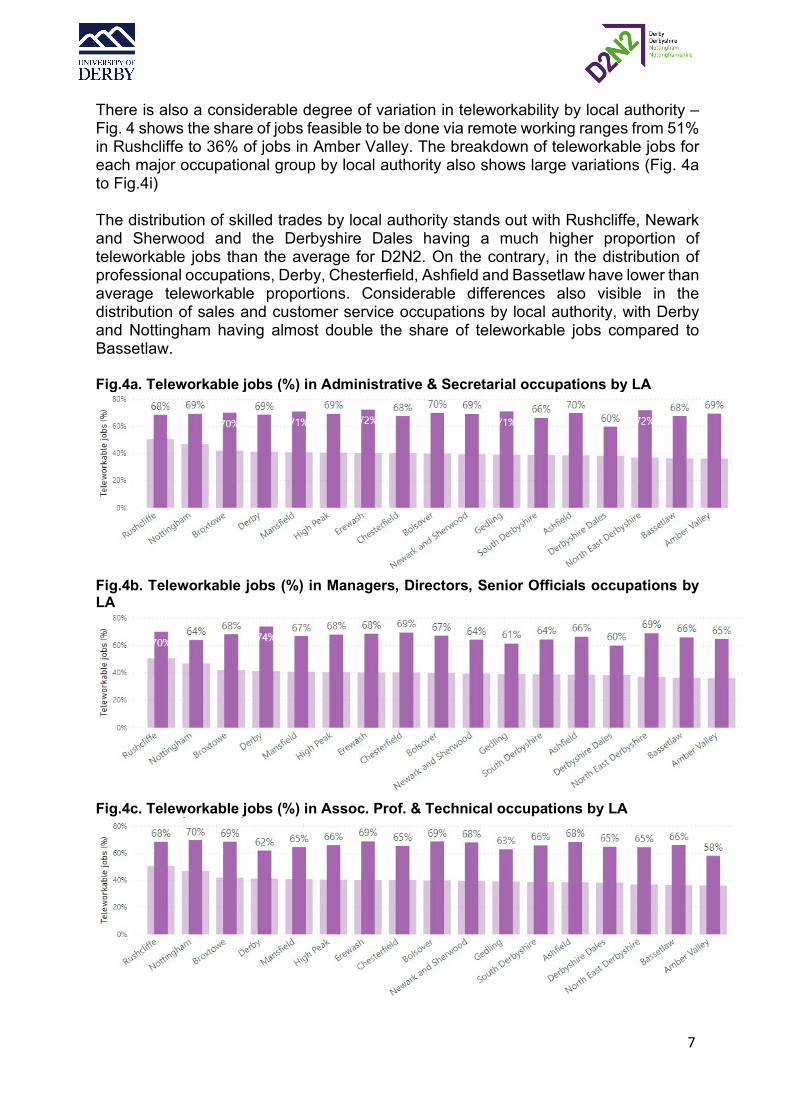
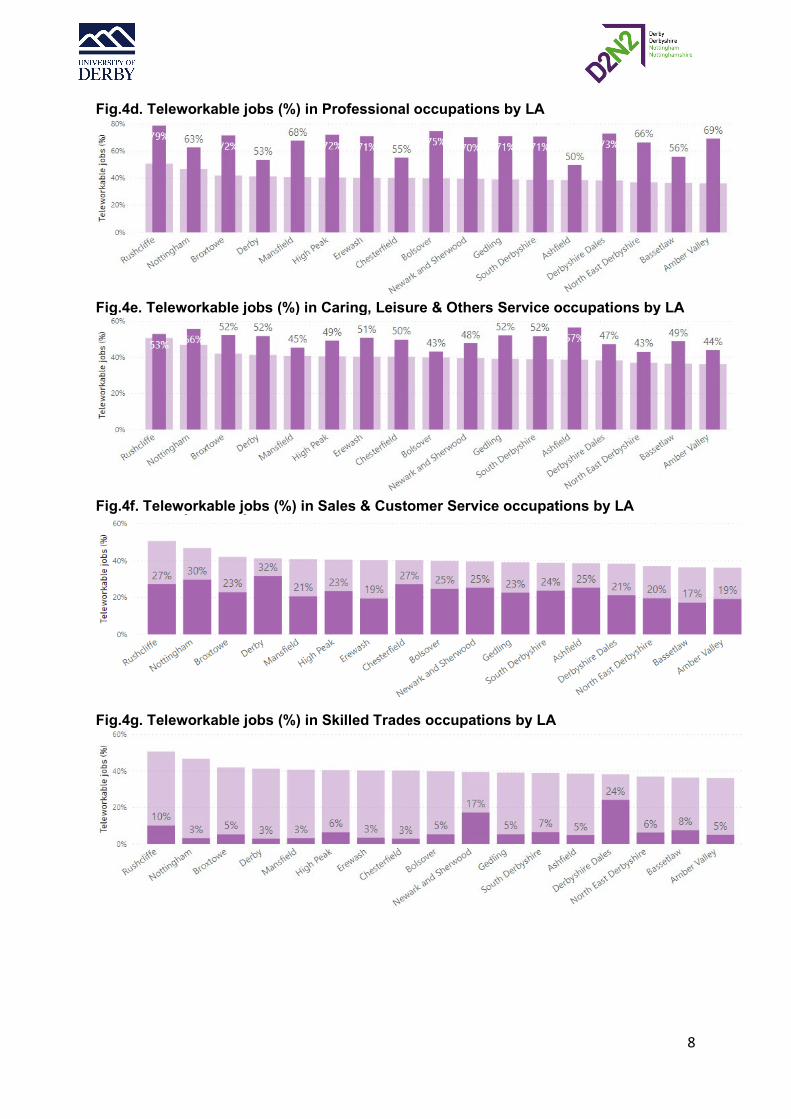
There is also a considerable degree of variation in teleworkability by local authority – Fig. 4 shows the share of jobs feasible to be done via remote working ranges from 51% in Rushcliffe to 36% of jobs in Amber Valley. The breakdown of teleworkable jobs for each major occupational group by local authority also shows large variations (Fig. 4a to Fig.4i) The distribution of skilled trades by local authority stands out with Rushcliffe, Newark and Sherwood and the Derbyshire Dales having a much higher proportion of teleworkable jobs than the average for D2N2. On the contrary, in the distribution of professional occupations, Derby, Chesterfield, Ashfield and Bassetlaw have lower than average teleworkable proportions. Considerable differences also visible in the distribution of sales and customer service occupations by local authority, with Derby and Nottingham having almost double the share of teleworkable jobs compared to Bassetlaw. Fig.4a. Teleworkable jobs (%) in Administrative & Secretarial occupations by LA
Fig.4b. Teleworkable jobs (%) in Managers, Directors, Senior Officials occupations by LA
Fig.4c. Teleworkable jobs (%) in Assoc. Prof. & Technical occupations by LA
8
Fig.4d. Teleworkable jobs (%) in Professional occupations by LA
Fig.4e. Teleworkable jobs (%) in Caring, Leisure & Others Service occupations by LA
Fig.4f. Teleworkable jobs (%) in Sales & Customer Service occupations by LA
Fig.4g. Teleworkable jobs (%) in Skilled Trades occupations by LA
9
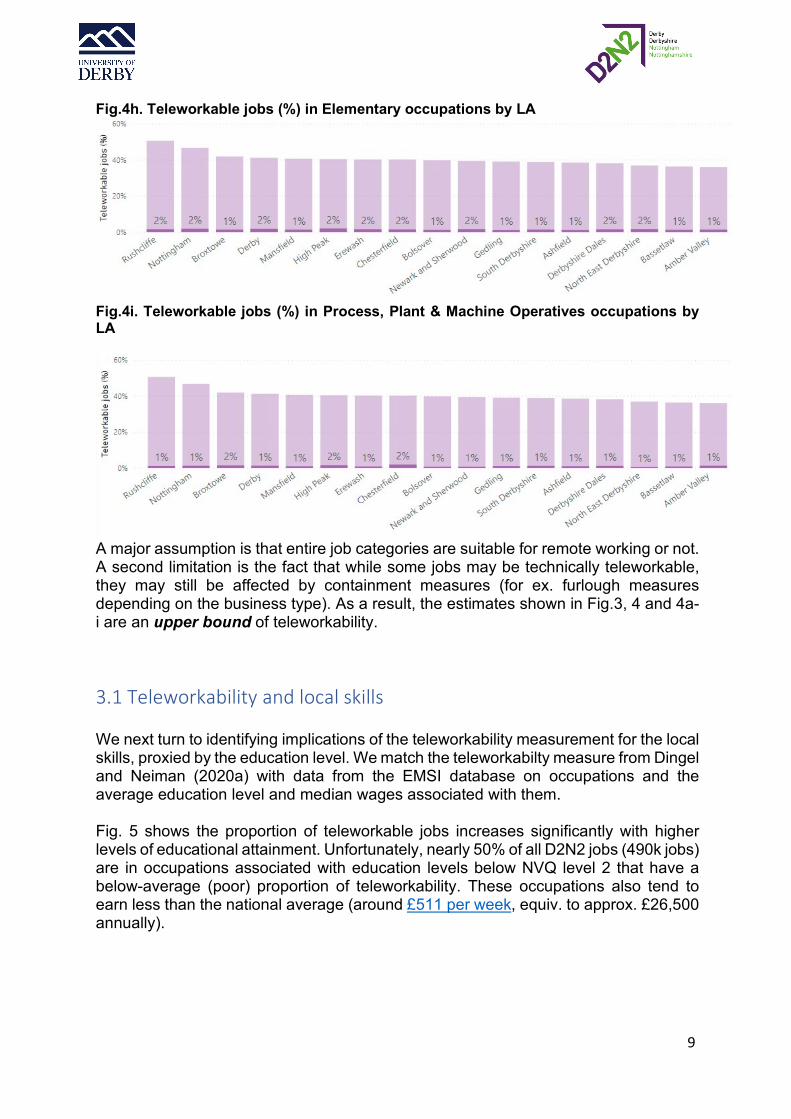
Fig.4h. Teleworkable jobs (%) in Elementary occupations by LA
Fig.4i. Teleworkable jobs (%) in Process, Plant & Machine Operatives occupations by LA
A major assumption is that entire job categories are suitable for remote working or not. A second limitation is the fact that while some jobs may be technically teleworkable, they may still be affected by containment measures (for ex. furlough measures depending on the business type). As a result, the estimates shown in Fig.3, 4 and 4a-i are an upper bound of teleworkability.
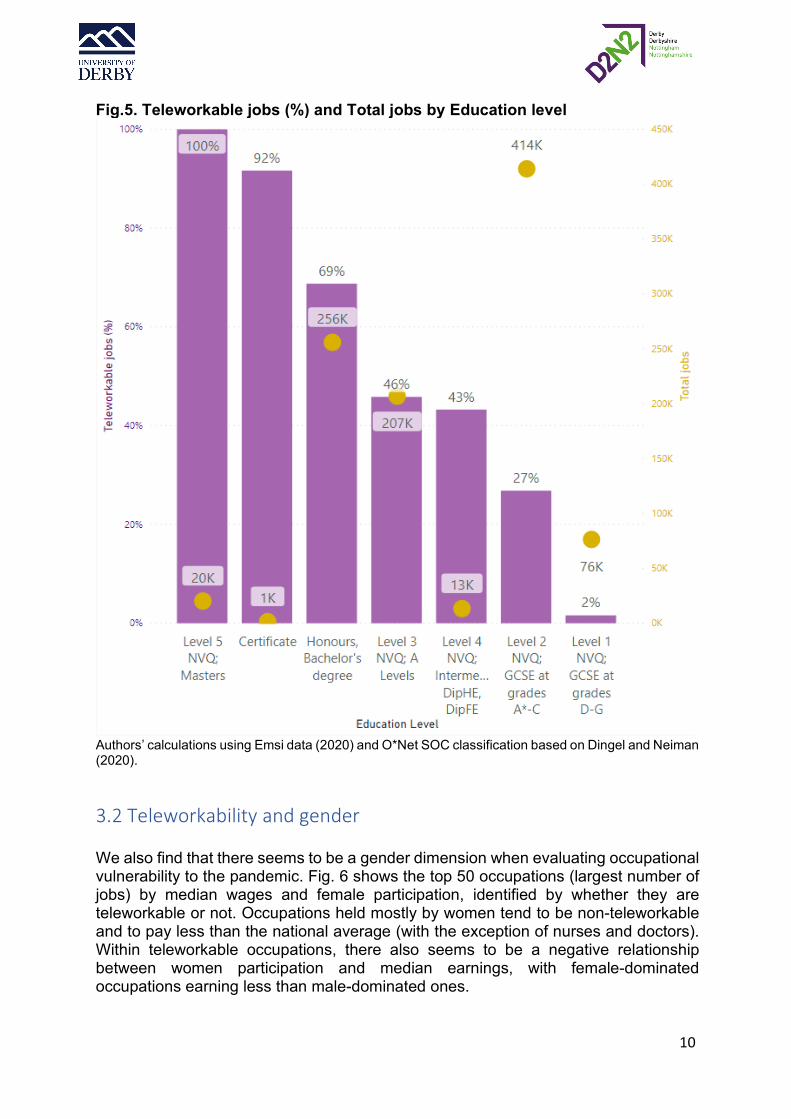
3.1 Teleworkability and local skills We next turn to identifying implications of the teleworkability measurement for the local skills, proxied by the education level. We match the teleworkabilty measure from Dingel and Neiman (2020a) with data from the EMSI database on occupations and the average education level and median wages associated with them. Fig. 5 shows the proportion of teleworkable jobs increases significantly with higher levels of educational attainment. Unfortunately, nearly 50% of all D2N2 jobs (490k jobs) are in occupations associated with education levels below NVQ level 2 that have a below-average (poor) proportion of teleworkability. These occupations also tend to earn less than the national average (around £511 per week, equiv. to approx. £26,500 annually).
10
Fig.5. Teleworkable jobs (%) and Total jobs by Education level
Authors’ calculations using Emsi data (2020) and O*Net SOC classification based on Dingel and Neiman (2020).
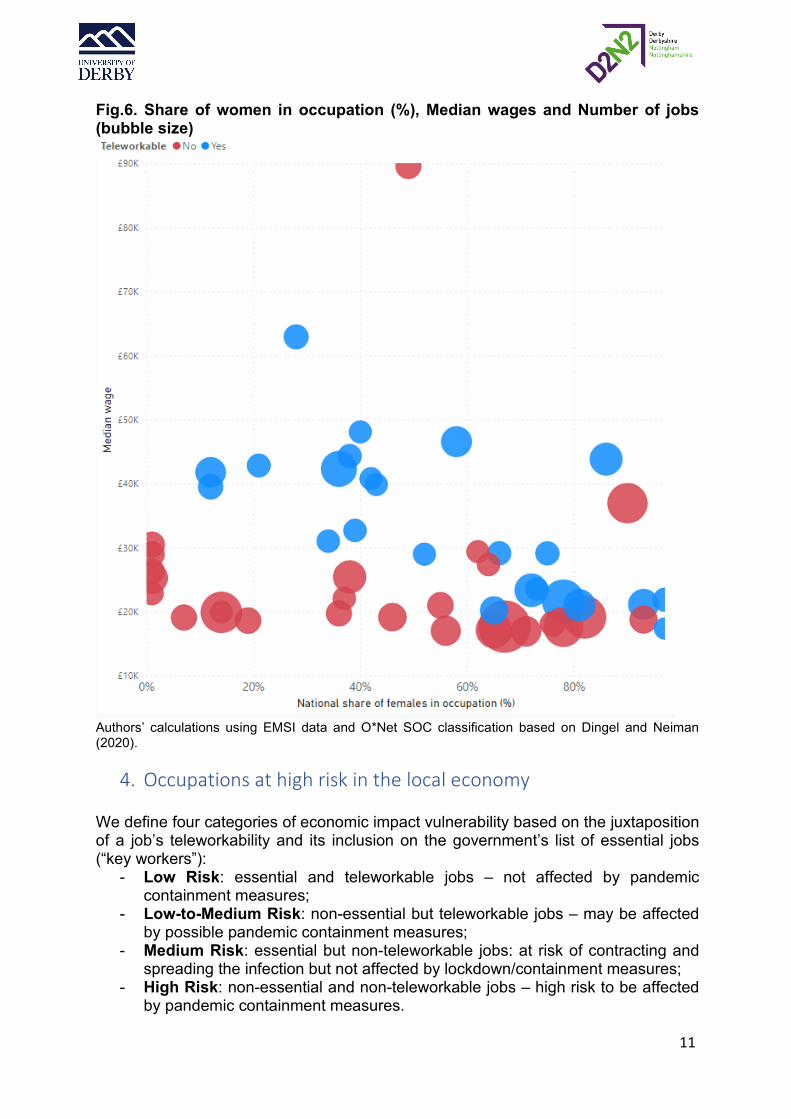
3.2 Teleworkability and gender We also find that there seems to be a gender dimension when evaluating occupational vulnerability to the pandemic. Fig. 6 shows the top 50 occupations (largest number of jobs) by median wages and female participation, identified by whether they are teleworkable or not. Occupations held mostly by women tend to be non-teleworkable and to pay less than the national average (with the exception of nurses and doctors). Within teleworkable occupations, there also seems to be a negative relationship between women participation and median earnings, with female-dominated occupations earning less than male-dominated ones.
11
Fig.6. Share of women in occupation (%), Median wages and Number of jobs (bubble size)
Authors’ calculations using EMSI data and O*Net SOC classification based on Dingel and Neiman (2020).
4. Occupations at high risk in the local economy We define four categories of economic impact vulnerability based on the juxtaposition of a job’s teleworkability and its inclusion on the government’s list of essential jobs (“key workers”):
- Low Risk: essential and teleworkable jobs – not affected by pandemic containment measures;
- Low-to-Medium Risk: non-essential but teleworkable jobs – may be affected by possible pandemic containment measures;
- Medium Risk: essential but non-teleworkable jobs: at risk of contracting and spreading the infection but not affected by lockdown/containment measures;
- High Risk: non-essential and non-teleworkable jobs – high risk to be affected by pandemic containment measures.
12
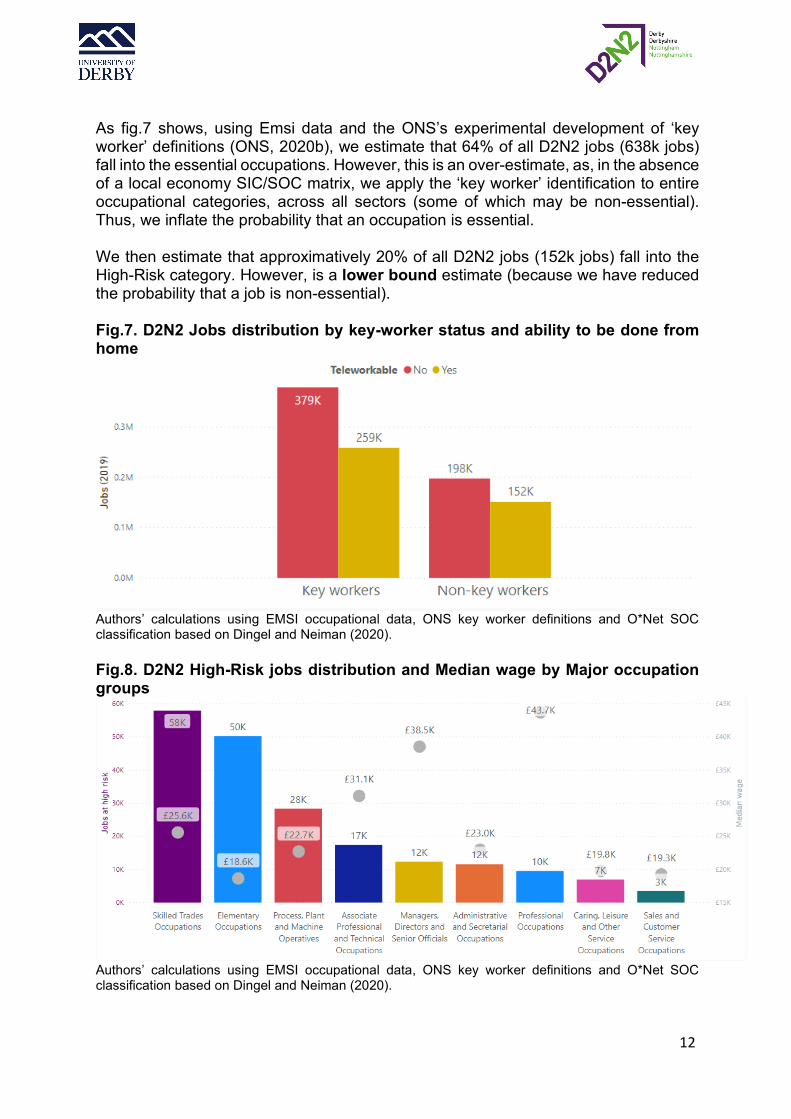
As fig.7 shows, using Emsi data and the ONS’s experimental development of ‘key worker’ definitions (ONS, 2020b), we estimate that 64% of all D2N2 jobs (638k jobs) fall into the essential occupations. However, this is an over-estimate, as, in the absence of a local economy SIC/SOC matrix, we apply the ‘key worker’ identification to entire occupational categories, across all sectors (some of which may be non-essential). Thus, we inflate the probability that an occupation is essential. We then estimate that approximatively 20% of all D2N2 jobs (152k jobs) fall into the High-Risk category. However, is a lower bound estimate (because we have reduced the probability that a job is non-essential). Fig.7. D2N2 Jobs distribution by key-worker status and ability to be done from home
Authors’ calculations using EMSI occupational data, ONS key worker definitions and O*Net SOC classification based on Dingel and Neiman (2020). Fig.8. D2N2 High-Risk jobs distribution and Median wage by Major occupation groups
Authors’ calculations using EMSI occupational data, ONS key worker definitions and O*Net SOC classification based on Dingel and Neiman (2020).
13
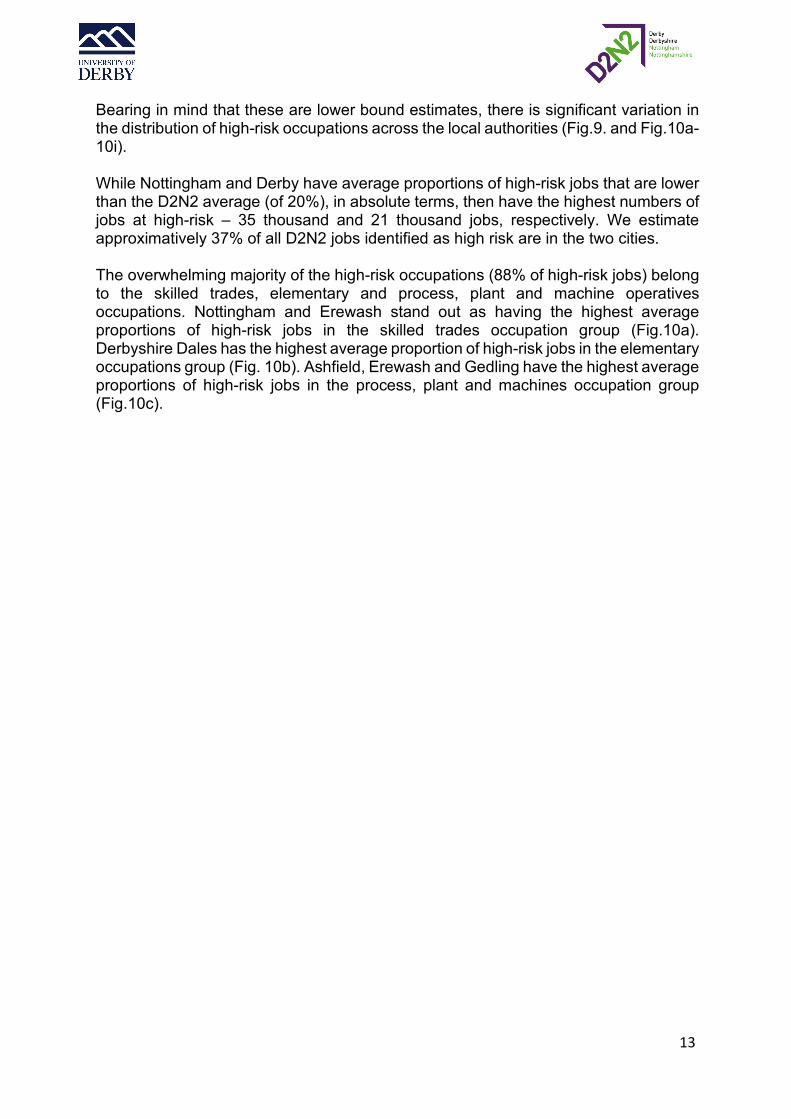
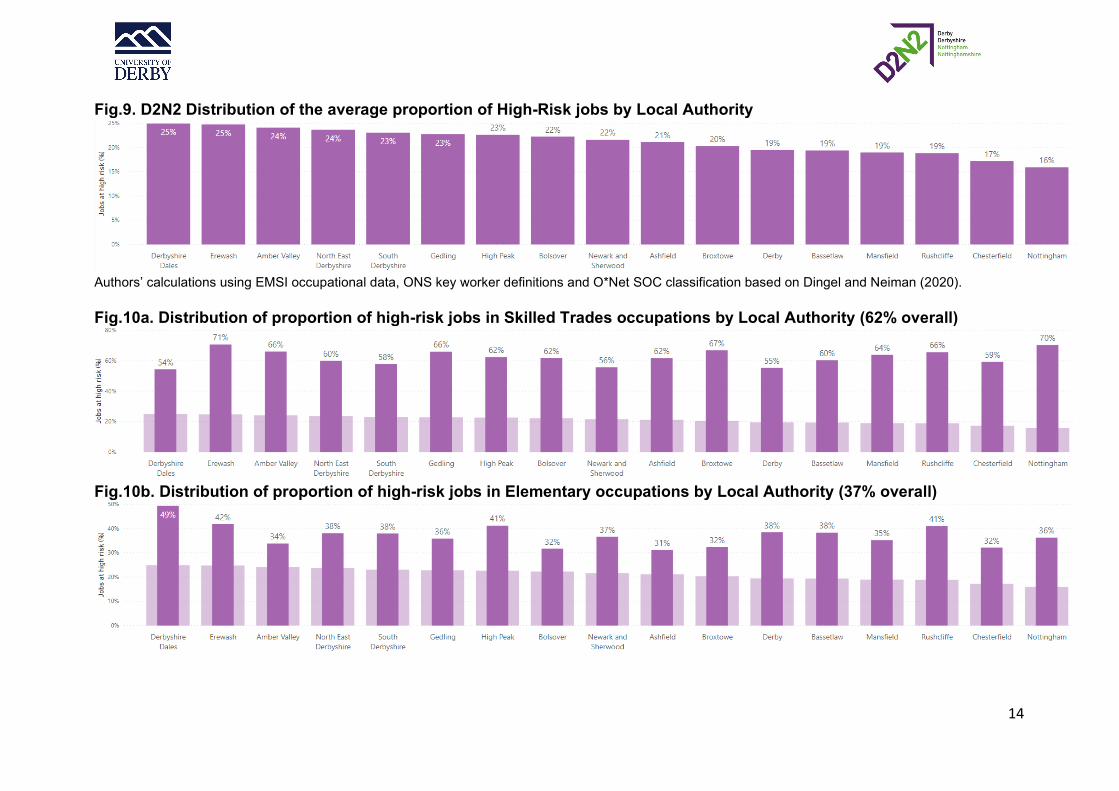
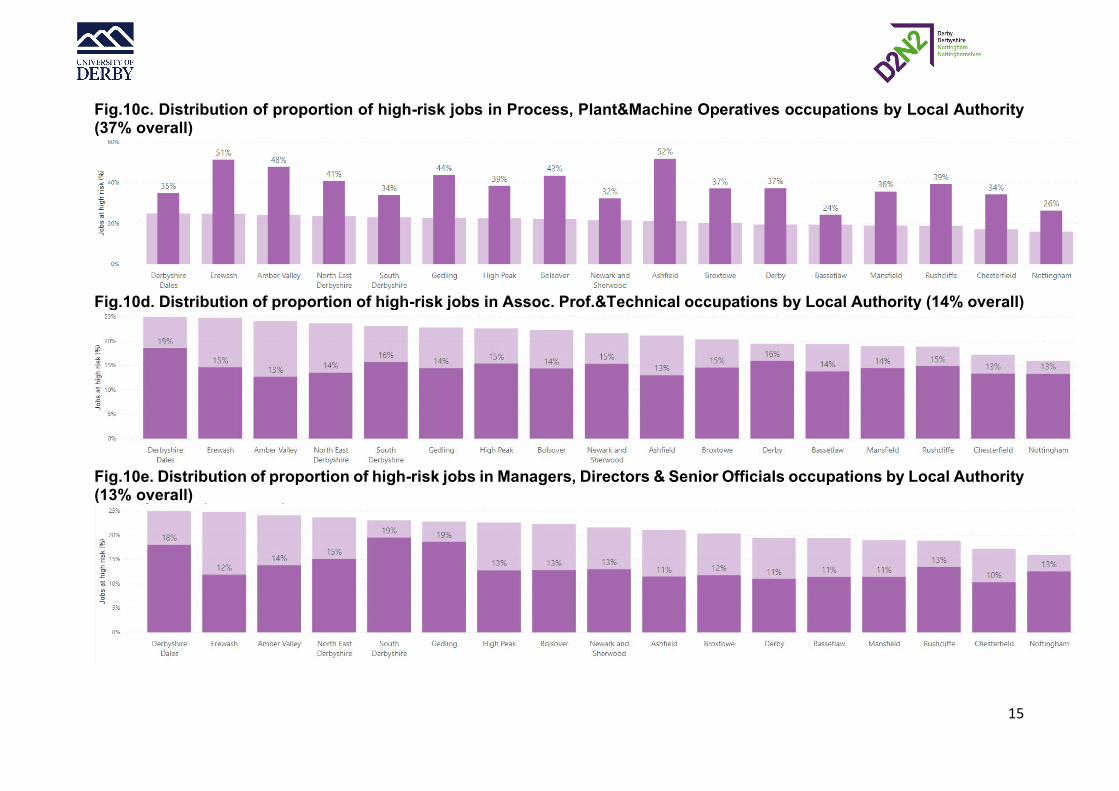
Bearing in mind that these are lower bound estimates, there is significant variation in the distribution of high-risk occupations across the local authorities (Fig.9. and Fig.10a-10i). While Nottingham and Derby have average proportions of high-risk jobs that are lower than the D2N2 average (of 20%), in absolute terms, then have the highest numbers of jobs at high-risk – 35 thousand and 21 thousand jobs, respectively. We estimate approximatively 37% of all D2N2 jobs identified as high risk are in the two cities. The overwhelming majority of the high-risk occupations (88% of high-risk jobs) belong to the skilled trades, elementary and process, plant and machine operatives occupations. Nottingham and Erewash stand out as having the highest average proportions of high-risk jobs in the skilled trades occupation group (Fig.10a). Derbyshire Dales has the highest average proportion of high-risk jobs in the elementary occupations group (Fig. 10b). Ashfield, Erewash and Gedling have the highest average proportions of high-risk jobs in the process, plant and machines occupation group (Fig.10c).
14
Fig.9. D2N2 Distribution of the average proportion of High-Risk jobs by Local Authority
Authors’ calculations using EMSI occupational data, ONS key worker definitions and O*Net SOC classification based on Dingel and Neiman (2020). Fig.10a. Distribution of proportion of high-risk jobs in Skilled Trades occupations by Local Authority (62% overall)
Fig.10b. Distribution of proportion of high-risk jobs in Elementary occupations by Local Authority (37% overall)
15
Fig.10c. Distribution of proportion of high-risk jobs in Process, Plant&Machine Operatives occupations by Local Authority (37% overall)
Fig.10d. Distribution of proportion of high-risk jobs in Assoc. Prof.&Technical occupations by Local Authority (14% overall)
Fig.10e. Distribution of proportion of high-risk jobs in Managers, Directors & Senior Officials occupations by Local Authority (13% overall)
16
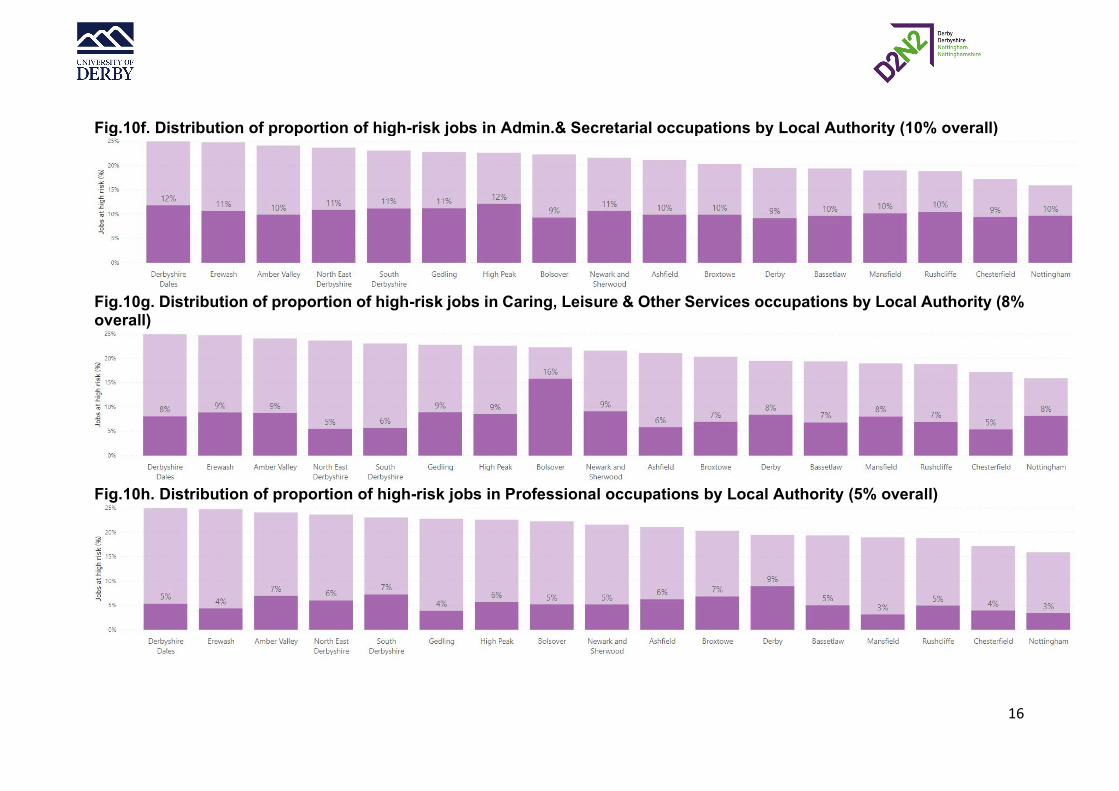
Fig.10f. Distribution of proportion of high-risk jobs in Admin.& Secretarial occupations by Local Authority (10% overall)
Fig.10g. Distribution of proportion of high-risk jobs in Caring, Leisure & Other Services occupations by Local Authority (8% overall)
Fig.10h. Distribution of proportion of high-risk jobs in Professional occupations by Local Authority (5% overall)
17
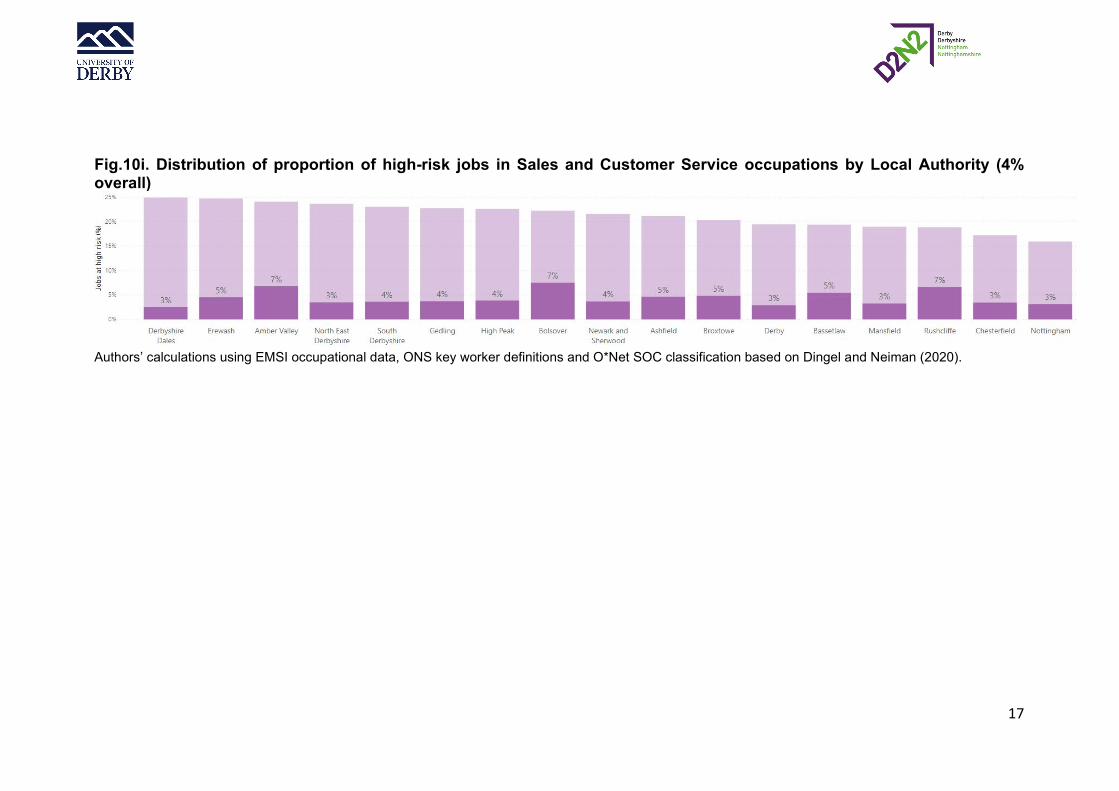
Fig.10i. Distribution of proportion of high-risk jobs in Sales and Customer Service occupations by Local Authority (4% overall)
Authors’ calculations using EMSI occupational data, ONS key worker definitions and O*Net SOC classification based on Dingel and Neiman (2020).
18
5. Conclusions This briefing paper attempts to define the varying degrees of labour market vulnerability for the local economy to COVID-19, focusing primarily on the supply side implications of the pandemic containment measures. Targeted policy responses need to be designed by taking into account the local employment vulnerabilities. However, the estimates and pattern insights should be considered with caution as they are built on a few generalising assumptions. Nevertheless, our analysis illustrates the wide variations by occupation and by local authority in our vulnerability to the pandemic and our ability to work remotely. More significantly, the paper highlights the labour market segment deemed most at risk to be economically affected by lockdown and social distancing measures.
References Bakhshi, H., Downing, J., Osborne, M. and Schneider, P. (2017) “The Future of Skills:
Employment in 2030”. London: Pearson and Nesta Dingel, J. and Neiman, B (2020a) “Which Jobs Can Be Performed from Home?” Covid
Economics. Vetted and Real-Time Papers, Issue 1, 3 April 2020, Centre for Economic Policy Research (CEPR) Press, available at https://cepr.org/file/9003/download?token=rojlyR9J
Dingel, J. and Neiman, B (2020b) “Which Jobs Can Be Performed from Home?” Becker Friedman Institute White Paper, available at https://bfi.uchicago.edu/working-paper/how-many-jobs-can-be-done-at-home/
Gamio, L. (2020) “The Workers Who Face the Greatest Coronavirus Risk”, The New York Times, 15 March 2020 available at https://www.nytimes.com/interactive/2020/03/15/business/economy/coronavirus-worker-risk.html
ONS (2020a) “Which occupations have the highest potential exposure to the coronavirus (COVID-19)?”, 11 May 2020, ONS available at https://www.ons.gov.uk/employmentandlabourmarket/peopleinwork/employmentandemployeetypes/articles/whichoccupationshavethehighestpotentialexposuretothecoronaviruscovid19/2020-05-11
ONS (2020b) “Key worker reference tables”, 15 May 2020, ONS, available at https://www.ons.gov.uk/employmentandlabourmarket/peopleinwork/earningsandworkinghours/datasets/keyworkersreferencetables
National Center for O*NET Development (2020) “O*NET 24.3 Database”,O*NET Resource Center, available at https://www.onetcenter.org/database.html
Sanchez, D.G., Parra, N.G., Ozden, C. and Rijkers, B. (2020) “Which Jobs Are Most Vulnerable to COVID-19? What an Analysis of the European Union Reveals”, Research & Policy Briefs No. 34, 11 May 2020, Washington D.C.: World Bank Group, available at http://documents.worldbank.org/curated/en/820351589209840894/pdf/Which-Jobs-Are-Most-Vulnerable-to-COVID-19-What-an-Analysis-of-the-European-Union-Reveals.pdf


![D2N2 EAFRD Presentation [Derbyshire]](https://img.pdfslide.net/doc/110x75/589ae4da1a28abee708b59c7/d2n2-eafrd-presentation-derbyshire.jpg)