Embed Size (px)
Citation preview
3. COMMODITY SNAPSHOTS
OECD-FAO AGRICULTURAL OUTLOOK 2016-2025 © OECD/FAO 2016110
DAIRY AND DAIRY PRODUCTS
Market situationInternational prices of all dairy products continued to decline from their 2013 peak, in
particular for skim milk powder (SMP) and whole milk powder (WMP). A key factor was the
decline in Chinese import demand, with demand for WMP dropping by 34% from 2014
levels. This decrease in Chinese demand for dairy products was coupled with continued
production growth between 2014 and 2015, in key export markets, with total output of
milk increasing in Australia (4%), the European Union (2%), New Zealand (5%) and
the United States (1%).
The Russian Federation’s ban on imports continues to restrict dairy trade. Russian
cheese imports dropped by 62% between 2013 and 2015, which mainly affected exports
from the European Union, the United States and Australia. Conversely, Belarus has greatly
increased cheese exports to the Russian Federation, supplementing demand there. The
ban is assumed to continue until the start of 2017; with imports of cheese expected to
increase sharply as trading resumes, mostly supplied from the European Union and
the United States, albeit at lower levels than prior to the ban.
Production in Oceania is facing challenges, low dairy prices have caused a reduction in
the total dairy herd, which dropped by 2.7% in 2015. Furthermore drought and adverse
weather conditions related to a very strong El Niño have restricted production in Oceania’s
pasture-based systems in 2016; this is expected to reduce production in New Zealand by
6.8% and to stall growth in Australia.
Previously good margins combined with the removal of the EU milk quota as of
April 2015 has promoted growth in total milk production in the European Union. This
growth, however, has been uneven across member states. For example, milk deliveries
from the 2014 to 2015 marketing year (April-March) increased by 18.5% in Ireland, 3.7% in
Germany, 2.9% in the United Kingdom, and 11.9% in the Netherlands. With increased milk
production and limited growth in domestic consumption, EU exports for all major dairy
commodities on aggregate are expected to increase by 58.5% between the 2013-15 base
years and 2025.
Projection highlightsPer capita demand for dairy products in developing countries is expected to grow
consistently over the medium-term, supported by rising incomes and lower dairy prices
relative to their 2013 peak. As seen in previous years there is a continued shift in dietary
patterns away from staples and towards animal products, due to changes in diets. Strong
consumption growth is expected across several markets in the Middle East and Asia,
including Saudi Arabia, Egypt, Iran and Indonesia, with the per capita consumption of
dairy products in developing countries growing between 0.8% and 1.7% p.a., the lowest
growth being for cheese and the highest for fresh dairy products. In addition, per capita
consumption in the developed world is expected to grow between 0.5% for fresh dairy
products and 1.1% p.a. for SMP.
3. COMMODITY SNAPSHOTS
OECD-FAO AGRICULTURAL OUTLOOK 2016-2025 © OECD/FAO 2016 111
World milk production is projected to increase by 177 Mt (23%) by 2025 compared to
the base years (2013-15), corresponding to an average grow rate of 1.8% p.a. which is below
the 2.0% p.a. witnessed in the last decade. The majority of this growth (73%) is anticipated
to come from developing countries, in particular India and Pakistan. This expansion of
production is largely in fresh dairy products, which will grow at 2.9% p.a. in developing
countries, and predominantly supply domestic markets. At the world level, production of
the main dairy products (butter, cheese, SMP and WMP) is increasing at similar pace to milk
production, albeit more slowly than that of fresh dairy products.
As a result of these demand and supply factors, nominal prices of all dairy products
are expected to increase over the medium-term, along with real prices of milk powders,
which recover from their current lows. The real prices of butter and cheese are expected to
decline slightly over the next decade, although this is from a comparatively higher base
level than for milk powders.
The strengthening of both the US Dollar and the euro will put pressure on the growth
of exports from the United States and the European Union, as they become less
competitive on the global market. Conversely, exporters in Argentina, Australia and
New Zealand are projected to become more competitive on the world market due to
relatively weaker currencies.
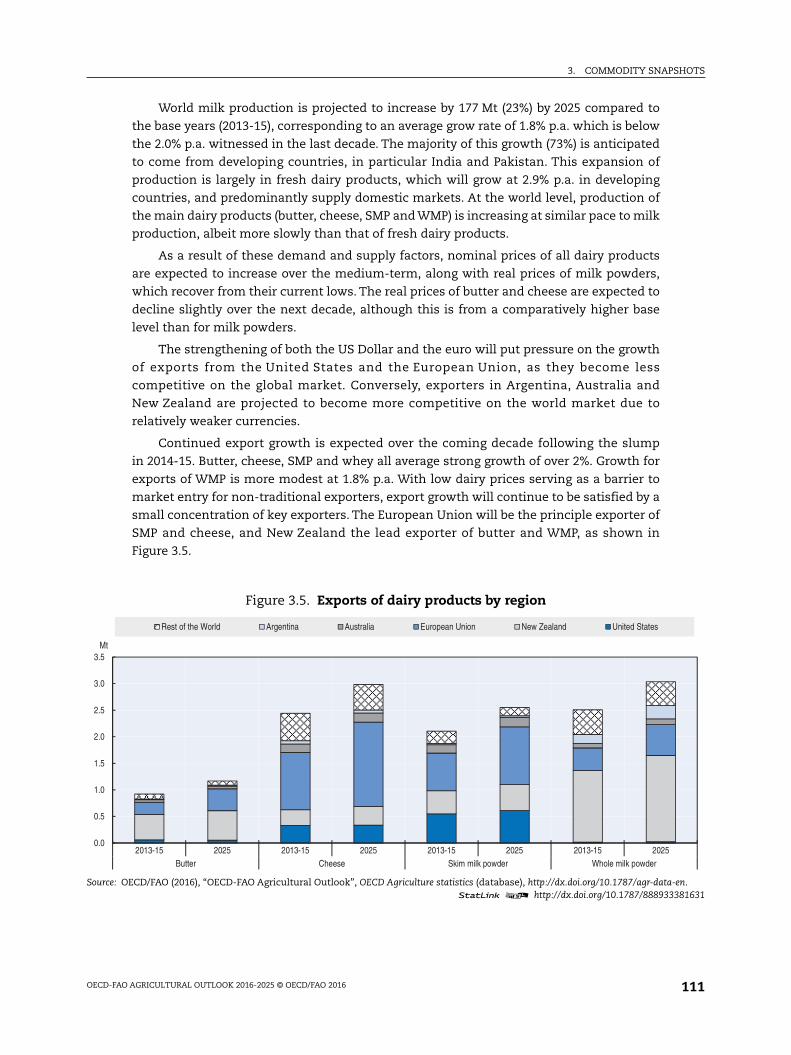
Continued export growth is expected over the coming decade following the slump
in 2014-15. Butter, cheese, SMP and whey all average strong growth of over 2%. Growth for
exports of WMP is more modest at 1.8% p.a. With low dairy prices serving as a barrier to
market entry for non-traditional exporters, export growth will continue to be satisfied by a
small concentration of key exporters. The European Union will be the principle exporter of
SMP and cheese, and New Zealand the lead exporter of butter and WMP, as shown in
Figure 3.5.
Figure 3.5. Exports of dairy products by region
Source: OECD/FAO (2016), “OECD-FAO Agricultural Outlook”, OECD Agriculture statistics (database), http://dx.doi.org/10.1787/agr-data-en.1 2 http://dx.doi.org/10.1787/888933381631
0.0
0.5
1.0
1.5
2.0
2.5
3.0
3.5
2013-15 2025 2013-15 2025 2013-15 2025 2013-15 2025Butter Cheese Skim milk powder Whole milk powder
Mt
Rest of the World Argentina Australia European Union New Zealand United States
3. COMMODITY SNAPSHOTS
OECD-FAO AGRICULTURAL OUTLOOK 2016-2025 © OECD/FAO 2016112
The global dairy commodity market is prone to disturbances from weather variability,
changes in policy, and the opening or closing of trade in key countries. Many of the
developments in the dairy market will stem from import demand in the China and how
quickly producers react to lower prices. The Outlook foresees a strengthening of demand
from developing countries and assumes that while China does not resume importing WMP
and butter at 2014 levels, instead servicing much of its demand internally, SMP and cheese
imports will increase over the outlook period.
The expanded dairy and dairy products chapter is available athttp://dx.doi.org/10.1787/agr_outlook-2016-11-en
DAIRY AND DAIRY PRODUCTS – 1
OECD-FAO AGRICULTURAL OUTLOOK 2016 © OECD/FAO 2016
DAIRY AND DAIRY PRODUCTS
Prices
Product prices of milk and dairy products declined sharply in 2014-15 due to decreased global demand and increased global production. Global demand for processed dairy products has dropped as the People’s Republic of China (hereafter “China”) has decreased its import demand, largely for whole milk powder (WMP) and skim milk powder (SMP), and the Russian Federation’s import embargo for several dairy products from major exporting countries continues. On the supply side, increases in production from key exporters have also placed downward pressure on world prices as low input prices have fuelled additional production in the United States and recent good margins, as well as the removal of milk quotas, has allowed for production growth in the European Union.
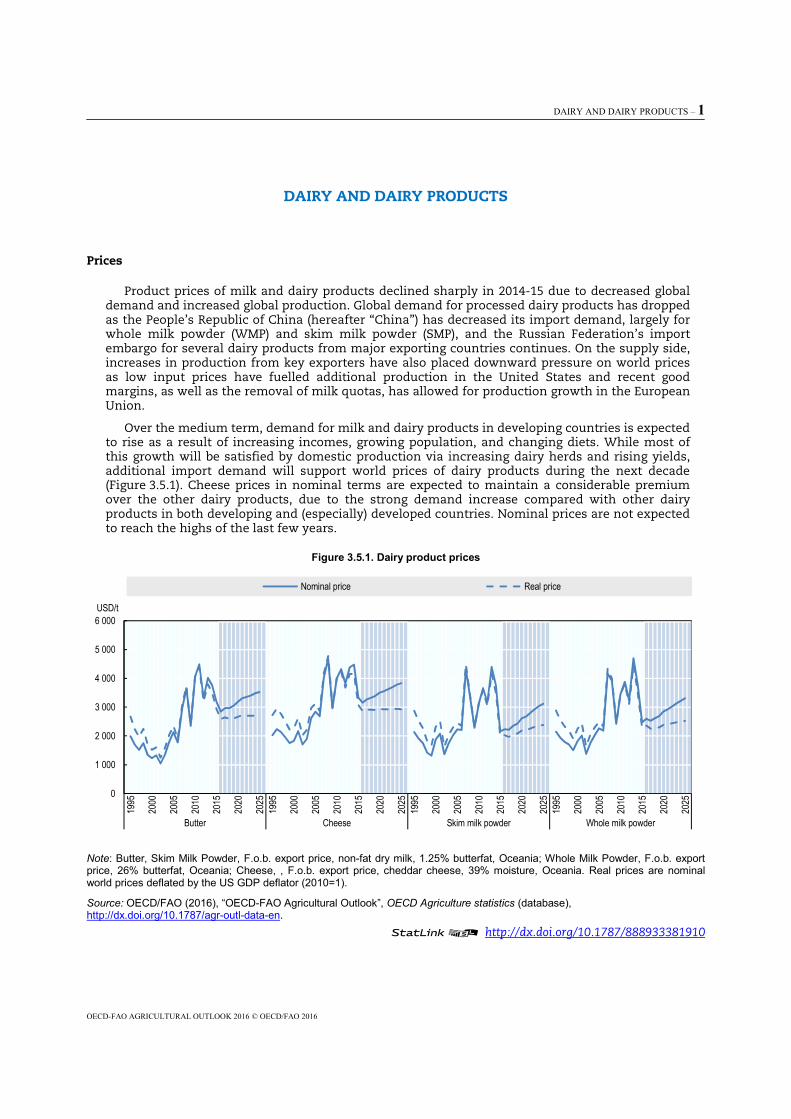
Over the medium term, demand for milk and dairy products in developing countries is expected to rise as a result of increasing incomes, growing population, and changing diets. While most of this growth will be satisfied by domestic production via increasing dairy herds and rising yields, additional import demand will support world prices of dairy products during the next decade (Figure 3.5.1). Cheese prices in nominal terms are expected to maintain a considerable premium over the other dairy products, due to the strong demand increase compared with other dairy products in both developing and (especially) developed countries. Nominal prices are not expected to reach the highs of the last few years.
Figure 3.5.1. Dairy product prices
Note: Butter, Skim Milk Powder, F.o.b. export price, non-fat dry milk, 1.25% butterfat, Oceania; Whole Milk Powder, F.o.b. export price, 26% butterfat, Oceania; Cheese, , F.o.b. export price, cheddar cheese, 39% moisture, Oceania. Real prices are nominal world prices deflated by the US GDP deflator (2010=1).
Source: OECD/FAO (2016), “OECD-FAO Agricultural Outlook”, OECD Agriculture statistics (database), http://dx.doi.org/10.1787/agr-outl-data-en.
12 http://dx.doi.org/10.1787/888933381910
0
1 000
2 000
3 000
4 000
5 000
6 000
1995
2000
2005
2010
2015
2020
2025
1995
2000
2005
2010
2015
2020
2025
1995
2000
2005
2010
2015
2020
2025
1995
2000
2005
2010
2015
2020
2025
Butter Cheese Skim milk powder Whole milk powder
USD/t
Nominal price Real price
2 – DAIRY AND DAIRY PRODUCTS
OECD-FAO AGRICULTURAL OUTLOOK 2016 © OECD/FAO 2016
Over the next ten years, it is expected that real dairy product prices will increase slightly. Nevertheless, real prices will remain below average prices of recent years, but substantially higher than in the period before 2007.
The price projections reflect the usual assumptions of stability in weather and in economic and policy conditions. Under these “normal” conditions, prices are not expected to reach the peak levels of 2007-08, 2011 or 2013. However, actual price outcomes are likely to exhibit significant variations around the projection trend.
Production
Growth in world milk production is expected to decrease slightly over the next decade, from 2.0% per annum (p.a.) to 1.8% p.a. Even with growth rates slowing down there will be a 23% increase in total milk production over the next ten years. The majority of this additional supply (73%) will come from developing countries, as a result of yield growth in yield per cow (1.4% p.a.) pushed by lower feed prices, and increasing dairy herds (1.2% p.a.). This is a change from the last decade when production grew mostly through expanding dairy herds (2.4% p.a.), while yield increased only by 0.5% p.a. Despite projected yield improvements, many developing countries’ yields are at a very low base and the absolute increase in productivity will remain small.
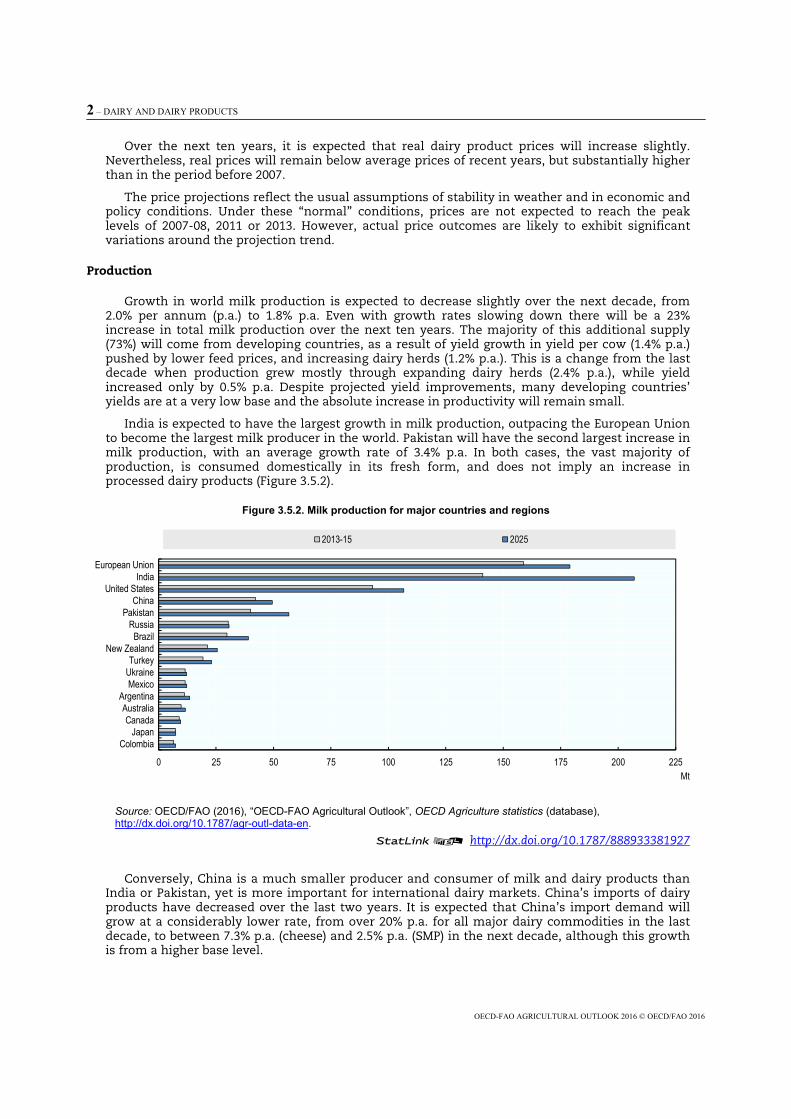
India is expected to have the largest growth in milk production, outpacing the European Union to become the largest milk producer in the world. Pakistan will have the second largest increase in milk production, with an average growth rate of 3.4% p.a. In both cases, the vast majority of production, is consumed domestically in its fresh form, and does not imply an increase in processed dairy products (Figure 3.5.2).
Figure 3.5.2. Milk production for major countries and regions
Source: OECD/FAO (2016), “OECD-FAO Agricultural Outlook”, OECD Agriculture statistics (database), http://dx.doi.org/10.1787/agr-outl-data-en.
12 http://dx.doi.org/10.1787/888933381927
Conversely, China is a much smaller producer and consumer of milk and dairy products than India or Pakistan, yet is more important for international dairy markets. China’s imports of dairy products have decreased over the last two years. It is expected that China’s import demand will grow at a considerably lower rate, from over 20% p.a. for all major dairy commodities in the last decade, to between 7.3% p.a. (cheese) and 2.5% p.a. (SMP) in the next decade, although this growth is from a higher base level.
0 25 50 75 100 125 150 175 200 225
ColombiaJapan
CanadaAustralia
ArgentinaMexico
UkraineTurkey
New ZealandBrazil
RussiaPakistan
ChinaUnited States
IndiaEuropean Union
Mt
2013-15 2025
DAIRY AND DAIRY PRODUCTS – 3
OECD-FAO AGRICULTURAL OUTLOOK 2016 © OECD/FAO 2016
Among developing countries, milk production prospects are expected to grow in across Africa, with Northern Africa, Sub-Saharan (excluding least-developed countries) and least developed countries growing respectively at 1.7% p.a., 2.6% p.a. and 2.6% p.a. However, in volume terms this increase is small when compared to the main producing countries. Elsewhere, milk production in the Middle East is constrained by climatic-conditions and water availability constraints.
In developed countries, total milk production is increasing at 1.0% p.a.; this growth is coming from yield growth (1.2% p.a.) as the total dairy herd declines (-0.25% p.a.), a continuation of the trend in the last decade of falling dairy herd size. Nevertheless, there are considerable differences between major milk producing countries and regions.
Milk output growth is expected to be constrained in New Zealand, the largest milk exporter, compared to the previous decade, with growth slowing from 5.1% p.a. to 2.1% p.a. As the majority exporter of WMP, New Zealand was particularly influenced by China’s sharp decrease in WMP imports leading to decreased producer prices. This, combined with adverse weather conditions and environmental constraints, has led to a reduced production potential. Most of the growth will come from a further increase in the dairy herd (1.6% p.a.) as the mainly pasture-based, extensive milk production system implies a continuation of low yield per dairy cow. Furthermore, due to rising prices for beef meat, non-dairy cattle will compete for land-use in the future.
Milk production in the United States is expected to increase by 1.1% p.a. during the next decade, the majority of which comes from increasing milk yields (1.1% p.a.), although there is a slight increase in the dairy herd, a change from the declines of the last decade. An important driver is strong annual production growth in SMP and butter of over 2% p.a., and 1.7% p.a. for cheese. A similar development is projected for Australia with strong yield growth at 1.4% p.a. This strong growth is based on the assumption of a further shift of dairy production to be compound feed based. Production in Australia, however, may also be limited by environmental constraints and adverse weather events.
Limited growth in European Union milk production is projected over the coming decade (0.8% p.a.) despite the end of the milk quota in 2015, in part due to declining domestic demand for fresh dairy products which counteracts increasing domestic cheese demand and increasing dairy product exports. Milk growth in expected to be uneven between member countries, leading to a concentration of production in some regions. While the growth of total milk production is slow, the growth of processed dairy products in the European Union is increasing.
The processing of milk into the four main dairy products – butter, cheese, SMP and WMP – is increasing at the world level at a fairly similar rate to milk production. The milk powders have the strongest growth, outstripping world milk production (1.8% p.a.) with annual growth of SMP at 2.0% and WMP at 2.1% p.a. Production growth of butter and cheese is slower at 1.7% p.a. and 1.4% p.a. respectively. The strong growth for SMP comes largely from increased production in the European Union (2.2% p.a.), the United States (2.4% p.a.) and India (3.5% p.a.), bolstered by strong demand in developing countries.
Consumption
The largest share of milk and dairy product consumption is in the form of fresh dairy products, taking up about 52% of the world’s total milk production. This share continues to increase to 54% over the next ten years due to raising milk production in developing countries. The total consumption of fresh dairy products in developing countries is expected to increase by 2.9% p.a. over the projection period, exceeding the growth of milk production by 0.3% p.a.
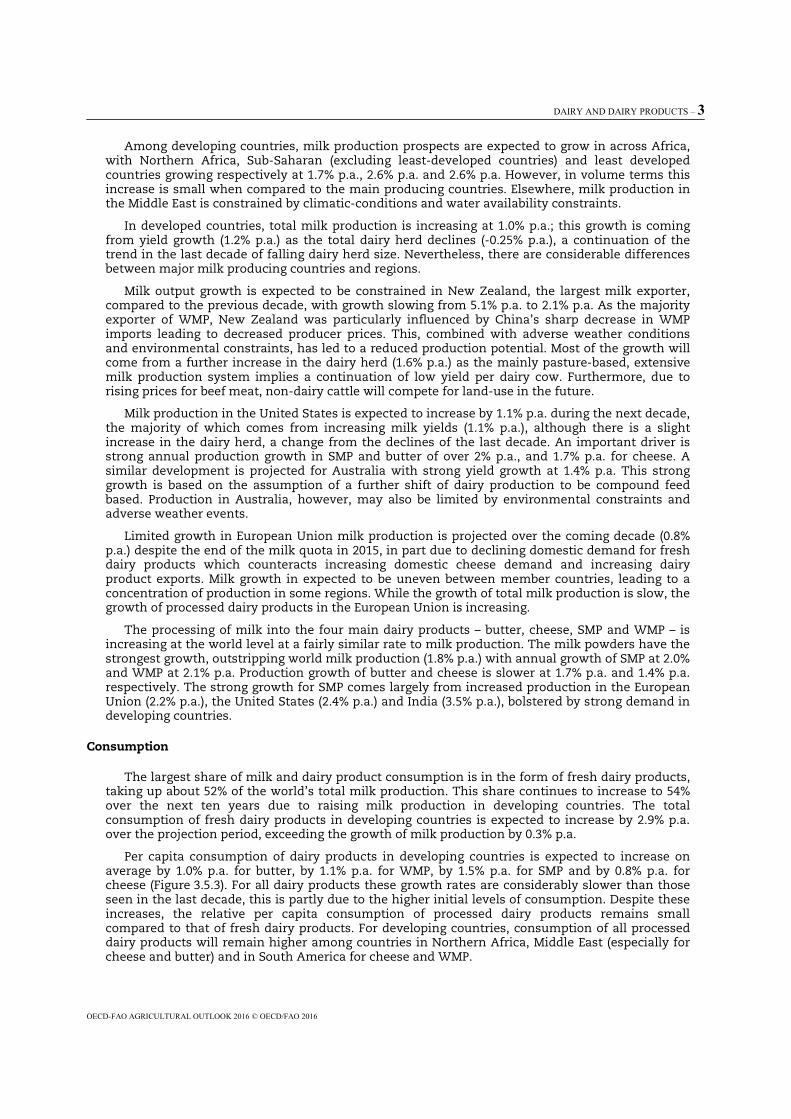
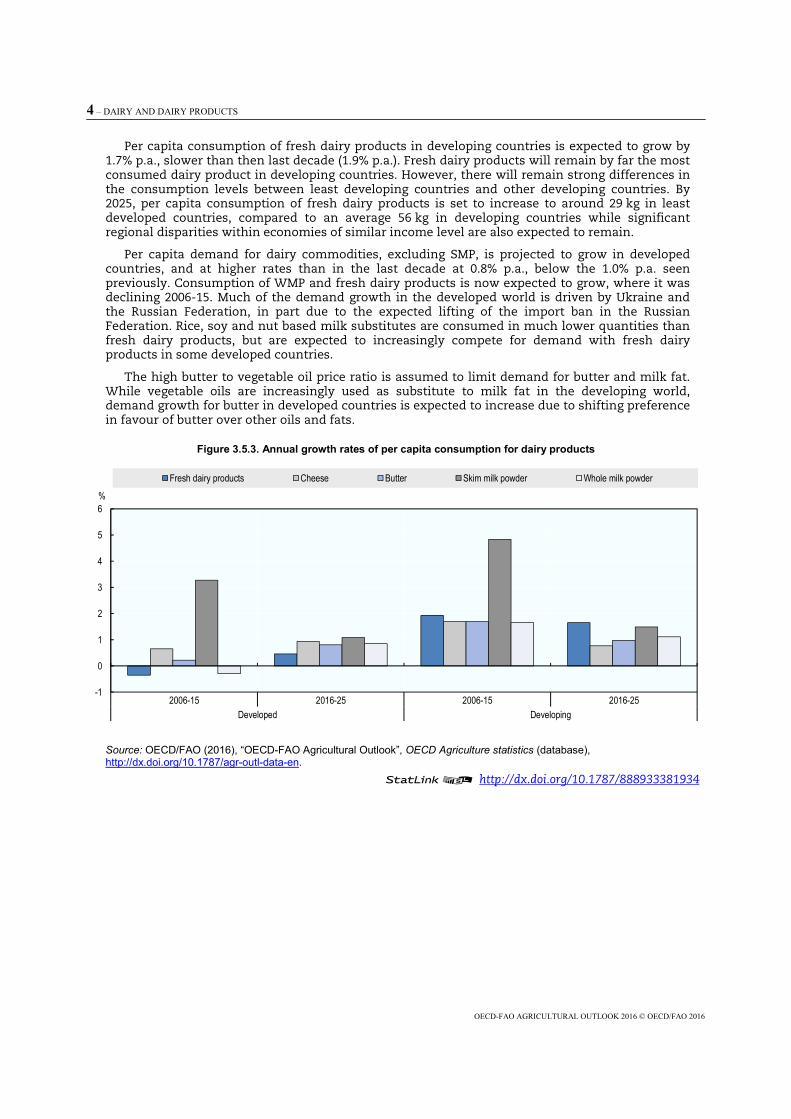
Per capita consumption of dairy products in developing countries is expected to increase on average by 1.0% p.a. for butter, by 1.1% p.a. for WMP, by 1.5% p.a. for SMP and by 0.8% p.a. for cheese (Figure 3.5.3). For all dairy products these growth rates are considerably slower than those seen in the last decade, this is partly due to the higher initial levels of consumption. Despite these increases, the relative per capita consumption of processed dairy products remains small compared to that of fresh dairy products. For developing countries, consumption of all processed dairy products will remain higher among countries in Northern Africa, Middle East (especially for cheese and butter) and in South America for cheese and WMP.
4 – DAIRY AND DAIRY PRODUCTS
OECD-FAO AGRICULTURAL OUTLOOK 2016 © OECD/FAO 2016
Per capita consumption of fresh dairy products in developing countries is expected to grow by 1.7% p.a., slower than then last decade (1.9% p.a.). Fresh dairy products will remain by far the most consumed dairy product in developing countries. However, there will remain strong differences in the consumption levels between least developing countries and other developing countries. By 2025, per capita consumption of fresh dairy products is set to increase to around 29 kg in least developed countries, compared to an average 56 kg in developing countries while significant regional disparities within economies of similar income level are also expected to remain.
Per capita demand for dairy commodities, excluding SMP, is projected to grow in developed countries, and at higher rates than in the last decade at 0.8% p.a., below the 1.0% p.a. seen previously. Consumption of WMP and fresh dairy products is now expected to grow, where it was declining 2006-15. Much of the demand growth in the developed world is driven by Ukraine and the Russian Federation, in part due to the expected lifting of the import ban in the Russian Federation. Rice, soy and nut based milk substitutes are consumed in much lower quantities than fresh dairy products, but are expected to increasingly compete for demand with fresh dairy products in some developed countries.
The high butter to vegetable oil price ratio is assumed to limit demand for butter and milk fat. While vegetable oils are increasingly used as substitute to milk fat in the developing world, demand growth for butter in developed countries is expected to increase due to shifting preference in favour of butter over other oils and fats.
Figure 3.5.3. Annual growth rates of per capita consumption for dairy products
Source: OECD/FAO (2016), “OECD-FAO Agricultural Outlook”, OECD Agriculture statistics (database), http://dx.doi.org/10.1787/agr-outl-data-en.
12 http://dx.doi.org/10.1787/888933381934
-1
0
1
2
3
4
5
6
2006-15 2016-25 2006-15 2016-25Developed Developing
%
Fresh dairy products Cheese Butter Skim milk powder Whole milk powder
DAIRY AND DAIRY PRODUCTS – 5
OECD-FAO AGRICULTURAL OUTLOOK 2016 © OECD/FAO 2016
Trade
A general expansion in dairy trade is expected over the coming decade. The growth rates differ among dairy products at 2.3% p.a. annually for butter, cheese (2.1% p.a.), SMP (2.2% p.a.) and WMP (1.8% p.a.). The bulk of this growth will be met by increased exports from the United States, European Union, New Zealand and Australia. These four will jointly account for 70% of world cheese, 75% of world WMP, 80% of world butter and 86% of world SMP exports in 2025 (Figure 3.5). Additionally, while demand for fresh dairy products is much greater than for processed products, trade is limited due to difficulties in transporting and storing fresh produce. In recent years however, trade in fresh dairy products has increased, particularly in exports from Oceania and the European Union to China.
The European Union will remain the main cheese exporter (accounting for 41% of world exports in 2025), growing at a faster pace of 5.4% p.a. than the other major cheese exporters, i.e. New Zealand (2.1% p.a.), the United States (-0.1% p.a.) and Australia (0.6% p.a.). This growth is helped by recovering a share in the Russian Federation’s import market in 2017. Several other countries like Argentina, Belarus, Egypt, Iran, Switzerland and Saudi Arabia export considerable amounts of cheese predominantly to neighbouring markets. Nevertheless, only about 11% of world cheese production is traded internationally. New Zealand remains the primary source for butter on the international market, with a 48% market share, although losing some share to the other major exporters, such as the European Union, gaining a 24% market share by 2025.
The share of world WMP and SMP production that is exported in 2025 is high at a projected 61% and 49%, respectively. In the case of WMP, it is expected that New Zealand’s share of world trade will remain stable at 54% in 2025. The United States and the European Union are the two main exporters of SMP at 24% and 36% of world exports in 2025, respectively. The main trade flow of SMP accounting for more than 90% trade is from developed to developing countries. The trade in fat-filled powders (SMP with vegetable oil) is not covered but is increasing especially from the European Union to Africa.
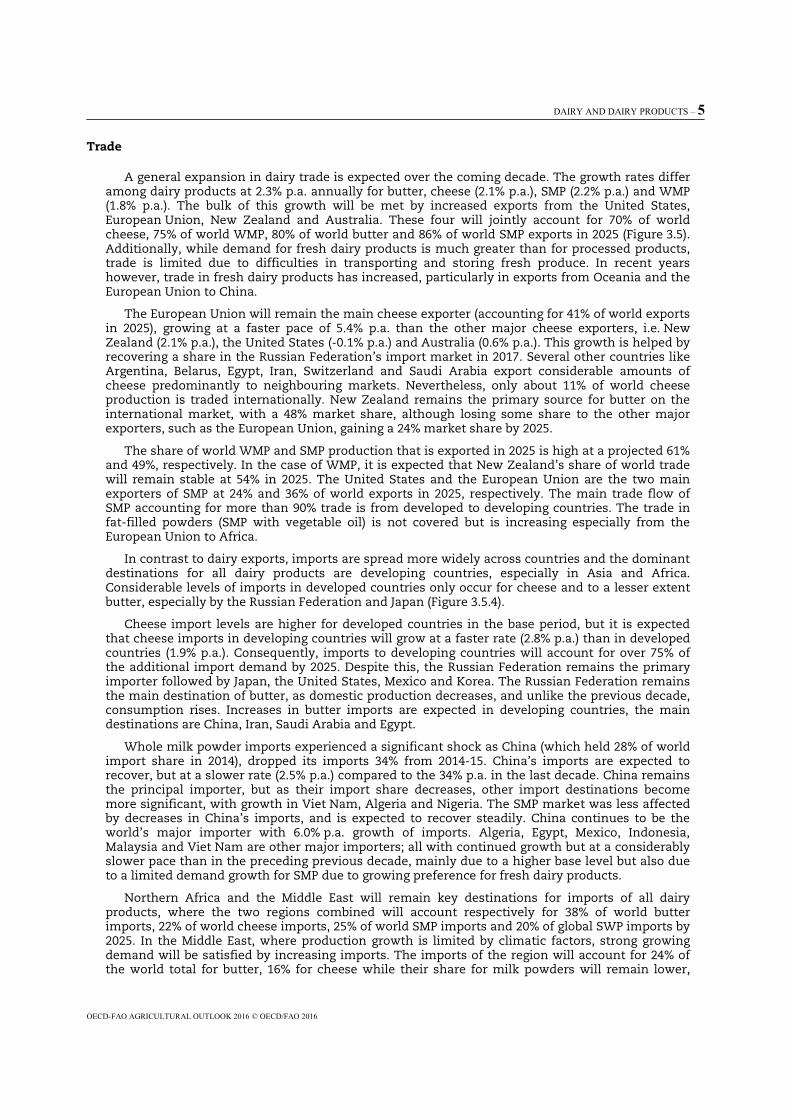
In contrast to dairy exports, imports are spread more widely across countries and the dominant destinations for all dairy products are developing countries, especially in Asia and Africa. Considerable levels of imports in developed countries only occur for cheese and to a lesser extent butter, especially by the Russian Federation and Japan (Figure 3.5.4).
Cheese import levels are higher for developed countries in the base period, but it is expected that cheese imports in developing countries will grow at a faster rate (2.8% p.a.) than in developed countries (1.9% p.a.). Consequently, imports to developing countries will account for over 75% of the additional import demand by 2025. Despite this, the Russian Federation remains the primary importer followed by Japan, the United States, Mexico and Korea. The Russian Federation remains the main destination of butter, as domestic production decreases, and unlike the previous decade, consumption rises. Increases in butter imports are expected in developing countries, the main destinations are China, Iran, Saudi Arabia and Egypt.
Whole milk powder imports experienced a significant shock as China (which held 28% of world import share in 2014), dropped its imports 34% from 2014-15. China’s imports are expected to recover, but at a slower rate (2.5% p.a.) compared to the 34% p.a. in the last decade. China remains the principal importer, but as their import share decreases, other import destinations become more significant, with growth in Viet Nam, Algeria and Nigeria. The SMP market was less affected by decreases in China’s imports, and is expected to recover steadily. China continues to be the world’s major importer with 6.0% p.a. growth of imports. Algeria, Egypt, Mexico, Indonesia, Malaysia and Viet Nam are other major importers; all with continued growth but at a considerably slower pace than in the preceding previous decade, mainly due to a higher base level but also due to a limited demand growth for SMP due to growing preference for fresh dairy products.
Northern Africa and the Middle East will remain key destinations for imports of all dairy products, where the two regions combined will account respectively for 38% of world butter imports, 22% of world cheese imports, 25% of world SMP imports and 20% of global SWP imports by 2025. In the Middle East, where production growth is limited by climatic factors, strong growing demand will be satisfied by increasing imports. The imports of the region will account for 24% of the world total for butter, 16% for cheese while their share for milk powders will remain lower,
6 – DAIRY AND DAIRY PRODUCTS
OECD-FAO AGRICULTURAL OUTLOOK 2016 © OECD/FAO 2016
with SMP and WMP accounting respectively for 7% and 13% of the world total. Within the region, Egypt is projected to increase imports for all dairy commodities, in particular for butter; the country is projected to become one of the major importers of butter, increasing its import share to 10% by 2025. Conversely in Northern Africa, some countries are encouraging milk production in order to satisfy domestic demand; Algeria, which remains a large importer of milk powders, taking between 7-10% of world imports, is moving toward self-sufficiency.
Figure 3.5.4. Dairy product imports of major countries and regions
Source: OECD/FAO (2016), “OECD-FAO Agricultural Outlook”, OECD Agriculture statistics (database), http://dx.doi.org/10.1787/agr-outl-data-en.
12 http://dx.doi.org/10.1787/888933381941
Main issues and uncertainties
China’s role as a key importer of many traded dairy products is a key uncertainty in the future developments of world dairy markets. China’s domestic milk production has continued to increase, along with investments in processing capabilities. If China resumes imports at 2014 levels, this would have a significant impact on the markets for milk powders. On the other hand, China could become further self-sufficient, supplying much of its demand for dairy products domestically, although current low prices do reduce the attractiveness of investments in dairy processing.
End March 2015, the European Union system of milk quotas ended. Total milk production has increased in some member states, most notably Germany, Ireland, the Netherlands and the United Kingdom. The end of milk quotas will lead to a concentration of production in the European Union after an adjustment period as production align more closely to the world market. However this has occurred simultaneously with low global milk prices, which may put additional pressures on producers, leading to a more severe transition in some countries. EU milk production is expected to be increasingly tied to developments in the world market.
Dairy demand and export opportunities could also be affected by the outcome of various free trade agreements (FTA) and regional trade agreements (RTA) currently under discussion. In particular the Trans-Pacific Partnership, while not predicted to largely reduce trade barriers for dairy commodities, does includes several major dairy exporting countries, and could consolidate regional trade flows, potentially diverting trade from other regions. On the other hand, the cessation of the Russian Federation embargo on several dairy products from major exporting countries is expected to end in 2017. The continuation of the ban could affect trade flows and international dairy prices, in particular the market for cheese. Additionally, the recent lift of the
0.0
0.5
1.0
1.5
2.0
2.5
2013-15 2025 2013-15 2025 2013-15 2025 2013-15 2025Butter Cheese Skim milk powder Whole milk powder
Mt
North Africa Russia South East Asia China Japan Mexico Near East
DAIRY AND DAIRY PRODUCTS – 7
OECD-FAO AGRICULTURAL OUTLOOK 2016 © OECD/FAO 2016
economic sanctions in Iran could translate into different trade scenarios; while some markets have been stable for many years, other sectors that have been policy driven could expand.
As seen in recent years, unusual weather events, such as the particular strong 2014-15 El Niño, can have a major impact on dairy markets through their impact on feed grains or pasture conditions. The Outlook assumes normal weather conditions from 2016 onwards. However, as climate change models increasingly predict an increase in the incidence and severity of extreme weather events, the probability of abnormal conditions may be increasing. Producers in Oceania are particularly weather dependent due to their predominantly pasture-based production.
Environmental legislation can have strong impacts on the future development of dairy production. The greenhouse-gas emissions from dairy activities make up a considerable share of the total emissions in some countries, and any changes in related policies could affect dairy production. Water access and manure management are additional areas where policy changes could have an impact on the dairy industry. It is also assumed that no major outbreaks of animal diseases occur during the outlook period, which could rapidly alter the setting.
ANNEX: COMMODITY SNAPSHOT TABLES
OECD-FAO AGRICULTURAL OUTLOOK 2016-2025 © OECD/FAO 2016128
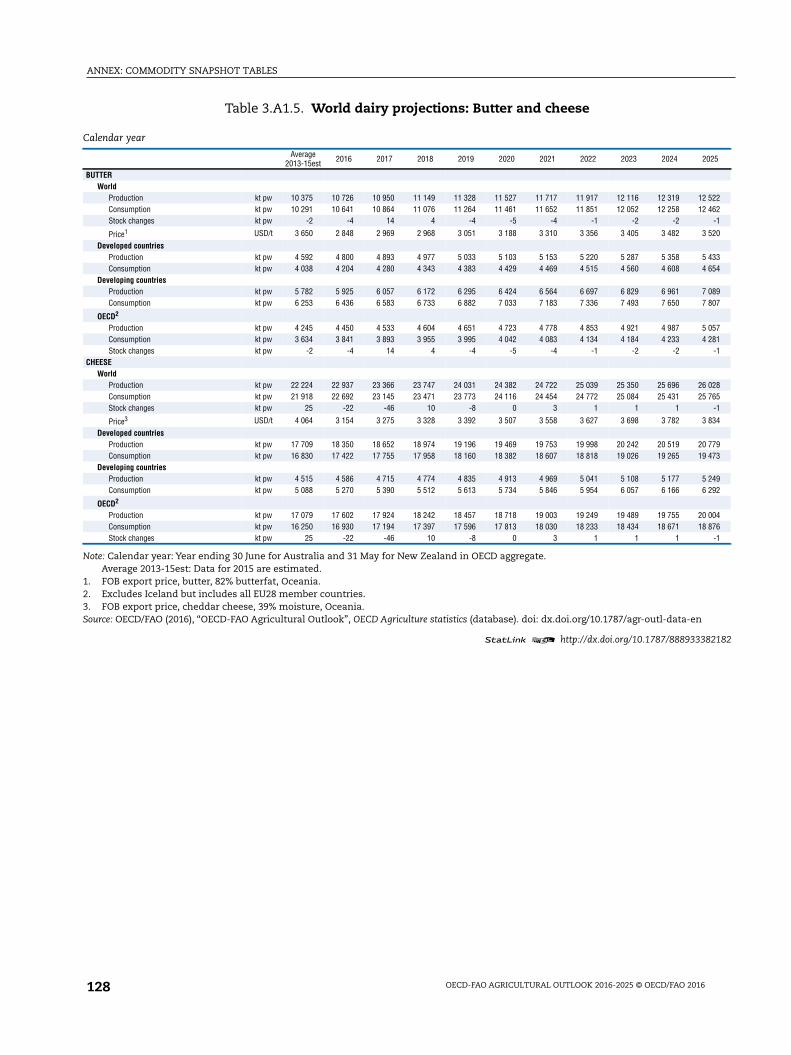
Table 3.A1.5. World dairy projections: Butter and cheese
1 2 http://dx.doi.org/10.1787/888933382182
Note: Calendar year: Year ending 30 June for Australia and 31 May for New Zealand in OECD aggregate.Average 2013-15est: Data for 2015 are estimated.
1. FOB export price, butter, 82% butterfat, Oceania.2. Excludes Iceland but includes all EU28 member countries.3. FOB export price, cheddar cheese, 39% moisture, Oceania.Source: OECD/FAO (2016), “OECD-FAO Agricultural Outlook”, OECD Agriculture statistics (database). doi: dx.doi.org/10.1787/agr-outl-data-en
Calendar year
Average2013-15est 2016 2017 2018 2019 2020 2021 2022 2023 2024 2025
BUTTERWorld
Production kt pw 10 375 10 726 10 950 11 149 11 328 11 527 11 717 11 917 12 116 12 319 12 522Consumption kt pw 10 291 10 641 10 864 11 076 11 264 11 461 11 652 11 851 12 052 12 258 12 462Stock changes kt pw -2 -4 14 4 -4 -5 -4 -1 -2 -2 -1
Price1 USD/t 3 650 2 848 2 969 2 968 3 051 3 188 3 310 3 356 3 405 3 482 3 520
Developed countriesProduction kt pw 4 592 4 800 4 893 4 977 5 033 5 103 5 153 5 220 5 287 5 358 5 433Consumption kt pw 4 038 4 204 4 280 4 343 4 383 4 429 4 469 4 515 4 560 4 608 4 654
Developing countriesProduction kt pw 5 782 5 925 6 057 6 172 6 295 6 424 6 564 6 697 6 829 6 961 7 089Consumption kt pw 6 253 6 436 6 583 6 733 6 882 7 033 7 183 7 336 7 493 7 650 7 807
OECD2
Production kt pw 4 245 4 450 4 533 4 604 4 651 4 723 4 778 4 853 4 921 4 987 5 057Consumption kt pw 3 634 3 841 3 893 3 955 3 995 4 042 4 083 4 134 4 184 4 233 4 281Stock changes kt pw -2 -4 14 4 -4 -5 -4 -1 -2 -2 -1
CHEESEWorld
Production kt pw 22 224 22 937 23 366 23 747 24 031 24 382 24 722 25 039 25 350 25 696 26 028Consumption kt pw 21 918 22 692 23 145 23 471 23 773 24 116 24 454 24 772 25 084 25 431 25 765Stock changes kt pw 25 -22 -46 10 -8 0 3 1 1 1 -1
Price3 USD/t 4 064 3 154 3 275 3 328 3 392 3 507 3 558 3 627 3 698 3 782 3 834
Developed countriesProduction kt pw 17 709 18 350 18 652 18 974 19 196 19 469 19 753 19 998 20 242 20 519 20 779Consumption kt pw 16 830 17 422 17 755 17 958 18 160 18 382 18 607 18 818 19 026 19 265 19 473
Developing countriesProduction kt pw 4 515 4 586 4 715 4 774 4 835 4 913 4 969 5 041 5 108 5 177 5 249Consumption kt pw 5 088 5 270 5 390 5 512 5 613 5 734 5 846 5 954 6 057 6 166 6 292
OECD2
Production kt pw 17 079 17 602 17 924 18 242 18 457 18 718 19 003 19 249 19 489 19 755 20 004Consumption kt pw 16 250 16 930 17 194 17 397 17 596 17 813 18 030 18 233 18 434 18 671 18 876Stock changes kt pw 25 -22 -46 10 -8 0 3 1 1 1 -1
ANNEX: COMMODITY SNAPSHOT TABLES
OECD-FAO AGRICULTURAL OUTLOOK 2016-2025 © OECD/FAO 2016 129
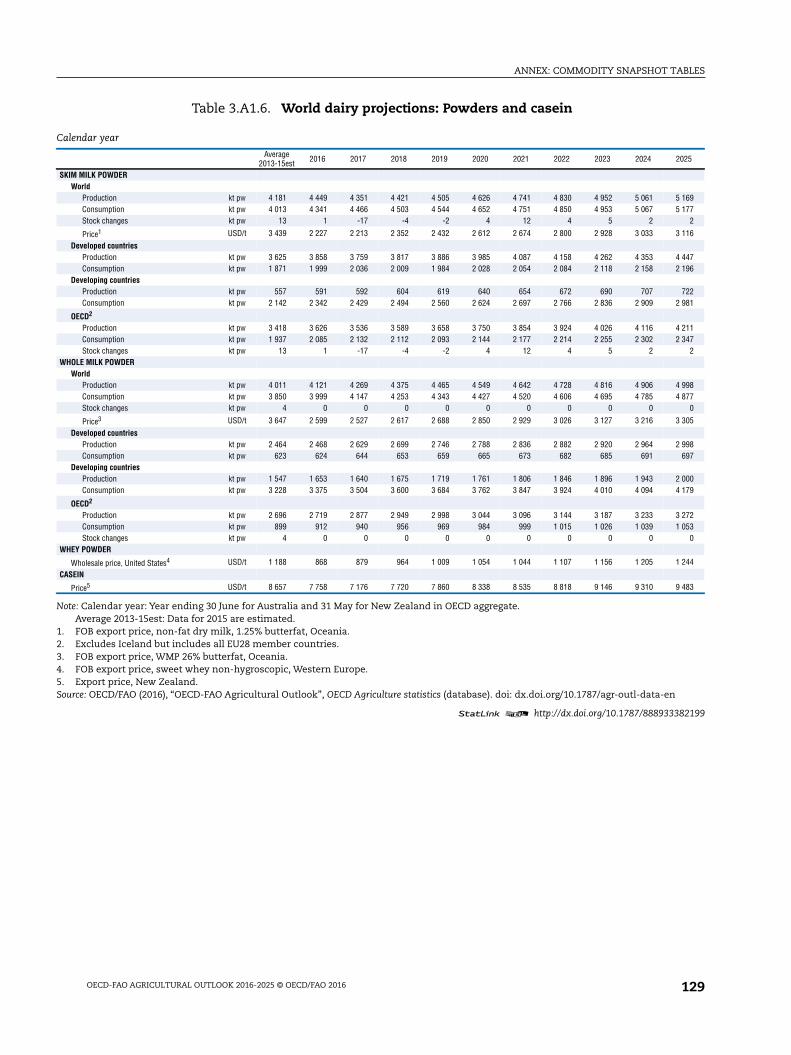
Table 3.A1.6. World dairy projections: Powders and casein
1 2 http://dx.doi.org/10.1787/888933382199
Note: Calendar year: Year ending 30 June for Australia and 31 May for New Zealand in OECD aggregate.Average 2013-15est: Data for 2015 are estimated.
1. FOB export price, non-fat dry milk, 1.25% butterfat, Oceania.2. Excludes Iceland but includes all EU28 member countries.3. FOB export price, WMP 26% butterfat, Oceania.4. FOB export price, sweet whey non-hygroscopic, Western Europe.5. Export price, New Zealand.Source: OECD/FAO (2016), “OECD-FAO Agricultural Outlook”, OECD Agriculture statistics (database). doi: dx.doi.org/10.1787/agr-outl-data-en
Calendar year
Average2013-15est 2016 2017 2018 2019 2020 2021 2022 2023 2024 2025
SKIM MILK POWDERWorld
Production kt pw 4 181 4 449 4 351 4 421 4 505 4 626 4 741 4 830 4 952 5 061 5 169Consumption kt pw 4 013 4 341 4 466 4 503 4 544 4 652 4 751 4 850 4 953 5 067 5 177Stock changes kt pw 13 1 -17 -4 -2 4 12 4 5 2 2
Price1 USD/t 3 439 2 227 2 213 2 352 2 432 2 612 2 674 2 800 2 928 3 033 3 116
Developed countriesProduction kt pw 3 625 3 858 3 759 3 817 3 886 3 985 4 087 4 158 4 262 4 353 4 447Consumption kt pw 1 871 1 999 2 036 2 009 1 984 2 028 2 054 2 084 2 118 2 158 2 196
Developing countriesProduction kt pw 557 591 592 604 619 640 654 672 690 707 722Consumption kt pw 2 142 2 342 2 429 2 494 2 560 2 624 2 697 2 766 2 836 2 909 2 981
OECD2
Production kt pw 3 418 3 626 3 536 3 589 3 658 3 750 3 854 3 924 4 026 4 116 4 211Consumption kt pw 1 937 2 085 2 132 2 112 2 093 2 144 2 177 2 214 2 255 2 302 2 347Stock changes kt pw 13 1 -17 -4 -2 4 12 4 5 2 2
WHOLE MILK POWDERWorld
Production kt pw 4 011 4 121 4 269 4 375 4 465 4 549 4 642 4 728 4 816 4 906 4 998Consumption kt pw 3 850 3 999 4 147 4 253 4 343 4 427 4 520 4 606 4 695 4 785 4 877Stock changes kt pw 4 0 0 0 0 0 0 0 0 0 0
Price3 USD/t 3 647 2 599 2 527 2 617 2 688 2 850 2 929 3 026 3 127 3 216 3 305
Developed countriesProduction kt pw 2 464 2 468 2 629 2 699 2 746 2 788 2 836 2 882 2 920 2 964 2 998Consumption kt pw 623 624 644 653 659 665 673 682 685 691 697
Developing countriesProduction kt pw 1 547 1 653 1 640 1 675 1 719 1 761 1 806 1 846 1 896 1 943 2 000Consumption kt pw 3 228 3 375 3 504 3 600 3 684 3 762 3 847 3 924 4 010 4 094 4 179
OECD2
Production kt pw 2 696 2 719 2 877 2 949 2 998 3 044 3 096 3 144 3 187 3 233 3 272Consumption kt pw 899 912 940 956 969 984 999 1 015 1 026 1 039 1 053Stock changes kt pw 4 0 0 0 0 0 0 0 0 0 0
WHEY POWDER
Wholesale price, United States4 USD/t 1 188 868 879 964 1 009 1 054 1 044 1 107 1 156 1 205 1 244
CASEIN
Price5 USD/t 8 657 7 758 7 176 7 720 7 860 8 338 8 535 8 818 9 146 9 310 9 483
From:OECD-FAO Agricultural Outlook 2016-2025
Access the complete publication at:http://dx.doi.org/10.1787/agr_outlook-2016-en
Please cite this chapter as:
OECD/FAO (2016), “Dairy and Dairy Products”, in OECD-FAO Agricultural Outlook 2016-2025, OECDPublishing, Paris.
DOI: http://dx.doi.org/10.1787/agr_outlook-2016-11-en
This work is published under the responsibility of the Secretary-General of the OECD and the Director-General of the FAO. Theopinions expressed and arguments employed herein do not necessarily reflect the official views of OECD member countries, orthe governments of the FAO member countries.
This document and any map included herein are without prejudice to the status of or sovereignty over any territory, to thedelimitation of international frontiers and boundaries and to the name of any territory, city or area.
You can copy, download or print OECD content for your own use, and you can include excerpts from OECD publications,databases and multimedia products in your own documents, presentations, blogs, websites and teaching materials, providedthat suitable acknowledgment of OECD as source and copyright owner is given. All requests for public or commercial use andtranslation rights should be submitted to [email protected]. Requests for permission to photocopy portions of this material forpublic or commercial use shall be addressed directly to the Copyright Clearance Center (CCC) at [email protected] or theCentre français d’exploitation du droit de copie (CFC) at [email protected].