Embed Size (px)
Citation preview
Danish Meteorological InstituteMinistry of Transport
Copenhagen 2005www.dmi.dk/dmi/tr05-13 page 1 of 31
Technical Report 05-13
Performance of DMI-HIRLAM-T15 and DMI-HIRLAM-S05and the storm surge model in winter storms
Claus Petersen, Maryanne Kmit, Niels Woetmann Nielsen,Bjarne Amstrup and Vibeke Huess
Danish Meteorological InstituteTechnical Report 05-13
ColophoneSerial title:Technical Report 05-13
Title:Performance of DMI-HIRLAM-T15 and DMI-HIRLAM-S05 and the storm surge model in winterstorms
Subtitle:
Authors:Claus Petersen, Maryanne Kmit, Niels Woetmann Nielsen, Bjarne Amstrup and Vibeke Huess
Other Contributers:
Responsible Institution:Danish Meteorological Institute
Language:English
Keywords:HIRLAM, storm surge, HIRLAM reference system, verification
Url:www.dmi.dk/dmi/tr05-13
ISSN:1399-1388
Version:
Link til hjemmeside:www.dmi.dk
Copyright:Danish Meteorological Institute
www.dmi.dk/dmi/tr05-13 page 2 of 31
Danish Meteorological InstituteTechnical Report 05-13
Dansk ResumeDMI’s numeriske vejrprognosesystem, DMI-HIRLAM, er blevet udskiftet med en ny version afHIRLAM, der grundlæggende er en tilbagevenden til Reference HIRLAM. Den tidligere version afDMI-HIRLAM var baseret på en tidlig version af Reference HIRLAM, men havde inkluderet en delDMI-specifikke features. Disse havde både betydning for den tekniske afvikling af modellen og denmeteorologiske ydeevne. I denne report er det godtgjort, at den meteorologiske ydeevne er forbedreten anelse i forhold til den foregående version. Dette er klargjort ved en standardverifikation for envinterperiode og ved en subjektiv sammenligning mellem den nye og den gamle model af en rækkeekstreme stormsituationer.
Derudover testes DMI’s stormflodsmodels evne til at forudsige vandstanden med forudsagte vindefra den nye version af DMI-HIRLAM som input. Totalt set klarer den nye DMI-HIRLAMmodelversion sig en anelse bedre.
AbstractThe former DMI-HIRLAM system has been replaced with a new DMI-HIRLAM which essentiallyis a return to the so-called Reference version of HIRLAM. The former version of DMI-HIRLAMwas based on a early version of Reference HIRLAM but with many DMI specific featuresincorporated in the system. These had an effect on model performance with respect to the technicalexecution of the model and the meteorological performance. In this report it is shown that themeteorological performance of the new version of DMI-HIRLAM is slightly improved relative to theprevious version. This is demonstrated by using standard verification of the model for a winterperiod and a subjective comparison between the new and old model version in some extreme stormcases. Finally the storm surge model’s ability to predict the sea level height using forecasted windfrom the new version of DMI-HIRLAM is tested. The overall conclusion is slightly in favor of thenew DMI-HIRLAM model version.
IntroductionDMI-HIRLAM-T15 and DMI-HIRLAM-S05 comprise a nested system with DMI-HIRLAM-T15 asthe outer domain and DMI-HIRLAM-S05 the inner domain. This model system replaced on 14 June2004 the formerly operational DMI-HIRLAM-GEDN. The two different systems are depicted inFigures 1 and 2.
Besides the change in model domains, the DMI-HIRLAM-T15 and DMI-HIRLAM-S05 modelsystem is in many ways very different from the DMI-HIRLAM-GEDN system. The coding structurehas been completely revised. This has been done for optimal use of the NEC SX-6 supercomputersystem at DMI. Operationally the required amount of computer resources has increased from 8processors in the old system to 24 processors in the new system. The amount of I/O and memory inuse have also increased substantially.
In this report there will be no focus on technical aspects of the change in the model system. Thesehave been treated in an earlier DMI report [Ulrik Smith Korsholm and Claus Petersen, 2004]. Thefocus in this report will be on the meteorological performance of the DMI-HIRLAM-T15 andDMI-HIRLAM-S05 system compared to the previous DMI-HIRLAM-GEDN system. Essentiallythe upgrade of the code amounted to a return to the standard HIRLAM code, the so-called referenceHIRLAM code, [Per Undén et al. 2002], and the most recent release from the HIRLAM communityhas been used as a starting point, presently version number 6.3. However major changes to this codehave been made to improve both the meteorological and computational performance. This report
www.dmi.dk/dmi/tr05-13 page 3 of 31
Danish Meteorological InstituteTechnical Report 05-13
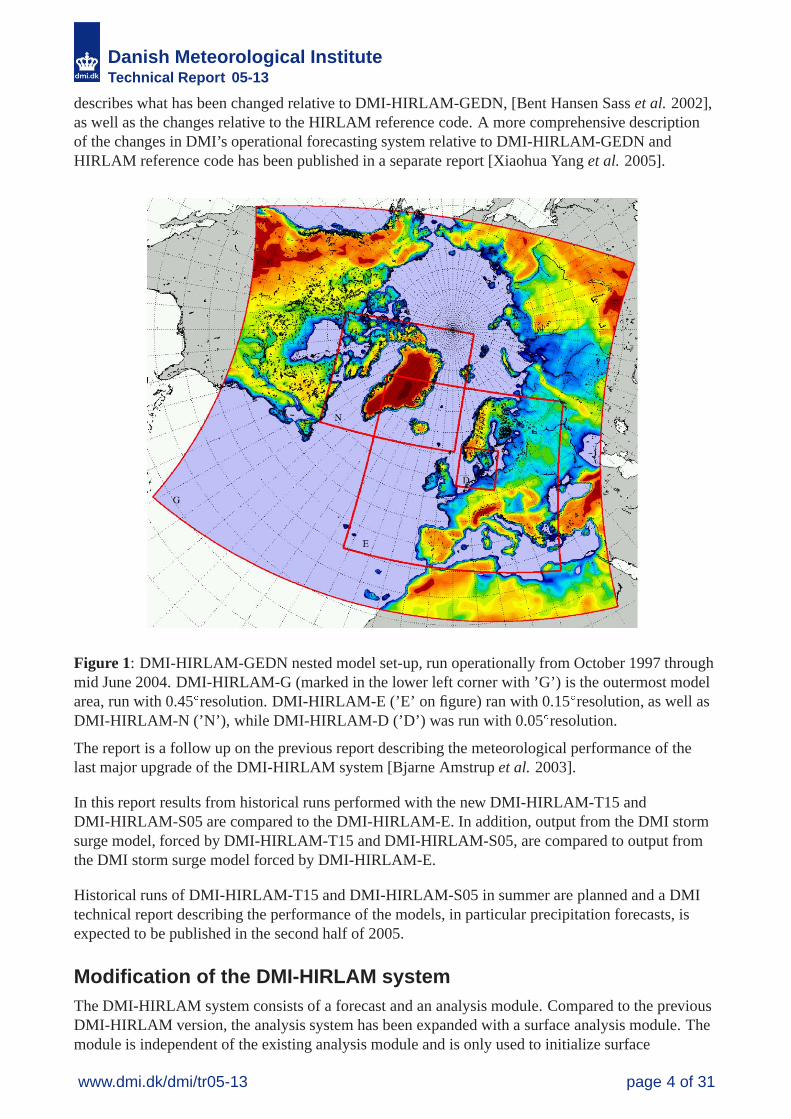
describes what has been changed relative to DMI-HIRLAM-GEDN, [Bent Hansen Sass et al. 2002],as well as the changes relative to the HIRLAM reference code. A more comprehensive descriptionof the changes in DMI’s operational forecasting system relative to DMI-HIRLAM-GEDN andHIRLAM reference code has been published in a separate report [Xiaohua Yang et al. 2005].
Figure 1: DMI-HIRLAM-GEDN nested model set-up, run operationally from October 1997 throughmid June 2004. DMI-HIRLAM-G (marked in the lower left corner with ’G’) is the outermost modelarea, run with 0.45Æresolution. DMI-HIRLAM-E (’E’ on figure) ran with 0.15Æresolution, as well asDMI-HIRLAM-N (’N’), while DMI-HIRLAM-D (’D’) was run with 0.05Æresolution.
The report is a follow up on the previous report describing the meteorological performance of thelast major upgrade of the DMI-HIRLAM system [Bjarne Amstrup et al. 2003].
In this report results from historical runs performed with the new DMI-HIRLAM-T15 andDMI-HIRLAM-S05 are compared to the DMI-HIRLAM-E. In addition, output from the DMI stormsurge model, forced by DMI-HIRLAM-T15 and DMI-HIRLAM-S05, are compared to output fromthe DMI storm surge model forced by DMI-HIRLAM-E.
Historical runs of DMI-HIRLAM-T15 and DMI-HIRLAM-S05 in summer are planned and a DMItechnical report describing the performance of the models, in particular precipitation forecasts, isexpected to be published in the second half of 2005.
Modification of the DMI-HIRLAM systemThe DMI-HIRLAM system consists of a forecast and an analysis module. Compared to the previousDMI-HIRLAM version, the analysis system has been expanded with a surface analysis module. Themodule is independent of the existing analysis module and is only used to initialize surface
www.dmi.dk/dmi/tr05-13 page 4 of 31
Danish Meteorological InstituteTechnical Report 05-13
parameters for the surface scheme in the forecast model. No changes have been made to theHIRLAM 3-dimensional variational data assimilation system, 3D-VAR. The forecast model has beenfundamentally changed in the coding structure as mentioned in the introduction. However thesolution to the governing equations and the parameterization of the physical processes have in mostcases remained unchanged. The three most important changes are
� a change from Eulerian to semi-Lagrangian advection,
� the change of the surface scheme which also includes a surface analysis system
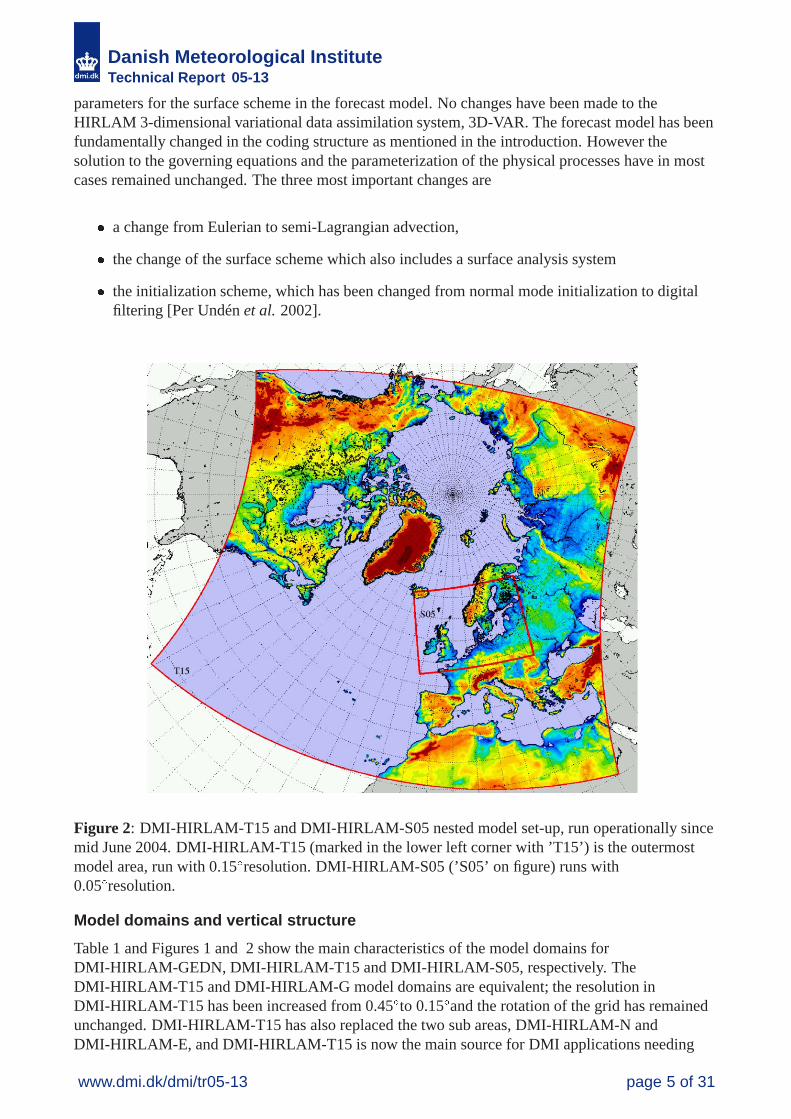
� the initialization scheme, which has been changed from normal mode initialization to digitalfiltering [Per Undén et al. 2002].
Figure 2: DMI-HIRLAM-T15 and DMI-HIRLAM-S05 nested model set-up, run operationally sincemid June 2004. DMI-HIRLAM-T15 (marked in the lower left corner with ’T15’) is the outermostmodel area, run with 0.15Æresolution. DMI-HIRLAM-S05 (’S05’ on figure) runs with0.05Æresolution.
Model domains and vertical structure
Table 1 and Figures 1 and 2 show the main characteristics of the model domains forDMI-HIRLAM-GEDN, DMI-HIRLAM-T15 and DMI-HIRLAM-S05, respectively. TheDMI-HIRLAM-T15 and DMI-HIRLAM-G model domains are equivalent; the resolution inDMI-HIRLAM-T15 has been increased from 0.45Æto 0.15Æand the rotation of the grid has remainedunchanged. DMI-HIRLAM-T15 has also replaced the two sub areas, DMI-HIRLAM-N andDMI-HIRLAM-E, and DMI-HIRLAM-T15 is now the main source for DMI applications needing
www.dmi.dk/dmi/tr05-13 page 5 of 31
Danish Meteorological InstituteTechnical Report 05-13
meteorological data as input. DMI-HIRLAM-S05 replaces the former DMI-HIRLAM-D. The areaof the model now also covers the Baltic Sea and the North Sea, an area of interest for the highresolution oceanographic models run at DMI, especially in connection with the storm surge model,Mike21. The resolution is unchanged (0.05Æ) but the rotation angle of the grid has been modified toget the optimal area. The vertical structure of DMI-HIRLAM-T15 and DMI-HIRLAM-S05 has beenslightly modified but the number of levels is still 40.
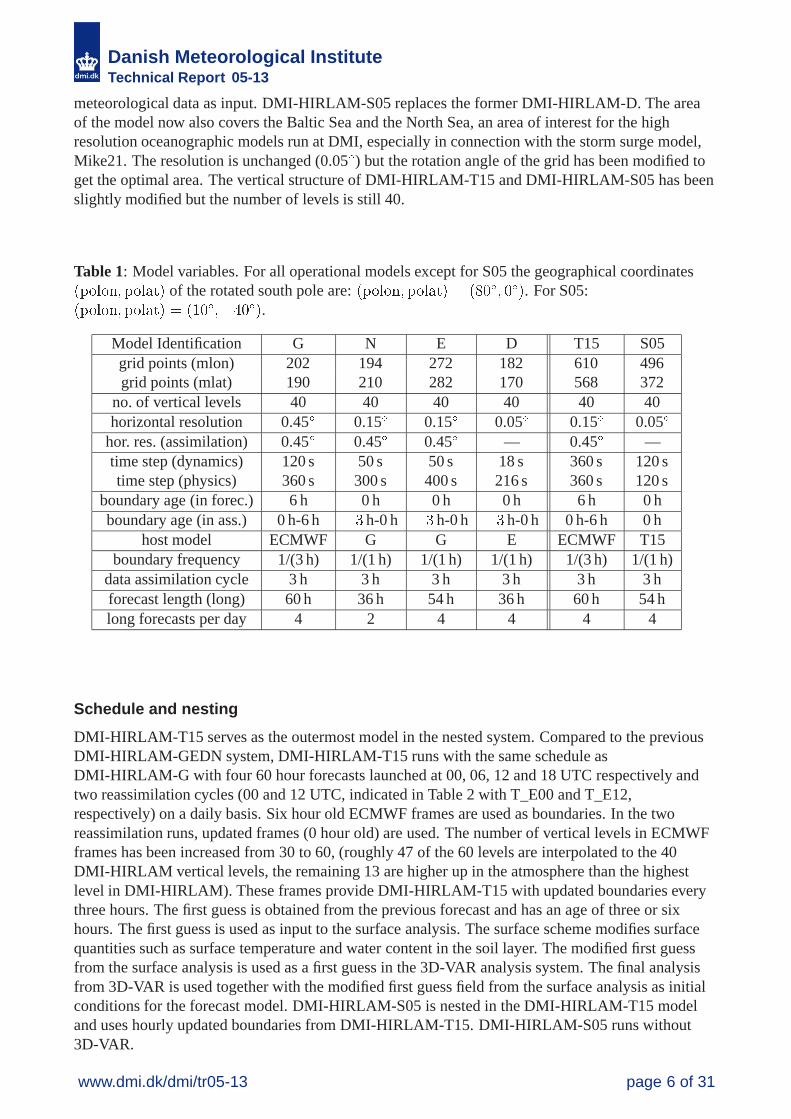
Table 1: Model variables. For all operational models except for S05 the geographical coordinates������� ������ of the rotated south pole are: ������� ������ � �� �. For S05:������� ������ � ������.
Model Identification G N E D T15 S05grid points (mlon) 202 194 272 182 610 496grid points (mlat) 190 210 282 170 568 372
no. of vertical levels 40 40 40 40 40 40horizontal resolution 0.45Æ 0.15Æ 0.15Æ 0.05Æ 0.15Æ 0.05Æ
hor. res. (assimilation) 0.45Æ 0.45Æ 0.45Æ — 0.45Æ —time step (dynamics) 120 s 50 s 50 s 18 s 360 s 120 stime step (physics) 360 s 300 s 400 s 216 s 360 s 120 s
boundary age (in forec.) 6 h 0 h 0 h 0 h 6 h 0 hboundary age (in ass.) 0 h-6 h � h-0 h � h-0 h � h-0 h 0 h-6 h 0 h
host model ECMWF G G E ECMWF T15boundary frequency 1/(3 h) 1/(1 h) 1/(1 h) 1/(1 h) 1/(3 h) 1/(1 h)
data assimilation cycle 3 h 3 h 3 h 3 h 3 h 3 hforecast length (long) 60 h 36 h 54 h 36 h 60 h 54 hlong forecasts per day 4 2 4 4 4 4
Schedule and nesting
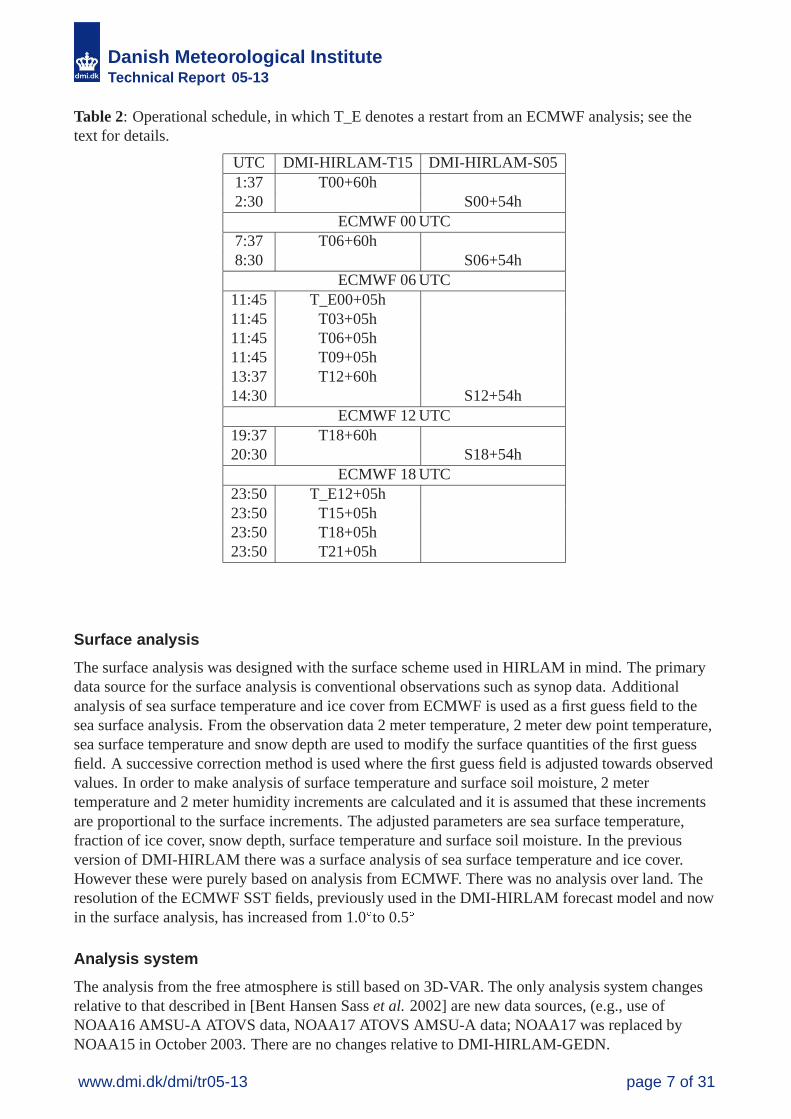
DMI-HIRLAM-T15 serves as the outermost model in the nested system. Compared to the previousDMI-HIRLAM-GEDN system, DMI-HIRLAM-T15 runs with the same schedule asDMI-HIRLAM-G with four 60 hour forecasts launched at 00, 06, 12 and 18 UTC respectively andtwo reassimilation cycles (00 and 12 UTC, indicated in Table 2 with T_E00 and T_E12,respectively) on a daily basis. Six hour old ECMWF frames are used as boundaries. In the tworeassimilation runs, updated frames (0 hour old) are used. The number of vertical levels in ECMWFframes has been increased from 30 to 60, (roughly 47 of the 60 levels are interpolated to the 40DMI-HIRLAM vertical levels, the remaining 13 are higher up in the atmosphere than the highestlevel in DMI-HIRLAM). These frames provide DMI-HIRLAM-T15 with updated boundaries everythree hours. The first guess is obtained from the previous forecast and has an age of three or sixhours. The first guess is used as input to the surface analysis. The surface scheme modifies surfacequantities such as surface temperature and water content in the soil layer. The modified first guessfrom the surface analysis is used as a first guess in the 3D-VAR analysis system. The final analysisfrom 3D-VAR is used together with the modified first guess field from the surface analysis as initialconditions for the forecast model. DMI-HIRLAM-S05 is nested in the DMI-HIRLAM-T15 modeland uses hourly updated boundaries from DMI-HIRLAM-T15. DMI-HIRLAM-S05 runs without3D-VAR.
www.dmi.dk/dmi/tr05-13 page 6 of 31
Danish Meteorological InstituteTechnical Report 05-13
Table 2: Operational schedule, in which T_E denotes a restart from an ECMWF analysis; see thetext for details.
UTC DMI-HIRLAM-T15 DMI-HIRLAM-S051:37 T00+60h2:30 S00+54h
ECMWF 00 UTC7:37 T06+60h8:30 S06+54h
ECMWF 06 UTC11:45 T_E00+05h11:45 T03+05h11:45 T06+05h11:45 T09+05h13:37 T12+60h14:30 S12+54h
ECMWF 12 UTC19:37 T18+60h20:30 S18+54h
ECMWF 18 UTC23:50 T_E12+05h23:50 T15+05h23:50 T18+05h23:50 T21+05h
Surface analysis
The surface analysis was designed with the surface scheme used in HIRLAM in mind. The primarydata source for the surface analysis is conventional observations such as synop data. Additionalanalysis of sea surface temperature and ice cover from ECMWF is used as a first guess field to thesea surface analysis. From the observation data 2 meter temperature, 2 meter dew point temperature,sea surface temperature and snow depth are used to modify the surface quantities of the first guessfield. A successive correction method is used where the first guess field is adjusted towards observedvalues. In order to make analysis of surface temperature and surface soil moisture, 2 metertemperature and 2 meter humidity increments are calculated and it is assumed that these incrementsare proportional to the surface increments. The adjusted parameters are sea surface temperature,fraction of ice cover, snow depth, surface temperature and surface soil moisture. In the previousversion of DMI-HIRLAM there was a surface analysis of sea surface temperature and ice cover.However these were purely based on analysis from ECMWF. There was no analysis over land. Theresolution of the ECMWF SST fields, previously used in the DMI-HIRLAM forecast model and nowin the surface analysis, has increased from 1.0Æto 0.5Æ
Analysis system
The analysis from the free atmosphere is still based on 3D-VAR. The only analysis system changesrelative to that described in [Bent Hansen Sass et al. 2002] are new data sources, (e.g., use ofNOAA16 AMSU-A ATOVS data, NOAA17 ATOVS AMSU-A data; NOAA17 was replaced byNOAA15 in October 2003. There are no changes relative to DMI-HIRLAM-GEDN.
www.dmi.dk/dmi/tr05-13 page 7 of 31
Danish Meteorological InstituteTechnical Report 05-13
Incremental digital filter initialization and blending
The initialization of DMI-HIRLAM has been changed from normal mode initialization to digitalfilter initialization, DFI, [Xiang-Yu Huang and Xiaohua Yang, 2002]. Incremental digital filterinitialization, IDFI, is used to combine the tasks of initialization and blending initial conditions,[Xiaohua Yang, 2004]. IDFI can be used for a single model, in which case the analysis and firstguess of the same model are used when calculating the initial model state. This is done forDMI-HIRLAM-T15 four times a day for each 60 hour forecast. IDFI is also used for everyDMI-HIRLAM-S05 run and two times daily for DMI-HIRLAM-T15, for blending the host modelanalysis and the nested model first guess. This method makes it possible to run the model withoutthe data assimilation module but still retain small scale features from the first guess field.Interpolated analyses or interpolated initialized analyses from an outer nested model are used asinput. It is assumed that the resolution of the outer host model is lower and thus on a larger scale. Inthe incremental digital filter these larger scales are retained and blended with small scale featuresfrom the first guess field, which is the output of the surface analysis, its input being a forecast fromthe previous run of the inner, nested model. DMI-HIRLAM-S05 uses an interpolated initializedanalysis from DMI-HIRLAM-T15 as input. This is done for every forecast. DMI-HIRLAM-T15uses an interpolated initialized analysis from ECMWF two times daily as input to the first run in thereassimilation cycle. It is believed that ECMWF can provide better large scale analyses than theHIRLAM analysis system. This can be justified from the fact that ECMWF’s long cut off allows forthe use of more data, that more data types are used and that ECMWF run data assimilation two timesdaily using the more advanced 4-dimensional variational data assimilation system.DMI-HIRLAM-GEDN also used increments in a similar way to that just described. However themethod was not based on digital filter methods but rather on a locally adopted, undocumentedmethod.
Advection scheme
Eulerian advection has been replaced by semi-Lagrangian advection. The semi-Lagrangianadvection scheme has made it possible to increase the time step significantly but it is alsocomputationally more expensive per time step. The physics package also uses the same time step asthe Lagrangian advection scheme. In DMI-HIRLAM-GEDN the physics package ran with a longertime step than the Eulerian advection. This option is not available in the new reference HIRLAMmodel set-up. It is noteworthy that the Lagrangian advection and its interaction with the modelphysics has been numerically very stable. This was not always the case with the interaction ofEulerian advection and the model physics which could especially become numerically unstable incertain convective situations.
Surface scheme
The surface scheme has been replaced by an entirely new scheme. The old scheme made distinctionsbetween sea, ice and land. The new scheme has in addition three grid tile types for land which arebare soil, forest and low vegetation. For the three grid tile types, each grid tile being assigned one ofthe types, the ISBA (Interaction between Soil, Biosphere and Atmosphere) formulation is used. Thesolution of the equations for the surface and soil layers is based on an entirely different approach.The old scheme basically solved the heat equation for the soil layers using fluxes from theatmosphere as input to the energy budget at the surface, and climate values as lower boundaryconditions. The new surface scheme uses a force restore approach and a more complicatedparameterization of the soil processes such as vegetation and different types of soil. The calculationof surface fluxes and diagnostic quantities such as 2 meter temperature and 10 meter wind are basedon a different approach in the new set-up. In order to reduce the 10 meter wind bias, the vegetation
www.dmi.dk/dmi/tr05-13 page 8 of 31
Danish Meteorological InstituteTechnical Report 05-13
roughness has been increased by a factor of three.
Implicit horizontal diffusion
The horizontal diffusion is still based on the same implicit horizontal diffusion scheme, the so-calledRaymond filter. The order of the diffusion scheme has been increased from fourth order inDMI-HIRLAM-GEDN to sixth order in DMI-HIRLAM-T15 and DMI-HIRLAM-S05.
Vertical diffusion
DMI-HIRLAM still utilizes the CBR scheme. Some modifications to the CBR scheme have beennecessary in order to get correct surface winds and filling of lows. These aspects can to some degreebe seen as a tuning of the CBR scheme and especially a tuning of the boundary condition at thesurface. The most important update of the CBR scheme has been a new parameterization of thesurface stress [Niels W. Nielsen and Bent Hansen Sass 2004]. In the old set-up it was assumed thatthe surface stress and the surface wind were parallel. However it can be justified that the direction ofthe surface wind and the surface stress are not necessarily parallel. The rotation of the surface stressrelative to the surface wind will increase the cross isobaric wind and lead to a more correct filling oflows. The rotation angle is dependent on the stability of the atmosphere. The CBR scheme used inDMI-HIRLAM-GEDN is based on an older version of the CBR scheme. Nevertheless, aside fromthe turning of surface stress there are few differences between the two versions.
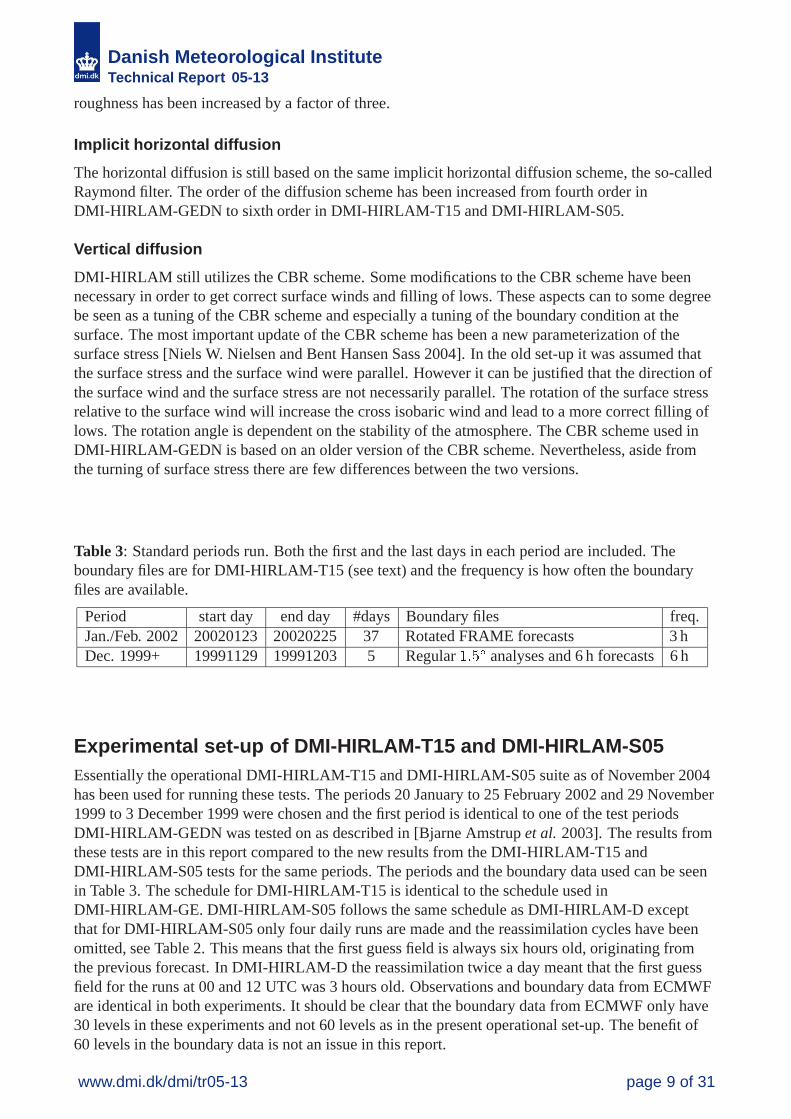
Table 3: Standard periods run. Both the first and the last days in each period are included. Theboundary files are for DMI-HIRLAM-T15 (see text) and the frequency is how often the boundaryfiles are available.
Period start day end day #days Boundary files freq.Jan./Feb. 2002 20020123 20020225 37 Rotated FRAME forecasts 3 hDec. 1999+ 19991129 19991203 5 Regular ���Æ analyses and 6 h forecasts 6 h
Experimental set-up of DMI-HIRLAM-T15 and DMI-HIRLAM-S05Essentially the operational DMI-HIRLAM-T15 and DMI-HIRLAM-S05 suite as of November 2004has been used for running these tests. The periods 20 January to 25 February 2002 and 29 November1999 to 3 December 1999 were chosen and the first period is identical to one of the test periodsDMI-HIRLAM-GEDN was tested on as described in [Bjarne Amstrup et al. 2003]. The results fromthese tests are in this report compared to the new results from the DMI-HIRLAM-T15 andDMI-HIRLAM-S05 tests for the same periods. The periods and the boundary data used can be seenin Table 3. The schedule for DMI-HIRLAM-T15 is identical to the schedule used inDMI-HIRLAM-GE. DMI-HIRLAM-S05 follows the same schedule as DMI-HIRLAM-D exceptthat for DMI-HIRLAM-S05 only four daily runs are made and the reassimilation cycles have beenomitted, see Table 2. This means that the first guess field is always six hours old, originating fromthe previous forecast. In DMI-HIRLAM-D the reassimilation twice a day meant that the first guessfield for the runs at 00 and 12 UTC was 3 hours old. Observations and boundary data from ECMWFare identical in both experiments. It should be clear that the boundary data from ECMWF only have30 levels in these experiments and not 60 levels as in the present operational set-up. The benefit of60 levels in the boundary data is not an issue in this report.
www.dmi.dk/dmi/tr05-13 page 9 of 31
Danish Meteorological InstituteTechnical Report 05-13
Case studiesTwo ’old’ cases, C1 and C2, and one more recent case, C3, have been selected for inter-comparison.C1 is about the December 1999 storm in Denmark and C2 is about a less severe storm on 28 January2002, affecting the North Sea and Denmark. The third, more recent case, deals with the severe stormover Southern Scandinavia on 8 January 2005. In all the cases storms let to storm surge conditions atthe Danish North Sea coast.
The inter-comparison for the December 1999 storm is between DMI-HIRLAM-E andDMI-HIRLAM-T15. The former was operational prior to 14 June 2004 and the latter has beenoperational since then.
Case C2 also includes an inter-comparison between DMI-HIRLAM-T15 (T1X) andDMI-HIRLAM-S05 (S0X). In the case studies included here, DMI-HIRLAM-T15 and -T1X refer toessentially the same model system. DMI-HIRLAM-T1X is used for situations for which this modelsystem version was a test version. DMI-HIRLAM-T15 is used to describe the operational modelsystem version.
DMI-HIRLAM-S05 is nested in DMI-HIRLAM-T15 (see Figure 2) and has a horizontal resolutionof approximately 5 km. In the figures presented below DMI-HIRLAM-E and DMI-HIRLAM-T15are referenced as D1C and T1X, respectively. Note that T1X refers to the historical runs describedhere and which were made using the operational set-up from 16 November 2004.
Case C1
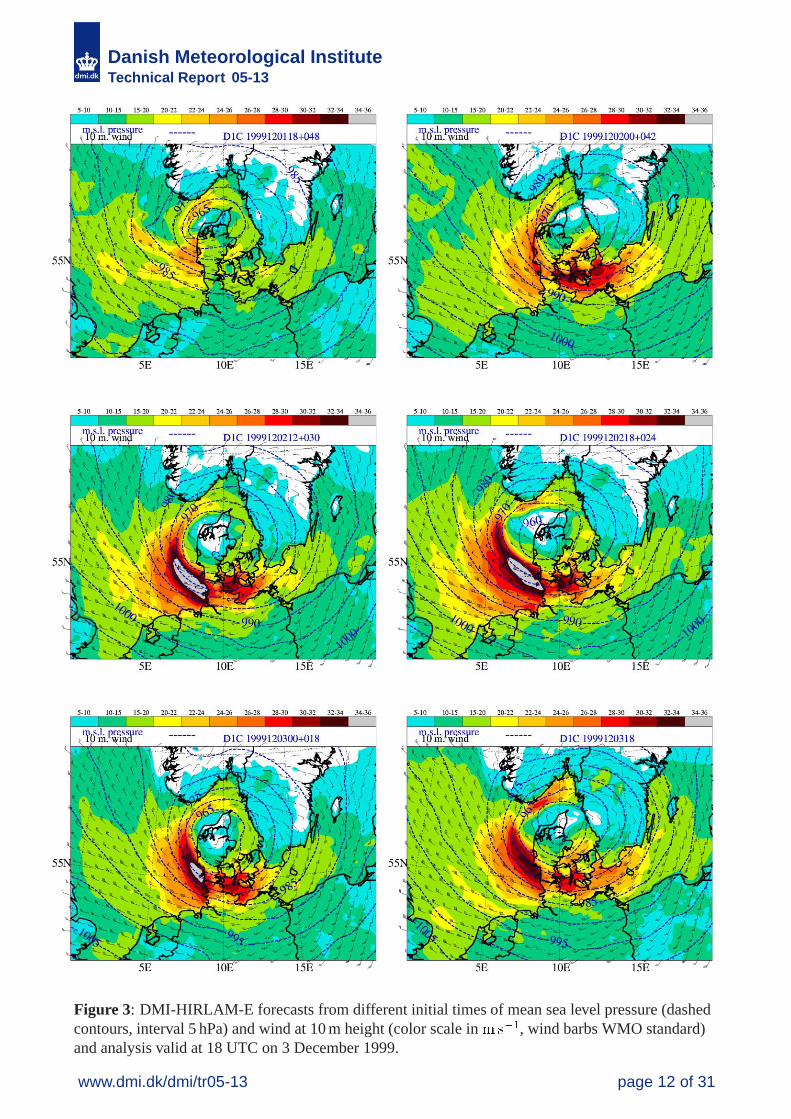
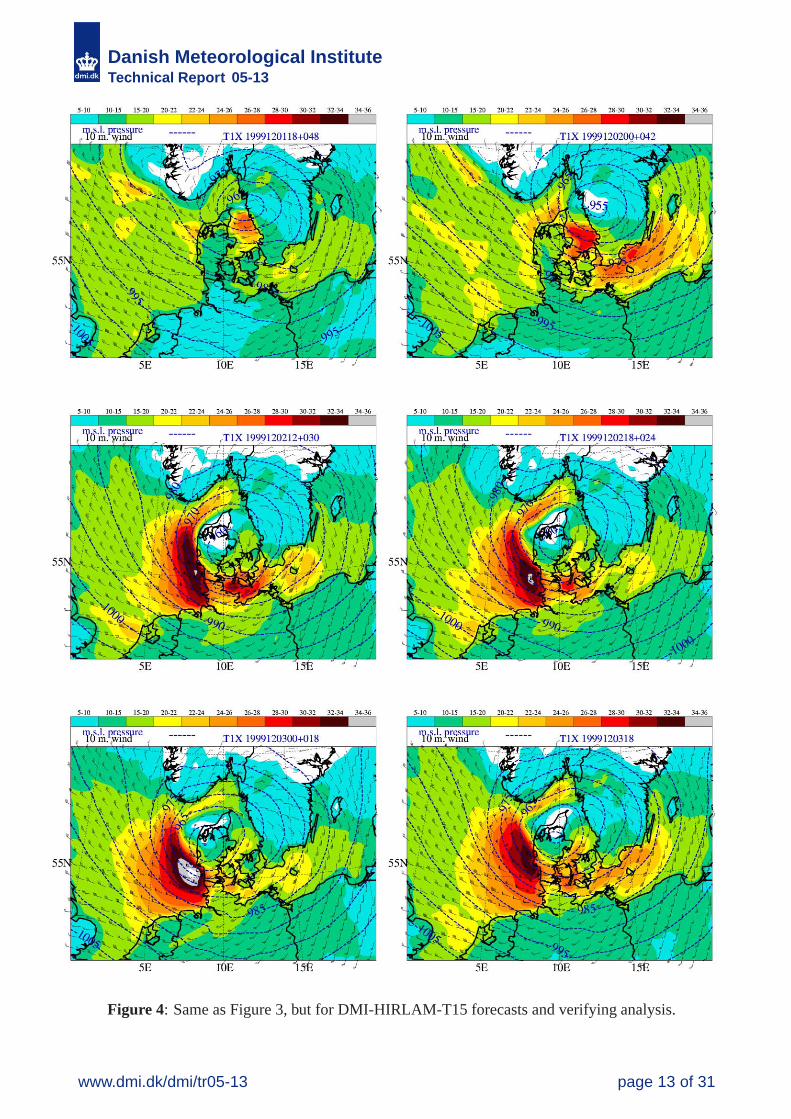
Figures 3 and 4 show forecasts of mean sea level pressure (mslp) and near-surface wind (at 10 mheight). Figure 3 shows results for D1C and Figure 4 shows corresponding results for T1X. Theforecasts of the storm evolution are fairly good in both model versions. A tendency for a slightlydeeper low with a more easterly position is seen in T1X, particularly in the longer forecasts(Figure 4, upper row). The predicted location of the near-surface wind maximum over thesoutheastern North Sea in the 30 and 24 hour forecasts is shifted a little northeastward in T1Xrelative to D1C. The northeastward shift seems to agree better with observations (not shown) and theanalyses (Figure 3 and Figure 4, bottom row, right). The predicted maximum near-surface windspeed is highest in D1C, except for the 18 hour forecast.
Case C2
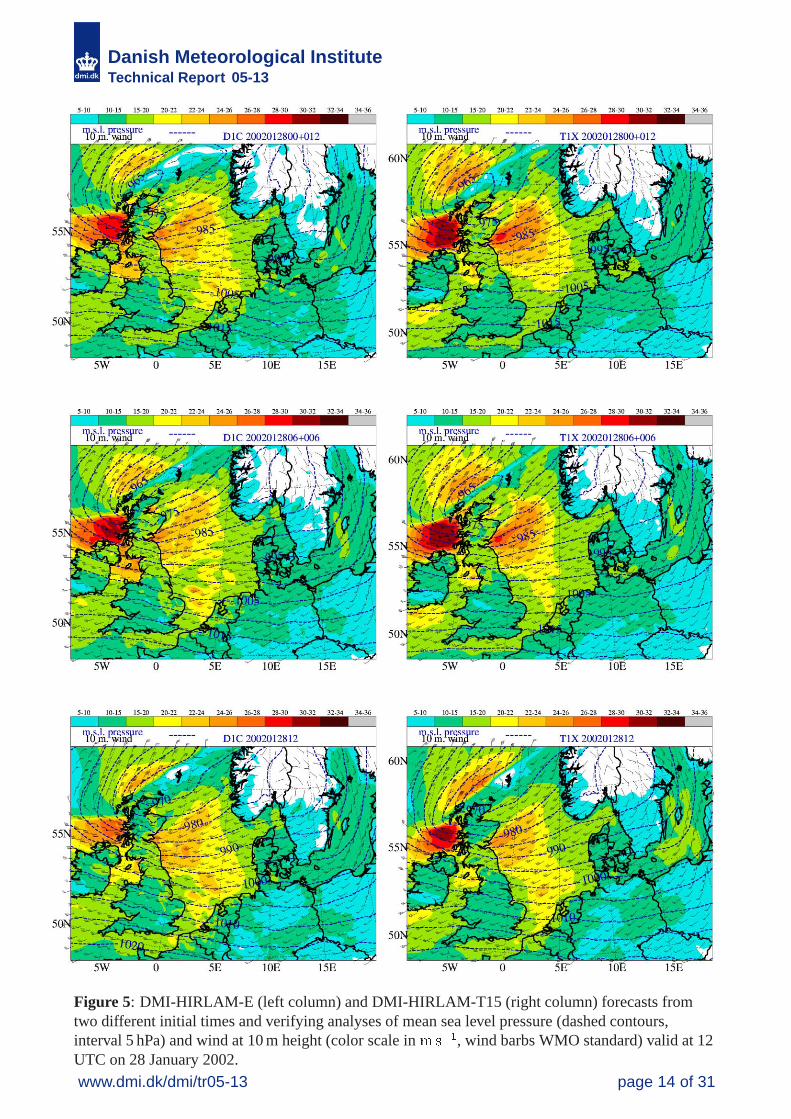
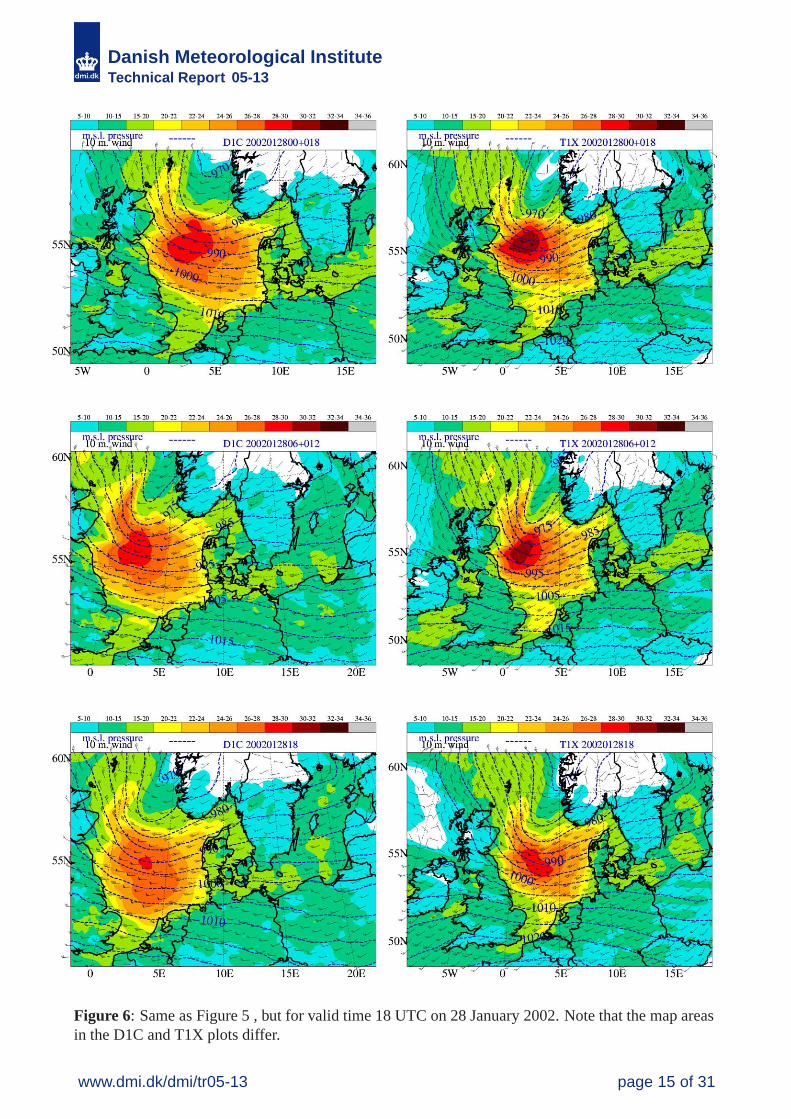
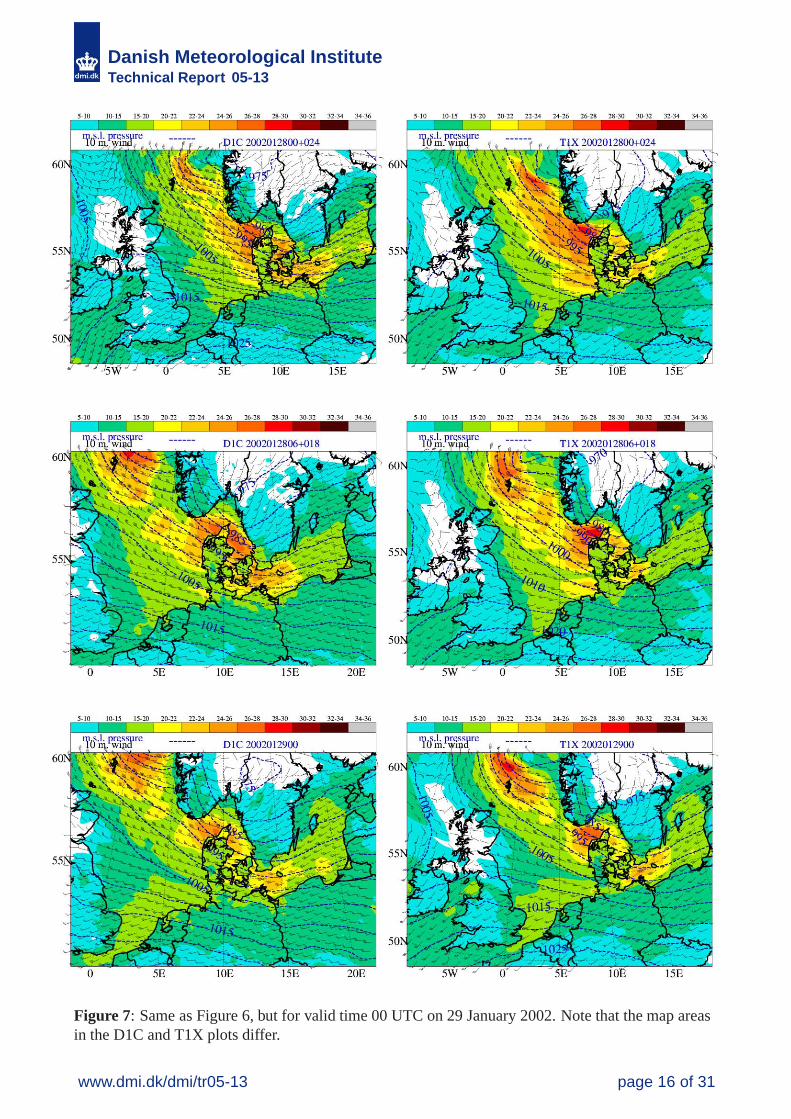
Figures 5, 6 and 7 show forecasts and analyses of mslp and near-surface wind for C2. Left and rightcolumns depict results for D1C and T1X, respectively. The analyses at 6 hour intervals from 12 UTCon 28 January 2002 (Figure 5, bottom row) until 00 UTC on 29 January 2002 (Figure 7) show aninitial relatively sharp surface trough with counterclockwise rotation moving eastward andweakening. The surface trough tends to be sharper and the near-surface winds on the downstreamside of the trough are consistently higher in T1X. Note that the same holds for the analyses. Here thenear-surface winds are not analyzed and therefore markedly influenced by the first guess.
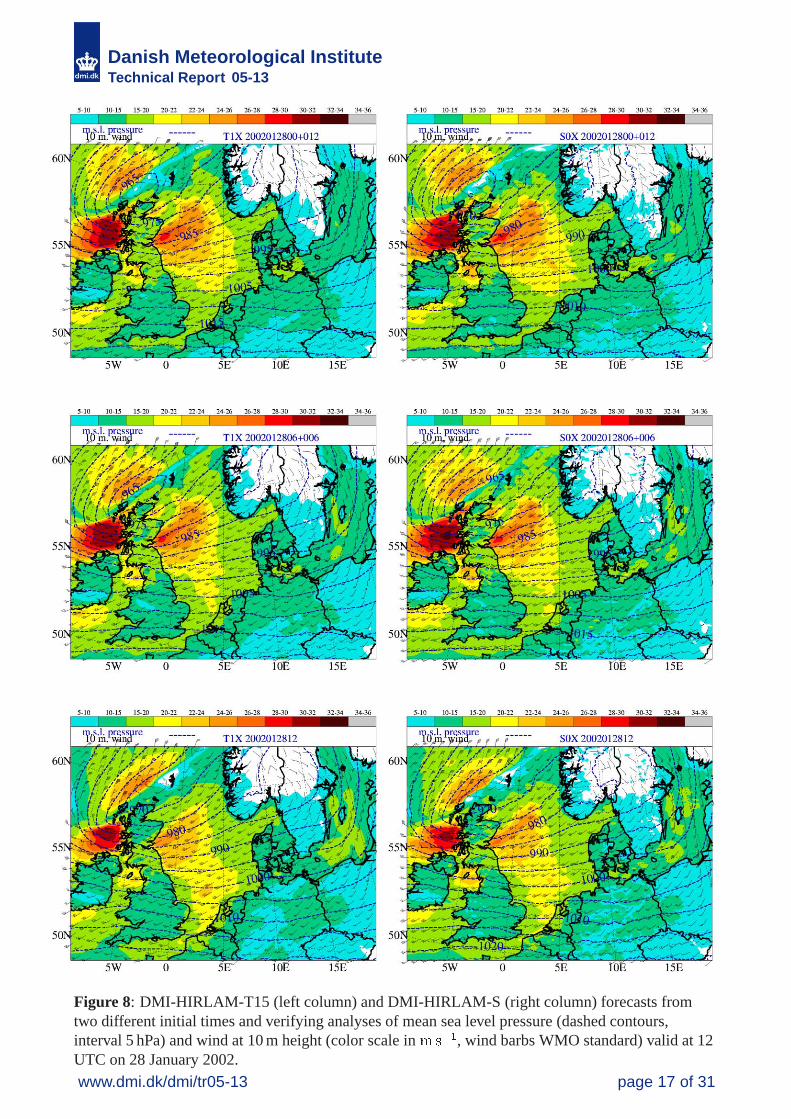
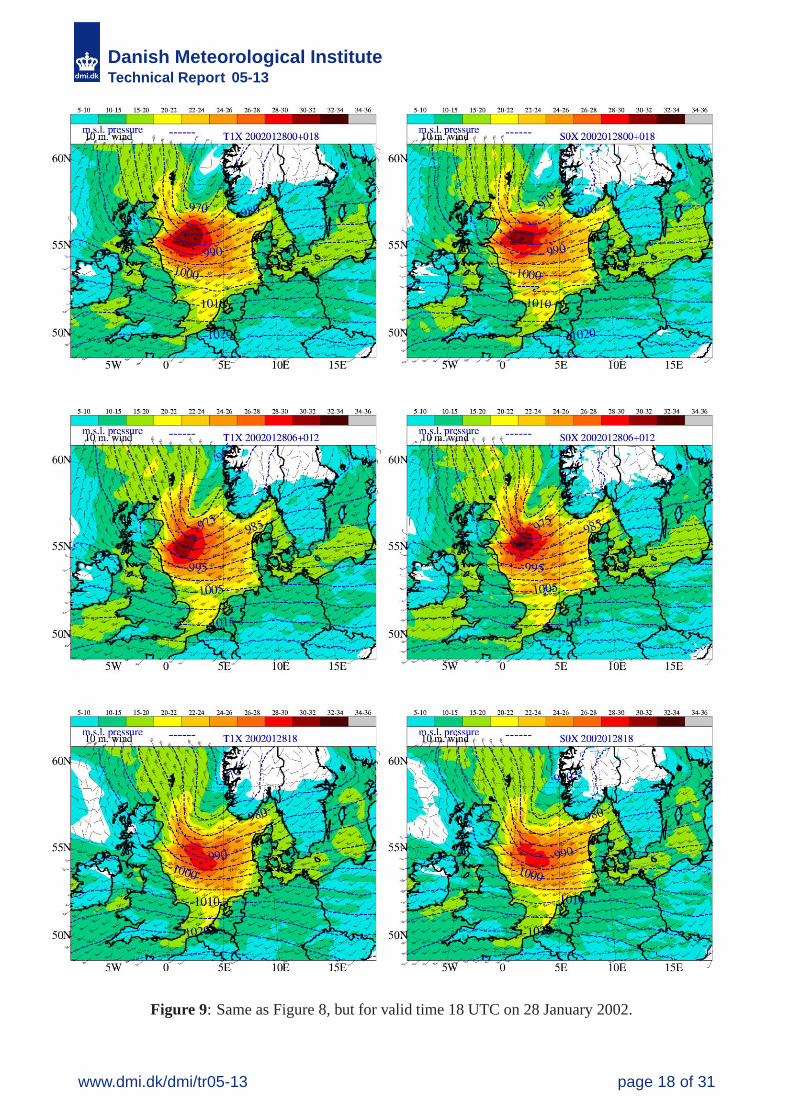
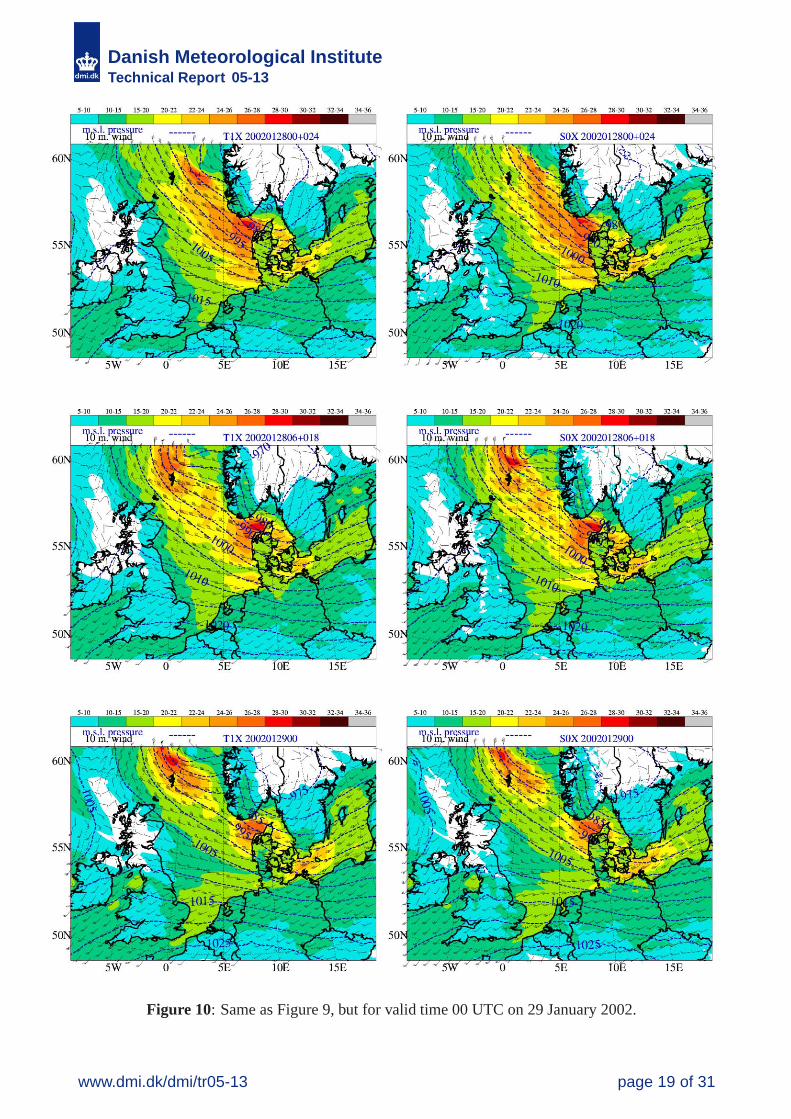
Figures 8 to 10 show that the differences in near-surface wind speed between T1X and S0Xgenerally are smaller then the corresponding differences between T1X and D1C. S0X is identicalwith T1X, but run on a smaller domain and with a higher horizontal resolution (about 5 km insteadof about 15 km in T1X and with analyses based on increments from T1X). T1X analyses andforecasts provide boundary values for S0X with an update frequency of 1 hour.
www.dmi.dk/dmi/tr05-13 page 10 of 31
Danish Meteorological InstituteTechnical Report 05-13
Case C3
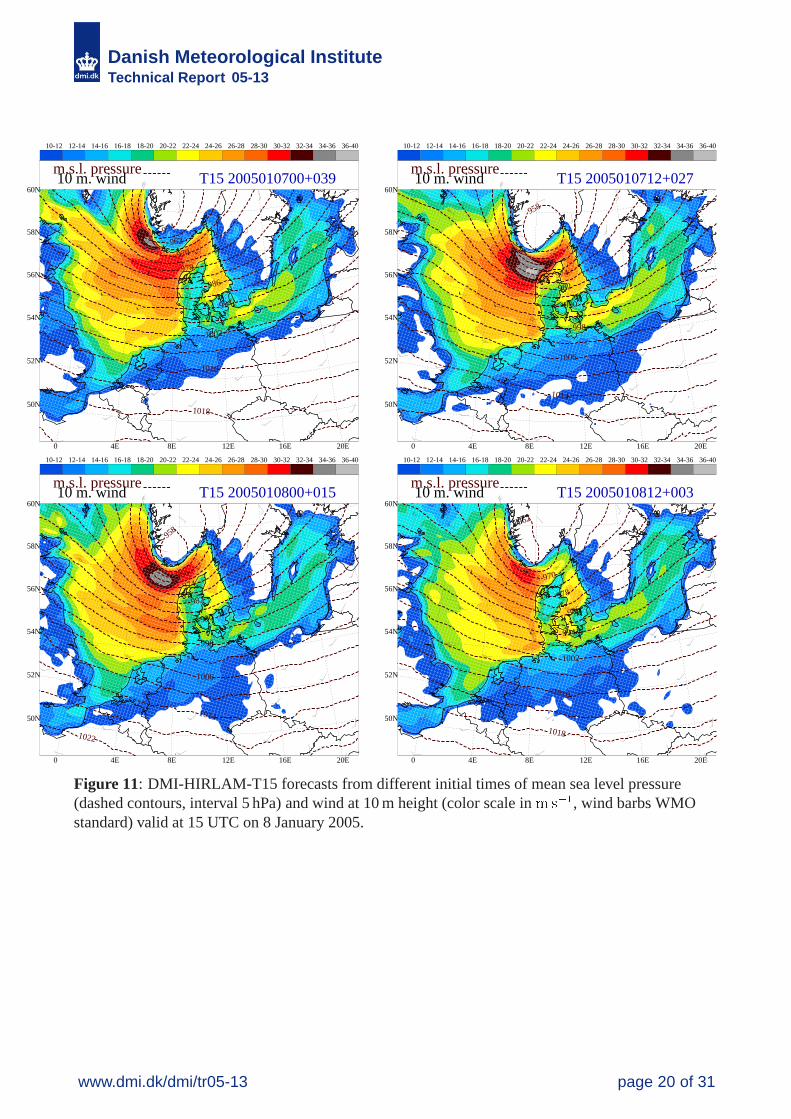
The selected cases C1 and C2 are relatively old. A more recent storm case, C3, from 8 January 2005has also been investigated, including an inter- comparison with forecasts from the old operationalsystem prior to the upgrade on 14 June 2004. Predictions by T15 from four different initial times areshown in Figure 11. This figure shows good consistency between the predicted near-surface wind atdifferent initial times. The storm surge models forced by winds from S0X gave remarkably goodpredictions of sea levels along the Danish wadden sea coast. A record high sea level was predictedfor Limfjorden and a record high sea level occurred.
www.dmi.dk/dmi/tr05-13 page 11 of 31
Danish Meteorological InstituteTechnical Report 05-13
Figure 3: DMI-HIRLAM-E forecasts from different initial times of mean sea level pressure (dashedcontours, interval 5 hPa) and wind at 10 m height (color scale in ����, wind barbs WMO standard)and analysis valid at 18 UTC on 3 December 1999.
www.dmi.dk/dmi/tr05-13 page 12 of 31
Danish Meteorological InstituteTechnical Report 05-13
Figure 4: Same as Figure 3, but for DMI-HIRLAM-T15 forecasts and verifying analysis.
www.dmi.dk/dmi/tr05-13 page 13 of 31
Danish Meteorological InstituteTechnical Report 05-13
Figure 5: DMI-HIRLAM-E (left column) and DMI-HIRLAM-T15 (right column) forecasts fromtwo different initial times and verifying analyses of mean sea level pressure (dashed contours,interval 5 hPa) and wind at 10 m height (color scale in ����, wind barbs WMO standard) valid at 12UTC on 28 January 2002.
www.dmi.dk/dmi/tr05-13 page 14 of 31
Danish Meteorological InstituteTechnical Report 05-13
Figure 6: Same as Figure 5 , but for valid time 18 UTC on 28 January 2002. Note that the map areasin the D1C and T1X plots differ.
www.dmi.dk/dmi/tr05-13 page 15 of 31
Danish Meteorological InstituteTechnical Report 05-13
Figure 7: Same as Figure 6, but for valid time 00 UTC on 29 January 2002. Note that the map areasin the D1C and T1X plots differ.
www.dmi.dk/dmi/tr05-13 page 16 of 31
Danish Meteorological InstituteTechnical Report 05-13
Figure 8: DMI-HIRLAM-T15 (left column) and DMI-HIRLAM-S (right column) forecasts fromtwo different initial times and verifying analyses of mean sea level pressure (dashed contours,interval 5 hPa) and wind at 10 m height (color scale in ����, wind barbs WMO standard) valid at 12UTC on 28 January 2002.
www.dmi.dk/dmi/tr05-13 page 17 of 31
Danish Meteorological InstituteTechnical Report 05-13
Figure 9: Same as Figure 8, but for valid time 18 UTC on 28 January 2002.
www.dmi.dk/dmi/tr05-13 page 18 of 31
Danish Meteorological InstituteTechnical Report 05-13
Figure 10: Same as Figure 9, but for valid time 00 UTC on 29 January 2002.
www.dmi.dk/dmi/tr05-13 page 19 of 31
Danish Meteorological InstituteTechnical Report 05-13
10-12 12-14 14-16 16-18 18-20 20-22 22-24 24-26 26-28 28-30 30-32 32-34 34-36 36-40
954
962
970
978
986
994
1002
1010
1018
50N
52N
54N
56N
58N
60N
0 4E 8E 12E 16E 20E
10 m. wind m.s.l. pressure
T15 2005010700+039
10-12 12-14 14-16 16-18 18-20 20-22 22-24 24-26 26-28 28-30 30-32 32-34 34-36 36-40
958
966
974
982
990
998
1006
1014
50N
52N
54N
56N
58N
60N
0 4E 8E 12E 16E 20E
10 m. wind m.s.l. pressure
T15 2005010712+027
10-12 12-14 14-16 16-18 18-20 20-22 22-24 24-26 26-28 28-30 30-32 32-34 34-36 36-40
958
966
974
982
990
998
1006
1014
1022
50N
52N
54N
56N
58N
60N
0 4E 8E 12E 16E 20E
10 m. wind m.s.l. pressure
T15 2005010800+015
10-12 12-14 14-16 16-18 18-20 20-22 22-24 24-26 26-28 28-30 30-32 32-34 34-36 36-40
962
970
978
986
994
1002
1010
1018
50N
52N
54N
56N
58N
60N
0 4E 8E 12E 16E 20E
10 m. wind m.s.l. pressure
T15 2005010812+003
Figure 11: DMI-HIRLAM-T15 forecasts from different initial times of mean sea level pressure(dashed contours, interval 5 hPa) and wind at 10 m height (color scale in ����, wind barbs WMOstandard) valid at 15 UTC on 8 January 2005.
www.dmi.dk/dmi/tr05-13 page 20 of 31
Danish Meteorological InstituteTechnical Report 05-13
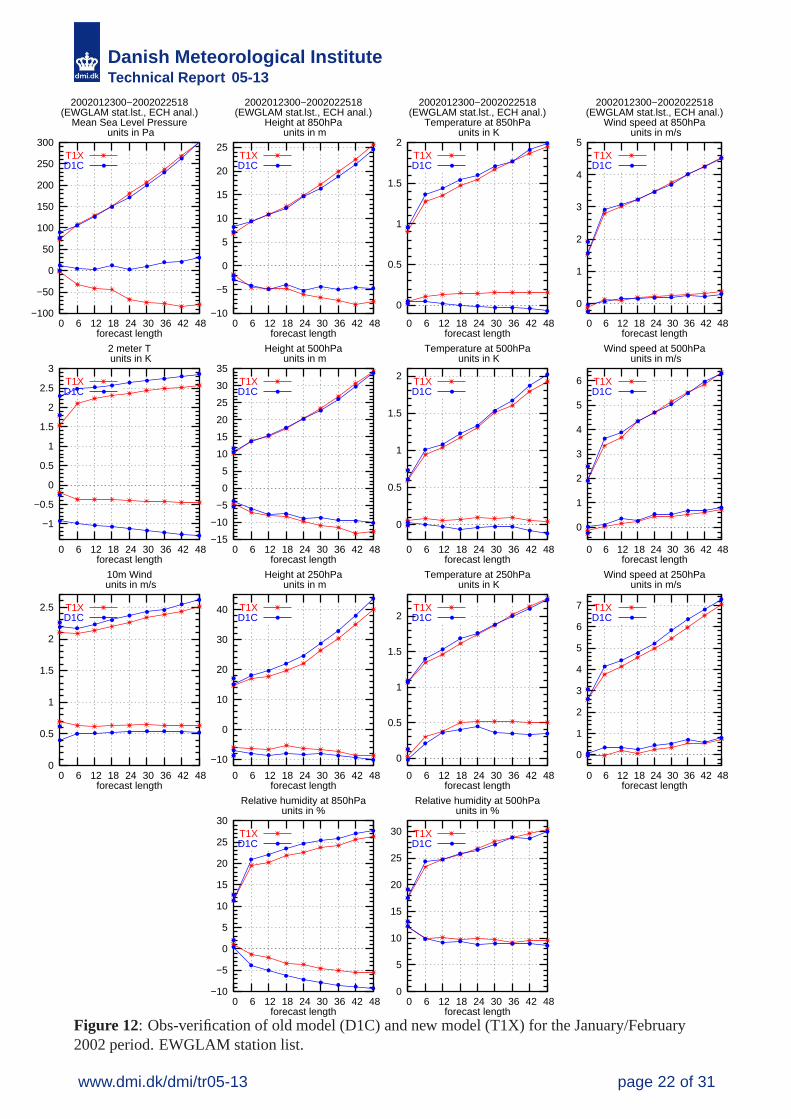
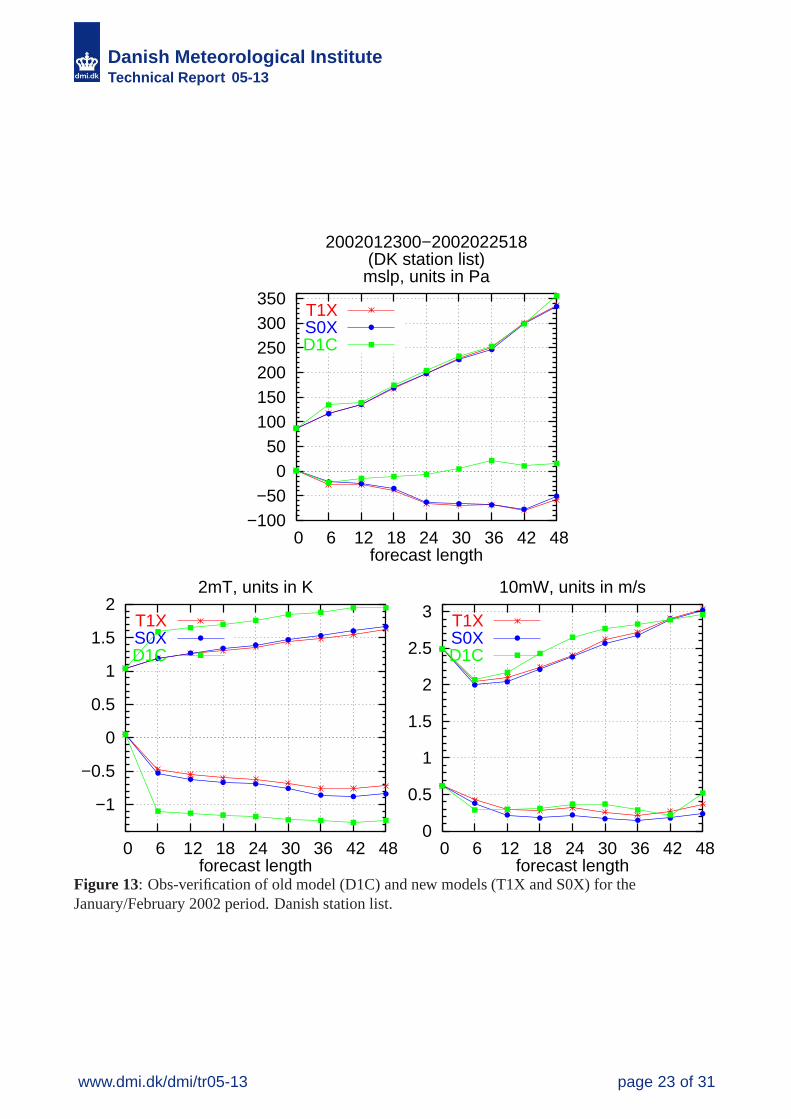
VerificationThe results are compared in different ways. Partly by case studies described earlier and by a standardobservation verification where forecast results are compared to standard SYNOP and radiosondeobservations using an EWGLAM1 station list and also for some surface variables against a Danishstation list. We have not included any precipitation verification scores here. Figure 12 shows biasscores (forecast value minus observed value) and root mean square (rms) for the surface variables10 m wind, mslp (mean sea level pressure) and 2 m temperature; for the upper level variablestemperature, wind speed and geopotential height at 850 hPa, 500 hPa and 250 hPa; and for relativehumidity at 850 hPa and 500 hPa as function of forecast length using the EWGLAM station list forthe old model (D1C) and the new model (T1X). Figure 13 shows bias-scores and rms-scores for thesurface variables 10 m wind, mslp and 2 m temperature using the Danish station list for the oldmodel (D1C) and the new models (S0X and T1X). For the EWGLAM station list the new model ingeneral has better or similar scores than the old model for the temperature and wind at the givenlevels; one exception being the 10 m wind speed bias. For mslp the old model has slightly betterrms-scores for medium forecast length and a somewhat better bias-score. For 850 hPa and 500 hPageopotential height the old model has slightly better rms-scores and better bias-scores. For 250 hPageopotential height and 850 hPa relative humidity, the new model has clearly better scores. For theDanish station list the new models has much better 2 m temperature scores in the period studied hereand marginal better 10 m wind speed scores. For mslp the old model has better bias-scores as alsoseen for the EWGLAM station list.
1European Working Group on Limited Area Model
www.dmi.dk/dmi/tr05-13 page 21 of 31
Danish Meteorological InstituteTechnical Report 05-13
−100
−50
0
50
100
150
200
250
300
0 6 12 18 24 30 36 42 48forecast length
2002012300−2002022518(EWGLAM stat.lst., ECH anal.)
Mean Sea Level Pressure units in Pa
T1XD1C
−1
−0.5
0
0.5
1
1.5
2
2.5
3
0 6 12 18 24 30 36 42 48forecast length
2 meter T units in K
T1XD1C
0
0.5
1
1.5
2
2.5
0 6 12 18 24 30 36 42 48forecast length
10m Wind units in m/s
T1XD1C
−10
−5
0
5
10
15
20
25
0 6 12 18 24 30 36 42 48forecast length
2002012300−2002022518(EWGLAM stat.lst., ECH anal.)
Height at 850hPa units in m
T1XD1C
−15
−10
−5
0
5
10
15
20
25
30
35
0 6 12 18 24 30 36 42 48forecast length
Height at 500hPa units in m
T1XD1C
−10
0
10
20
30
40
0 6 12 18 24 30 36 42 48forecast length
Height at 250hPa units in m
T1XD1C
−10
−5
0
5
10
15
20
25
30
0 6 12 18 24 30 36 42 48forecast length
Relative humidity at 850hPaunits in %
T1XD1C
0
0.5
1
1.5
2
0 6 12 18 24 30 36 42 48forecast length
2002012300−2002022518(EWGLAM stat.lst., ECH anal.)
Temperature at 850hPa units in K
T1XD1C
0
0.5
1
1.5
2
0 6 12 18 24 30 36 42 48forecast length
Temperature at 500hPa units in K
T1XD1C
0
0.5
1
1.5
2
0 6 12 18 24 30 36 42 48forecast length
Temperature at 250hPa units in K
T1XD1C
0
5
10
15
20
25
30
0 6 12 18 24 30 36 42 48forecast length
Relative humidity at 500hPaunits in %
T1XD1C
0
1
2
3
4
5
0 6 12 18 24 30 36 42 48forecast length
2002012300−2002022518(EWGLAM stat.lst., ECH anal.)
Wind speed at 850hPa units in m/s
T1XD1C
0
1
2
3
4
5
6
0 6 12 18 24 30 36 42 48forecast length
Wind speed at 500hPa units in m/s
T1XD1C
0
1
2
3
4
5
6
7
0 6 12 18 24 30 36 42 48forecast length
Wind speed at 250hPa units in m/s
T1XD1C
Figure 12: Obs-verification of old model (D1C) and new model (T1X) for the January/February2002 period. EWGLAM station list.
www.dmi.dk/dmi/tr05-13 page 22 of 31
Danish Meteorological InstituteTechnical Report 05-13
−100−50
0 50
100 150 200 250 300 350
0 6 12 18 24 30 36 42 48forecast length
2002012300−2002022518(DK station list)
mslp, units in Pa
T1XS0XD1C
−1
−0.5
0
0.5
1
1.5
2
0 6 12 18 24 30 36 42 48forecast length
2mT, units in K
T1XS0XD1C
0
0.5
1
1.5
2
2.5
3
0 6 12 18 24 30 36 42 48forecast length
10mW, units in m/s
T1XS0XD1C
Figure 13: Obs-verification of old model (D1C) and new models (T1X and S0X) for theJanuary/February 2002 period. Danish station list.
www.dmi.dk/dmi/tr05-13 page 23 of 31
Danish Meteorological InstituteTechnical Report 05-13
Storm surge model testAny major upgrade of the DMI-HIRLAM system has to be scrutinized by tests with DMI’soperational storm surge model. A storm surge model is highly sensitive to the meteorologicalforcing fields (10 m winds), and benchmark tests have been performed to ensure that the quality ofDMI’s storm surge warning system is at the very least maintained after a DMI-HIRLAM upgrade.
DMI’s operational storm surge model, Mike21, is a barotropic model, forced with DMI-HIRLAMsurface level pressure, and "stressed" 10 m wind fields (i.e. 10 m winds that give the HIRLAMsurface stress using the Mike21 wind drag formula). The Mike21 tests are run with 48 hour forecastsfor a number of test periods. A new run is made every six hours corresponding to a new HIRLAManalysis and forecast. No analysis takes place in Mike21.
The initial value of the sea level for the first run in a benchmark test period is taken from a ’hot file,’i.e., a 6 hour forecast from the operational set-up, valid at the beginning of the test period.Subsequent Mike21 runs in a test period are initiated from the new fields produced by the test run.
Four benchmark periods have been chosen for the Mike21-HIRLAM tests:Case ICase IICase IIICase IV
3 December 1999 hurricane with flooding in the Wadden Sea.28 January 2002 flooding in the Wadden Sea.21 February 2002 high water in the western Baltic.8 January 2005 flooding in the Wadden Sea.
The first three cases are "old benchmark periods", whereas case IV is a new, recent storm surgesituation, included here to demonstrate the quality of the storm surge system after the June 2004upgrade of the DMI-HIRLAM system.
The following DMI-HIRLAM models have been compared in the Mike21 benchmark tests:D1CT1XS0X
the operational 15 km model before the June 2004 upgrade.the new 15 km grid model.the new 5 km grid model (in CaseIV called S05 to indicate the change from test tooperational version).
Storm surge model test results
Time series for the predicted sea level at pilot stations calculated with Mike21 forced with fieldsfrom the three different DMI-HIRLAM versions D1C, T1X and S0X are compared with observedwater level from tide gauges, and shown for selected stations and forecast lengths in Figure 15 toFigure 17 for the Cases I-III.
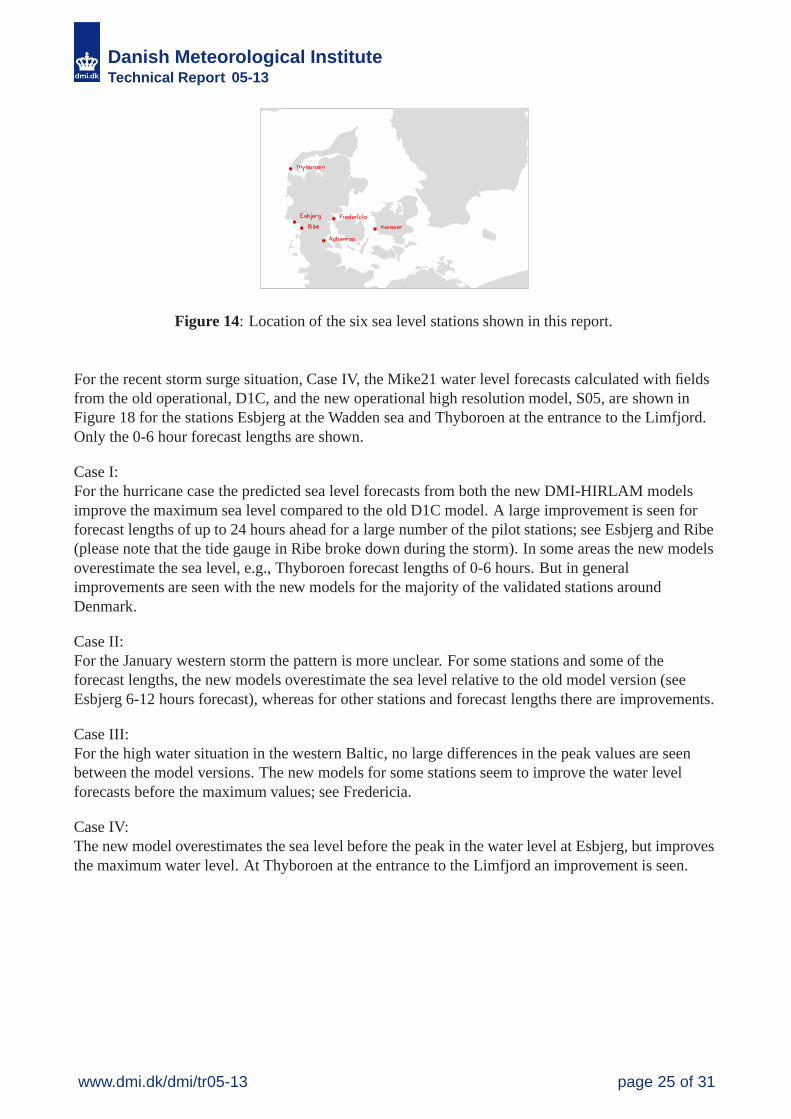
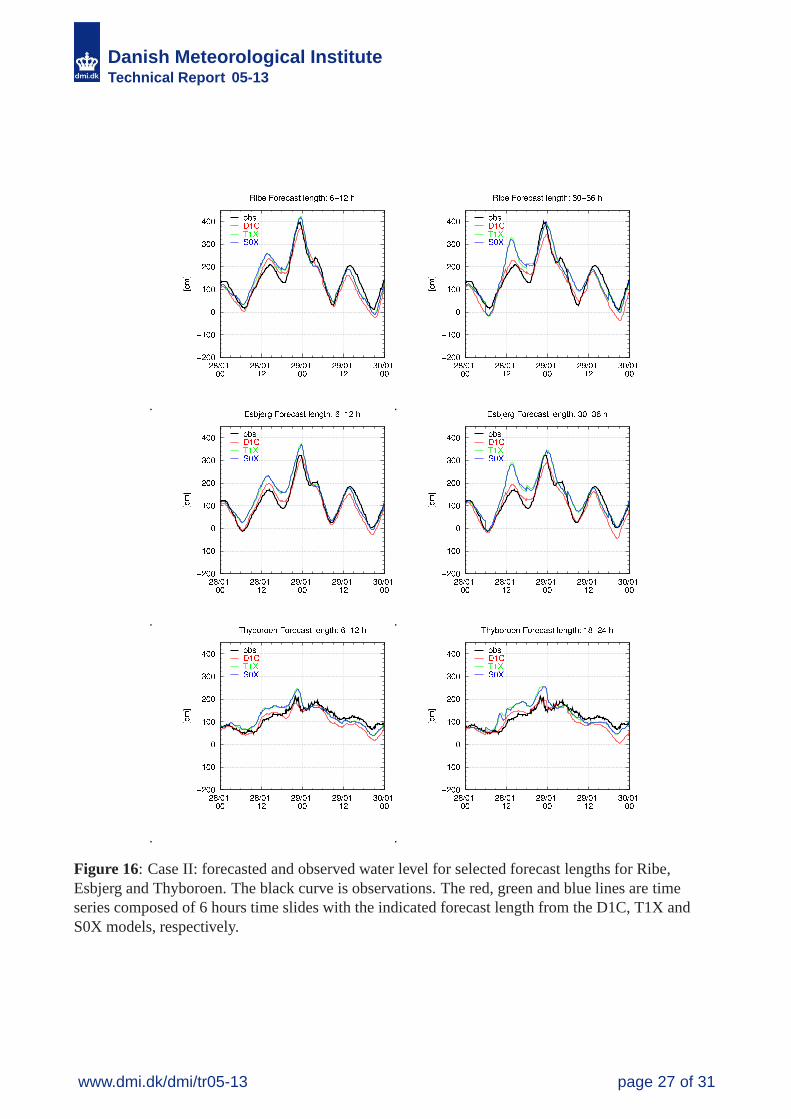
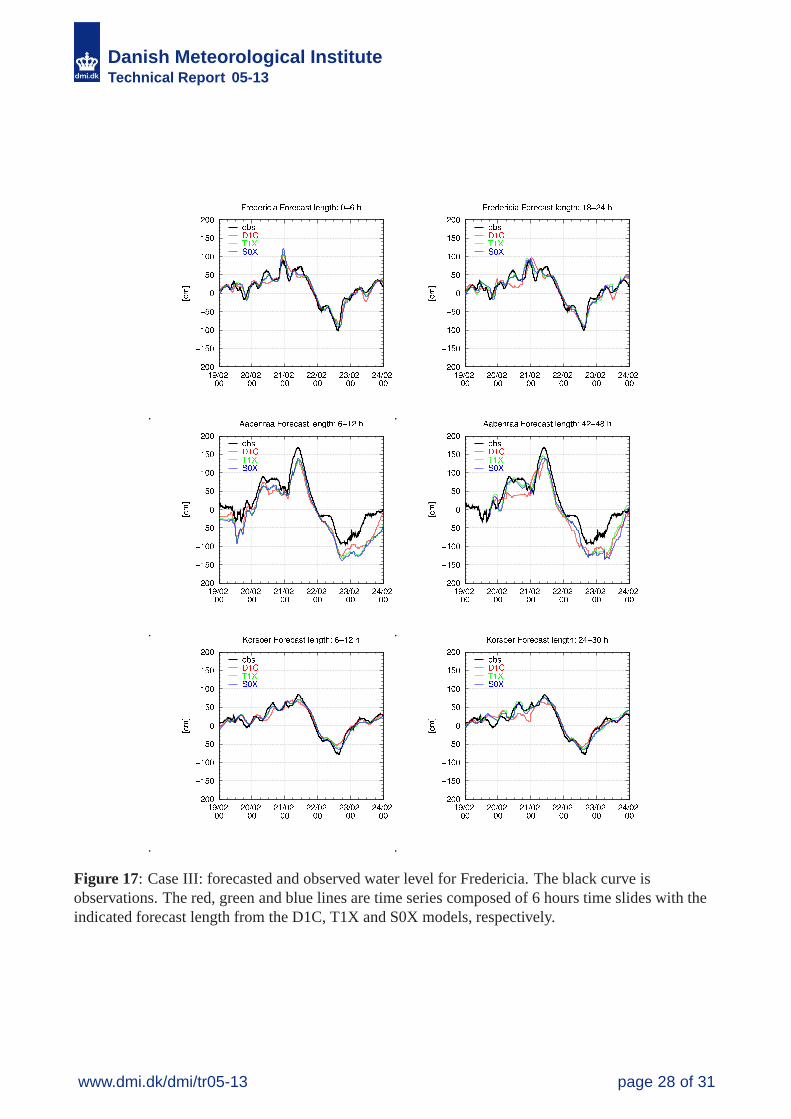
For each of the three old benchmark cases examples are shown from three stations. For the twosituations with westerly winds (Case I and Case II) we select Ribe, Esbjerg (in the Wadden Sea) andThyboroen (at the North Sea coast). For Case III with high water in the Western Baltic we selectFredericia, Aabenraa and Korsoer (see Figure 14).
The model calculated time series shown in the Figures are composed of 6 hours time slides with thesame forecast length (i.e. the 0-6 hours forecast time series consist of the first 6 hours time seriesfrom all the model runs). The time series shown do therefore consist of a discontinuity each 6 hour(at 00Z, 06Z, 12Z and 18Z), and the large jump seen in the time series, especially for the longforecast lengths, are caused by large differences between the different model runs.
www.dmi.dk/dmi/tr05-13 page 24 of 31
Danish Meteorological InstituteTechnical Report 05-13
Figure 14: Location of the six sea level stations shown in this report.
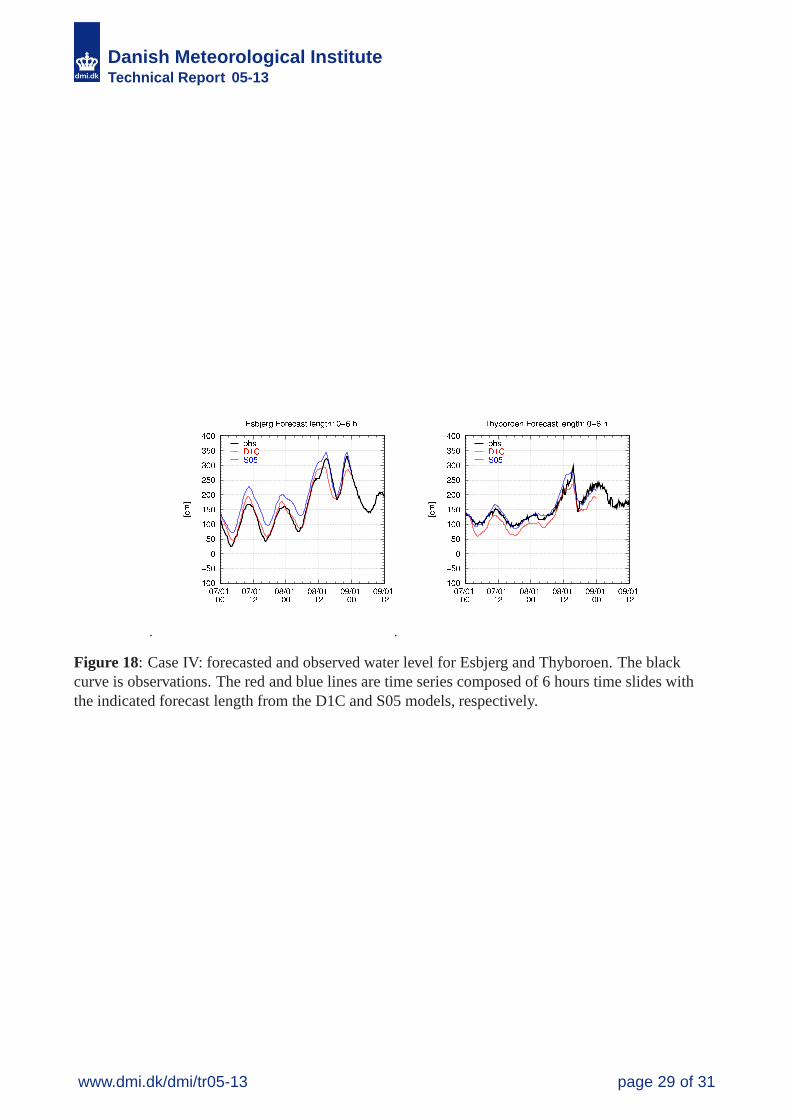
For the recent storm surge situation, Case IV, the Mike21 water level forecasts calculated with fieldsfrom the old operational, D1C, and the new operational high resolution model, S05, are shown inFigure 18 for the stations Esbjerg at the Wadden sea and Thyboroen at the entrance to the Limfjord.Only the 0-6 hour forecast lengths are shown.
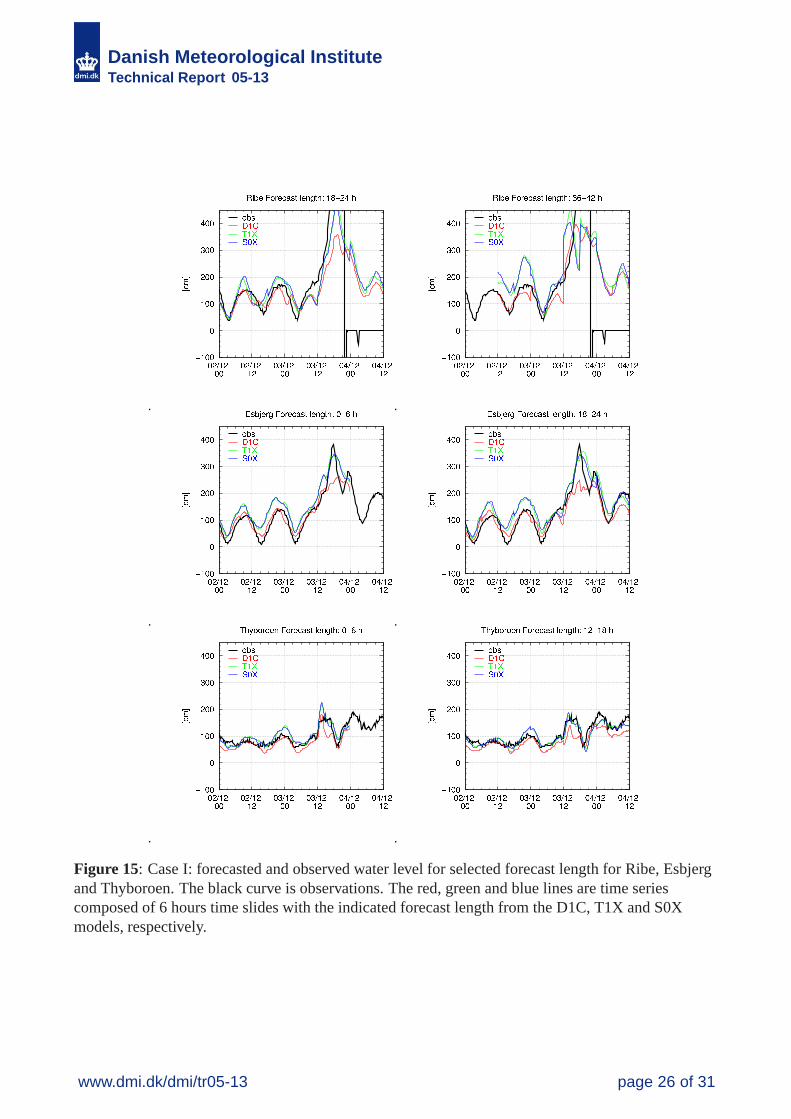
Case I:For the hurricane case the predicted sea level forecasts from both the new DMI-HIRLAM modelsimprove the maximum sea level compared to the old D1C model. A large improvement is seen forforecast lengths of up to 24 hours ahead for a large number of the pilot stations; see Esbjerg and Ribe(please note that the tide gauge in Ribe broke down during the storm). In some areas the new modelsoverestimate the sea level, e.g., Thyboroen forecast lengths of 0-6 hours. But in generalimprovements are seen with the new models for the majority of the validated stations aroundDenmark.
Case II:For the January western storm the pattern is more unclear. For some stations and some of theforecast lengths, the new models overestimate the sea level relative to the old model version (seeEsbjerg 6-12 hours forecast), whereas for other stations and forecast lengths there are improvements.
Case III:For the high water situation in the western Baltic, no large differences in the peak values are seenbetween the model versions. The new models for some stations seem to improve the water levelforecasts before the maximum values; see Fredericia.
Case IV:The new model overestimates the sea level before the peak in the water level at Esbjerg, but improvesthe maximum water level. At Thyboroen at the entrance to the Limfjord an improvement is seen.
www.dmi.dk/dmi/tr05-13 page 25 of 31
Danish Meteorological InstituteTechnical Report 05-13
Figure 15: Case I: forecasted and observed water level for selected forecast length for Ribe, Esbjergand Thyboroen. The black curve is observations. The red, green and blue lines are time seriescomposed of 6 hours time slides with the indicated forecast length from the D1C, T1X and S0Xmodels, respectively.
www.dmi.dk/dmi/tr05-13 page 26 of 31
Danish Meteorological InstituteTechnical Report 05-13
Figure 16: Case II: forecasted and observed water level for selected forecast lengths for Ribe,Esbjerg and Thyboroen. The black curve is observations. The red, green and blue lines are timeseries composed of 6 hours time slides with the indicated forecast length from the D1C, T1X andS0X models, respectively.
www.dmi.dk/dmi/tr05-13 page 27 of 31
Danish Meteorological InstituteTechnical Report 05-13
Figure 17: Case III: forecasted and observed water level for Fredericia. The black curve isobservations. The red, green and blue lines are time series composed of 6 hours time slides with theindicated forecast length from the D1C, T1X and S0X models, respectively.
www.dmi.dk/dmi/tr05-13 page 28 of 31
Danish Meteorological InstituteTechnical Report 05-13
Figure 18: Case IV: forecasted and observed water level for Esbjerg and Thyboroen. The blackcurve is observations. The red and blue lines are time series composed of 6 hours time slides withthe indicated forecast length from the D1C and S05 models, respectively.
www.dmi.dk/dmi/tr05-13 page 29 of 31
Danish Meteorological InstituteTechnical Report 05-13
ConclusionIt has been particularly important to verify that the DMI-HIRLAM-TS system performs well inwinter situations with severe weather and especially cases with extreme weather conditions with apotential risk for storm surge situations. The DMI-HIRLAM-TS system has been validated by threedifferent approaches and compared to the previously DMI-HIRLAM system. A standard verificationusing SYNOP and radiosonde observations has shown that DMI-HIRLAM-TS for the period 23January 2002 to 25 February 2002 gave reasonably good results compared to the previous version ofDMI-HIRLAM. For most quantities, the new set-up performed slightly better but the improvement isnot very significant. For the application of the Storm Surge Model, the verification of 10 m wind iscomparable with the previous version of DMI-HIRLAM however with a slightly higher positive bias.Case studies of three different situations with high water and severe weather have been subjectivelyverified. Two extreme weather events 3 December 1999 and 8 January 2005 were well forecastedwith the new DMI-HIRLAM-TS system. The 3 December 1999 storm was well forecasted by boththe new and old DMI-HIRLAM system. In the case of the 8 January 2005 storm, DMI-HIRLAM-TSpredicted this extreme event with high precision and the storm surge model was also able to producea very accurate prediction of the sea level in both time and space. It is worthwhile to note that theevent already is well forecasted in the 39 hour forecast and that the following forecasts all areconsistent with this early forecast. A third case with high water also gave the same impression of themodel performance. The storm surge model was tested on four different cases with flooding or highwater levels in the Danish waters. Although the improvement cannot be seen in all cases anddepends of the location of the observed sea level height and the individual cases, the overallconclusion from a subjective point of view is that the combined system of DMI-HIRLAM-TS andthe storm surge model has slightly improved the forecasted height of the sea level.
www.dmi.dk/dmi/tr05-13 page 30 of 31
Danish Meteorological InstituteTechnical Report 05-13
References
[Bjarne Amstrup et al. 2003] Results from DMI-HIRLAM pre-operational tests prior to the upgradein December 2002. DMI Technical Report 03-20.
[Xiang-Yu Huang and Xiaohua Yang, 2002] A new implementation of digital filtering initializationschemes for HIRLAM. Norrköping, March 2002. HIRLAM Technical Report, pp.33.
[Ulrik Smith Korsholm and Claus Petersen, 2004] Reference Hirlam on NEC SX-6, Part 1. DMITechnical Report 04-23.
[Niels W. Nielsen and Bent Hansen Sass 2004] Rotation of the surface stress as a tool inparameterization of atmospheric turbulence. DMI Scientific Report 04-07.
[Bent Hansen Sass et al. 2002] The operational DMI-HIRLAM system - 2002-version. DMITechnical Report 02-05.
[Per Undén et al. 2002] HIRLAM-5 Scientific Documentation.
[Xiaohua Yang, 2004] Adaptation of the Reference HIRLAM in DMI’s operational suite. April2004. HIRLAM Newsletter, 45, 81-91.
[Xiaohua Yang et al. 2005] The DMI-HIRLAM upgrade in June 2004. DMI Technical Report05-09.
Previous reportsPrevious reports from the Danish Meteorological Institute can be found at:http://www.dmi.dk/dmi/dmi-publikationer.htm
www.dmi.dk/dmi/tr05-13 page 31 of 31