Embed Size (px)
Citation preview
Google Technical Report dapper-2010-1, April 2010
Dapper, a Large-Scale Distributed Systems Tracing Infrastructure
Benjamin H. Sigelman, Luiz Andre Barroso, Mike Burrows, Pat Stephenson,Manoj Plakal, Donald Beaver, Saul Jaspan, Chandan Shanbhag
Abstract
Modern Internet services are often implemented as com-plex, large-scale distributed systems. These applicationsare constructed from collections of software modulesthat may be developed by different teams, perhaps indifferent programming languages, and could span manythousands of machines across multiple physical facili-ties. Tools that aid in understanding system behaviorand reasoning about performance issues are invaluablein such an environment.
Here we introduce the design of Dapper, Google’sproduction distributed systems tracing infrastructure,and describe how our design goals of low overhead,application-level transparency, and ubiquitous deploy-ment on a very large scale system were met. Dappershares conceptual similarities with other tracing systems,particularly Magpie [3] and X-Trace [12], but certain de-sign choices were made that have been key to its successin our environment, such as the use of sampling and re-stricting the instrumentation to a rather small number ofcommon libraries.
The main goal of this paper is to report on our ex-perience building, deploying and using the system forover two years, since Dapper’s foremost measure of suc-cess has been its usefulness to developer and operationsteams. Dapper began as a self-contained tracing tool butevolved into a monitoring platform which has enabledthe creation of many different tools, some of which werenot anticipated by its designers. We describe a few of theanalysis tools that have been built using Dapper, sharestatistics about its usage within Google, present some ex-ample use cases, and discuss lessons learned so far.
1 Introduction
We built Dapper to provide Google’s developers withmore information about the behavior of complex dis-tributed systems. Such systems are of special interest
because large collections of small servers are a partic-ularly cost-efficient platform for Internet services work-loads [4]. Understanding system behavior in this contextrequires observing related activities across many differ-ent programs and machines.
A web-search example will illustrate some of the chal-lenges such a system needs to address. A front-end ser-vice may distribute a web query to many hundreds ofquery servers, each searching within its own piece ofthe index. The query may also be sent to a numberof other sub-systems that may process advertisements,check spelling, or look for specialized results, includ-ing images, videos, news, and so on. Results from allof these services are selectively combined in the resultspage; we call this model “universal search” [6]. In total,thousands of machines and many different services mightbe needed to process one universal search query. More-over, web-search users are sensitive to delays, which canbe caused by poor performance in any sub-system. Anengineer looking only at the overall latency may knowthere is a problem, but may not be able to guess whichservice is at fault, nor why it is behaving poorly. First, theengineer may not be aware precisely which services arein use; new services and pieces may be added and modi-fied from week to week, both to add user-visible featuresand to improve other aspects such as performance or se-curity. Second, the engineer will not be an expert on theinternals of every service; each one is built and main-tained by a different team. Third, services and machinesmay be shared simultaneously by many different clients,so a performance artifact may be due to the behavior ofanother application. For example, front-ends may handlemany different request types, or a storage system such asBigtable [8] may be most efficient when shared acrossmultiple applications.
The scenario described above gives rise to two funda-mental requirements for Dapper: ubiquitous deployment,and continuous monitoring. Ubiquity is important sincethe usefulness of a tracing infrastructure can be severly
impacted if even small parts of the system are not be-ing monitored. In addition, monitoring should alwaysbe turned on, because it is often the case that unusual orotherwise noteworthy system behavior is difficult or im-possible to reproduce. Three concrete design goals resultfrom these requirements:
• Low overhead: the tracing system should have neg-ligible performance impact on running services. Insome highly optimized services even small monitor-ing overheads are easily noticeable, and might com-pel the deployment teams to turn the tracing systemoff.
• Application-level transparency: programmersshould not need to be aware of the tracing system.A tracing infrastructure that relies on active collab-oration from application-level developers in orderto function becomes extremely fragile, and is oftenbroken due to instrumentation bugs or omissions,therefore violating the ubiquity requirement. Thisis especially important in a fast-paced developmentenvironment such as ours.
• Scalability: it needs to handle the size of Google’sservices and clusters for at least the next few years.
An additional design goal is for tracing data to beavailable for analysis quickly after it is generated: ide-ally within a minute. Although a trace analysis systemoperating on hours-old data is still quite valuable, theavailability of fresh information enables faster reactionto production anomalies.
True application-level transparency, possibly our mostchallenging design goal, was achieved by restrictingDapper’s core tracing instrumentation to a small corpusof ubiquitous threading, control flow, and RPC librarycode. Making the system scalable and reducing perfor-mance overhead was facilitated by the use of adaptivesampling, as will be described in Section 4.4. The re-sulting system also includes code to collect traces, toolsto visualize them, and libraries and APIs (ApplicationProgramming Interfaces) to analyze large collections oftraces. Although Dapper alone is sometimes sufficientfor a developer to identify the source of a performanceanomaly, it is not intended to replace all other tools. Wehave found that Dapper’s system-wide data often focusesa performance investigation so that other tools can be ap-plied locally.
1.1 Summary of contributionsThe design space of distributed systems tracing tools hasbeen explored in a number of excellent previous articles,among which Pinpoint [9], Magpie [3] and X-Trace [12]are most closely related to Dapper. These systems tendto be described in the research literature at a very early
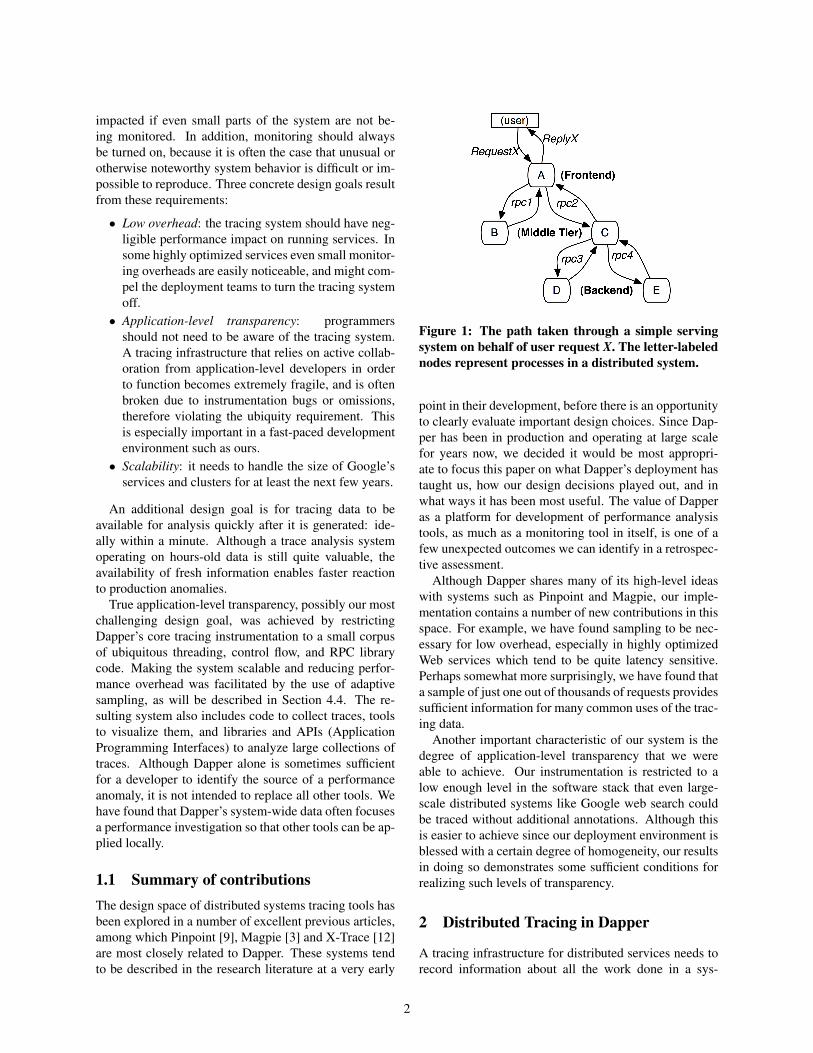
Figure 1: The path taken through a simple servingsystem on behalf of user request X. The letter-labelednodes represent processes in a distributed system.
point in their development, before there is an opportunityto clearly evaluate important design choices. Since Dap-per has been in production and operating at large scalefor years now, we decided it would be most appropri-ate to focus this paper on what Dapper’s deployment hastaught us, how our design decisions played out, and inwhat ways it has been most useful. The value of Dapperas a platform for development of performance analysistools, as much as a monitoring tool in itself, is one of afew unexpected outcomes we can identify in a retrospec-tive assessment.
Although Dapper shares many of its high-level ideaswith systems such as Pinpoint and Magpie, our imple-mentation contains a number of new contributions in thisspace. For example, we have found sampling to be nec-essary for low overhead, especially in highly optimizedWeb services which tend to be quite latency sensitive.Perhaps somewhat more surprisingly, we have found thata sample of just one out of thousands of requests providessufficient information for many common uses of the trac-ing data.
Another important characteristic of our system is thedegree of application-level transparency that we wereable to achieve. Our instrumentation is restricted to alow enough level in the software stack that even large-scale distributed systems like Google web search couldbe traced without additional annotations. Although thisis easier to achieve since our deployment environment isblessed with a certain degree of homogeneity, our resultsin doing so demonstrates some sufficient conditions forrealizing such levels of transparency.
2 Distributed Tracing in Dapper
A tracing infrastructure for distributed services needs torecord information about all the work done in a sys-
2
tem on behalf of a given initiator. For example, Fig-ure 1 shows a service with 5 servers: a front-end (A),two middle-tiers (B and C) and two backends (D and E).When a user request (the initiator in this case) arrives atthe front end, it sends two RPCs to servers B and C. Bcan respond right away, but C requires work from back-ends D and E before it can reply to A, which in turn re-sponds to the originating request. A simple yet usefuldistributed trace for this request would be a collectionof message identifiers and timestamped events for everymessage sent and received at each server.
Two classes of solutions have been proposed to ag-gregate this information so that one can associate allrecord entries with a given initiator (e.g., RequestX inFigure 1), black-box and annotation-based monitoringschemes. Black-box schemes [1, 15, 2] assume there isno additional information other than the message recorddescribed above, and use statistical regression techniquesto infer that association. Annotation-based schemes[3, 12, 9, 16] rely on applications or middleware toexplicitly tag every record with a global identifier thatlinks these message records back to the originating re-quest. While black-box schemes are more portable thanannotation-based methods, they need more data in orderto gain sufficient accuracy due to their reliance on sta-tistical inference. The key disadvantage of annotation-based methods is, obviously, the need to instrument pro-grams. In our environment, since all applications use thesame threading model, control flow and RPC system, wefound that it was possible to restrict instrumentation toa small set of common libraries, and achieve a monitor-ing system that is effectively transparent to applicationdevelopers.
We tend to think of a Dapper trace as a tree of nestedRPCs. However, our core data model is not restrictedto our particular RPC framework; we also trace activ-ities such as SMTP sessions in Gmail, HTTP requestsfrom the outside world, and outbound queries to SQLservers. Formally, we model Dapper traces using trees,spans, and annotations.
2.1 Trace trees and spans
In a Dapper trace tree, the tree nodes are basic units ofwork which we refer to as spans. The edges indicate acasual relationship between a span and its parent span.Independent of its place in a larger trace tree, though, aspan is also a simple log of timestamped records whichencode the span’s start and end time, any RPC timingdata, and zero or more application-specific annotationsas discussed in Section 2.3.
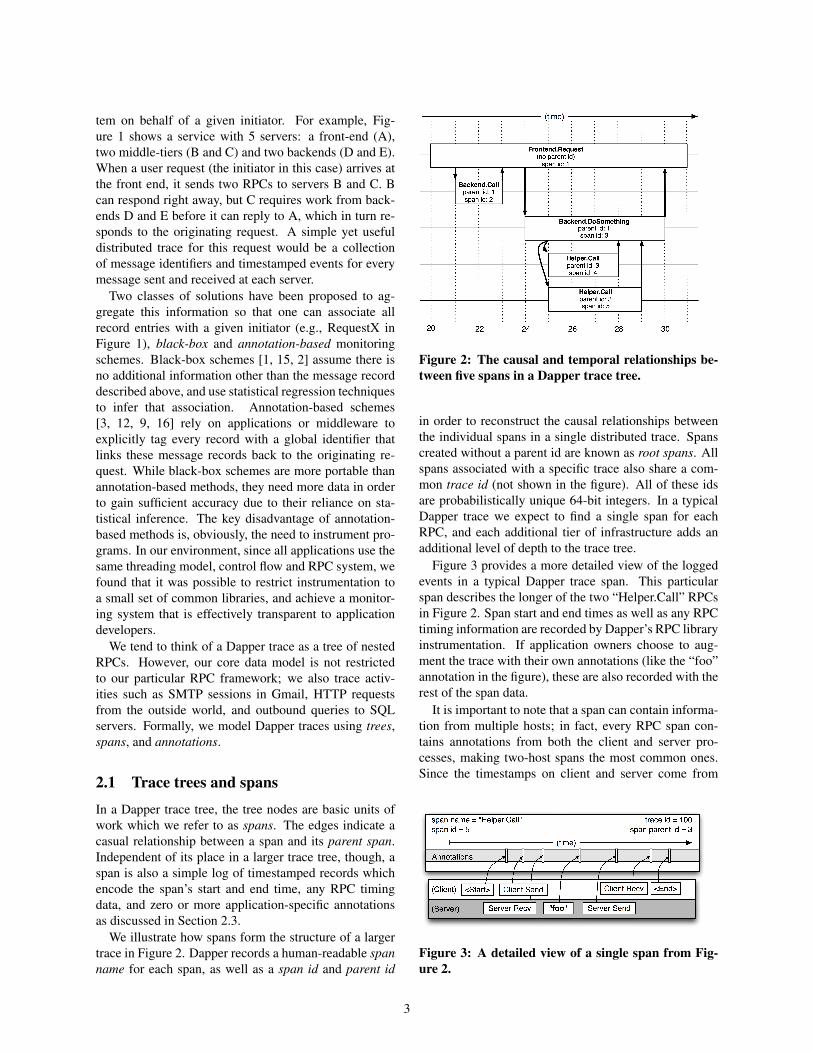
We illustrate how spans form the structure of a largertrace in Figure 2. Dapper records a human-readable spanname for each span, as well as a span id and parent id
Figure 2: The causal and temporal relationships be-tween five spans in a Dapper trace tree.
in order to reconstruct the causal relationships betweenthe individual spans in a single distributed trace. Spanscreated without a parent id are known as root spans. Allspans associated with a specific trace also share a com-mon trace id (not shown in the figure). All of these idsare probabilistically unique 64-bit integers. In a typicalDapper trace we expect to find a single span for eachRPC, and each additional tier of infrastructure adds anadditional level of depth to the trace tree.
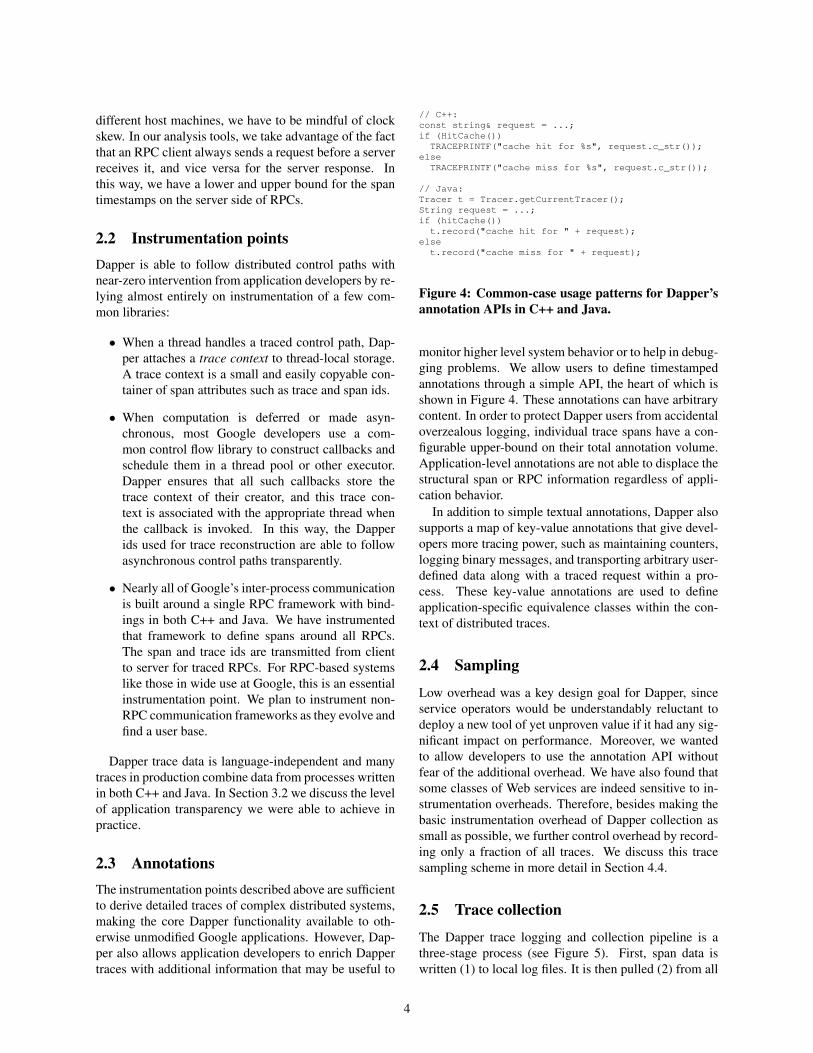
Figure 3 provides a more detailed view of the loggedevents in a typical Dapper trace span. This particularspan describes the longer of the two “Helper.Call” RPCsin Figure 2. Span start and end times as well as any RPCtiming information are recorded by Dapper’s RPC libraryinstrumentation. If application owners choose to aug-ment the trace with their own annotations (like the “foo”annotation in the figure), these are also recorded with therest of the span data.
It is important to note that a span can contain informa-tion from multiple hosts; in fact, every RPC span con-tains annotations from both the client and server pro-cesses, making two-host spans the most common ones.Since the timestamps on client and server come from
Figure 3: A detailed view of a single span from Fig-ure 2.
3
different host machines, we have to be mindful of clockskew. In our analysis tools, we take advantage of the factthat an RPC client always sends a request before a serverreceives it, and vice versa for the server response. Inthis way, we have a lower and upper bound for the spantimestamps on the server side of RPCs.
2.2 Instrumentation pointsDapper is able to follow distributed control paths withnear-zero intervention from application developers by re-lying almost entirely on instrumentation of a few com-mon libraries:
• When a thread handles a traced control path, Dap-per attaches a trace context to thread-local storage.A trace context is a small and easily copyable con-tainer of span attributes such as trace and span ids.
• When computation is deferred or made asyn-chronous, most Google developers use a com-mon control flow library to construct callbacks andschedule them in a thread pool or other executor.Dapper ensures that all such callbacks store thetrace context of their creator, and this trace con-text is associated with the appropriate thread whenthe callback is invoked. In this way, the Dapperids used for trace reconstruction are able to followasynchronous control paths transparently.
• Nearly all of Google’s inter-process communicationis built around a single RPC framework with bind-ings in both C++ and Java. We have instrumentedthat framework to define spans around all RPCs.The span and trace ids are transmitted from clientto server for traced RPCs. For RPC-based systemslike those in wide use at Google, this is an essentialinstrumentation point. We plan to instrument non-RPC communication frameworks as they evolve andfind a user base.
Dapper trace data is language-independent and manytraces in production combine data from processes writtenin both C++ and Java. In Section 3.2 we discuss the levelof application transparency we were able to achieve inpractice.
2.3 AnnotationsThe instrumentation points described above are sufficientto derive detailed traces of complex distributed systems,making the core Dapper functionality available to oth-erwise unmodified Google applications. However, Dap-per also allows application developers to enrich Dappertraces with additional information that may be useful to
// C++:const string& request = ...;if (HitCache())TRACEPRINTF("cache hit for %s", request.c_str());
elseTRACEPRINTF("cache miss for %s", request.c_str());
// Java:Tracer t = Tracer.getCurrentTracer();String request = ...;if (hitCache())t.record("cache hit for " + request);
elset.record("cache miss for " + request);
Figure 4: Common-case usage patterns for Dapper’sannotation APIs in C++ and Java.
monitor higher level system behavior or to help in debug-ging problems. We allow users to define timestampedannotations through a simple API, the heart of which isshown in Figure 4. These annotations can have arbitrarycontent. In order to protect Dapper users from accidentaloverzealous logging, individual trace spans have a con-figurable upper-bound on their total annotation volume.Application-level annotations are not able to displace thestructural span or RPC information regardless of appli-cation behavior.
In addition to simple textual annotations, Dapper alsosupports a map of key-value annotations that give devel-opers more tracing power, such as maintaining counters,logging binary messages, and transporting arbitrary user-defined data along with a traced request within a pro-cess. These key-value annotations are used to defineapplication-specific equivalence classes within the con-text of distributed traces.
2.4 Sampling
Low overhead was a key design goal for Dapper, sinceservice operators would be understandably reluctant todeploy a new tool of yet unproven value if it had any sig-nificant impact on performance. Moreover, we wantedto allow developers to use the annotation API withoutfear of the additional overhead. We have also found thatsome classes of Web services are indeed sensitive to in-strumentation overheads. Therefore, besides making thebasic instrumentation overhead of Dapper collection assmall as possible, we further control overhead by record-ing only a fraction of all traces. We discuss this tracesampling scheme in more detail in Section 4.4.
2.5 Trace collection
The Dapper trace logging and collection pipeline is athree-stage process (see Figure 5). First, span data iswritten (1) to local log files. It is then pulled (2) from all
4
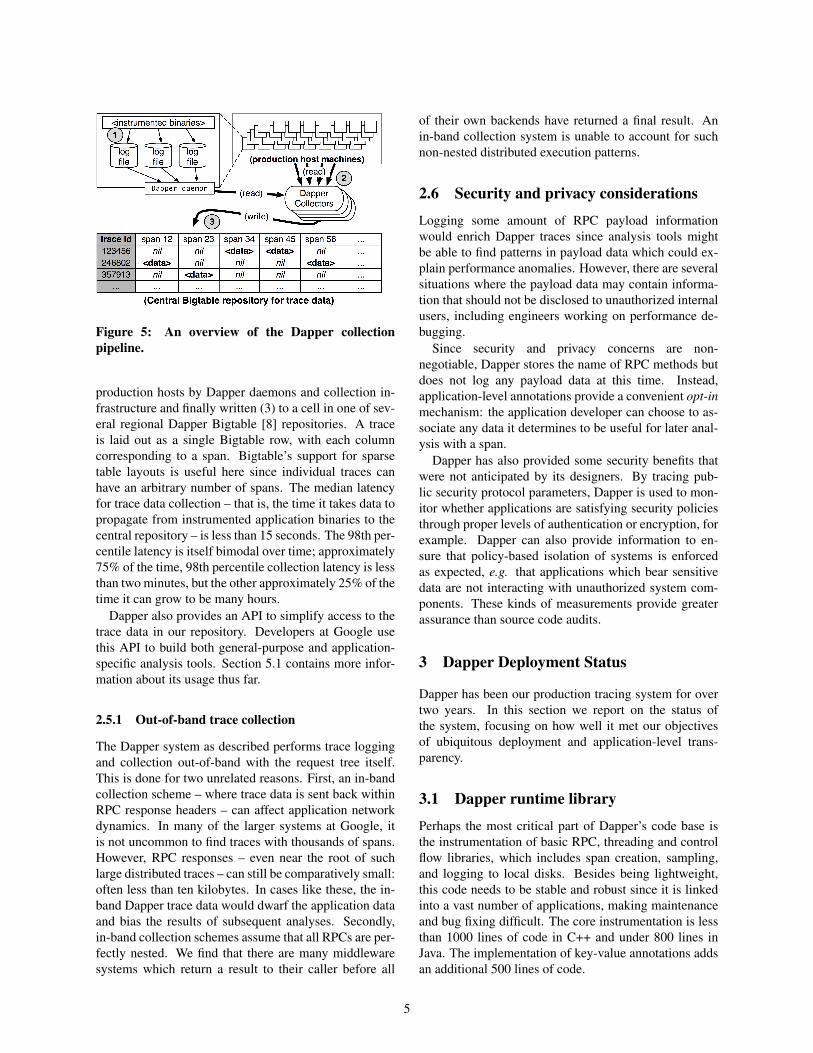
Figure 5: An overview of the Dapper collectionpipeline.
production hosts by Dapper daemons and collection in-frastructure and finally written (3) to a cell in one of sev-eral regional Dapper Bigtable [8] repositories. A traceis laid out as a single Bigtable row, with each columncorresponding to a span. Bigtable’s support for sparsetable layouts is useful here since individual traces canhave an arbitrary number of spans. The median latencyfor trace data collection – that is, the time it takes data topropagate from instrumented application binaries to thecentral repository – is less than 15 seconds. The 98th per-centile latency is itself bimodal over time; approximately75% of the time, 98th percentile collection latency is lessthan two minutes, but the other approximately 25% of thetime it can grow to be many hours.
Dapper also provides an API to simplify access to thetrace data in our repository. Developers at Google usethis API to build both general-purpose and application-specific analysis tools. Section 5.1 contains more infor-mation about its usage thus far.
2.5.1 Out-of-band trace collection
The Dapper system as described performs trace loggingand collection out-of-band with the request tree itself.This is done for two unrelated reasons. First, an in-bandcollection scheme – where trace data is sent back withinRPC response headers – can affect application networkdynamics. In many of the larger systems at Google, itis not uncommon to find traces with thousands of spans.However, RPC responses – even near the root of suchlarge distributed traces – can still be comparatively small:often less than ten kilobytes. In cases like these, the in-band Dapper trace data would dwarf the application dataand bias the results of subsequent analyses. Secondly,in-band collection schemes assume that all RPCs are per-fectly nested. We find that there are many middlewaresystems which return a result to their caller before all
of their own backends have returned a final result. Anin-band collection system is unable to account for suchnon-nested distributed execution patterns.
2.6 Security and privacy considerations
Logging some amount of RPC payload informationwould enrich Dapper traces since analysis tools mightbe able to find patterns in payload data which could ex-plain performance anomalies. However, there are severalsituations where the payload data may contain informa-tion that should not be disclosed to unauthorized internalusers, including engineers working on performance de-bugging.
Since security and privacy concerns are non-negotiable, Dapper stores the name of RPC methods butdoes not log any payload data at this time. Instead,application-level annotations provide a convenient opt-inmechanism: the application developer can choose to as-sociate any data it determines to be useful for later anal-ysis with a span.
Dapper has also provided some security benefits thatwere not anticipated by its designers. By tracing pub-lic security protocol parameters, Dapper is used to mon-itor whether applications are satisfying security policiesthrough proper levels of authentication or encryption, forexample. Dapper can also provide information to en-sure that policy-based isolation of systems is enforcedas expected, e.g. that applications which bear sensitivedata are not interacting with unauthorized system com-ponents. These kinds of measurements provide greaterassurance than source code audits.
3 Dapper Deployment Status
Dapper has been our production tracing system for overtwo years. In this section we report on the status ofthe system, focusing on how well it met our objectivesof ubiquitous deployment and application-level trans-parency.
3.1 Dapper runtime library
Perhaps the most critical part of Dapper’s code base isthe instrumentation of basic RPC, threading and controlflow libraries, which includes span creation, sampling,and logging to local disks. Besides being lightweight,this code needs to be stable and robust since it is linkedinto a vast number of applications, making maintenanceand bug fixing difficult. The core instrumentation is lessthan 1000 lines of code in C++ and under 800 lines inJava. The implementation of key-value annotations addsan additional 500 lines of code.
5
3.2 Production coverage
Dapper penetration can be assessed in two dimensions:the fraction of production processes that can generateDapper traces (i.e., those that are linked with Dapper-instrumented runtime libraries) and the fraction of pro-duction machines running Dapper’s trace collection dae-mon. Dapper’s daemon is part of our basic machineimage, making it present on virtually every server atGoogle. It is difficult to determine the precise fractionof Dapper-ready processes since processes generatingno trace information are invisible to Dapper. However,given how ubiquitous Dapper-instrumented libraries are,we estimate that nearly every Google production processsupports tracing.
There are cases where Dapper is unable to follow thecontrol path correctly. These typically stem from the useof non-standard control-flow primitives, or when Dap-per mistakenly attributes causality to unrelated events.Dapper provides a simple library to help developerscontrol trace propagation manually as a work-around.Presently there are 40 C++ applications and 33 Java ap-plications that required some manual trace propagation,corresponding to a small fraction of the totals whichnumber in the thousands. There is also a very small num-ber of programs that use uninstrumented communicationlibraries (raw TCP sockets, or SOAP RPCs, for exam-ple), and therefore do not support Dapper tracing. Dap-per support can be added to these applications, if it isdeemed important.
Dapper tracing can be turned off as a production safetymeasure. In fact it was off by default during its earlydays, until we built confidence in its stability and lowoverhead. The Dapper team performs occasional auditslooking for changes to configurations where tracing isturned off by a service owner. Such changes are rare andusually stem from concerns about monitoring overhead.All of these changes to date have been reverted upon fur-ther investigation and measurement of the actual over-head, which has been immaterial.
3.3 Use of trace annotations
Programmers tend to use application-specific annota-tions either as a kind of distributed debug log file orto classify traces by some application-specific feature.For example, all Bigtable requests are annotated with thename of the table being accessed. Currently, 70% of allDapper spans and 90% of all Dapper traces have at leastone application-specified annotation.
41 Java and 68 C++ applications have added cus-tom application annotations in order to better understandintra-span activity in their services. It is worth notingthat our Java developers who have adopted the anno-
tation API have made more annotations per span thantheir C++ counterparts thus far. This may be becauseour Java workloads tend to be closer to the end user;these sorts of applications often handle a wider mix ofrequests and consequently have comparatively complexcontrol paths.
4 Managing Tracing Overhead
The cost of a tracing system is felt as performance degra-dation in the system being monitored due to both tracegeneration and collection overheads, and as the amountof resources needed to store and analyze trace data. Al-though one can argue that a valuable tracing infrastruc-ture could be worth a performance penalty, we believedthat initial adoption would be greatly facilitated if thebaseline overheads could be demonstrably negligible.
In this section we present the overhead of the mainDapper instrumentation operations, the overhead of thetrace collection, and the impact of Dapper on a produc-tion workload. We also describe how Dapper’s adaptivetrace sampling mechanism helps us balance the need forlow overhead and the desire for representative traces.
4.1 Trace generation overhead
Trace generation overhead is the most critical segmentof Dapper’s performance footprint, since collection andanalysis can more easily be turned off in an emergency.The most important sources of trace generation overheadin the Dapper runtime libraries are creating and destroy-ing spans and annotations, and logging them to local diskfor subsequent collection. Root span creation and de-struction takes 204 nanoseconds on average, while thesame operation for non-root spans takes 176 nanosec-onds. The difference is the added cost of allocating aglobally unique trace id for root spans.
The cost of additional span annotations is almost neg-ligible if the span is not sampled for tracing, consistingof a thread-local lookup in the Dapper runtime, averag-ing about 9 nanoseconds. If it is sampled, annotating thetrace with a string literal – much like what’s shown inFigure 4 – costs 40 nanoseconds on average. These mea-surements were made on a 2.2GHz x86 server.
Writes to local disk are the most expensive operationin Dapper’s runtime library, but their visible overheadis much reduced since each disk write coalesces multi-ple log file write operations and executes asynchronouslywith respect to the traced application. Nevertheless, logwrite activity can have a perceptible impact on high-throughput application performance, especially if all re-quests are being traced. We quantify this overhead in aWeb search workload in Section 4.3.
6
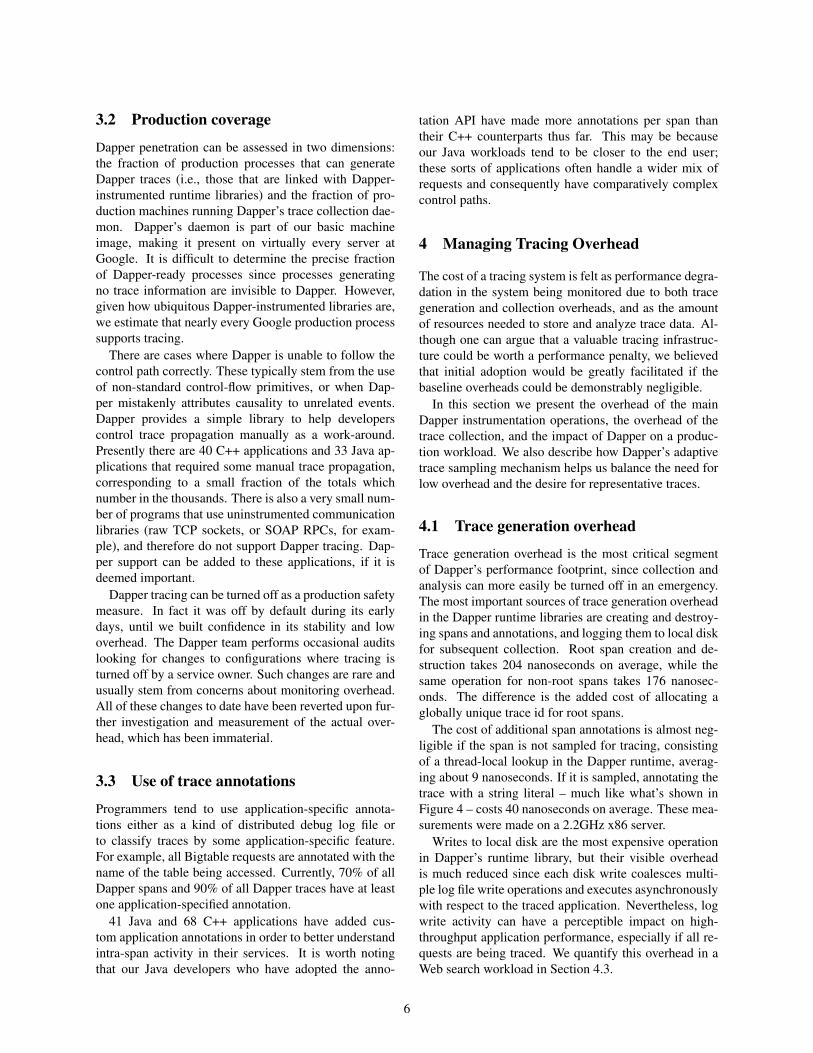
Process Count Data Rate Daemon CPU Usage(per host) (per process) (single CPU core)
25 10K/sec 0.125%10 200K/sec 0.267%50 2K/sec 0.130%
Table 1: CPU resource usage for the Dapper daemonduring load testing
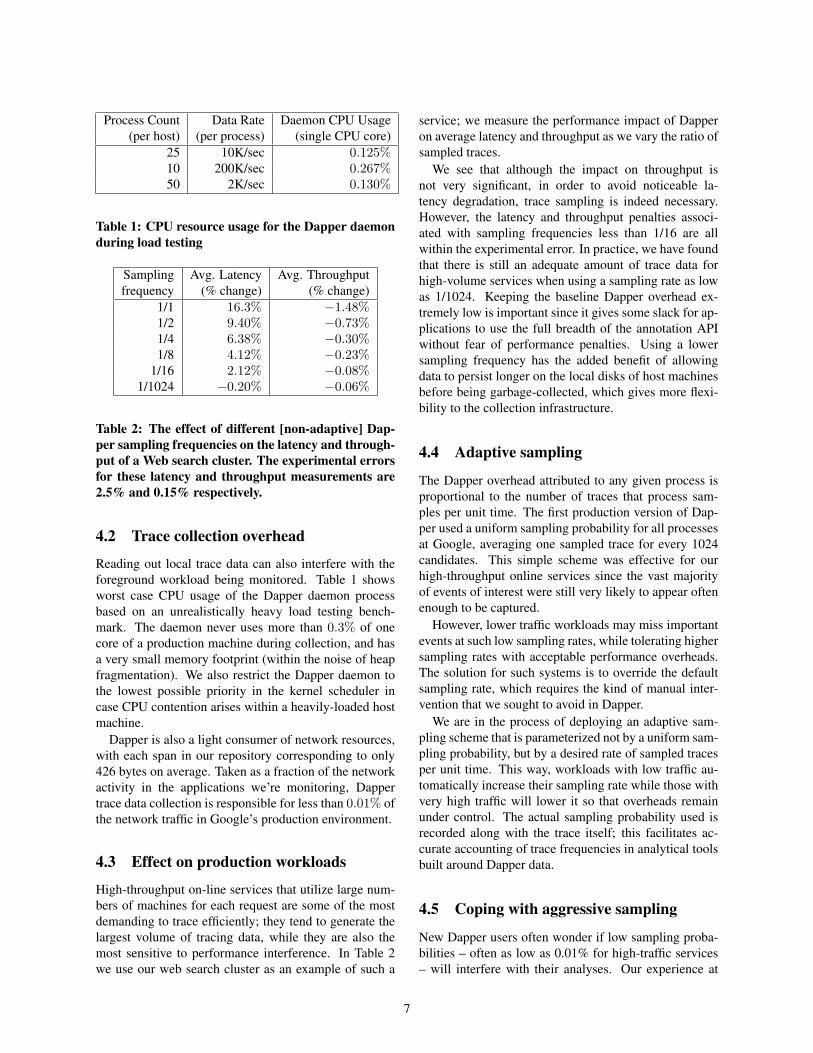
Sampling Avg. Latency Avg. Throughputfrequency (% change) (% change)
1/1 16.3% −1.48%1/2 9.40% −0.73%1/4 6.38% −0.30%1/8 4.12% −0.23%
1/16 2.12% −0.08%1/1024 −0.20% −0.06%
Table 2: The effect of different [non-adaptive] Dap-per sampling frequencies on the latency and through-put of a Web search cluster. The experimental errorsfor these latency and throughput measurements are2.5% and 0.15% respectively.
4.2 Trace collection overhead
Reading out local trace data can also interfere with theforeground workload being monitored. Table 1 showsworst case CPU usage of the Dapper daemon processbased on an unrealistically heavy load testing bench-mark. The daemon never uses more than 0.3% of onecore of a production machine during collection, and hasa very small memory footprint (within the noise of heapfragmentation). We also restrict the Dapper daemon tothe lowest possible priority in the kernel scheduler incase CPU contention arises within a heavily-loaded hostmachine.
Dapper is also a light consumer of network resources,with each span in our repository corresponding to only426 bytes on average. Taken as a fraction of the networkactivity in the applications we’re monitoring, Dappertrace data collection is responsible for less than 0.01% ofthe network traffic in Google’s production environment.
4.3 Effect on production workloads
High-throughput on-line services that utilize large num-bers of machines for each request are some of the mostdemanding to trace efficiently; they tend to generate thelargest volume of tracing data, while they are also themost sensitive to performance interference. In Table 2we use our web search cluster as an example of such a
service; we measure the performance impact of Dapperon average latency and throughput as we vary the ratio ofsampled traces.
We see that although the impact on throughput isnot very significant, in order to avoid noticeable la-tency degradation, trace sampling is indeed necessary.However, the latency and throughput penalties associ-ated with sampling frequencies less than 1/16 are allwithin the experimental error. In practice, we have foundthat there is still an adequate amount of trace data forhigh-volume services when using a sampling rate as lowas 1/1024. Keeping the baseline Dapper overhead ex-tremely low is important since it gives some slack for ap-plications to use the full breadth of the annotation APIwithout fear of performance penalties. Using a lowersampling frequency has the added benefit of allowingdata to persist longer on the local disks of host machinesbefore being garbage-collected, which gives more flexi-bility to the collection infrastructure.
4.4 Adaptive sampling
The Dapper overhead attributed to any given process isproportional to the number of traces that process sam-ples per unit time. The first production version of Dap-per used a uniform sampling probability for all processesat Google, averaging one sampled trace for every 1024candidates. This simple scheme was effective for ourhigh-throughput online services since the vast majorityof events of interest were still very likely to appear oftenenough to be captured.
However, lower traffic workloads may miss importantevents at such low sampling rates, while tolerating highersampling rates with acceptable performance overheads.The solution for such systems is to override the defaultsampling rate, which requires the kind of manual inter-vention that we sought to avoid in Dapper.
We are in the process of deploying an adaptive sam-pling scheme that is parameterized not by a uniform sam-pling probability, but by a desired rate of sampled tracesper unit time. This way, workloads with low traffic au-tomatically increase their sampling rate while those withvery high traffic will lower it so that overheads remainunder control. The actual sampling probability used isrecorded along with the trace itself; this facilitates ac-curate accounting of trace frequencies in analytical toolsbuilt around Dapper data.
4.5 Coping with aggressive sampling
New Dapper users often wonder if low sampling proba-bilities – often as low as 0.01% for high-traffic services– will interfere with their analyses. Our experience at
7
Google leads us to believe that, for high-throughput ser-vices, aggressive sampling does not hinder most impor-tant analyses. If a notable execution pattern surfacesonce in such systems, it will surface thousands of times.Services with lower volume – perhaps dozens rather thantens of thousands of requests per second – can afford totrace every request; this is what motivated our decisionto move towards adaptive sampling rates.
4.6 Additional sampling during collection
The sampling mechanisms described above were de-signed to minimize perceptible overhead in applicationswhich incorporate the Dapper runtime library. The Dap-per team also needs to control the total size of data writ-ten to its central repositories, though, and thus we incor-porate a second round of sampling for that purpose.
Our production clusters presently generate more than1 terabyte of sampled trace data per day. Dapper userswould like trace data to remain available for at least twoweeks after it was initially logged from a production pro-cess. The benefits of increased trace data density mustthen be weighed against the cost of machines and diskstorage for the Dapper repositories. Sampling a highfraction of requests also brings the Dapper collectors un-comfortably close to the write throughput limit for theDapper Bigtable repository.
In order to maintain flexibility around both the mate-rial resource requirements and the cumulative Bigtablewrite throughput, we added support for additional sam-pling in the collection system itself. We leverage thefact that all spans for a given trace – though they maybe spread across thousands of distinct host machines –share a common trace id. For each span seen in the col-lection system, we hash the associated trace id as a scalarz, where 0 ≤ z ≤ 1. If z is less than our collection sam-pling coefficient, we keep the span and write it to theBigtable. Otherwise, we discard it. By depending onthe trace id for our sampling decision, we either sam-ple or discard entire traces rather than individual spanswithin traces. We have found that this additional config-uration parameter makes the administration of our col-lection pipeline much simpler, as we can easily adjustour global write rate by changing a single parameter in aconfiguration file.
It would be simpler if there was only one sampling pa-rameter for the entire tracing and collection system, butit is not feasible to quickly adjust the runtime samplingconfiguration in all deployed binaries. We have chosena runtime sampling rate which yields slightly more datathan we can write to our repositories, and we throttle thatwrite rate with the secondary sampling coefficient in thecollection system. Dapper pipeline maintenance is easiersince we can augment or diminish our global coverage
and write-rate immediately with a single change to oursecondary sampling configuration.
5 General-Purpose Dapper Tools
Several years ago while Dapper was still a prototype, itwas only usable with the patient assistance of the Dapperdevelopers. Since then, we have iteratively built up thecollection infrastructure, programming interfaces, and aninteractive web-based user interface to help Dapper userssolve their problems independently. In this section, wesummarize which approaches have worked and whichhaven’t, and we provide basic usage information aboutthese general-purpose analytical tools.
5.1 The Dapper Depot APIThe Dapper “Depot API,” or DAPI, provides direct ac-cess to the distributed trace records in the regional Dap-per repositories (or “Depots”). The DAPI and the Dap-per trace repositories were designed in tandem, and theDAPI is meant to expose a clean and intuitive interfaceto the raw data contained within these Dapper reposito-ries. Our use cases suggested the following three waysto access trace data:
Access by trace id: The DAPI can load any trace ondemand given its globally unique trace id.Bulk access: The DAPI can leverage MapReduce to pro-vide access to billions of Dapper traces in parallel. Theuser overrides a virtual function which accepts a Dappertrace as its only argument, and the framework will in-voke that function once for every collected trace within auser-specified time window.Indexed access: The Dapper repositories support a sin-gle index which has been chosen to match our com-mon access patterns. This index maps from commonly-requested trace features (described below) to distinctdapper traces. Since trace ids are allocated pseudo-randomly, this is the best way to quickly access tracesassociated with a specific service or host machine.
All three access patterns lead the user to distinct Dap-per trace records. As described earlier in Section 2.1,Dapper traces are modelled as trees of trace spans,so the Trace data structure is consequently a simpletraversable tree of individual Span structures. The spansoften correspond to RPC calls, and, in those cases, RPCtiming information is available. Timestamped applica-tion annotations are also accessible via the span struc-tures.
The choice of an appropriate custom index was themost challenging aspect of the DAPI design. The com-pressed storage required for an index into the trace datais only 26% less than for the actual trace data itself, so
8
the costs are significant. Initially, we deployed two in-dices: one index for host machines, and one for servicenames. However, we did not find sufficient interest inthe machine-based indices to justify their storage cost.When users were interested in individual machines, theywere also interested in a specific service, so we eventu-ally combined the two into a composite index which al-lows for efficient lookup by service name, host machine,and timestamp, in that order.
5.1.1 DAPI usage within Google
There are three classes of DAPI usage at Google: persis-tent online web applications which make use of DAPI,well-maintained DAPI-based tools which can be run on-demand from the command line, and one-off analyti-cal tools which are written, run, and mostly forgotten.Respectively, we know of 3 persistent DAPI-based ap-plications, 8 additional on-demand DAPI-based analy-sis tools, and about 15-20 one-off analytical tools builtusing the DAPI framework. It’s difficult to account fortools in this latter category since developers can build,run, and abandon these projects without the knowledgeof the Dapper team.
5.2 The Dapper user interface
Most Dapper usage takes place within the interactiveweb-based user interface. Space considerations do notallow us to demonstrate every feature therein, but a typi-cal user workflow is shown in Figure 6.
1: The user describes the service and time windowthey’re interested in, as well as whatever informationthey need to distinguish trace patterns (in this case, thespan name). They also specify a cost metric most rele-vant to their investigation (in this case, service latency).2: A large table of performance summaries for all dis-tributed execution patterns associated with the given ser-vice appears. The user may sort these execution patternsas they wish and choose one to view in more detail.3: Once a single distributed execution pattern is se-lected, the user is presented with a graphical depictionof said execution pattern. The service under examinationis highlighted in the center of the diagram.4: After creating buckets which correspond to subdivi-sions of the cost metric space selected in step #1, theDapper user interface presents a simple frequency his-togram over that metric space. So, in this example, wecan see that there’s a roughly log normal distribution oflatencies for the selected execution pattern. The useris also presented with a list of specific example traceswhich fall into different ranges of the histogram. In thiscase, the user clicks on the second example trace, which
brings them to the trace inspection view in the Dapperuser interface.5: Many if not most Dapper users eventually aim to in-spect specific traces in hopes of gleaning informationabout root causes of system behavior. We do not haveenough space to do the trace view justice, but it is charac-terized by a global time line (seen at the top) and the abil-ity to expand and collapse subtrees interactively. Suc-cessive tiers of the distributed trace tree are representedby nested colored rectangles. Every RPC span is bro-ken down further into time spent within a server process(green) and time spent on the network (blue). User an-notations are not shown in this screenshot, but they maybe selectively included in the global time line on a span-by-span basis.
For users seeking real-time data, the Dapper user inter-face is capable of communicating directly with Dapperdaemons on each production machine. In that mode, it isnot possible to look at system-level diagrams as shownabove, but it is still easy to select individual traces basedon latency or network characteristics. In that mode of op-eration, the data is available within seconds of real time.
According to our logs, roughly 200 different Googleengineers use the Dapper UI on a typical weekday; overthe course of the week, accordingly, there are approxi-mately 750-1000 distinct users. Those numbers are con-sistent from month to month modulo internal announce-ments of new features. It is common for users to sendout links to specific traces of interest which will in-evitably generate much one-time, short-duration trafficin the trace inspector.
6 Experiences
Dapper is used widely at Google, both directly throughthe Dapper user interface and indirectly through the pro-grammatic APIs or applications built on top of thoseAPIs. In this section we do not attempt to catalog everyknown use of Dapper, but instead attempt to cover the“basis vectors” of Dapper usage in an effort to illustratewhat sorts of applications have been most successful.
6.1 Using Dapper during development
The Google AdWords system is built around a largedatabase of keyword targeting criteria and associatedtextual advertisements. When new keywords or adver-tisements are either inserted or modified, they must bechecked for adherence to service policy terms (such asinappropriate language); a process that is made more ef-ficient by an automated review system.
When it came time to re-engineer one of Ads Review’sservices from the ground up, the team used Dapper iter-
9
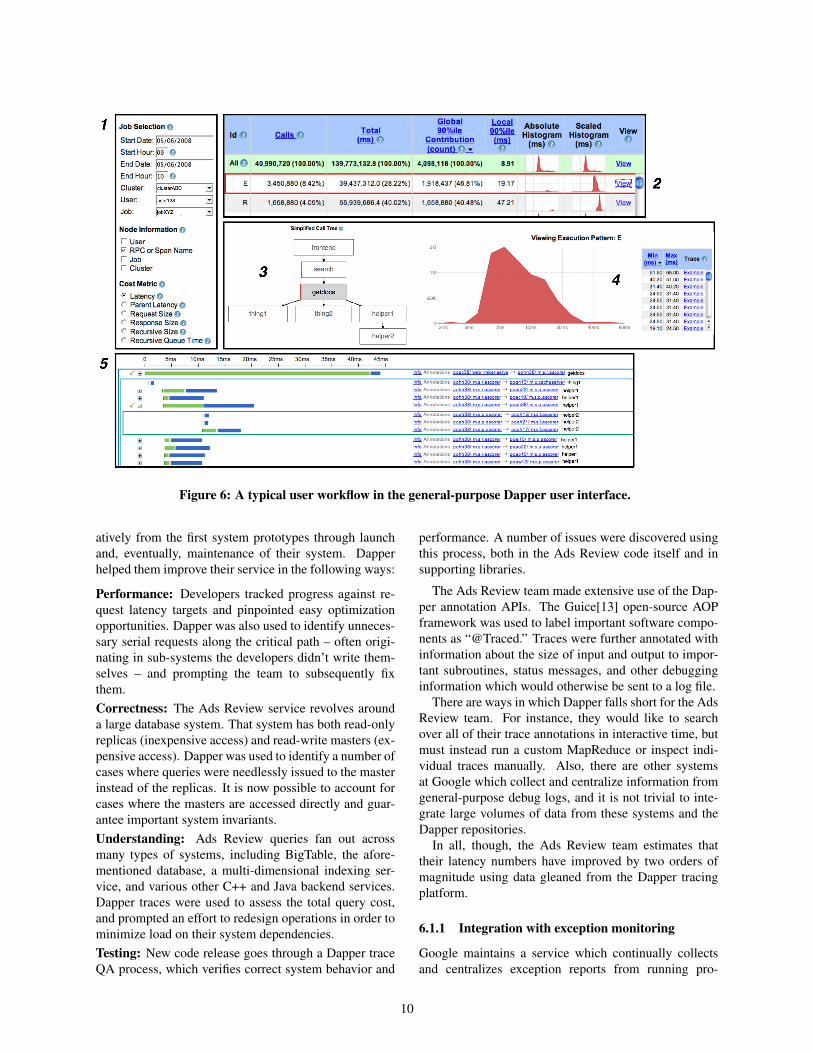
Figure 6: A typical user workflow in the general-purpose Dapper user interface.
atively from the first system prototypes through launchand, eventually, maintenance of their system. Dapperhelped them improve their service in the following ways:
Performance: Developers tracked progress against re-quest latency targets and pinpointed easy optimizationopportunities. Dapper was also used to identify unneces-sary serial requests along the critical path – often origi-nating in sub-systems the developers didn’t write them-selves – and prompting the team to subsequently fixthem.Correctness: The Ads Review service revolves arounda large database system. That system has both read-onlyreplicas (inexpensive access) and read-write masters (ex-pensive access). Dapper was used to identify a number ofcases where queries were needlessly issued to the masterinstead of the replicas. It is now possible to account forcases where the masters are accessed directly and guar-antee important system invariants.Understanding: Ads Review queries fan out acrossmany types of systems, including BigTable, the afore-mentioned database, a multi-dimensional indexing ser-vice, and various other C++ and Java backend services.Dapper traces were used to assess the total query cost,and prompted an effort to redesign operations in order tominimize load on their system dependencies.Testing: New code release goes through a Dapper traceQA process, which verifies correct system behavior and
performance. A number of issues were discovered usingthis process, both in the Ads Review code itself and insupporting libraries.
The Ads Review team made extensive use of the Dap-per annotation APIs. The Guice[13] open-source AOPframework was used to label important software compo-nents as “@Traced.” Traces were further annotated withinformation about the size of input and output to impor-tant subroutines, status messages, and other debugginginformation which would otherwise be sent to a log file.
There are ways in which Dapper falls short for the AdsReview team. For instance, they would like to searchover all of their trace annotations in interactive time, butmust instead run a custom MapReduce or inspect indi-vidual traces manually. Also, there are other systemsat Google which collect and centralize information fromgeneral-purpose debug logs, and it is not trivial to inte-grate large volumes of data from these systems and theDapper repositories.
In all, though, the Ads Review team estimates thattheir latency numbers have improved by two orders ofmagnitude using data gleaned from the Dapper tracingplatform.
6.1.1 Integration with exception monitoring
Google maintains a service which continually collectsand centralizes exception reports from running pro-
10

Figure 7: The fraction of universal search traceswhich encountered unusually high network lag some-where along their critical path, shown as a functionof end-to-end request latency.
cesses. If these exceptions occurred in the context of asampled Dapper trace, the appropriate trace and span idsare included as metadata in the exception report. Thefrontend to the exception monitoring service then pro-vides links from specific exception reports to their re-spective distributed traces. The Ads Review team usedthis feature to understand the larger forensic context ofbugs identified by the exception monitoring service. Byexporting interfaces built around simple unique ids, theDapper platform is integrated into other event monitoringsystems with relative ease.
6.2 Addressing long tail latencyDue to the number of moving parts and the size and scopeof the codebase and deployment, debugging services likeuniversal search (described earlier in Section 1) is verychallenging. Here we describe efforts made to attenuatethe long tail of the universal search latency distribution.Dapper was able to validate hypotheses about end-to-endlatency and, more specifically, the critical path for uni-versal search requests. When systems involve not justdozens of subsystems but dozens of engineering teams,even our best and most experienced engineers routinelyguess wrong about the root cause of poor end-to-end per-formance. In such situations, Dapper can furnish much-needed facts and is able to answer many important per-formance questions conclusively.
An engineer working on long tail latency debuggingbuilt a small library which infers hierarchical criticalpaths from DAPI Trace objects. These critical pathstructures were then used to diagnose problems and pri-oritize prospective performance improvements for uni-versal search. This work with Dapper led to the follow-ing discoveries:
• Momentary degradation in network performancealong the critical path does not affect systemthroughput, but it can have a profound effect on out-lier latency. As seen in Figure 7, most of the slowUniversal Search traces experienced network degra-dation along their critical path.
• There were many problematic and expensive querypatterns which resulted from unintended interac-tions between services. Once identified they wereoften corrected for easily, but identification itselfwas difficult before Dapper.
• Common queries were harvested from a secure logsrepository outside of Dapper, and, using Dapper’sunique trace ids, joined with the Dapper reposito-ries. This mapping was then used to build lists ofexample queries which were slow for each individ-ual sub-system within universal search.
6.3 Inferring service dependencies
At any given time, a typical computing cluster at Googleis host to thousands of logical “jobs”; sets of processesperforming a common function. Google maintains manysuch clusters, of course, and indeed we find that the jobsin one computing cluster often depend on jobs in otherclusters. Because dependencies between jobs changedynamically, it is not possible to infer all inter-servicedependencies through configuration information alone.Still, various processes within the company require accu-rate service dependency information in order to identifybottlenecks and plan service moves among other things.Google’s appropriately-named “Service Dependencies”project has made use of trace annotations and the DAPIMapReduce interface in an effort to automate service de-pendency determination.
Using Dapper’s core instrumentation along with Dap-per trace annotations, the service dependencies projectis able to infer dependencies between individual jobs, aswell as dependencies on shared software infrastructureused by those jobs. For instance, all Bigtable operationsare tagged with the name of the affected table. Usingthe Dapper platform, the service dependencies team isthus able to automatically infer dependencies on namedresources at various service granularities.
6.4 Network usage of different services
Google devotes substantial human and material re-sources to its networking fabric. Not surprisingly, net-work operators have long had access to monitoring infor-mation from individual pieces of hardware, and customtools and dashboards were built to give a birds-eye view
11
of global network utilization. Network operators had rea-sonable visibility into the overall health of our wide-areanetwork, but, when there were problems, they had fewtools which could properly attribute network load to anapplication-level culprit.
Though Dapper was not designed for link-level moni-toring, we have found that it is well-suited to the task ofapplication-level analysis of inter-cluster network activ-ity. Google was able to leverage the Dapper platform tobuild a continuously-updating console showing the mostactive application-level endpoints for inter-cluster net-work traffic. Furthermore, using Dapper we are able topoint to the causal trace root for these expensive networkrequests rather than restricting ourselves to the two peermachines in isolation. The dashboard was built on top ofthe Dapper APIs in less than 2 weeks.
6.5 Layered and Shared Storage Systems
Many storage systems at Google are composed of mul-tiple independently complex layers of distributed infras-tructure. For instance, the Google App Engine[5] is builton top of a scalable entity storage system. This entitystorage system exposes certain RDBMS functionality ontop of an underlying BigTable. Bigtable in turn uses bothChubby[7] (a distributed lock system) and GFS. More-over, systems like BigTable are managed as a shared ser-vice in order to simplify deployment and better utilizecomputing resources.
In such layered systems it is not always easy to deter-mine end-user resource consumption patterns. For exam-ple, a high degree of GFS traffic from a given BigTablecell could be originating from one user mostly or severalusers, while at the GFS level the difference between thesetwo distinct usage patterns is obscured. Moreover, con-tention for such shared services can be similarly difficultto debug in the absence of tools like Dapper.
The Dapper user interface shown in Section 5.2can group and aggregate trace performance informationacross the various clients of any shared service. Thismakes it easy for the owners of shared services to ranktheir users in terms of various metrics (e.g., inbound net-work load, outbound network load, or total time spentservicing requests).
6.6 Firefighting with Dapper
Dapper is useful for some but not all firefighting tasks.“Firefighting” here refers to activities performed on be-half of a distributed system in peril. Typically, Dapperusers who are firefighting need access to fresh data anddo not have time to write new DAPI code or wait for pe-riodic reports to run.
For services which are experiencing high latencies or,worse still, timing out given a normal workload, the Dap-per user interface can often isolate the location of the la-tency bottleneck. By communicating directly with theDapper daemons, fresh data about specific high-latencytraces can be gathered without difficulty. During catas-trophic failures, it is usually not necessary to look at ag-gregate statistics to determine root causes and exampletraces are sufficient.
However, shared storage services like those describedin Section 6.5 require aggregated information as soon aspossible during a sudden spike in user activity. For eventpost-mortems, shared services can still make use of theaggregated Dapper data, but until bulk analysis of col-lected Dapper data can complete within 10 minutes of anevent onset, Dapper will not be as useful as it could befor firefighting problems with shared storage services.
7 Other Lessons Learned
Although our experience with Dapper thus far has gen-erally met our expectations, there were some positive as-pects that we did not fully anticipate. We were particu-larly pleased with the number of unintended use cases. Inaddition to several of the experiences described in Sec-tion 6, these also include resource accounting systems,tools that check that sensitive services conform to spec-ified communication patterns, and an analysis of RPCcompression strategies, among others. We attribute theseunintended uses in part to the decision to open our tracedatastores to developers through a simple programminginterface, as this allowed us to harness the creativity ofa much larger community. The addition of Dapper sup-port to legacy workloads was also simpler than expected,requiring only a re-compile with new versions of exist-ing libraries for programs that were using the commonsupported threading, control flow, and RPC frameworks.
Dapper’s broad usage within Google has also providedus with valuable feedback on some of its limitations. Be-low we describe some of the most important ones wehave identified to date.
Coalescing effects: Our model implicitly assumes thatvarious subsystems will perform work for one traced re-quest at a time. In some cases it is more efficient tobuffer a few requests before performing an operation on agroup of requests at once (coalescing of disk writes is onesuch example). In such instances, a traced request can beblamed for a deceptively large unit of work. Moreover,if multiple traced requests are batched together, only oneof them will appear responsible for the span due to ourreliance on a single unique trace id for each trace. Weare considering solutions that could identify these casesand log the minimum amount of information required to
12
disambiguate them.
Tracing batch workloads: Dapper’s design was tar-geted at on-line serving systems, and the original objec-tive was to understand system behavior resulting froma user request to Google. However, off-line data inten-sive workloads, such as those that fit the MapReduce [10]model, can also benefit from better performance insight.In such cases, we need to associate a trace id with someother meaningful unit of work, such as a key (or range ofkeys) in the input data, or a MapReduce shard.
Finding a root cause: Dapper is effective in determin-ing which part of a system is experiencing slowdowns,but is not always sufficient for finding the root causes.For example, a request may be slow not because of itsown behavior, but because other requests were queuedahead of it. Programs can make use of application-levelannotations to relay queue sizes or overload situations tothe tracing system. Also, if such effects are common, thepaired sampling technique proposed in ProfileMe [11]could prove useful. It consists of sampling two time-overlapping requests, and observing their relative laten-cies throughout the system.
Logging kernel-level information: Detailed informa-tion about kernel-visible events would sometimes be use-ful in root cause determination. We have a number oftools capable of tracing or otherwise profiling kernel ex-ecution, but tying that information to a trace context thatresides at user level is difficult to accomplish in a generaland unobtrusive manner. We are investigating a possiblecompromise solution, in which we take snapshots of afew kernel-level activity parameters from user level andassociate them with an active span.
8 Related Work
There is a healthy body of work in the area of distributedsystems tracing, with some systems primarily focusingon pinpointing faults while others aim at performanceoptimization. Dapper has been used for fault discovery,but it has generally been more useful in uncovering per-formance issues and improving the general understand-ing of the behavior of large complex workloads.
Dapper is related to black-box monitoring systems,such as Project5 [1], WAP5 [15] and the Sherlock system[2], which arguably can achieve an even higher degree ofapplication-level transparency by not relying in run-timelibrary instrumentation. The disadvantage of black-boxschemes are some amount of imprecision and possiblylarger overheads involved in the statistical inference ofcausal paths.
Explicit annotation-based instrumentation of middle-ware or applications themselves is perhaps a more pop-ular approach to distributed systems monitoring. Pip
[14] and Webmon[16] are examples of systems that relymore heavily on application level annotations, while X-Trace[12], Pinpoint [9] and Magpie [3] mostly focus onlibrary and middleware modifications. Dapper is mostclosely related to this latter group. Like Pinpoint, X-Trace, and the early version of Magpie, Dapper uses aglobal identifier to tie together related events from vari-ous parts of a distributed system. Also like these systems,Dapper attempts to obviate the need to annotate applica-tions by hiding instrumentation within common softwaremodules. Magpie abandoned the use of global IDs, andthe challenges of correctly propagating them, by adopt-ing an event schema that is written for each applicationand describes explicitly the relationships between events.It is unclear to us how effective schemas are in achiev-ing transparency in practice. X-Trace’s core annotationrequirements are somewhat more ambitious than Dap-per’s, in that traces are collected not only at node bound-aries but also whenever control is passed between dif-ferent software layers within a node. Our strict require-ments for low-overhead instrumentation steered us awayfrom such a model, and towards creating the minimumset of mechanisms that enable all work done on behalf ofa given original request to be tied together. Dapper tracescan still be enriched by optional application annotations.
9 Conclusions
In this paper we have introduced Dapper, Google’s pro-duction distributed systems tracing platform, and re-ported on our experience developing and using it. Dap-per is deployed across virtually all of Google’s systems,and has allowed the vast majority of our largest work-loads to be traced without need for any application-levelmodifications, and with no noticeable performance im-pact. Dapper’s utility to developers and operations teamsis evidenced by the popularity of the main tracing userinterface and illustrated here through examples of usecases, even some which were not anticipated by its de-signers.
To our knowledge, this is the first article to report on alarge, production distributed systems tracing framework.In fact our main contributions derive from the fact thatwe report retrospectively on a system that has been op-erational for over two years. We have found, for exam-ple, that the decision to combine a minimal application-transparent tracing functionality with a simple API forprogrammers to enhance traces has been worthwhile.
We believe that Dapper achieves a higher degree ofapplication-level transparency than previous annotation-based distributed tracing systems, as demonstrated by thesmall number of workloads that required manual inter-vention. While this has been facilitated by the somewhatunusual homogeneity of our computing deployment, it
13
was still a significant challenge. Most importantly, ourdesign suggests some sufficient conditions for realizingapplication-level transparency which we hope might helpothers develop solutions for more heterogeneous envi-ronments.
Finally, by opening Dapper’s trace repositories to in-ternal developers we have enabled the creation of manymore analysis tools than the Dapper team alone couldhave been able to produce in isolation, greatly leverag-ing the design and implementation effort.
Acknowledgments
We thank Mahesh Palekar, Cliff Biffle, Thomas Kotz-mann, Kevin Gibbs, Yonatan Zunger, Michael Kleber,and Toby Smith for their experimental data and feedbackabout Dapper experiences. We also thank Silvius Rusfor his assistance with load testing. Most importantly,though, we thank the outstanding team of engineers whohave continued to develop and improve Dapper over theyears; in order of appearance, Sharon Perl, Dick Sites,Rob von Behren, Tony DeWitt, Don Pazel, Ofer Zajicek,Anthony Zana, Hyang-Ah Kim, Joshua MacDonald, DanSturman, Glenn Willen, Alex Kehlenbeck, Brian McBar-ron, Michael Kleber, Chris Povirk, Bradley White, TobySmith, Todd Derr, Michael De Rosa, and Athicha Muthi-tacharoen. They have all done a tremendous amount ofwork to make Dapper a day-to-day reality at Google.
References
[1] M. K. Aguilera, J. C. Mogul, J. L. Wiener, P. Reynolds,and A. Muthitacharoen. Performance Debugging for Dis-tributed Systems of Black Boxes. In Proceedings of the19th ACM Symposium on Operating Systems Principles,December 2003.
[2] P. Bahl, R. Chandra, A. Greenberg, S. Kandula, D. A.Maltz, and M. Zhang. Towards Highly Reliable Enter-prise Network Services Via Inference of Multi-level De-pendencies. In Proceedings of SIGCOMM, 2007.
[3] P. Barham, R. Isaacs, R. Mortier, and D. Narayanan. Mag-pie: online modelling and performance-aware systems. InProceedings of USENIX HotOS IX, 2003.
[4] L. A. Barroso, J. Dean, and U. Holzle. Web Search fora Planet: The Google Cluster Architecture. IEEE Micro,23(2):22–28, March/April 2003.
[5] T. O. G. Blog. Developers, start your engines.http://googleblog.blogspot.com/2008/04/developers-start-your-engines.html, 2007.
[6] T. O. G. Blog. Universal search: Thebest answer is still the best answer.http://googleblog.blogspot.com/2007/05/universal-search-best-answer-is-still.html, 2007.
[7] M. Burrows. The Chubby lock service for loosely-coupled distributed systems. In Proceedings of the 7thUSENIX Symposium on Operating Systems Design andImplementation, pages 335 – 350, 2006.
[8] F. Chang, J. Dean, S. Ghemawat, W. C. Hsieh, D. A. Wal-lach, M. Burrows, T. Chandra, A. Fikes, and R. E. Gru-ber. Bigtable: A Distributed Storage System for Struc-tured Data. In Proceedings of the 7th USENIX Sympo-sium on Operating Systems Design and Implementation(OSDI’06), November 2006.
[9] M. Y. Chen, E. Kiciman, E. Fratkin, A. fox, andE. Brewer. Pinpoint: Problem Determination in Large,Dynamic Internet Services. In Proceedings of ACM In-ternational Conference on Dependable Systems and Net-works, 2002.
[10] J. Dean and S. Ghemawat. MapReduce: Simplified DataProcessing on Large Clusters. In Proceedings of the 6thUSENIX Symposium on Operating Systems Design andImplementation (OSDI’04), pages 137 – 150, December2004.
[11] J. Dean, J. E. Hicks, C. A. Waldspurger, W. E. Weihl,and G. Chrysos. ProfileMe: Hardware Support forInstruction-Level Profiling on Out-of-Order Processors.In Proceedings of the IEEE/ACM International Sympo-sium on Microarchitecture, 1997.
[12] R. Fonseca, G. Porter, R. H. Katz, S. Shenker, and I. Sto-ica. X-Trace: A Pervasive Network Tracing Framework.In Proceedings of USENIX NSDI, 2007.
[13] B. Lee and K. Bourrillion. The Guice Project Home Page.http://code.google.com/p/google-guice/, 2007.
[14] P. Reynolds, C. Killian, J. L. Wiener, J. C. Mogul, M. A.Shah, and A. Vahdat. Pip: Detecting the Unexpected inDistributed Systems. In Proceedings of USENIX NSDI,2006.
[15] P. Reynolds, J. L. Wiener, J. C. Mogul, M. K. Aguilera,and A. Vahdat. WAP5: Black Box Performance Debug-ging for Wide-Area Systems. In Proceedings of the 15thInternational World Wide Web Conference, 2006.
[16] P. K. G. T. Gschwind, K. Eshghi and K. Wurster. Web-Mon: A Performance Profiler for Web Transactions. InE-Commerce Workshop, 2002.
14


![On real-time ray tracing Ville Rahikainenits own – stochastic or distributed ray tracing [Glassner, 1989a]. In addition to anti-aliasing, distributed ray tracing also creates a more](https://img.pdfslide.net/doc/110x75/5f419cd1816fbf313317ce45/on-real-time-ray-tracing-ville-rahikainen-its-own-a-stochastic-or-distributed.jpg)