Embed Size (px)
Citation preview
Data analysis for Program Improvement: Part 1
Kathy Hebbeler, ECO at SRI
Cornelia Taylor, ECO at SRI
Objectives
• Describe why analysis for program improvement is important.
• Describe methods for asking questions about data.
• Describe methods for descriptive analysis of data.
2
Introductions
• Name
• State
• Role – state, program/district, other
• Are you currently looking at data by individual programs?
3Early Childhood Outcomes Center
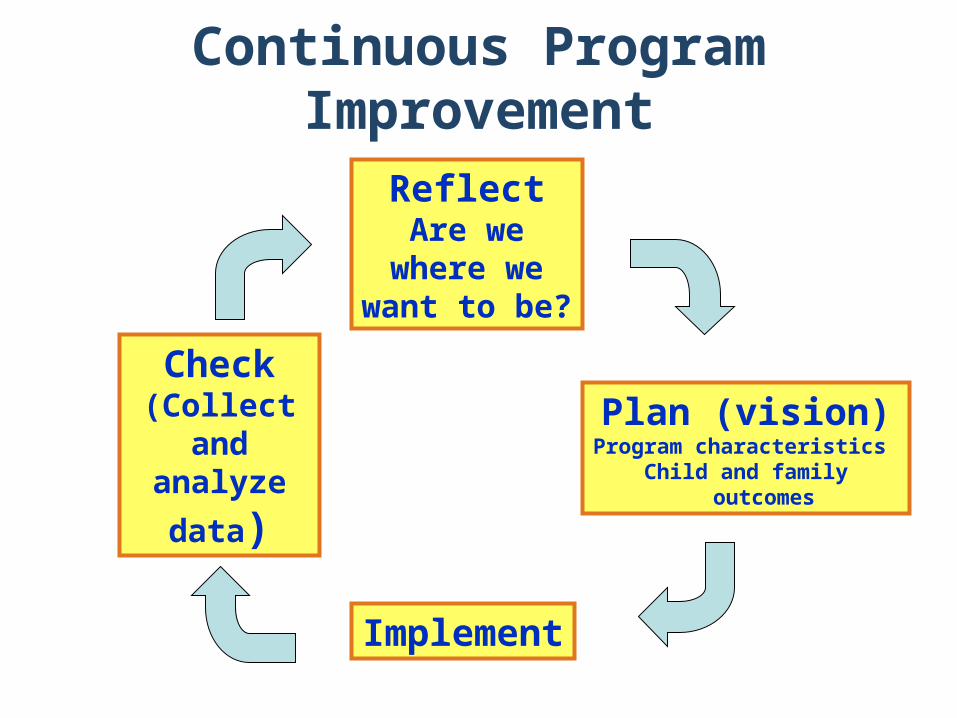
Continuous Program Improvement
Plan (vision) Program characteristics
Child and family outcomes
Implement
Check(Collect
and analyze
data)
ReflectAre we where
we want to be?
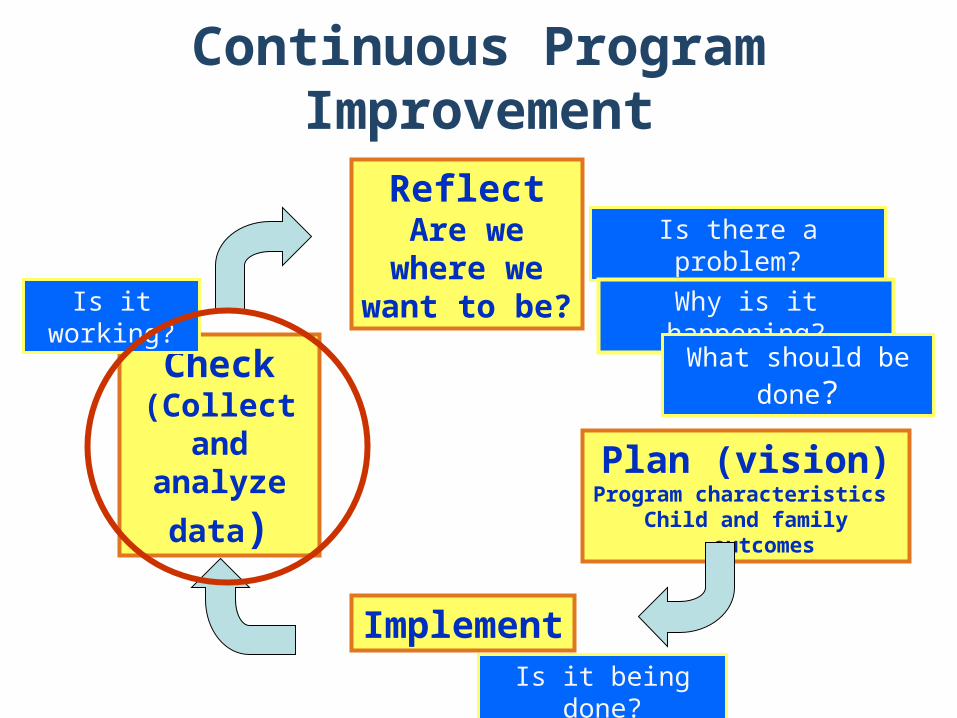
Continuous Program Improvement
Plan (vision) Program characteristics
Child and family outcomes
Implement
Check(Collect
and analyze
data)
ReflectAre we where
we want to be?
Is there a problem?
Why is it happening?
What should be
done?
Is it being done?
Is it working?
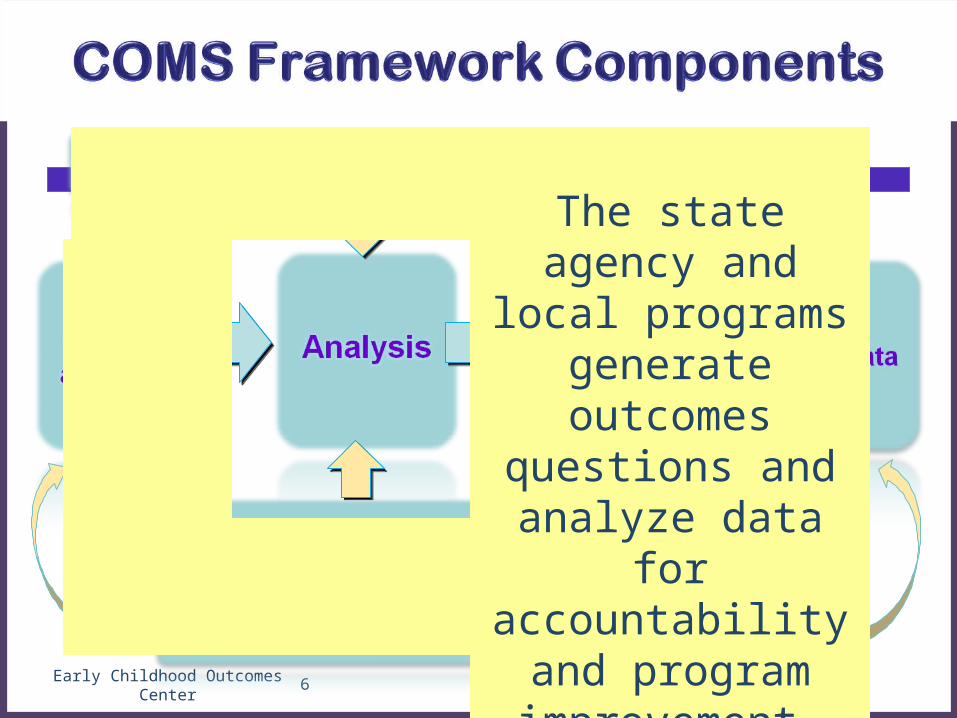
Early Childhood Outcomes Center 6
The state agency and local programs generate outcomes
questions and analyze data for
accountability and program
improvement.
Quality Indicators Related to Analysis
5.State identifies accountability and program improvement questions related to child outcomes.
6.Local programs identify accountability and program improvement questions related to child outcomes.
7.State agency analyzes data in a timely manner.
8.Local programs analyze data in a timely manner.
9.State agency ensures completeness and accuracy of data.
7Early Childhood Outcomes Center
5. State identifies accountability and program improvement questions related to child
outcomes.
• State has a written set of publicly available accountability and program improvement questions related to child outcomes.
• The questions were developed with broad stakeholder input, including families.
• The questions are aligned with the vision and purposes of the state’s early childhood system.
• The questions address how outcomes relate to child, family, and service characteristics.
• Answers to the questions will provide useful information for accountability and program improvement.
• A process is in place for regularly reviewing and revising the questions.
8Early Childhood Outcomes Center
7. State agency analyzes data in a timely manner.
• State has sufficient resources to conduct data analyses in a timely and accurate manner.
• State can access all data elements necessary to address state level questions.
• State conducts analyses throughout the year to address accountability and program improvement questions.
• State conducts additional ad hoc analyses as needed.
• State thoroughly documents analyses so they can be independently replicated.
9Early Childhood Outcomes Center

Finding the Killer Questions
Starting with a question (or two..)
• All analyses are driven by questions
• Several ways to word the same question
• Some ways are more “precise” than others
• Questions come from different sources
• Different versions of the same question are necessary and appropriate for different audiences.
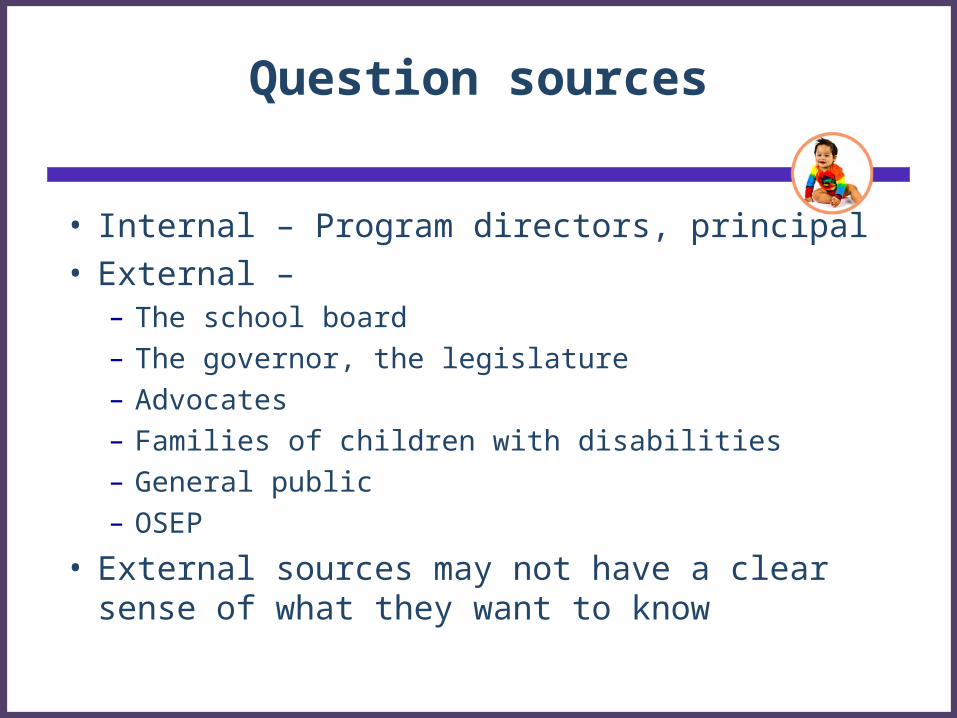
Question sources
• Internal – Program directors, principal• External –
– The school board– The governor, the legislature– Advocates– Families of children with disabilities– General public– OSEP
• External sources may not have a clear sense of what they want to know
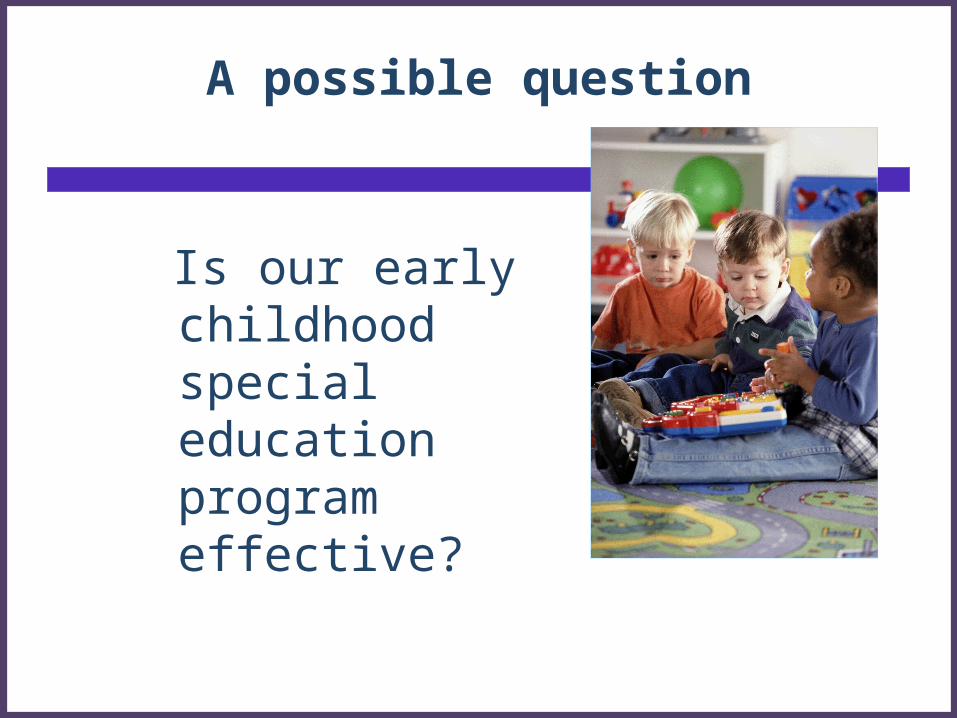
A possible question
Is our early childhood special education program effective?
14
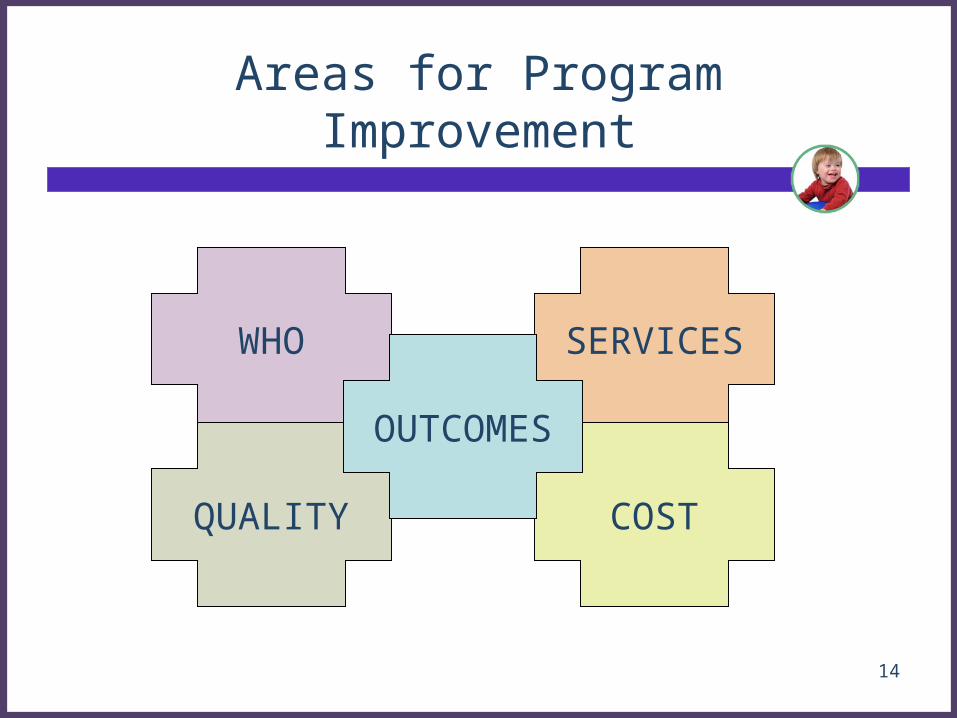
Areas for Program Improvement
WHO SERVICES
COSTQUALITY
OUTCOMES
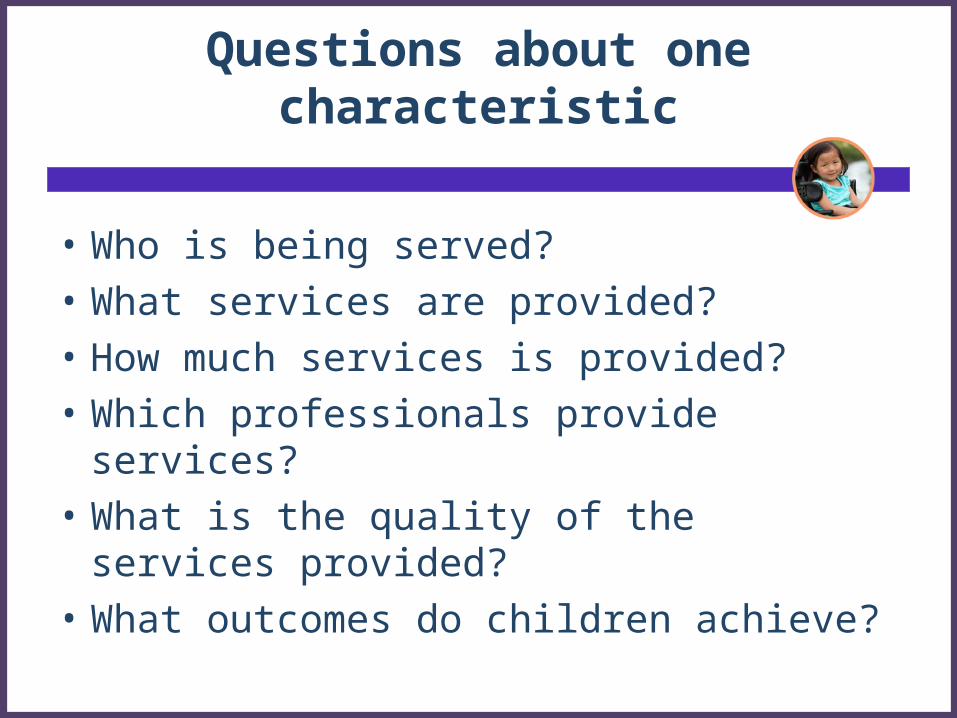
Questions about one characteristic
• Who is being served?
• What services are provided?
• How much services is provided?
• Which professionals provide services?
• What is the quality of the services provided?
• What outcomes do children achieve?
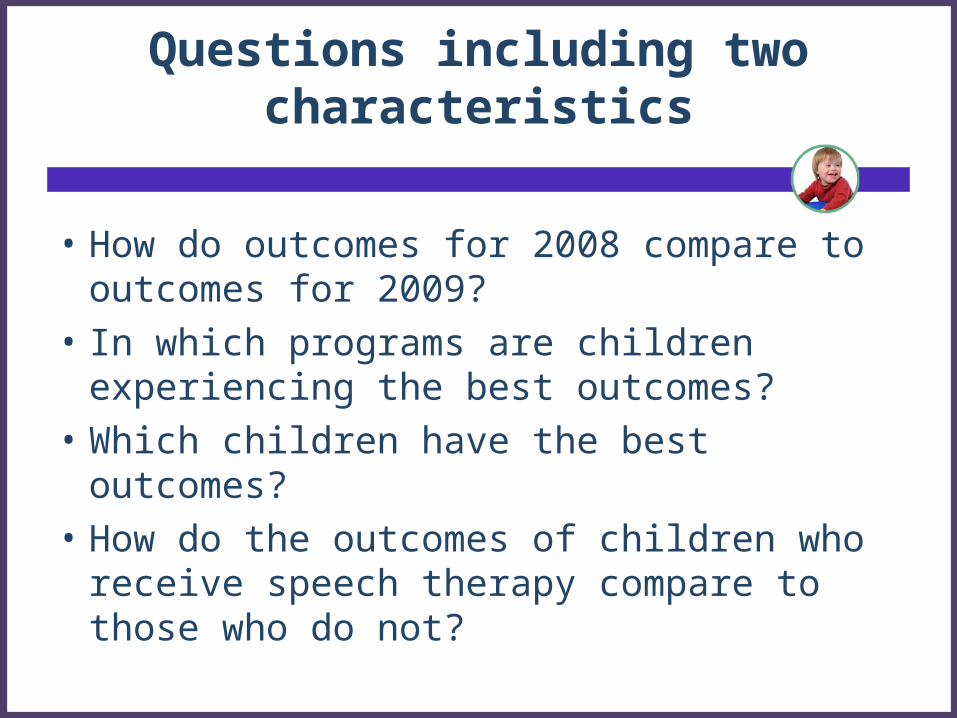
Questions including two characteristics
• How do outcomes for 2008 compare to outcomes for 2009?
• In which programs are children experiencing the best outcomes?
• Which children have the best outcomes?
• How do the outcomes of children who receive speech therapy compare to those who do not?
Activity 1: Killer Questions
Imagine you are a local coordinator for ECSE. A major foundation in your state has announced they will be giving your district a large grant to improve services in the district. What are the 5 top questions you want answered to be able to plan this new program improvement effort?
Conclusion
• Data analysis is always driven by questions.
• What do you want to know?
• What are others likely to want to know?
• Write down your questions.
18Early Childhood Outcomes Center
Talking to Your [Data] Analyst
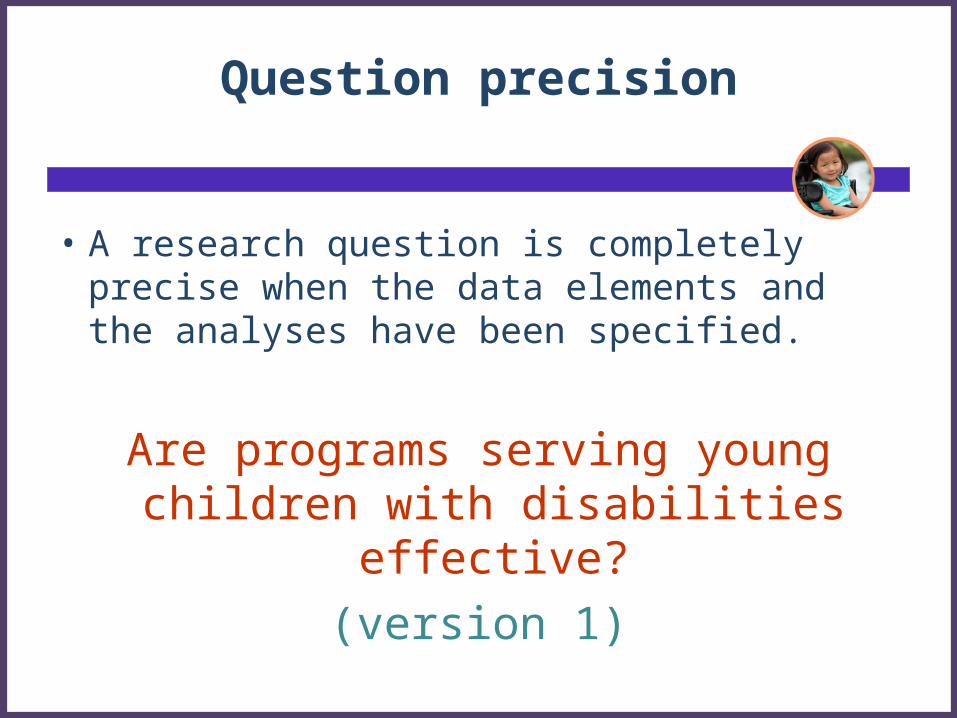
Question precision
• A research question is completely precise when the data elements and the analyses have been specified.
Are programs serving young children with disabilities effective?
(version 1)
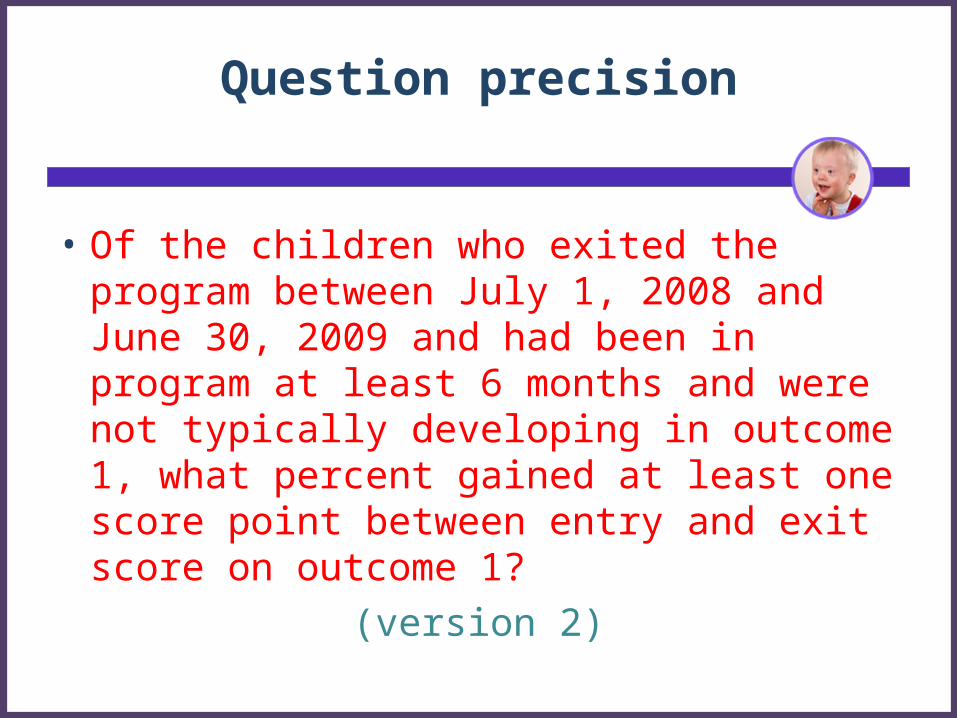
Question precision
• Of the children who exited the program between July 1, 2008 and June 30, 2009 and had been in program at least 6 months and were not typically developing in outcome 1, what percent gained at least one score point between entry and exit score on outcome 1?
(version 2)
Finding the right level of precision
• Who is the audience?
• What is the purpose?
• Different levels of precision for different purposes
BUT THEY CAN BE VERSIONS OF THE SAME QUESTION

Working with Table
Shells
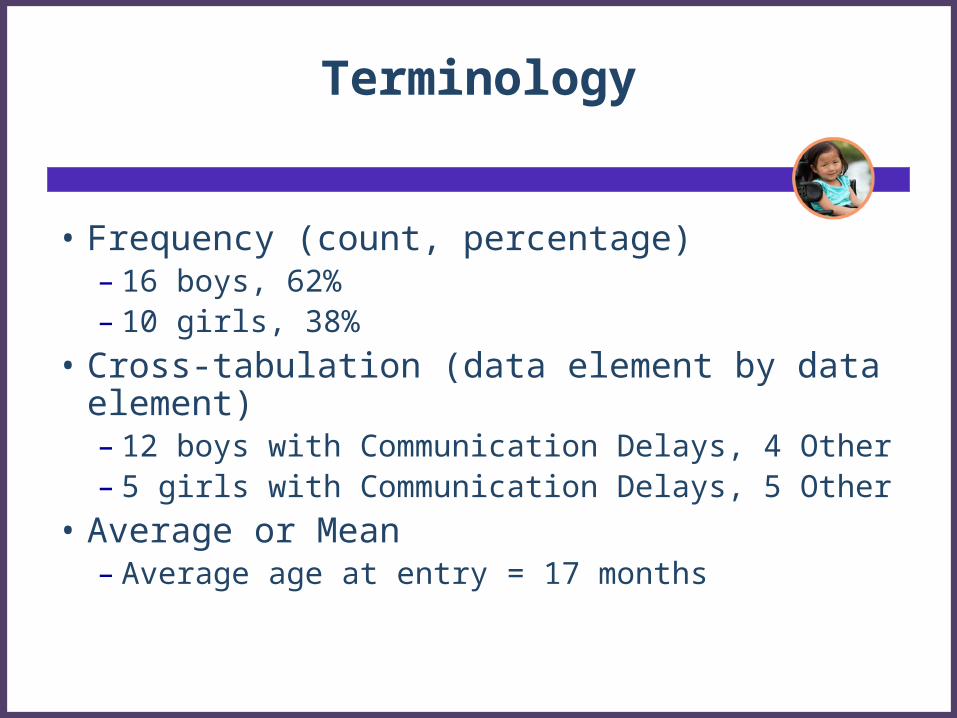
Terminology
• Frequency (count, percentage)– 16 boys, 62%– 10 girls, 38%
• Cross-tabulation (data element by data element)– 12 boys with Communication Delays, 4 Other– 5 girls with Communication Delays, 5 Other
• Average or Mean– Average age at entry = 17 months
Next decisions
• Tables and Graphs - How do you want your data displayed?
• What is the display that will address your question?
Frequency Table
• Used for data with categories (e.g., disability, primary language, school)
• Show the number and percent of each category.
26Early Childhood Outcomes Center
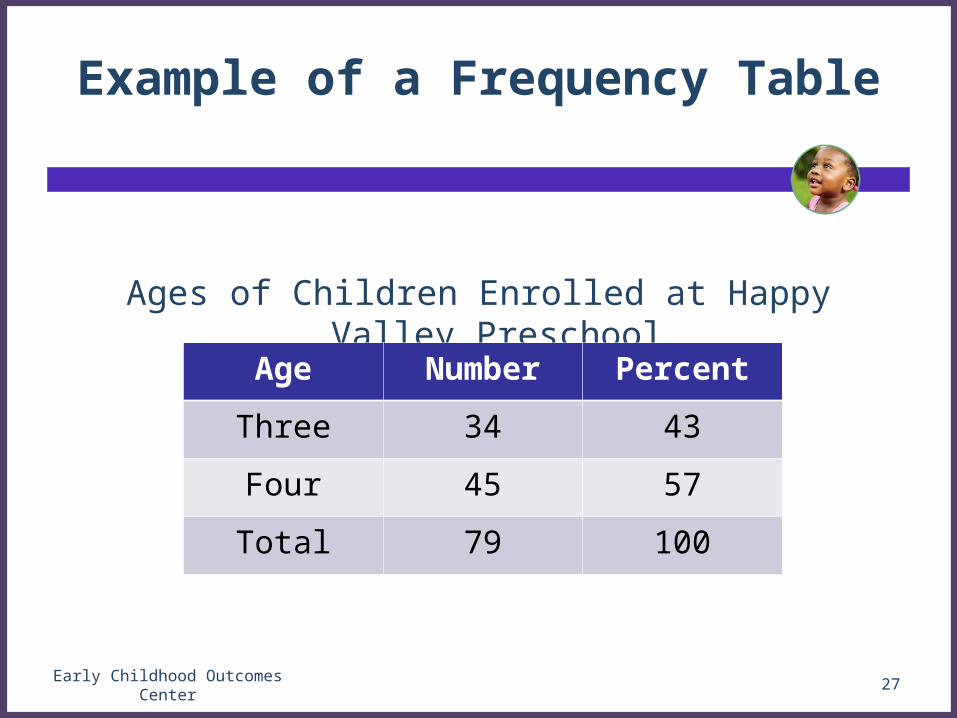
Example of a Frequency Table
Ages of Children Enrolled at Happy Valley Preschool
27Early Childhood Outcomes Center
Age Number Percent
Three 34 43
Four 45 57
Total 79 100
Cross-tabulations
• Tables that show two variables crossed with one another– Gender and race/ethnicity– Disability and age– Program and disability
• Number of cells determined by number of values– Gender (2) by race/ethnicity (5) = 10
28Early Childhood Outcomes Center
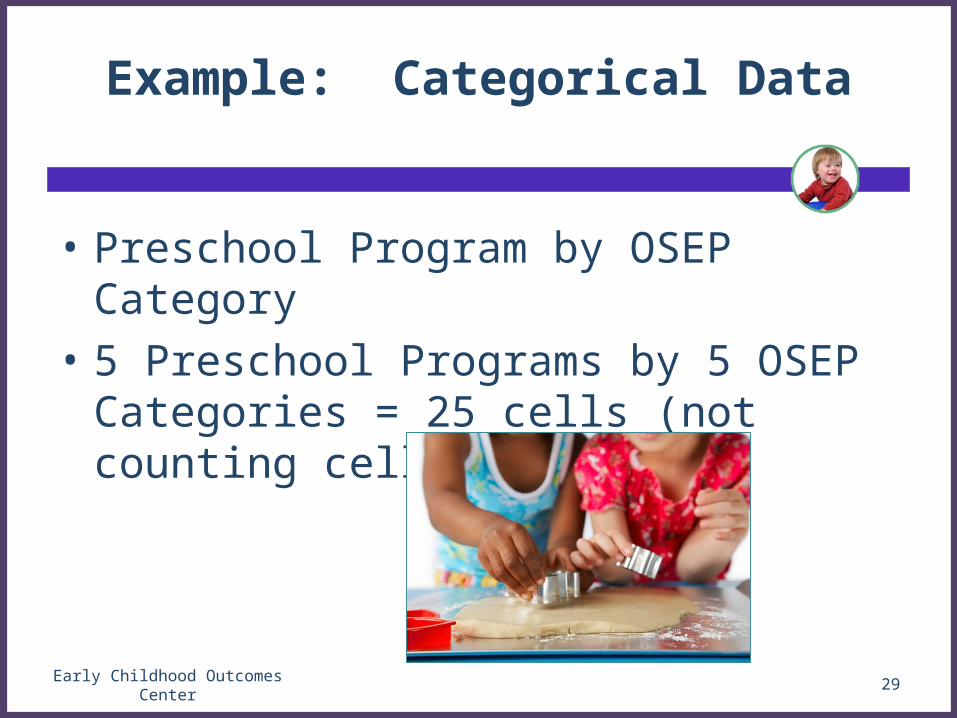
Example: Categorical Data
• Preschool Program by OSEP Category
• 5 Preschool Programs by 5 OSEP Categories = 25 cells (not counting cells for totals)
29Early Childhood Outcomes Center
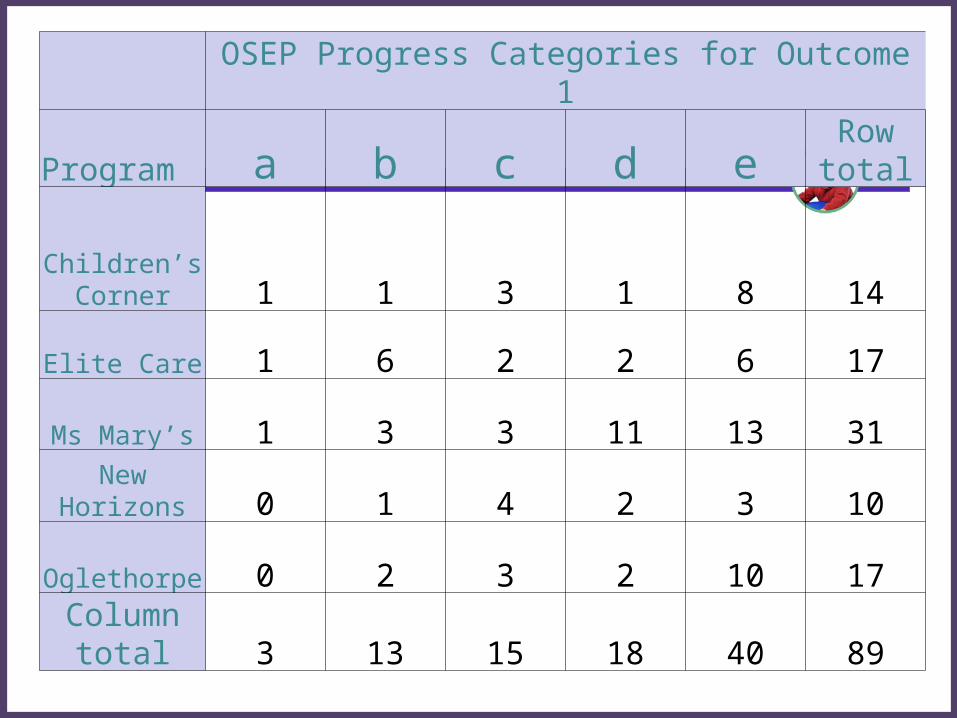
OSEP Progress Categories for Outcome 1
Program a b c d eRow total
Children’s Corner 1 1 3 1 8 14
Elite Care 1 6 2 2 6 17
Ms Mary’s 1 3 3 11 13 31New
Horizons 0 1 4 2 3 10
Oglethorpe 0 2 3 2 10 17Column
total 3 13 15 18 40 89
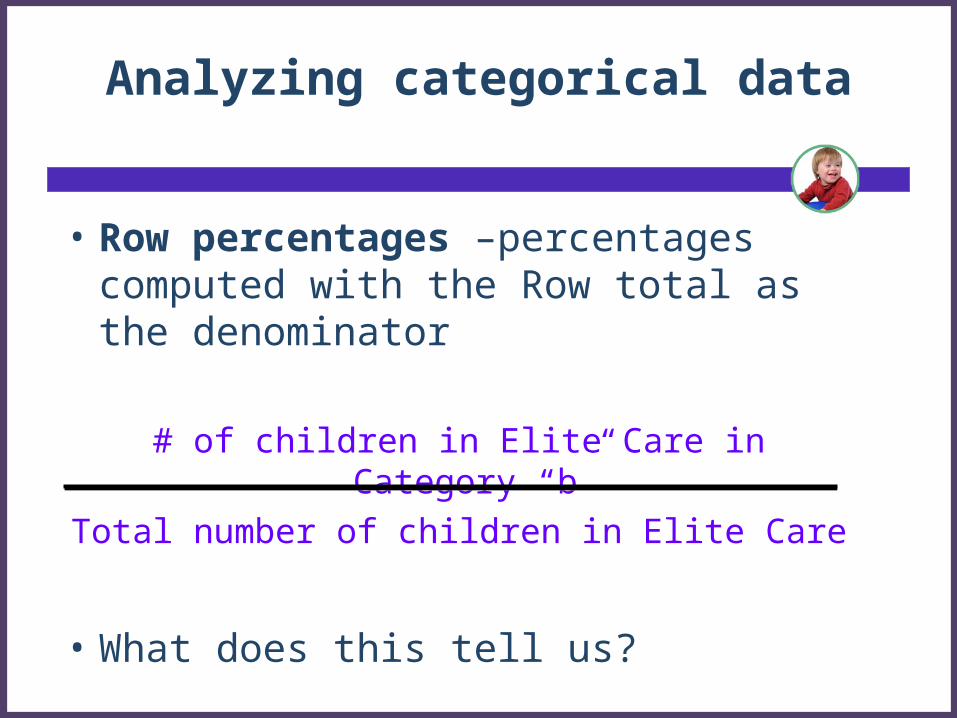
Analyzing categorical data
• Row percentages –percentages computed with the Row total as the denominator
# of children in Elite Care in Category “b”
Total number of children in Elite Care
• What does this tell us?
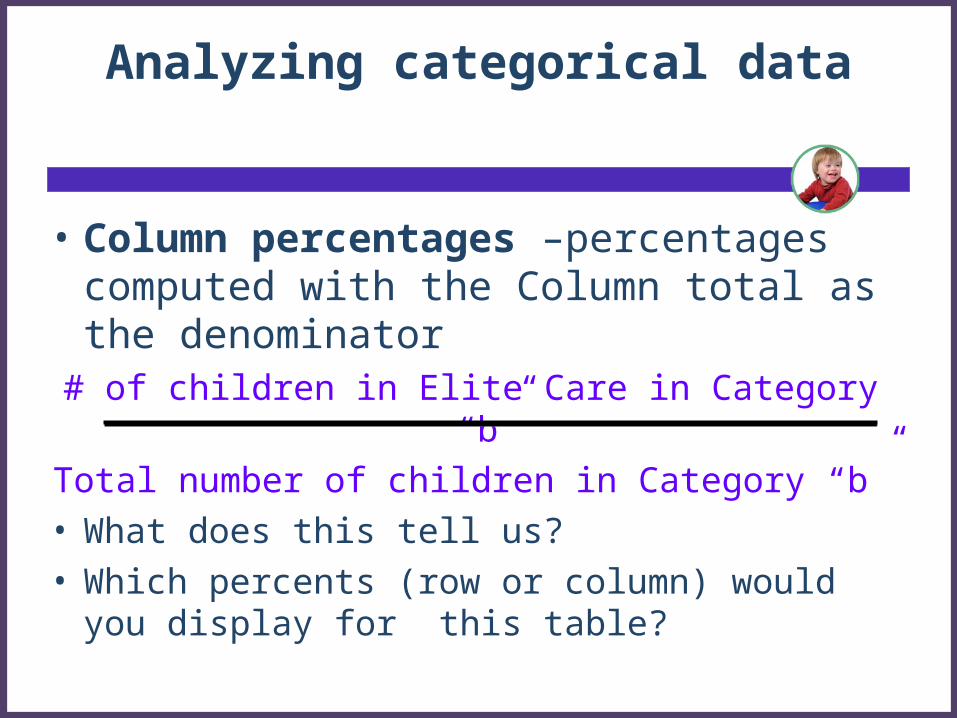
Analyzing categorical data
• Column percentages –percentages computed with the Column total as the denominator
# of children in Elite Care in Category “b”
Total number of children in Category “b”• What does this tell us?• Which percents (row or column) would you
display for this table?
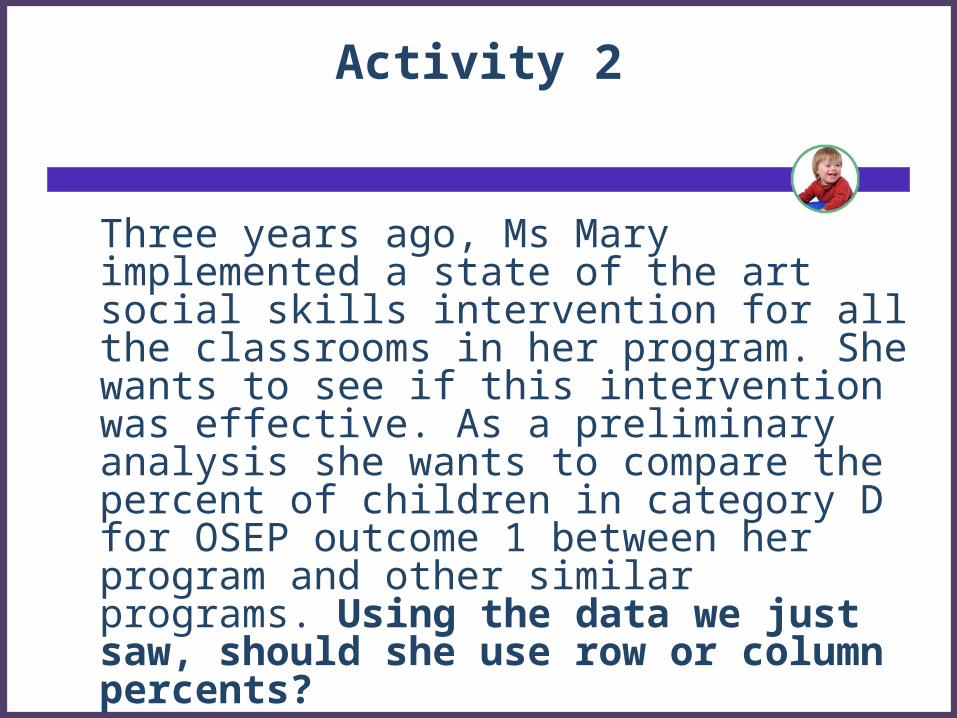
Activity 2
Three years ago, Ms Mary implemented a state of the art social skills intervention for all the classrooms in her program. She wants to see if this intervention was effective. As a preliminary analysis she wants to compare the percent of children in category D for OSEP outcome 1 between her program and other similar programs. Using the data we just saw, should she use row or column percents?
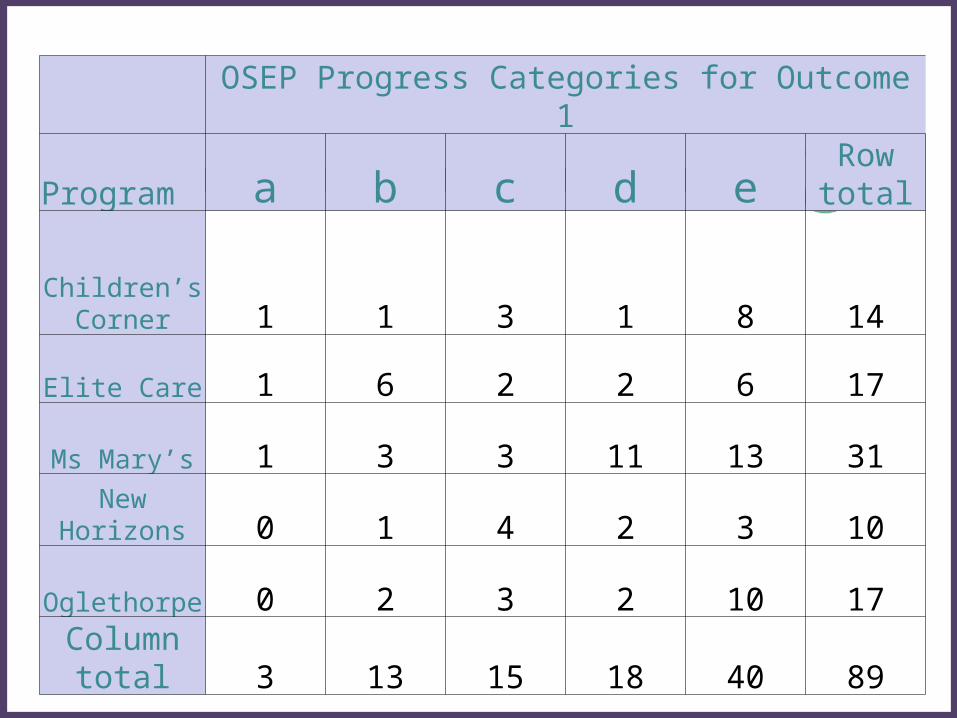
OSEP Progress Categories for Outcome 1
Program a b c d eRow total
Children’s Corner 1 1 3 1 8 14
Elite Care 1 6 2 2 6 17
Ms Mary’s 1 3 3 11 13 31New
Horizons 0 1 4 2 3 10
Oglethorpe 0 2 3 2 10 17Column
total 3 13 15 18 40 89
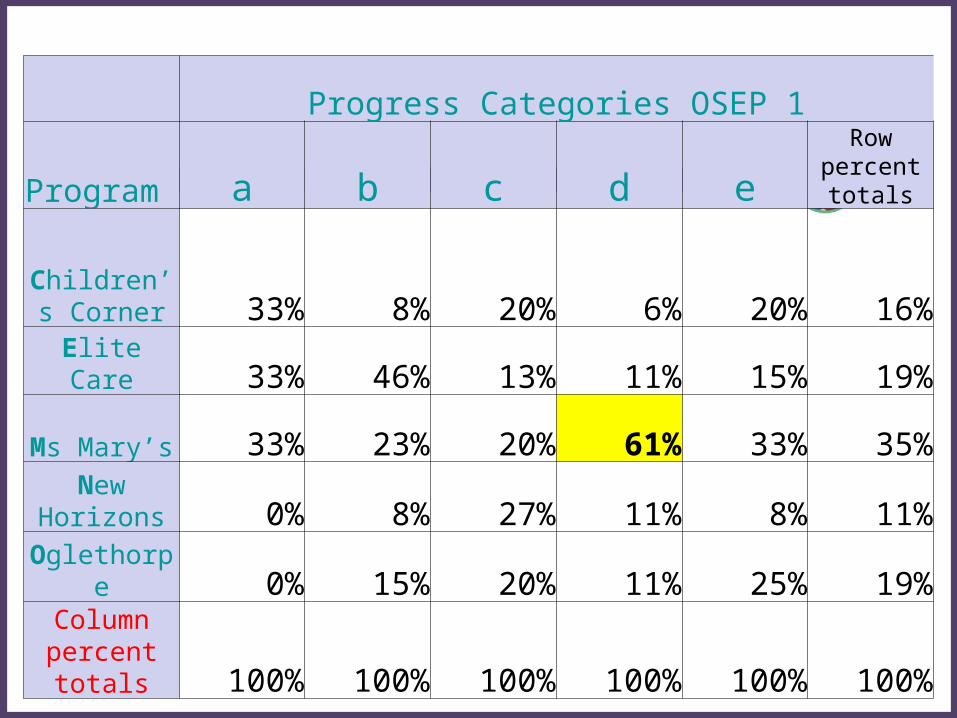
Progress Categories OSEP 1
Program a b c d e
Row percent totals
Children’s Corner 33% 8% 20% 6% 20% 16%
Elite Care 33% 46% 13% 11% 15% 19%
Ms Mary’s 33% 23% 20% 61% 33% 35%New
Horizons 0% 8% 27% 11% 8% 11%
Oglethorpe 0% 15% 20% 11% 25% 19%Column percent totals 100% 100% 100% 100% 100% 100%
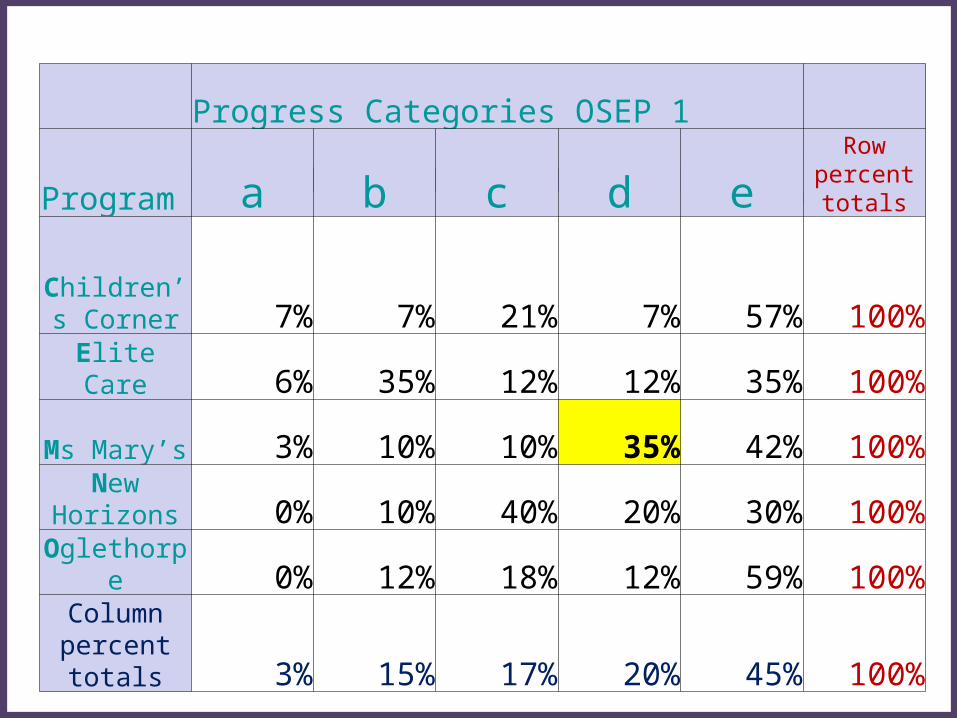
Progress Categories OSEP 1
Program a b c d eRow
percent totals
Children’s Corner 7% 7% 21% 7% 57% 100%
Elite Care 6% 35% 12% 12% 35% 100%
Ms Mary’s 3% 10% 10% 35% 42% 100%New
Horizons 0% 10% 40% 20% 30% 100%
Oglethorpe 0% 12% 18% 12% 59% 100%Column percent totals 3% 15% 17% 20% 45% 100%
Final results
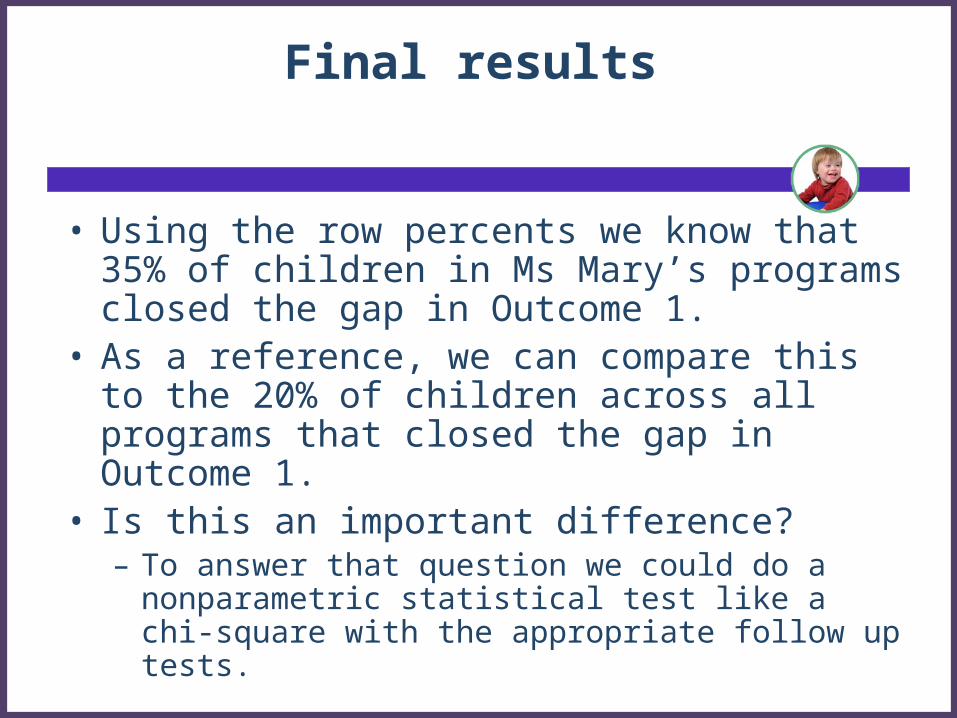
• Using the row percents we know that 35% of children in Ms Mary’s programs closed the gap in Outcome 1.
• As a reference, we can compare this to the 20% of children across all programs that closed the gap in Outcome 1.
• Is this an important difference? – To answer that question we could do a nonparametric
statistical test like a chi-square with the appropriate follow up tests.
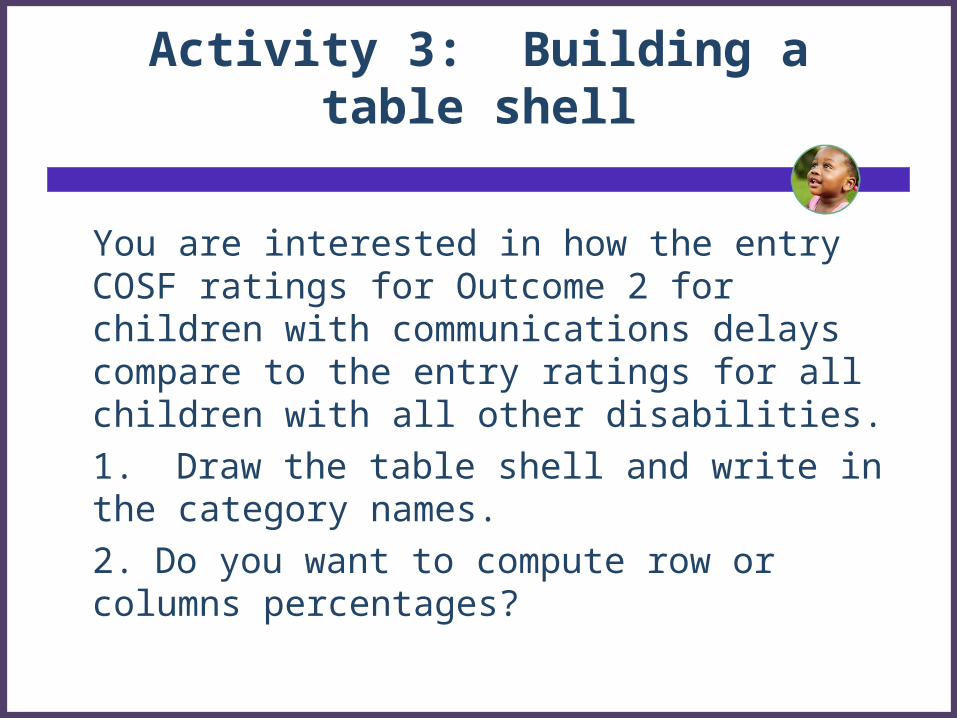
Activity 3: Building a table shell
You are interested in how the entry COSF ratings for Outcome 2 for children with communications delays compare to the entry ratings for all children with all other disabilities.
1. Draw the table shell and write in the category names.
2. Do you want to compute row or columns percentages?
Working with Data
Excel online training
http://office.microsoft.com/en-us/training/CR100479681033.aspx
40Early Childhood Outcomes Center
Data Explorations
• Computing with pivot tables– Frequencies– Cross-tabulations
• Learning to use the COSF Calculator
41Early Childhood Outcomes Center
Creating a Frequency Table: Primary Disability
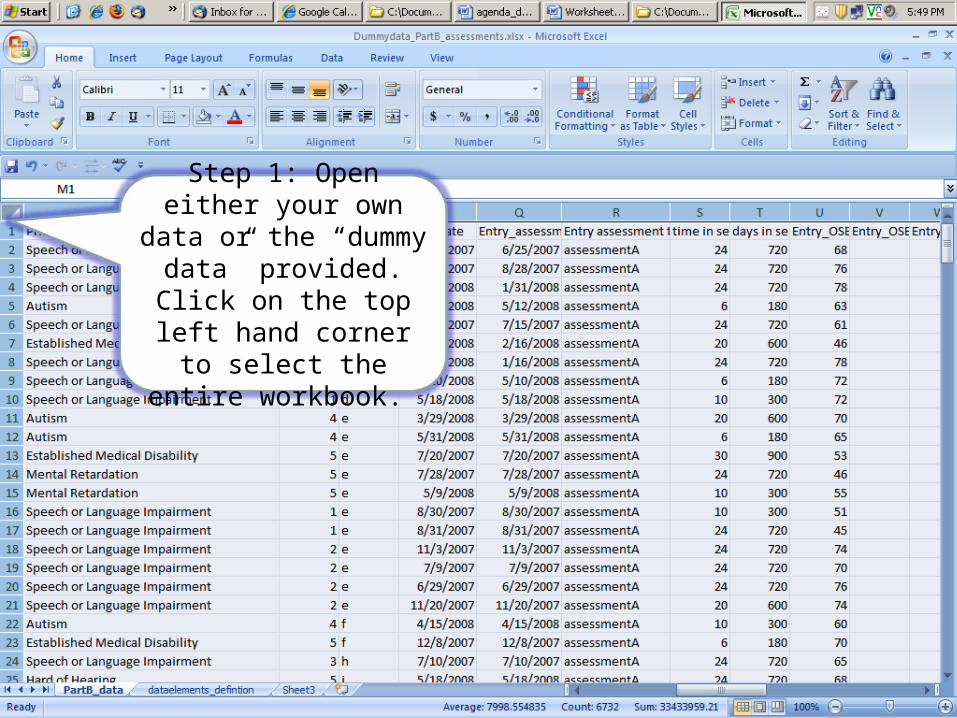
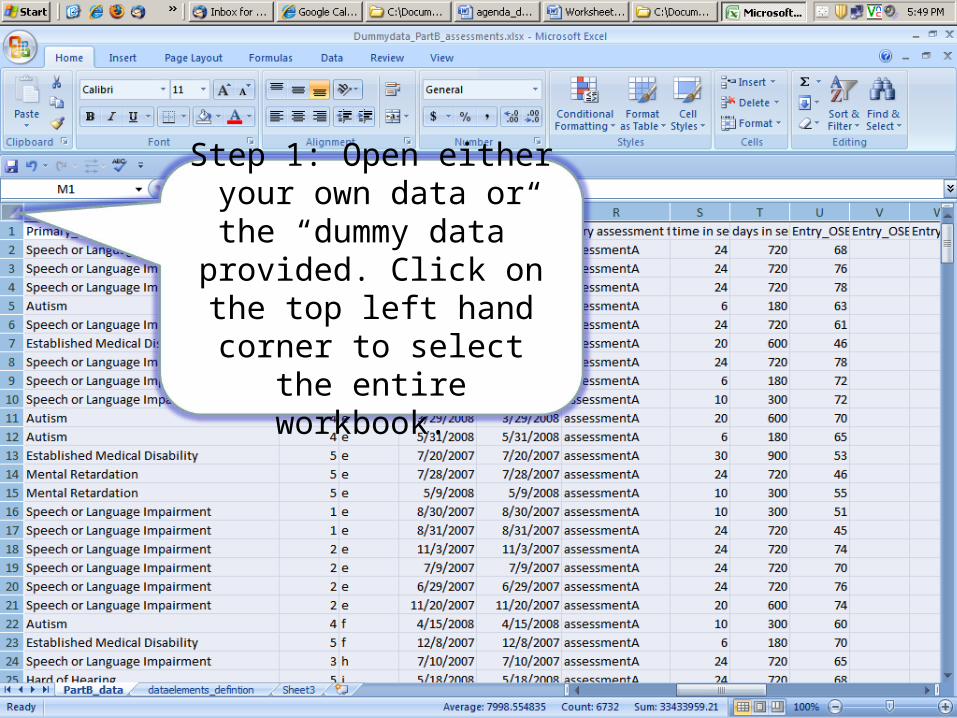
Step 1: Open either your own data or the
“dummy data” provided. Click on the top left
hand corner to select the entire workbook.
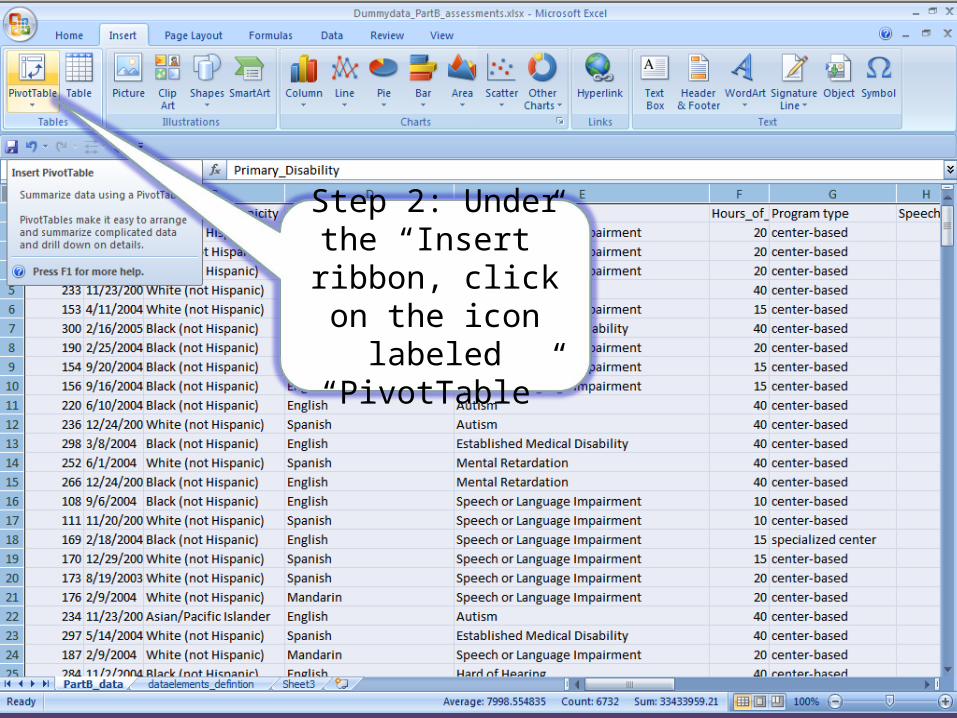
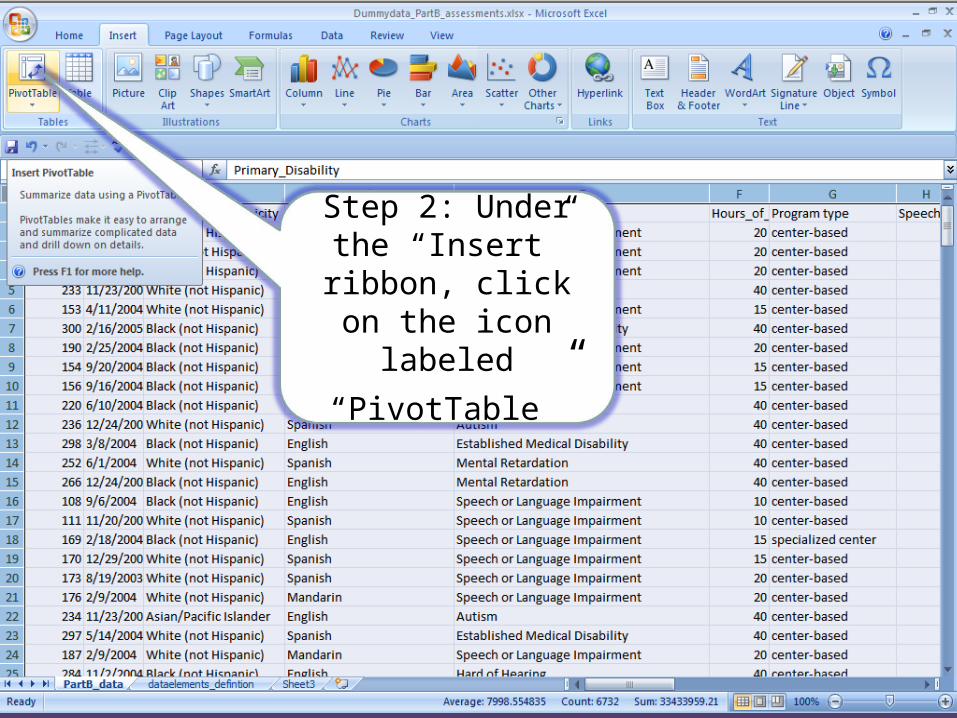
Step 2: Under the “Insert” ribbon,
click on the icon labeled
“PivotTable”
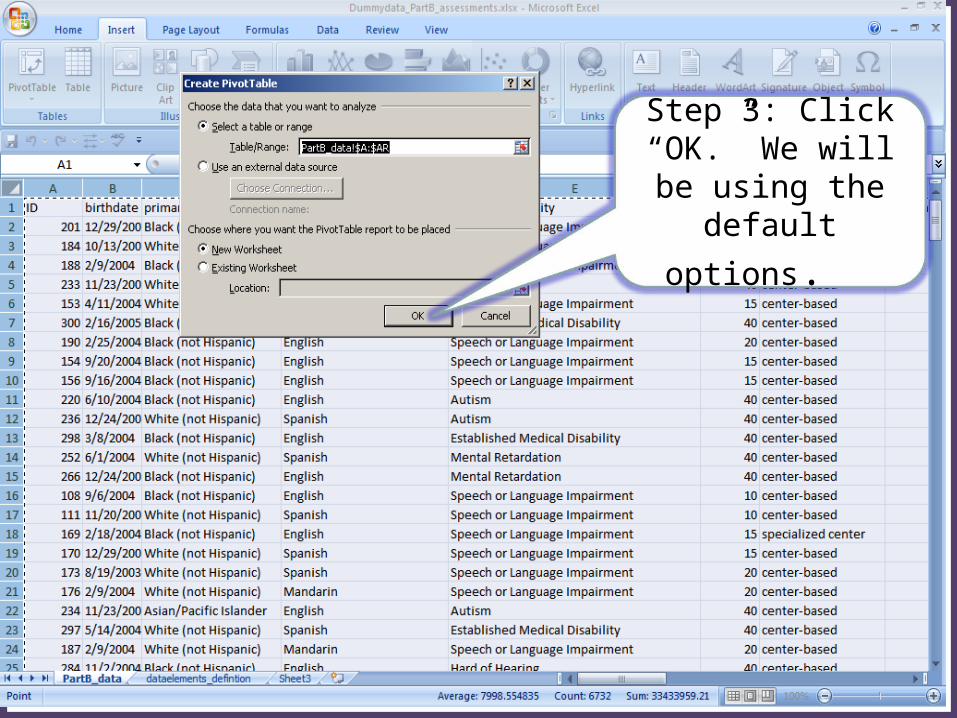
Step 3: Click “OK.” We will be using
the default options.
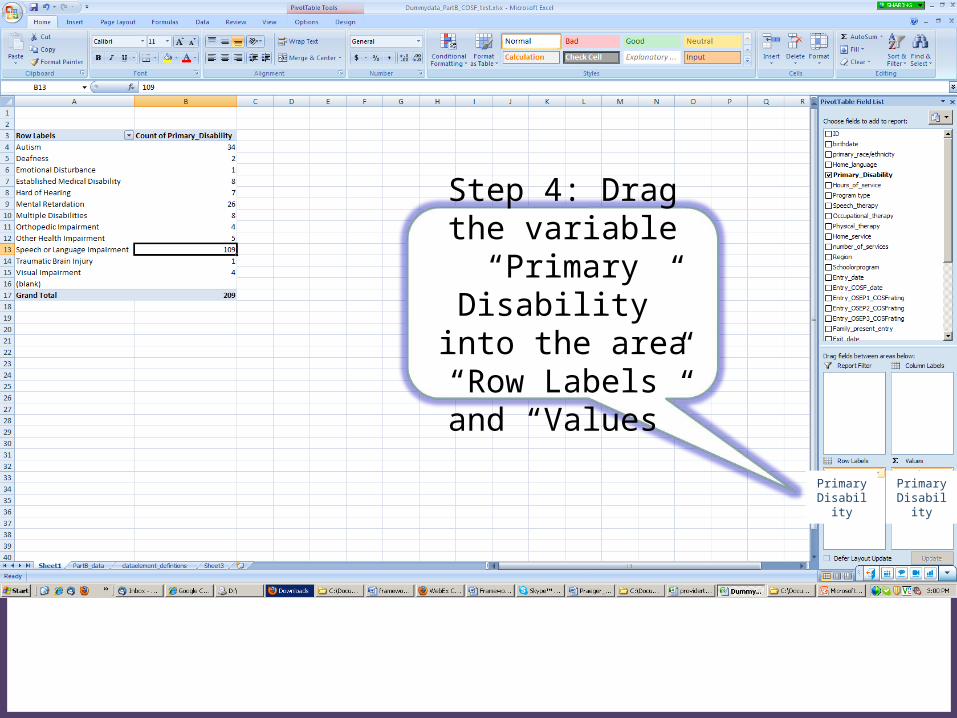
Step 4: Drag the variable “Primary Disability” into the area “Row Labels”
and “Values”
Primary Disability
Primary Disability
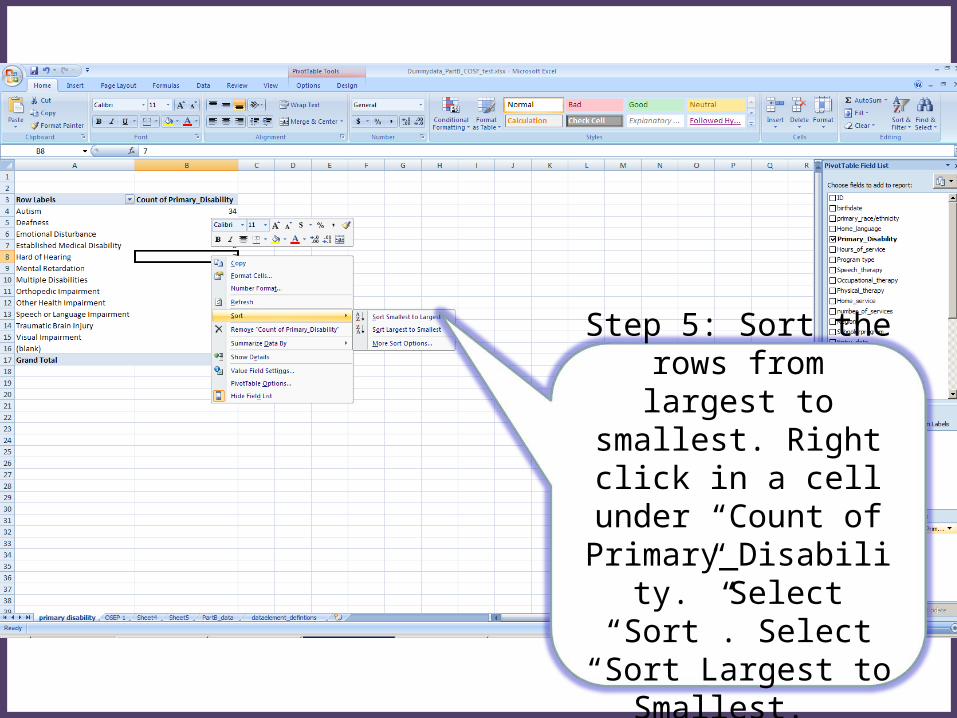
Step 5: Sort the rows from largest to
smallest. Right click in a cell under “Count of Primary_Disability.” Select “Sort”. Select
“Sort Largest to Smallest.
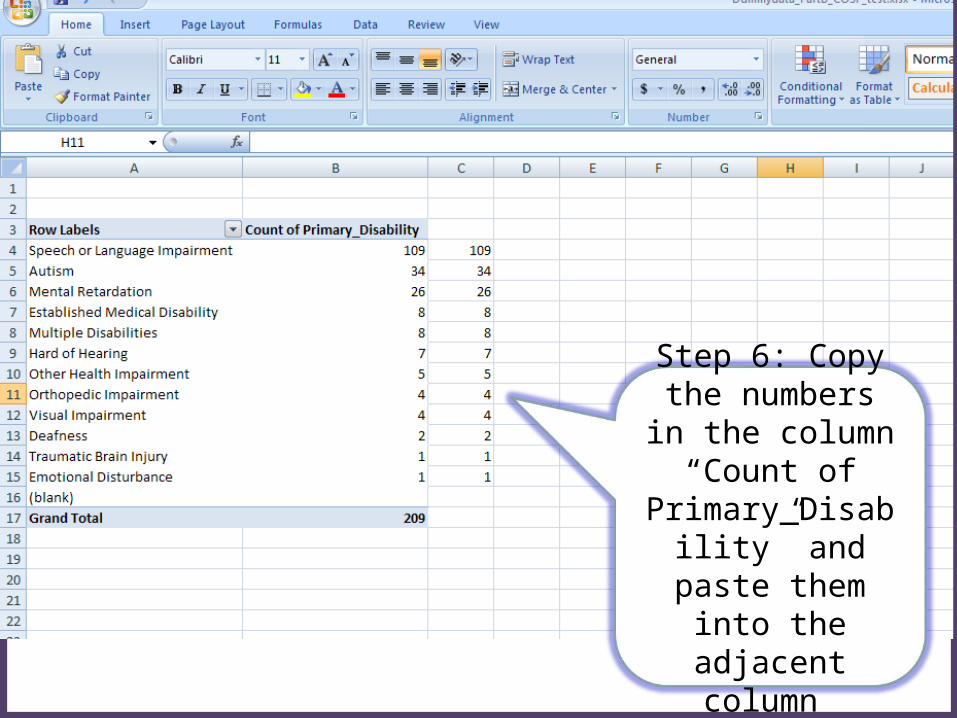
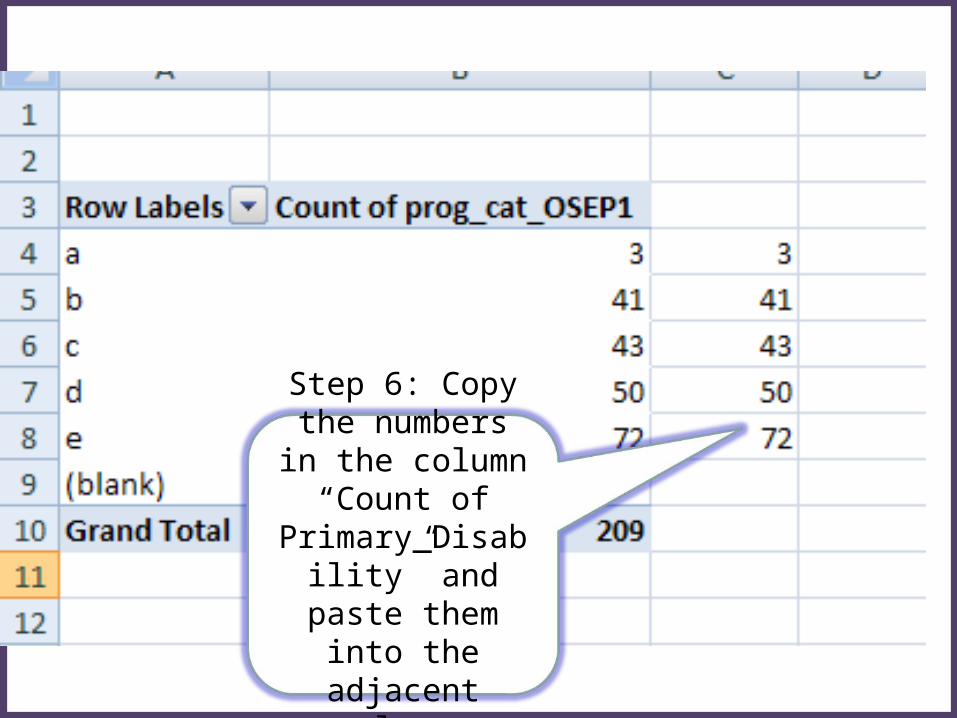
Step 6: Copy the numbers in the
column “Count of Primary_Disability” and paste them into the adjacent
column
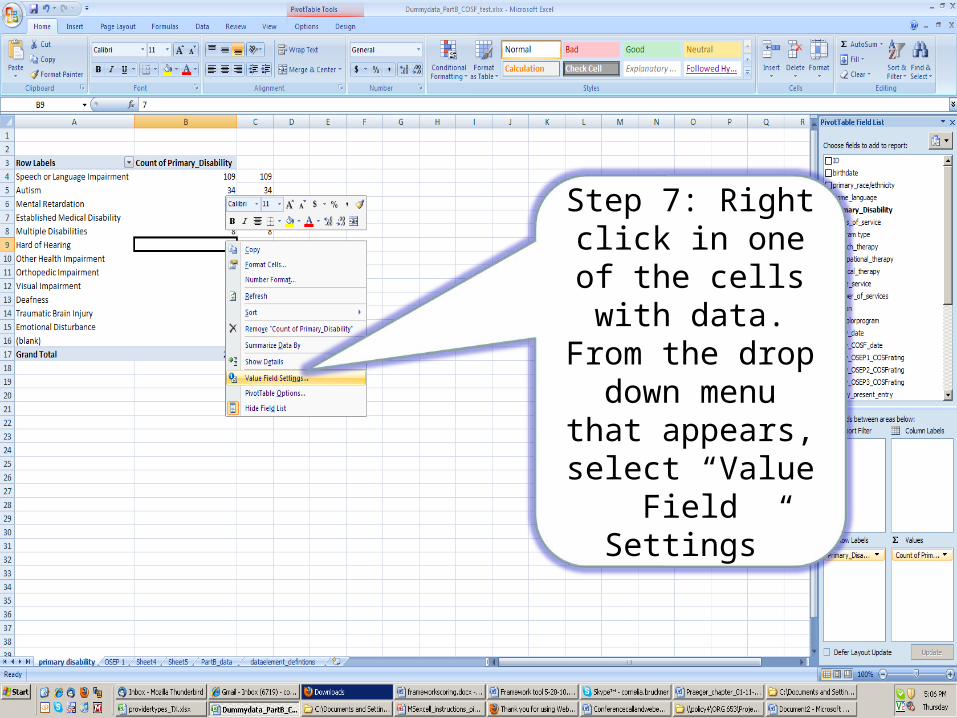
Step 7: Right click in one of the cells with data. From the drop down
menu that appears, select
“Value Field Settings”
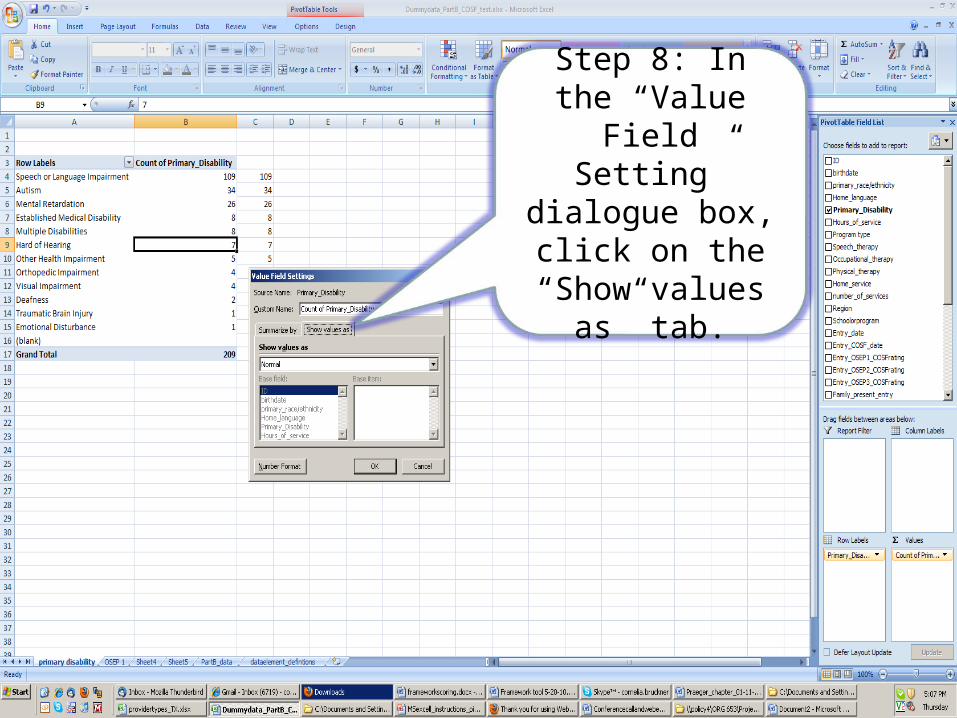
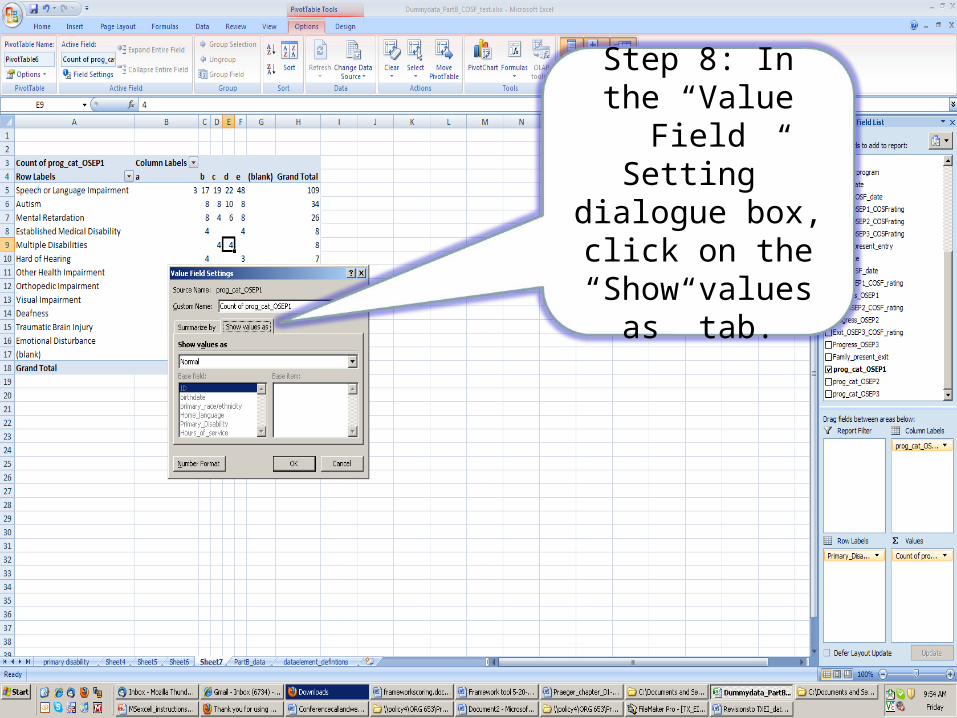
Step 8: In the “Value Field
Setting” dialogue box, click on the “Show values as”
tab.
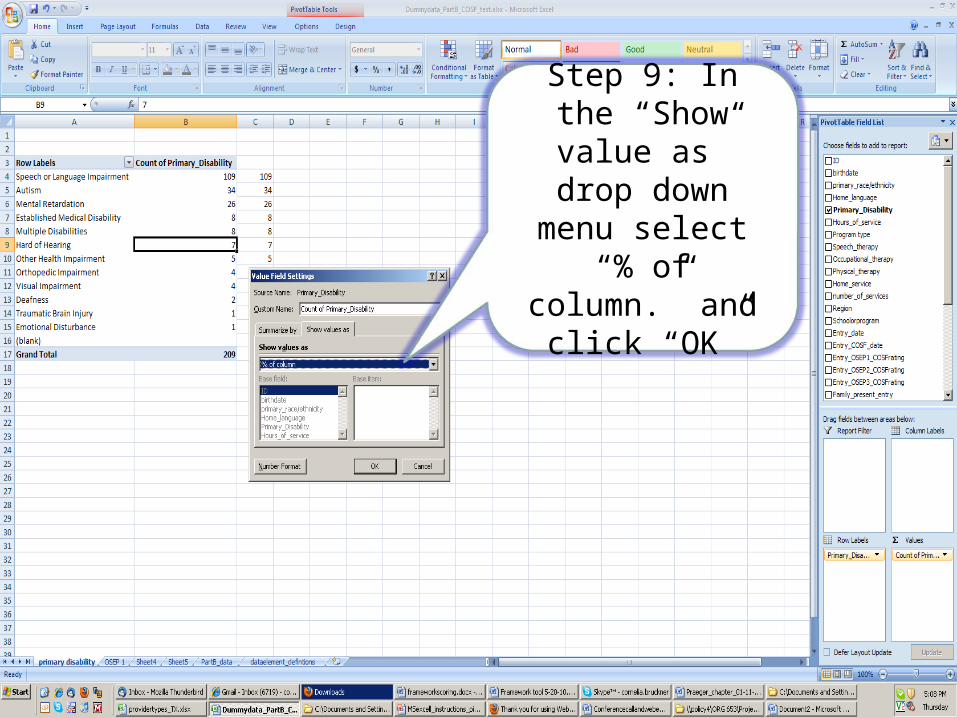
Step 9: In the “Show value as” drop down menu
select “% of column.” and click
“OK”
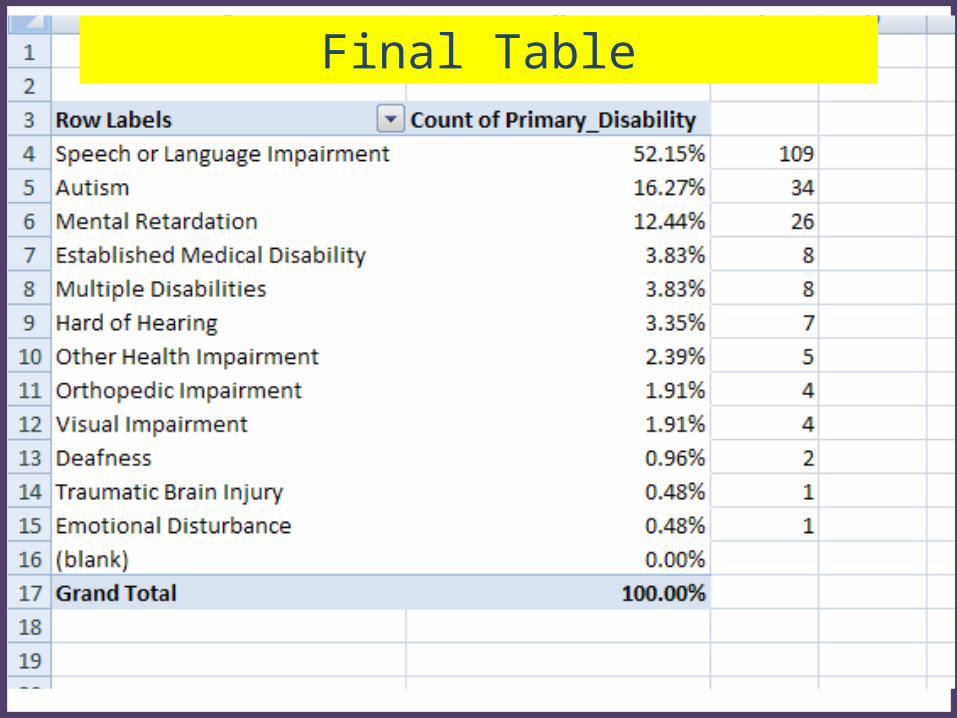
Final Table
Creating a table with percent of children in each progress category
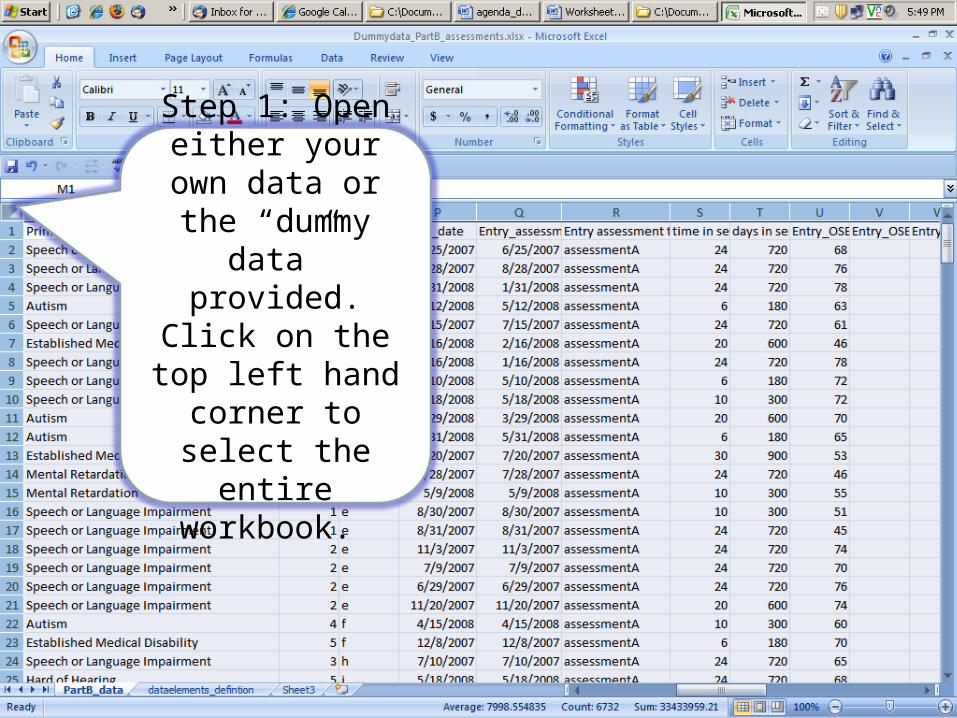
Step 1: Open either your own
data or the “dummy data”
provided. Click on the top left hand corner to select
the entire workbook.
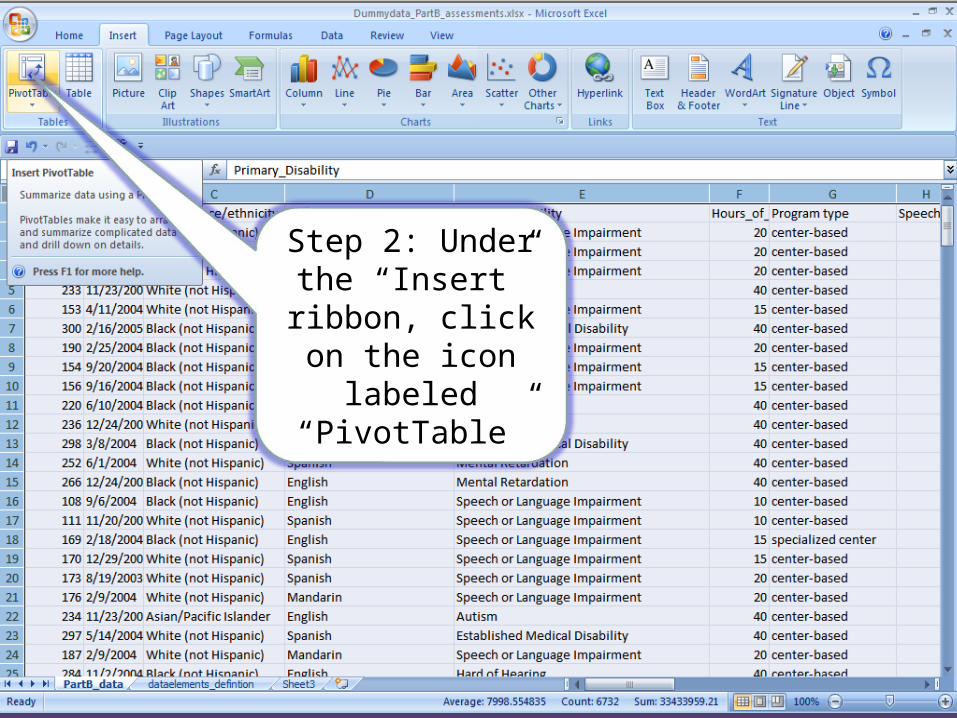
Step 2: Under the “Insert” ribbon,
click on the icon labeled
“PivotTable”

Step 3: Click “OK.” We will be using
the default options.
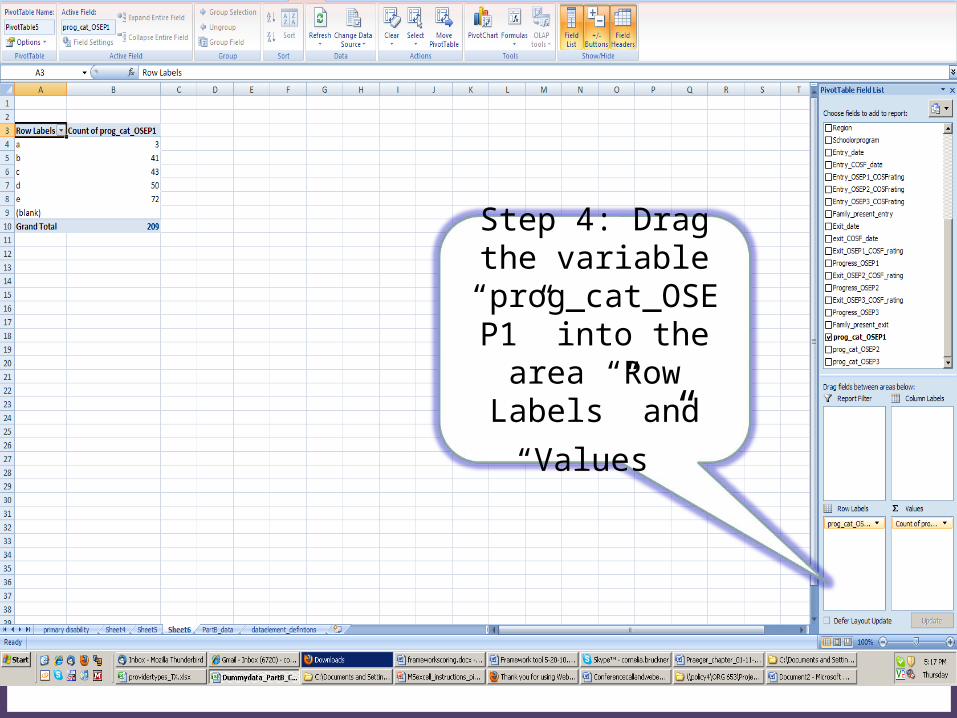
Step 4: Drag the variable
“prog_cat_OSEP1” into the area
“Row Labels” and
“Values”
Step 6: Copy the numbers in the
column “Count of Primary_Disability” and paste them into the adjacent
column
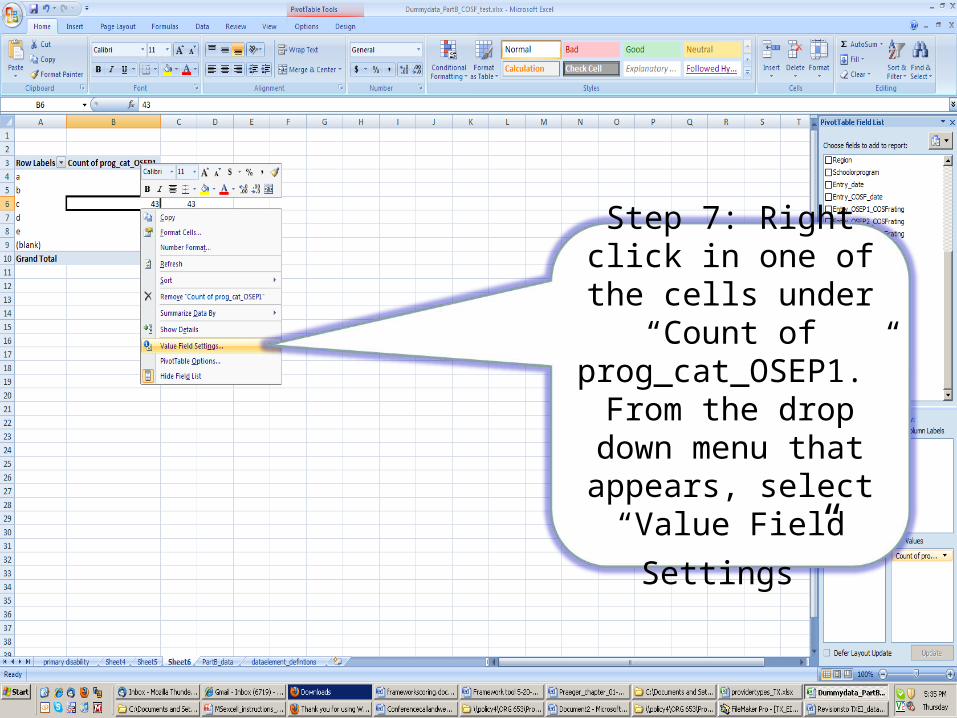
Step 7: Right click in one of the cells under
“Count of prog_cat_OSEP1.”
From the drop down menu that appears, select “Value Field
Settings”
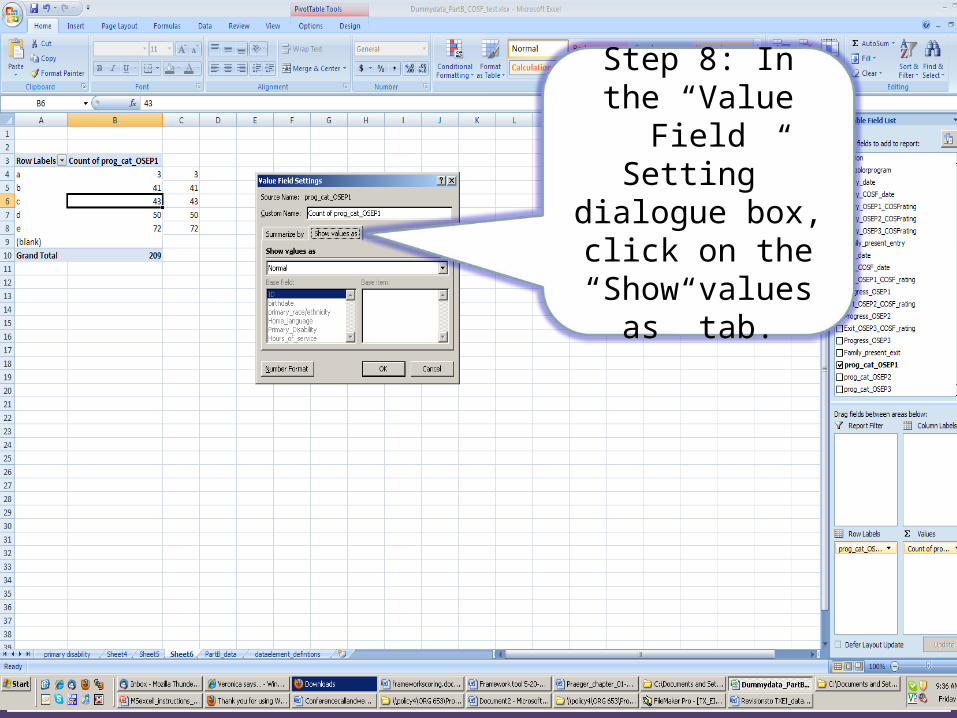
Step 8: In the “Value Field
Setting” dialogue box, click on the “Show values as”
tab.
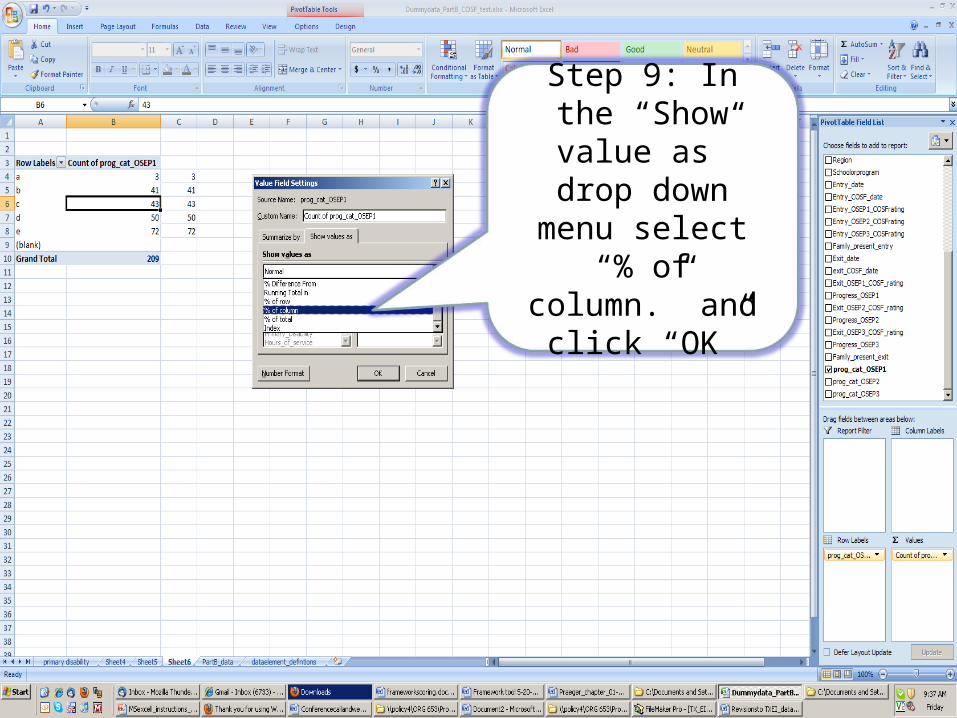
Step 9: In the “Show value as” drop down menu
select “% of column.” and click
“OK”
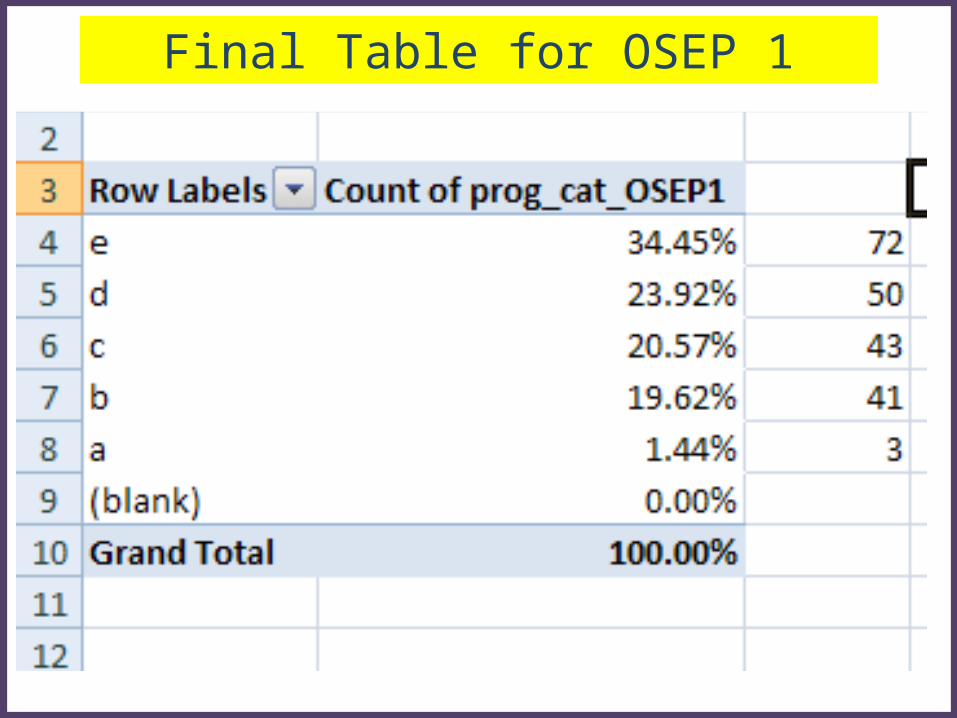
Final Table for OSEP 1
Creating a crosstab report of Primary Disability by Progress Categories
Step 1: Open either your own data or the “dummy data” provided. Click on
the top left hand corner to select the entire
workbook.
Step 2: Under the “Insert” ribbon, click on the icon labeled
“PivotTable”

Step 3: Click “OK.” We will be using
the default options.
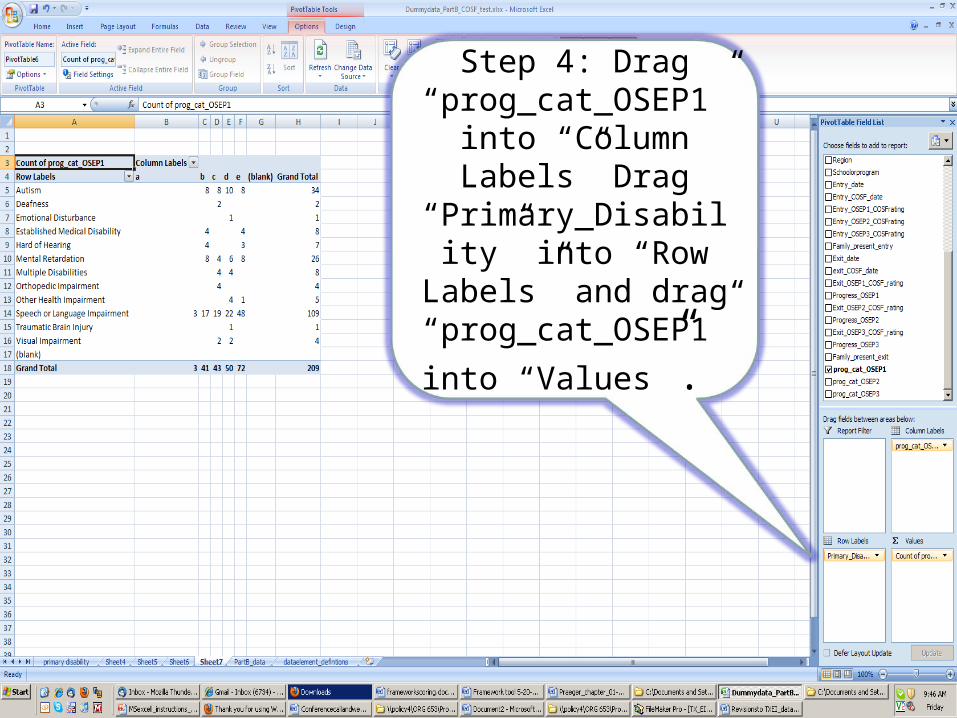
Step 4: Drag “prog_cat_OSEP1”
into “Column Labels” Drag
“Primary_Disability” into “Row Labels” and
drag “prog_cat_OSEP1”
into “Values”.
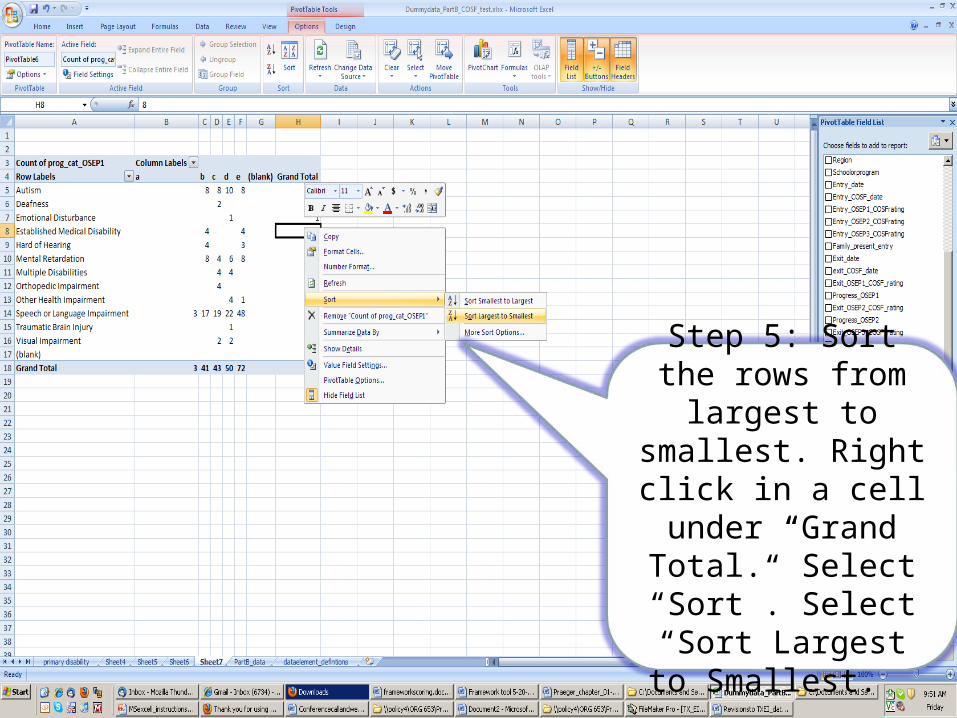
Step 5: Sort the rows from largest to
smallest. Right click in a cell under
“Grand Total.” Select “Sort”. Select “Sort
Largest to Smallest.
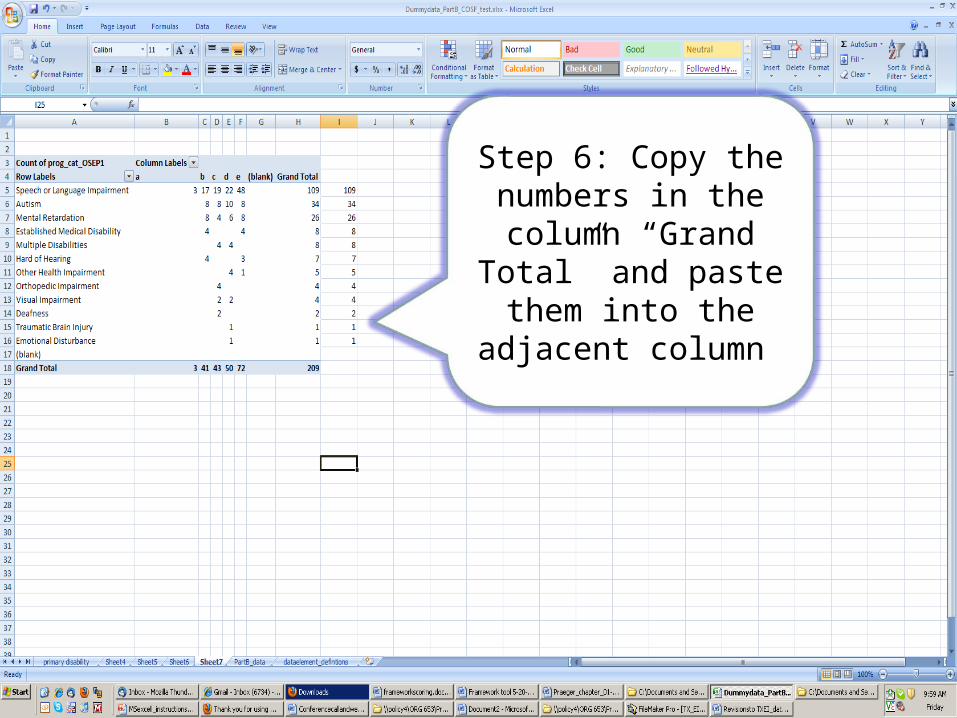
Step 6: Copy the numbers in the
column “Grand Total” and paste them into the adjacent column
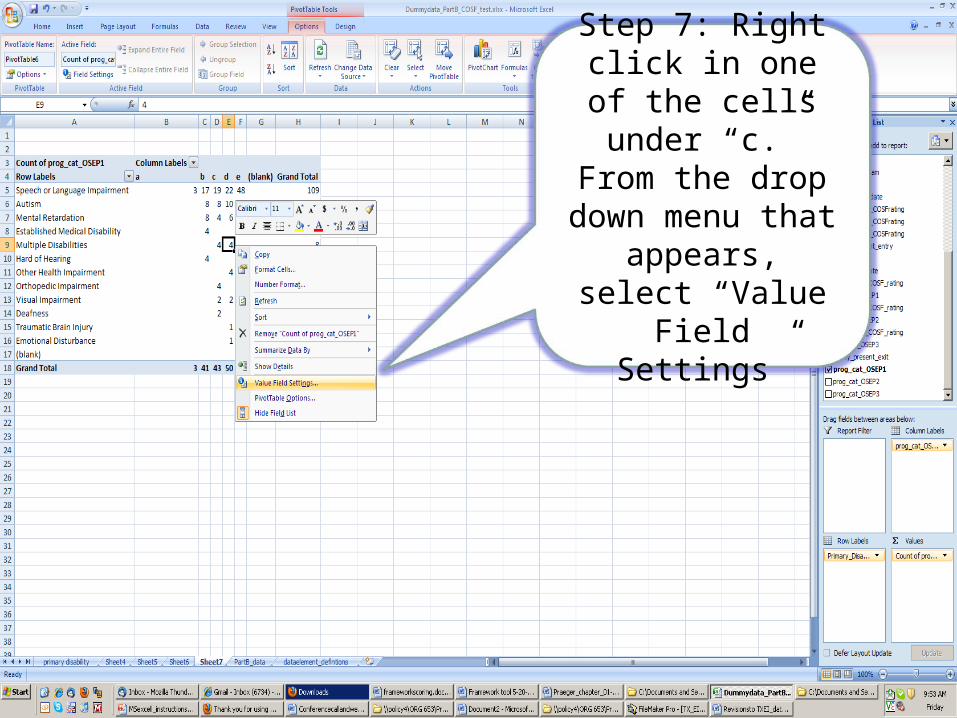
Step 7: Right click in one of the cells
under “c.” From the drop down menu
that appears, select “Value Field
Settings”
Step 8: In the “Value Field
Setting” dialogue box, click on the “Show values as”
tab.
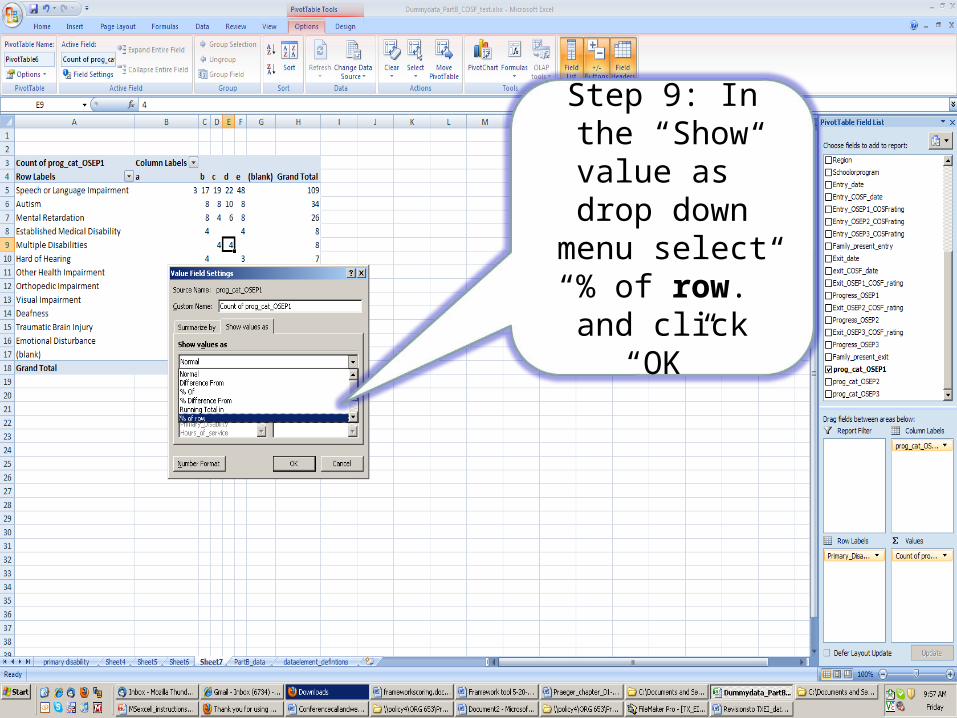
Step 9: In the “Show value as” drop down menu select “% of row.”
and click “OK”
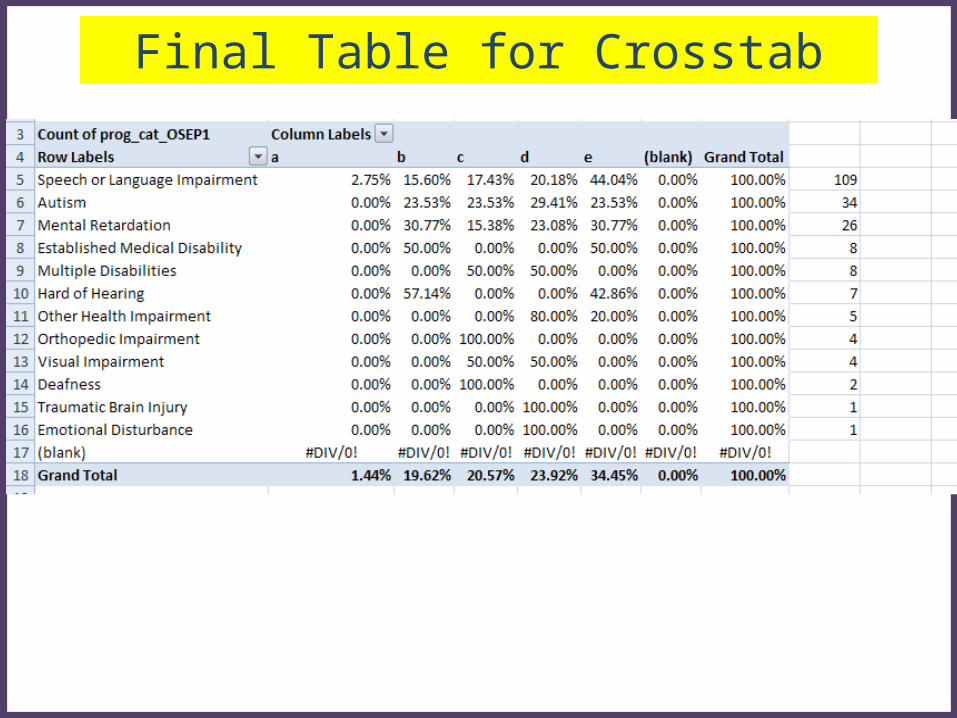
Final Table for Crosstab
74
Find more resources at: www. the-eco-center-org
Thank you!!