Embed Size (px)
Citation preview
@ApartmentWire#NMHCresearch
2019 NMHC Research ForumApril 2-3, 2019
@ApartmentWire#NMHCresearch
Data Analytics and Visualization Workshop
@ApartmentWire#NMHCresearch
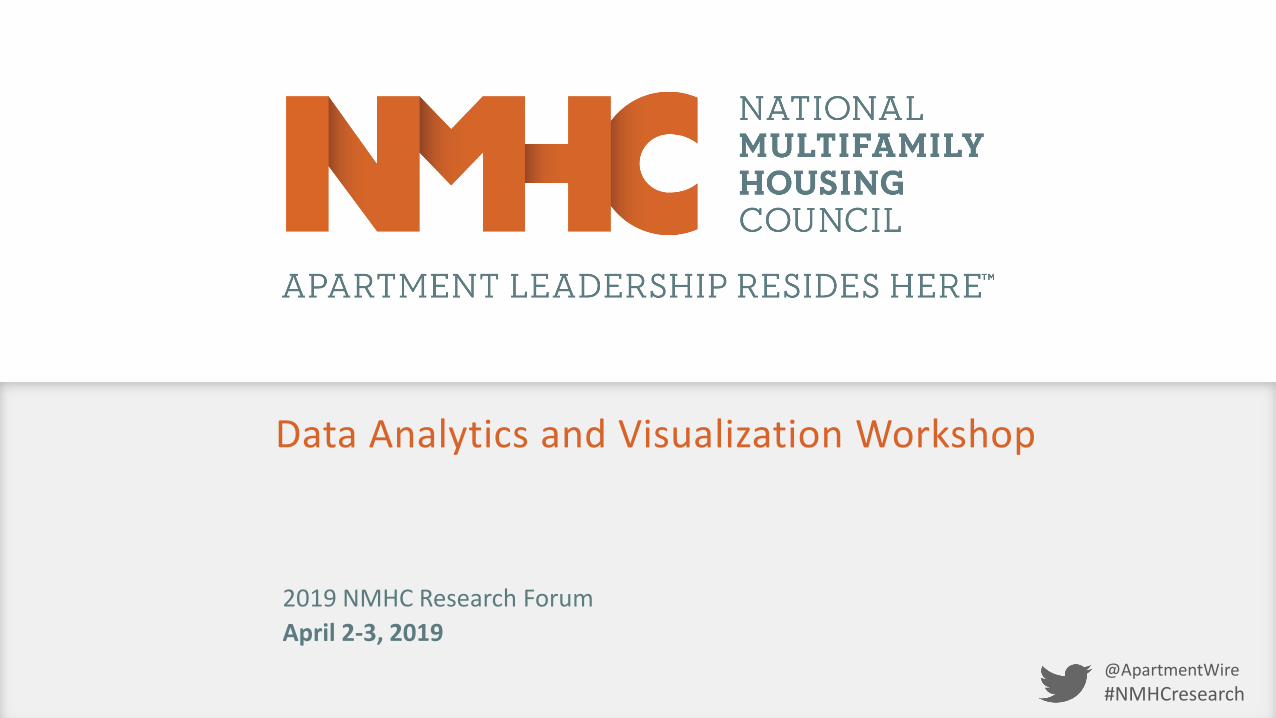
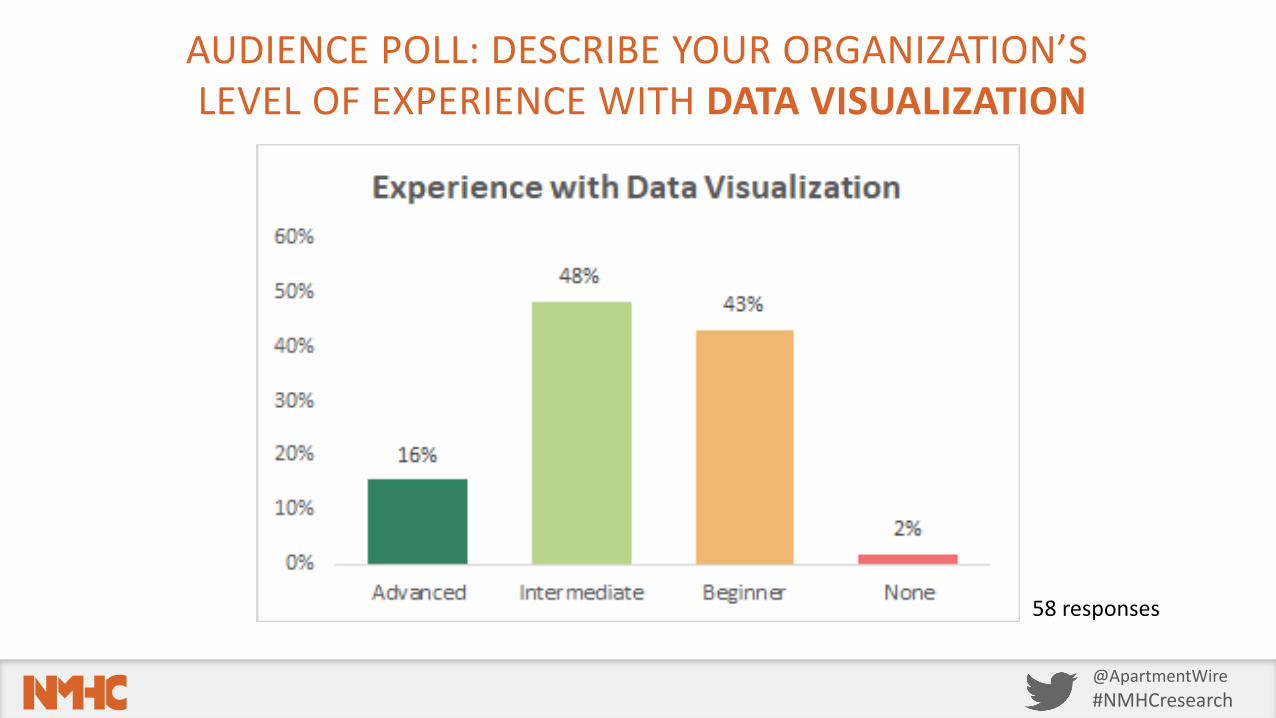
TODAY’S WORKSHOP
• Overview• Data Analytics• Data Visualization• Questions and
Discussion
Purpose:
Provide overview and examples of approaches to data analysis and data visualization for the multifamily sector.
@ApartmentWire#NMHCresearch
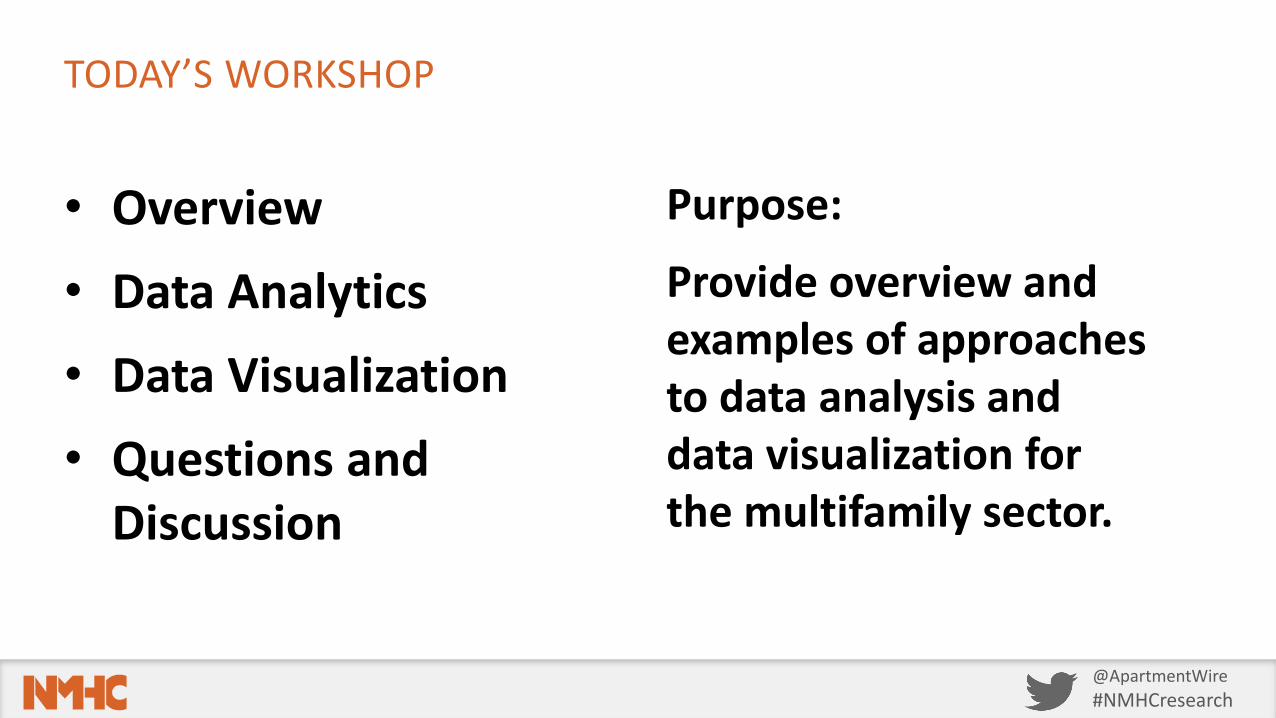
AUDIENCE POLL: DESCRIBE YOUR ORGANIZATION’SLEVEL OF EXPERIENCE WITH DATA VISUALIZATION
58 responses
@ApartmentWire#NMHCresearch
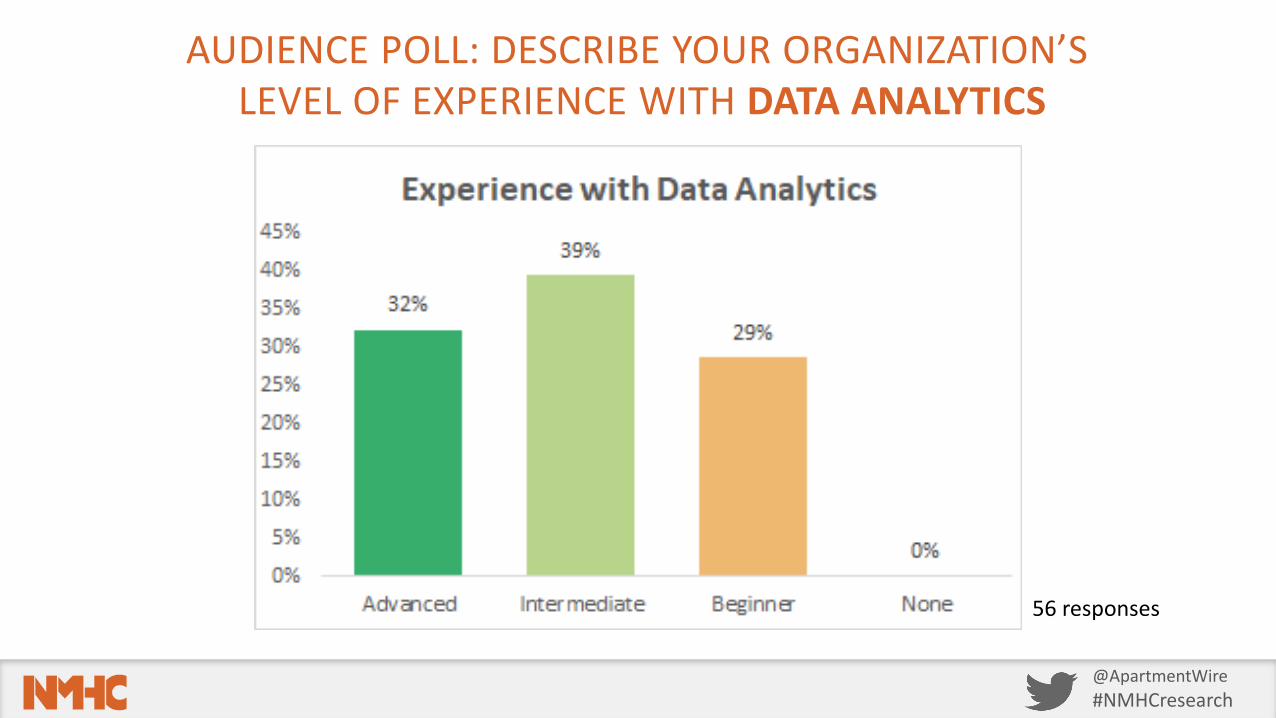
AUDIENCE POLL: DESCRIBE YOUR ORGANIZATION’SLEVEL OF EXPERIENCE WITH DATA ANALYTICS
56 responses
@ApartmentWire#NMHCresearch
WHY IS THIS WORTH AN HOUR OF MY TIME?
• CRE industry has lagged in technology adoption
• Data. More data. And more data…
• Need for actionable insights
• Need an advantage in the competitive marketplace
@ApartmentWire#NMHCresearch
TERMS AND BUZZWORDS
• Data Analytics• Data Visualization• Data Science• Big Data• Predictive Analytics• Machine Learning• Business Analytics• Data Analysis• Business Intelligence
• Self-Service BI• Dashboarding• Ad-Hoc Reporting• Data Lake• Data Warehouse• OLAP• KPIs
@ApartmentWire#NMHCresearch
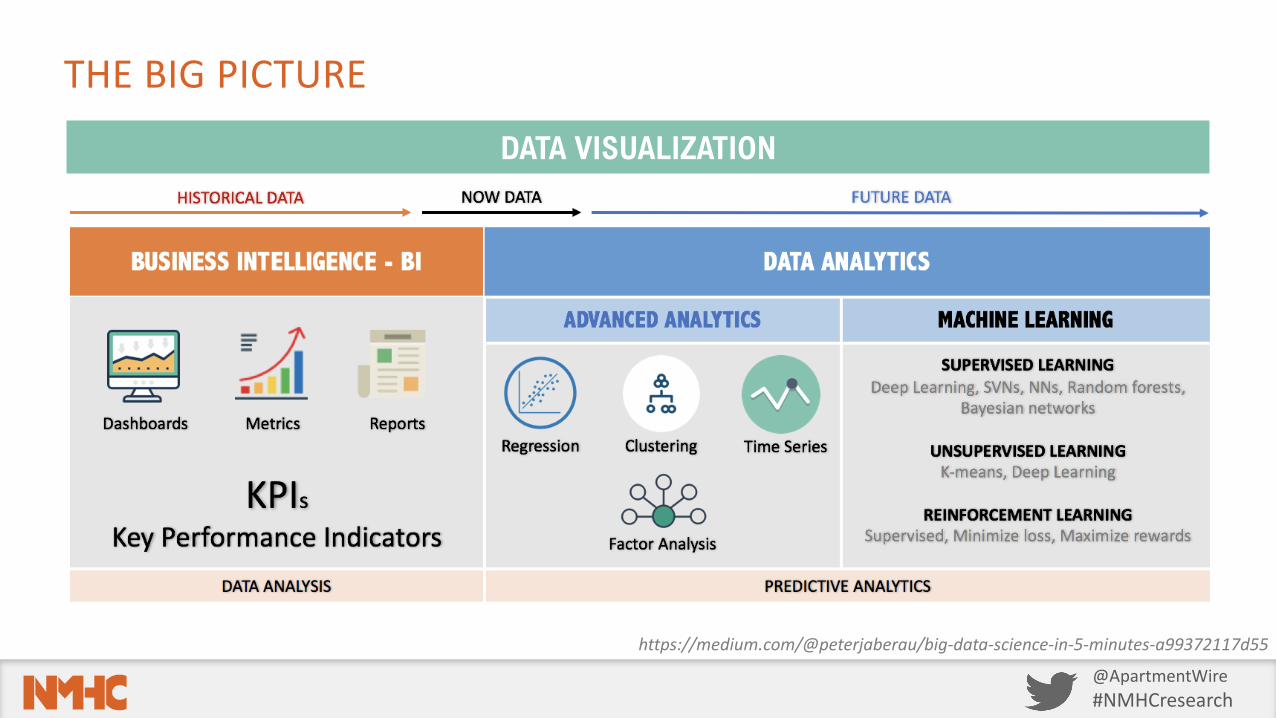
THE BIG PICTURE
https://medium.com/@peterjaberau/big-data-science-in-5-minutes-a99372117d55
DATA VISUALIZATION
@ApartmentWire#NMHCresearch
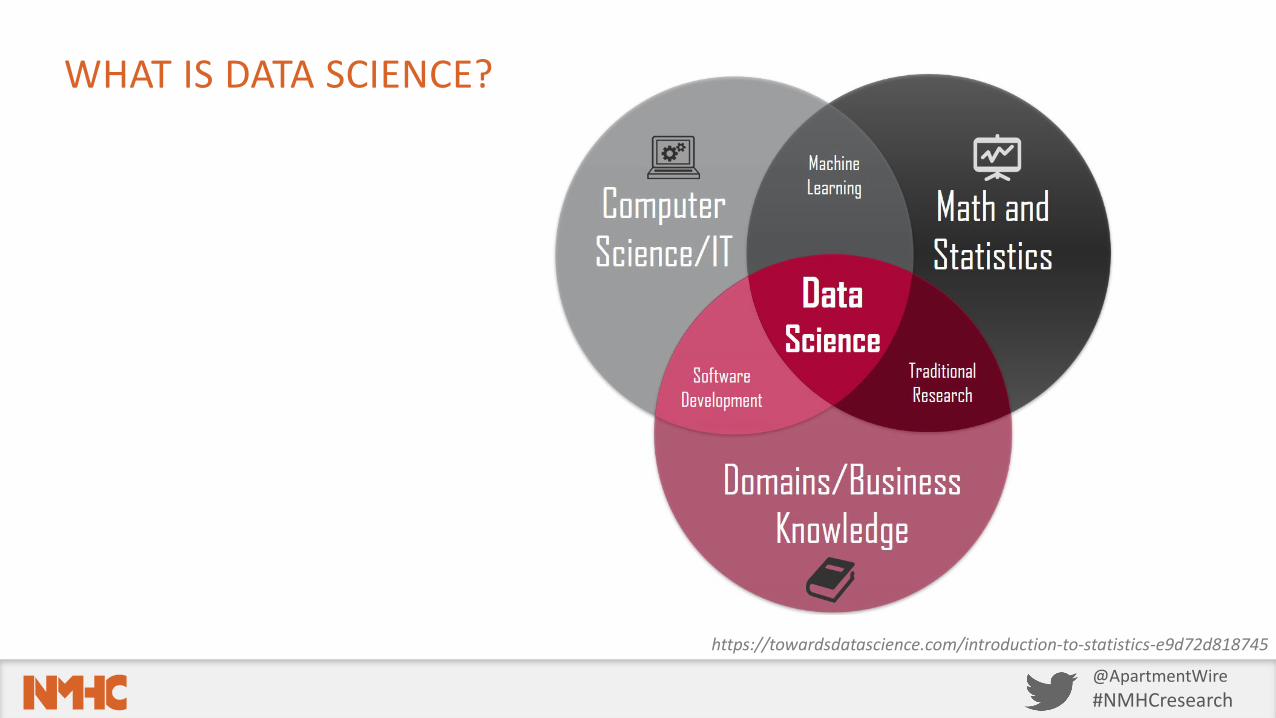
WHAT IS DATA SCIENCE?
https://towardsdatascience.com/introduction-to-statistics-e9d72d818745
@ApartmentWire#NMHCresearch
DATA ANALYTICS
@ApartmentWire#NMHCresearch
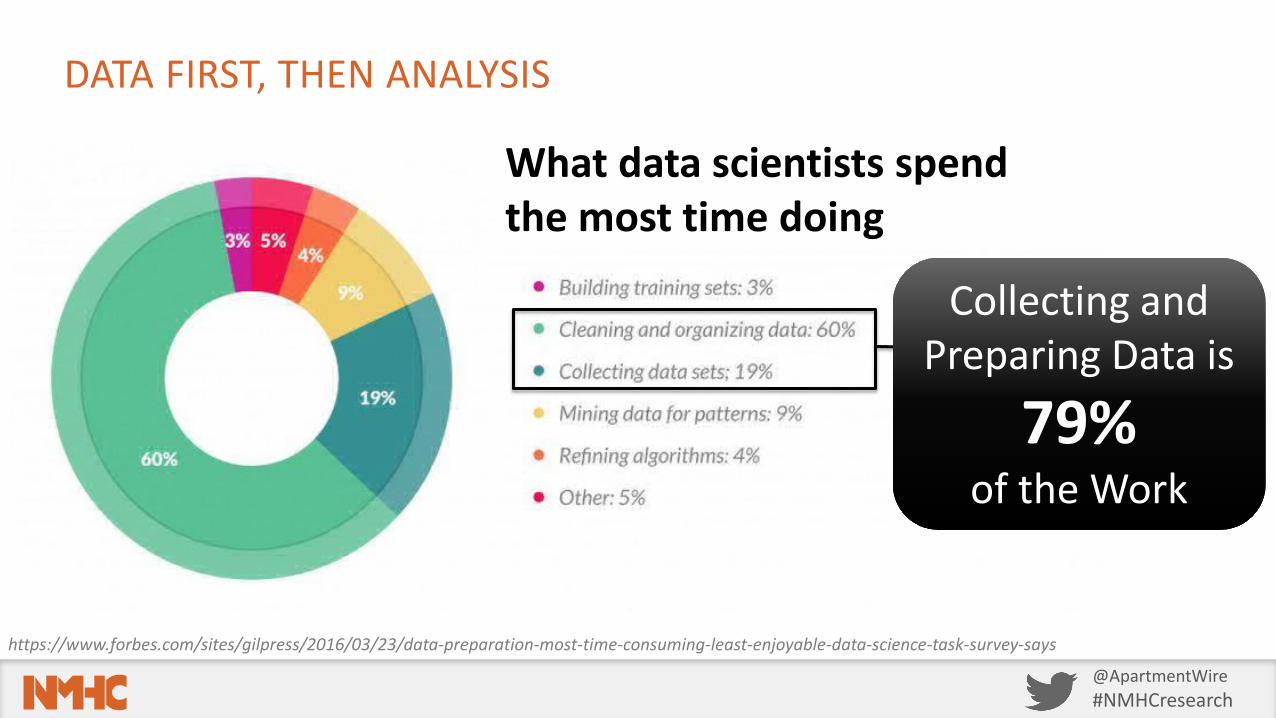
DATA FIRST, THEN ANALYSIS
https://www.forbes.com/sites/gilpress/2016/03/23/data-preparation-most-time-consuming-least-enjoyable-data-science-task-survey-says
Collecting and Preparing Data is
79%of the Work
What data scientists spendthe most time doing

@ApartmentWire#NMHCresearch
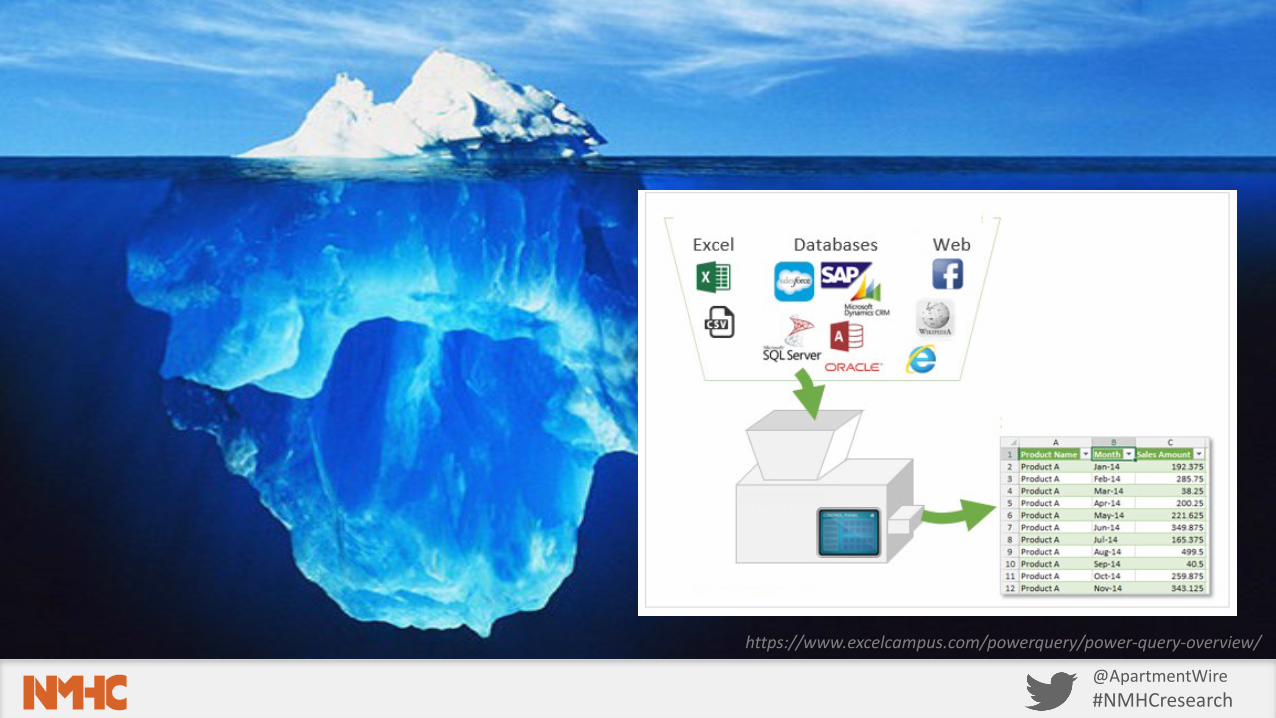
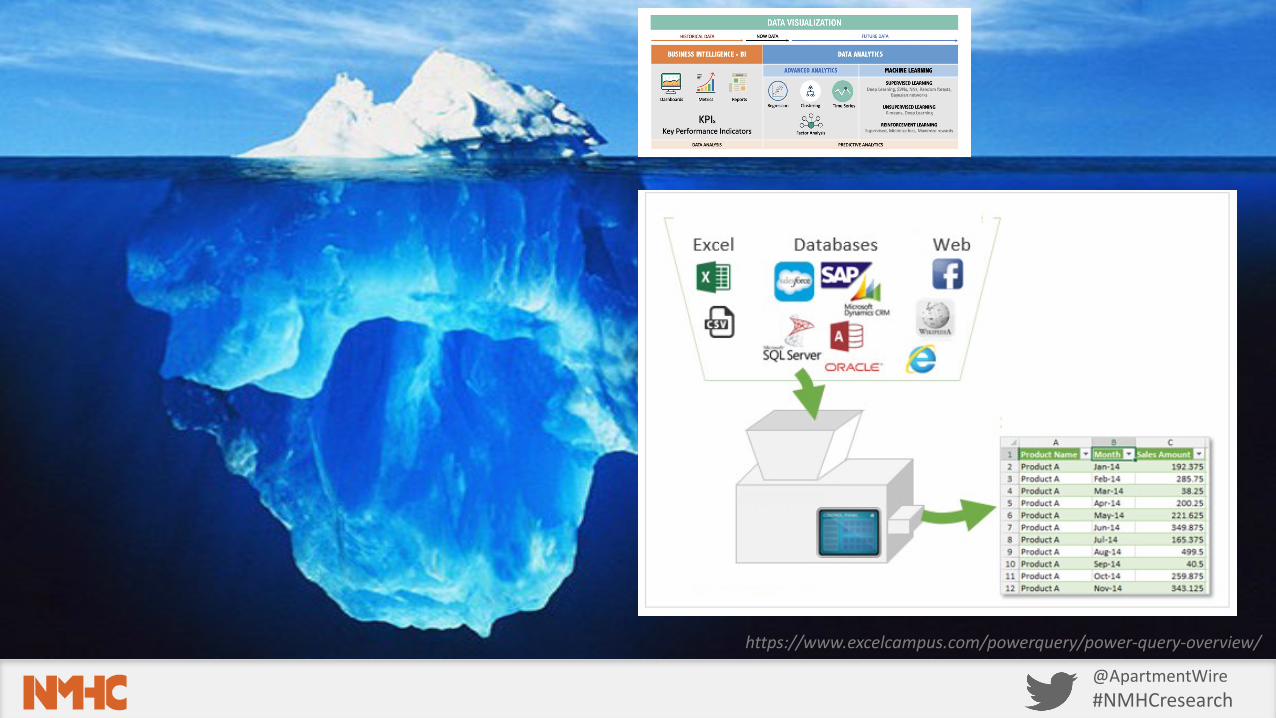
https://www.excelcampus.com/powerquery/power-query-overview/
@ApartmentWire#NMHCresearch
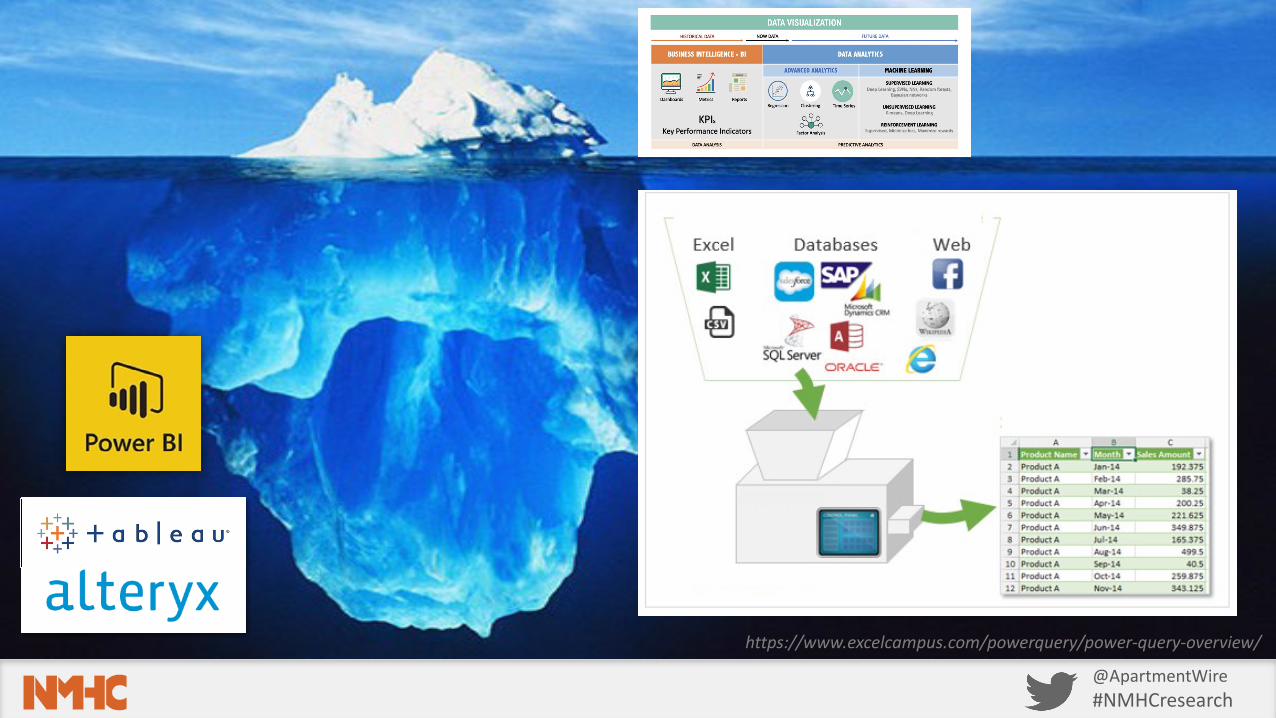
https://www.excelcampus.com/powerquery/power-query-overview/
@ApartmentWire#NMHCresearch
https://www.excelcampus.com/powerquery/power-query-overview/
@ApartmentWire#NMHCresearch
https://www.excelcampus.com/powerquery/power-query-overview/
@ApartmentWire#NMHCresearch
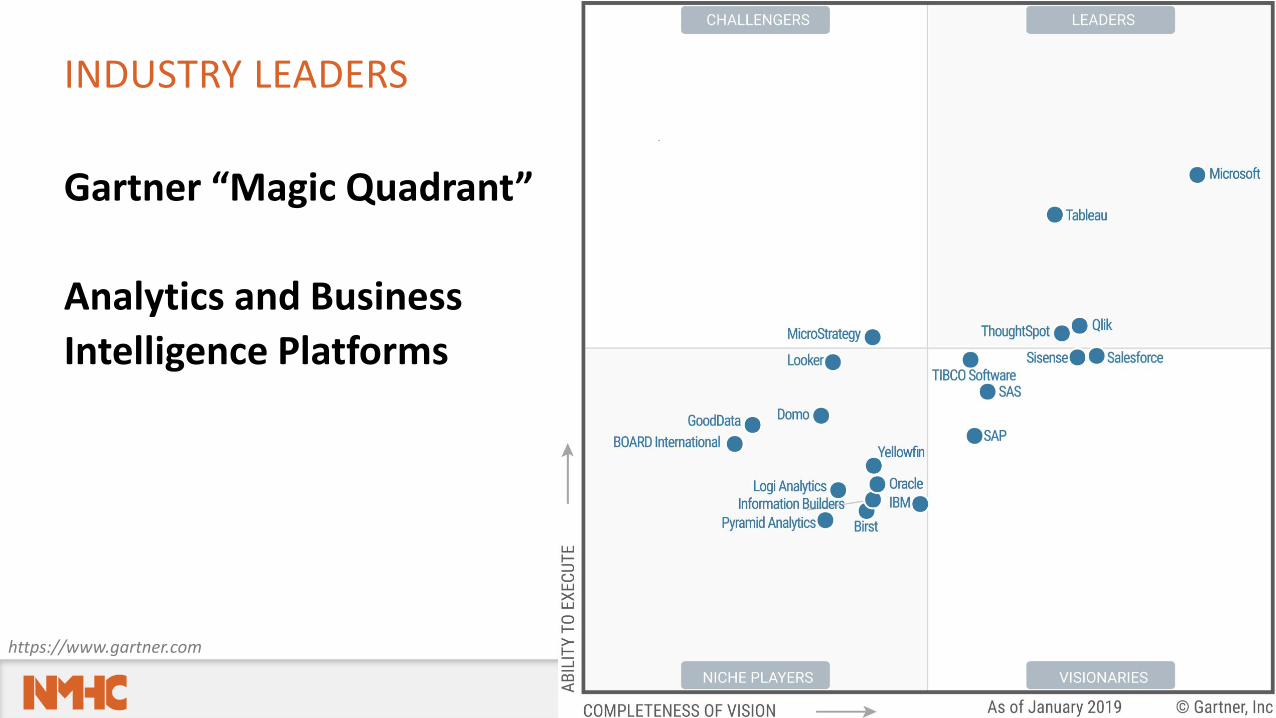
INDUSTRY LEADERS
Gartner “Magic Quadrant”
Analytics and BusinessIntelligence Platforms
https://www.gartner.com
@ApartmentWire#NMHCresearch
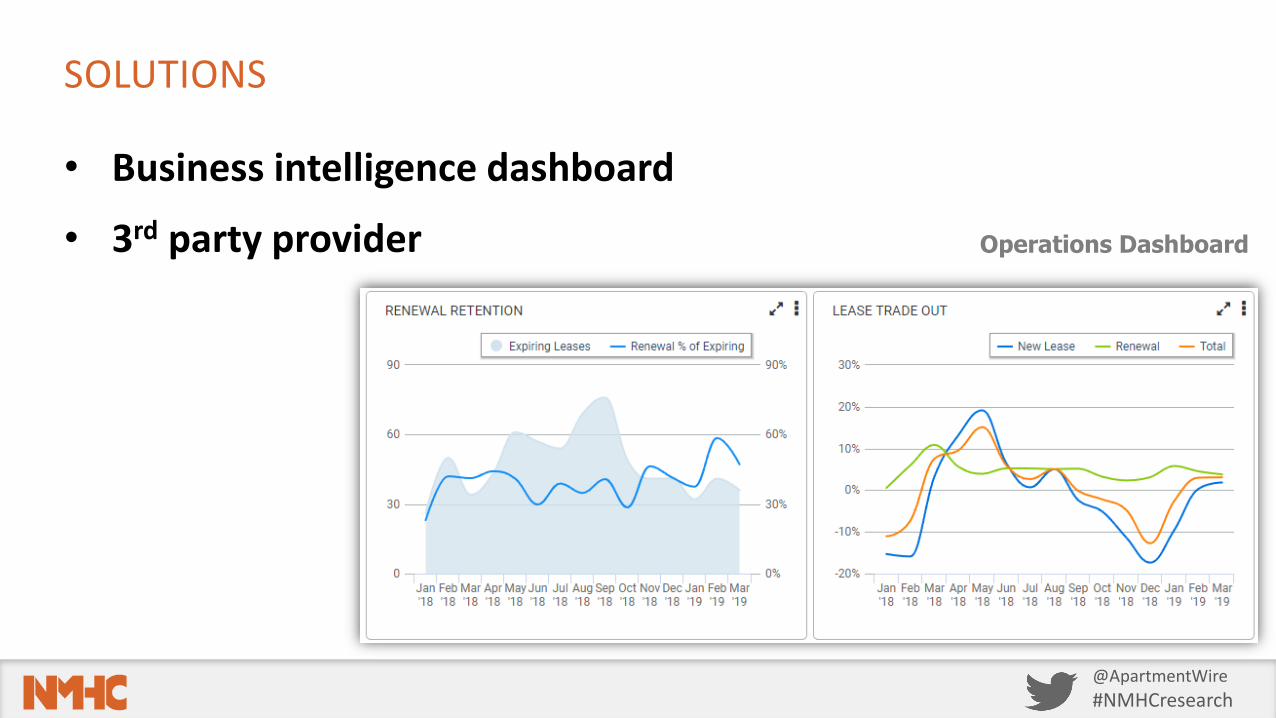
SOLUTIONS
• Business intelligence dashboard
• 3rd party provider Operations Dashboard
@ApartmentWire#NMHCresearch
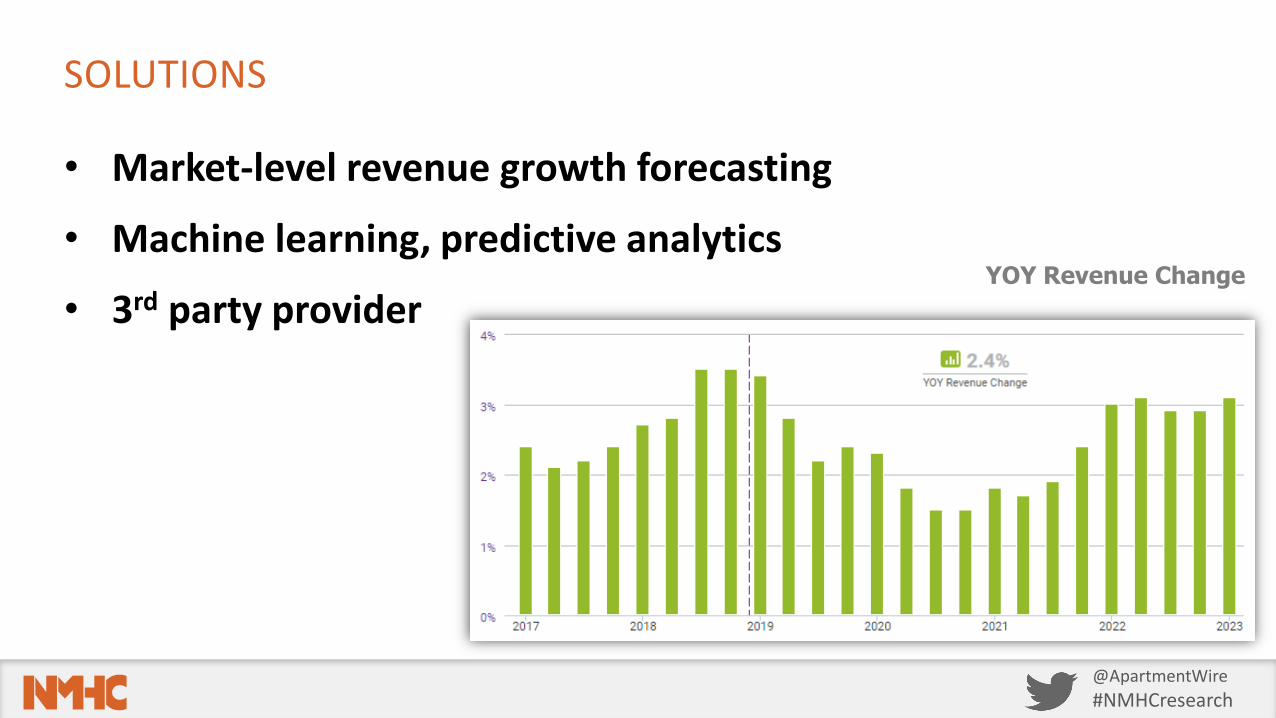
SOLUTIONS
• Market-level revenue growth forecasting
• Machine learning, predictive analytics
• 3rd party providerYOY Revenue Change
@ApartmentWire#NMHCresearch
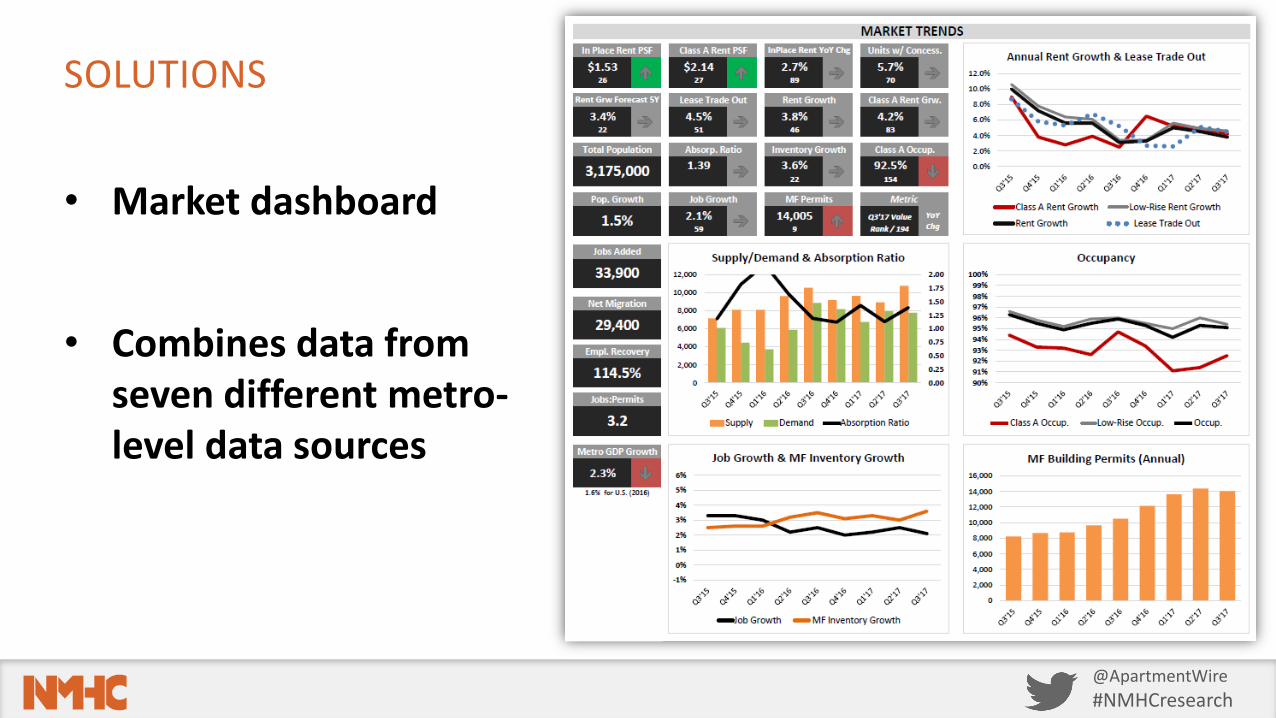
SOLUTIONS
• Market dashboard
• Combines data from seven different metro-level data sources
@ApartmentWire#NMHCresearch
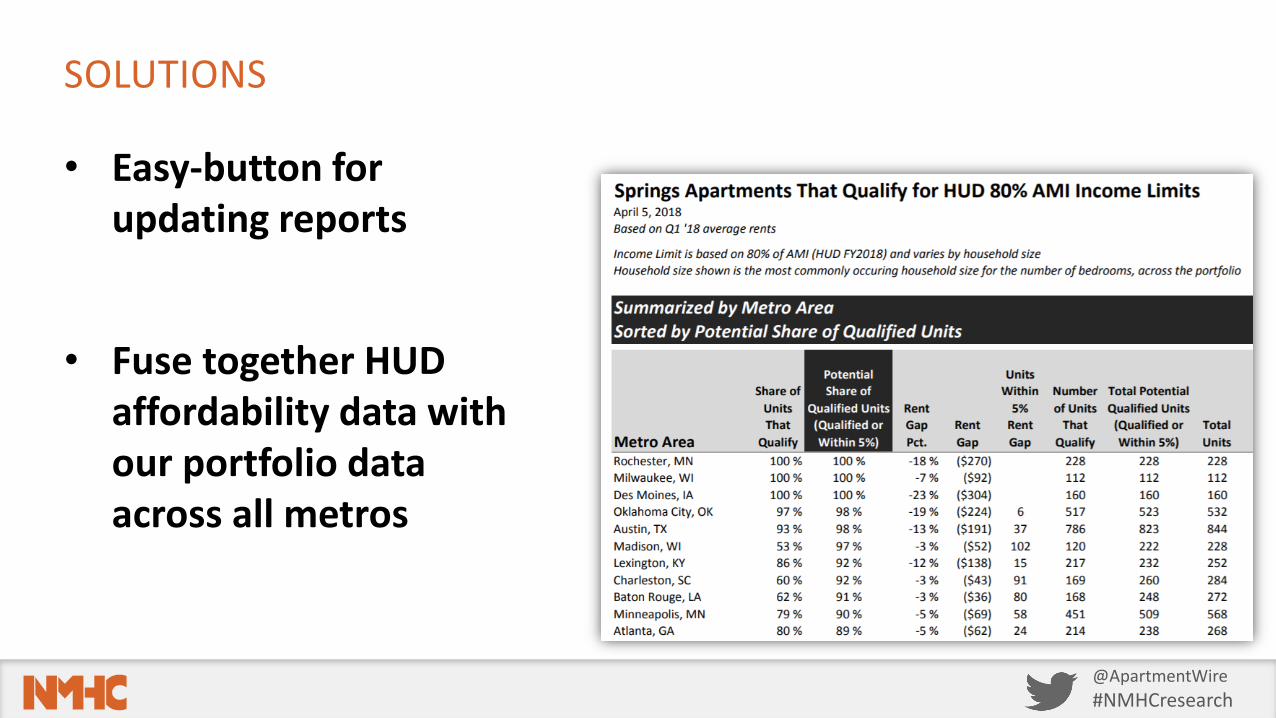
SOLUTIONS
• Easy-button for updating reports
• Fuse together HUD affordability data with our portfolio data across all metros
@ApartmentWire#NMHCresearch
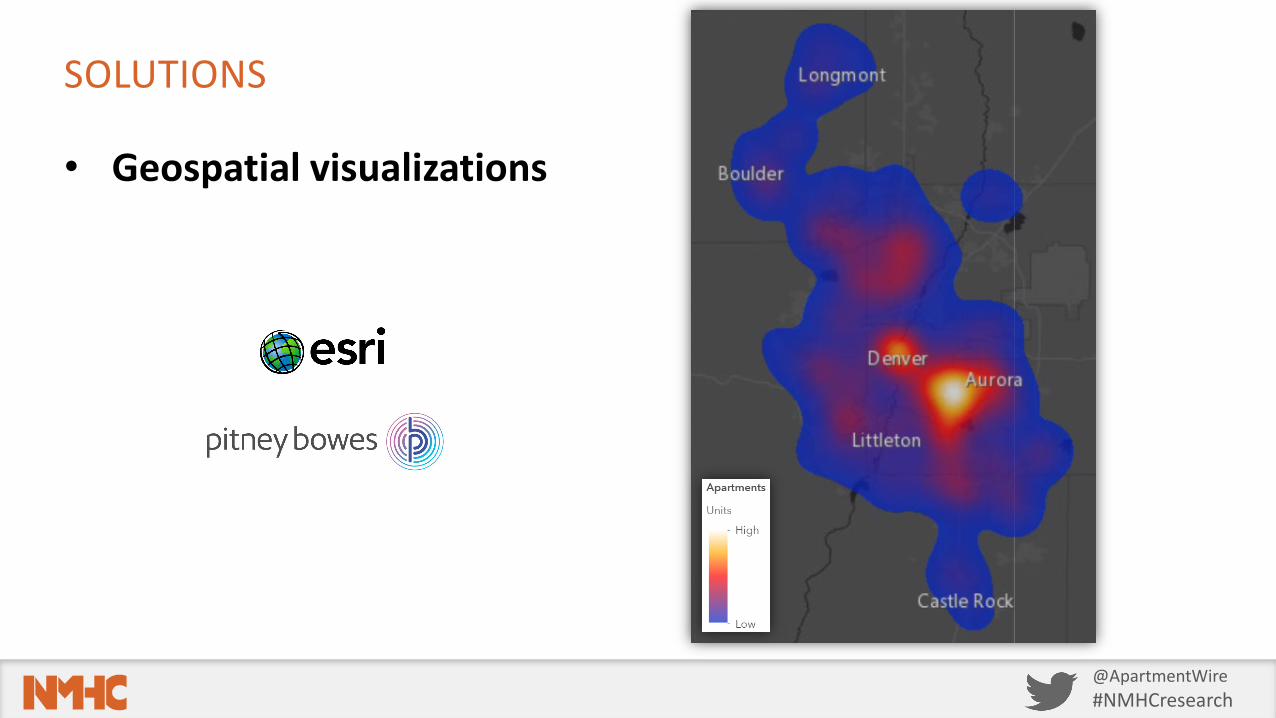
SOLUTIONS
• Geospatial visualizations
@ApartmentWire#NMHCresearch
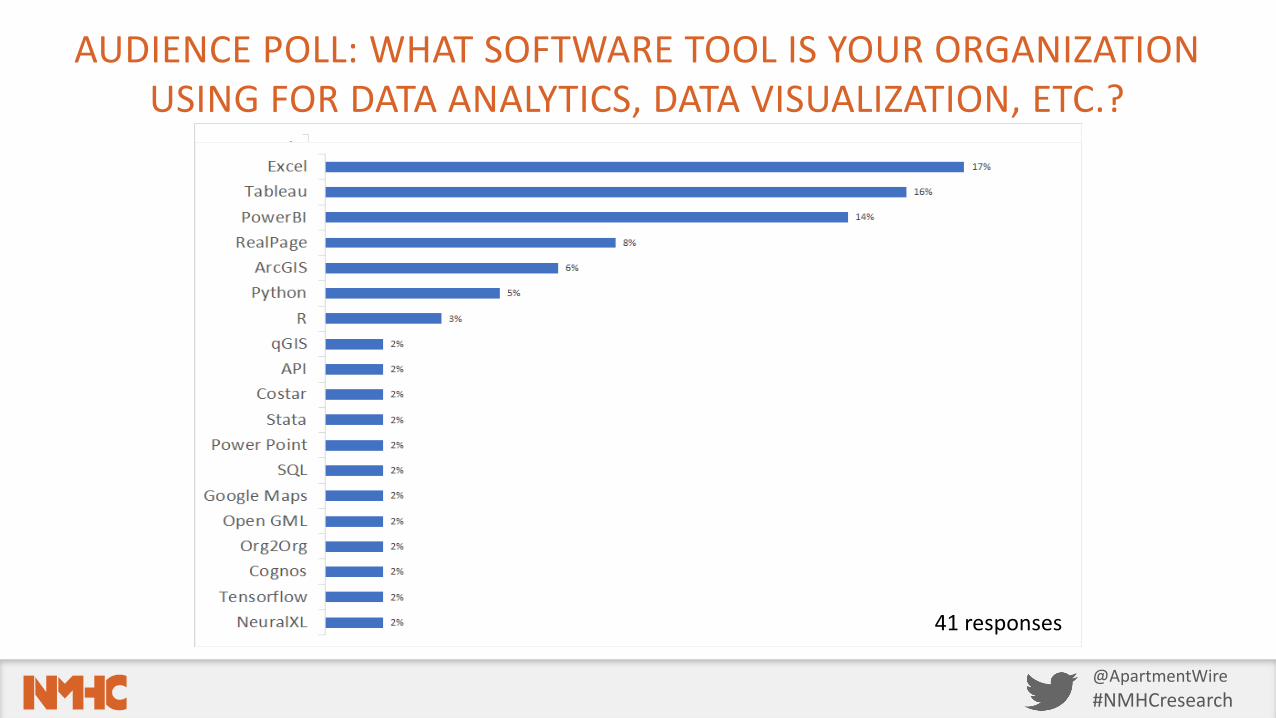
AUDIENCE POLL: WHAT SOFTWARE TOOL IS YOUR ORGANIZATION USING FOR DATA ANALYTICS, DATA VISUALIZATION, ETC.?
41 responses

@ApartmentWire#NMHCresearch
DATA VISUALIZATION & HOUSING
@ApartmentWire#NMHCresearch
OVERVIEW
Goals for data visualization
Common housing stories
Tableau demo
1
2
3
@ApartmentWire#NMHCresearch
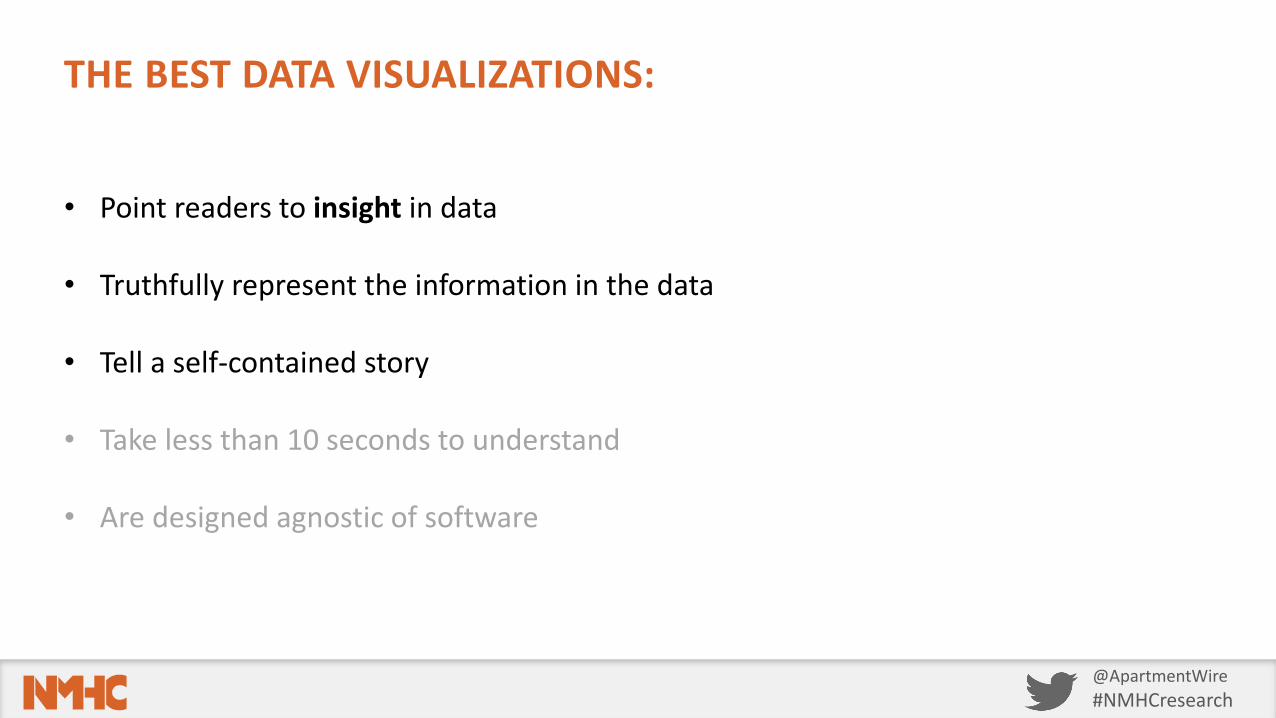
THE BEST DATA VISUALIZATIONS:
• Point readers to insight in data
• Truthfully represent the information in the data
• Tell a self-contained story
• Take less than 10 seconds to understand
• Are designed agnostic of software
@ApartmentWire#NMHCresearch
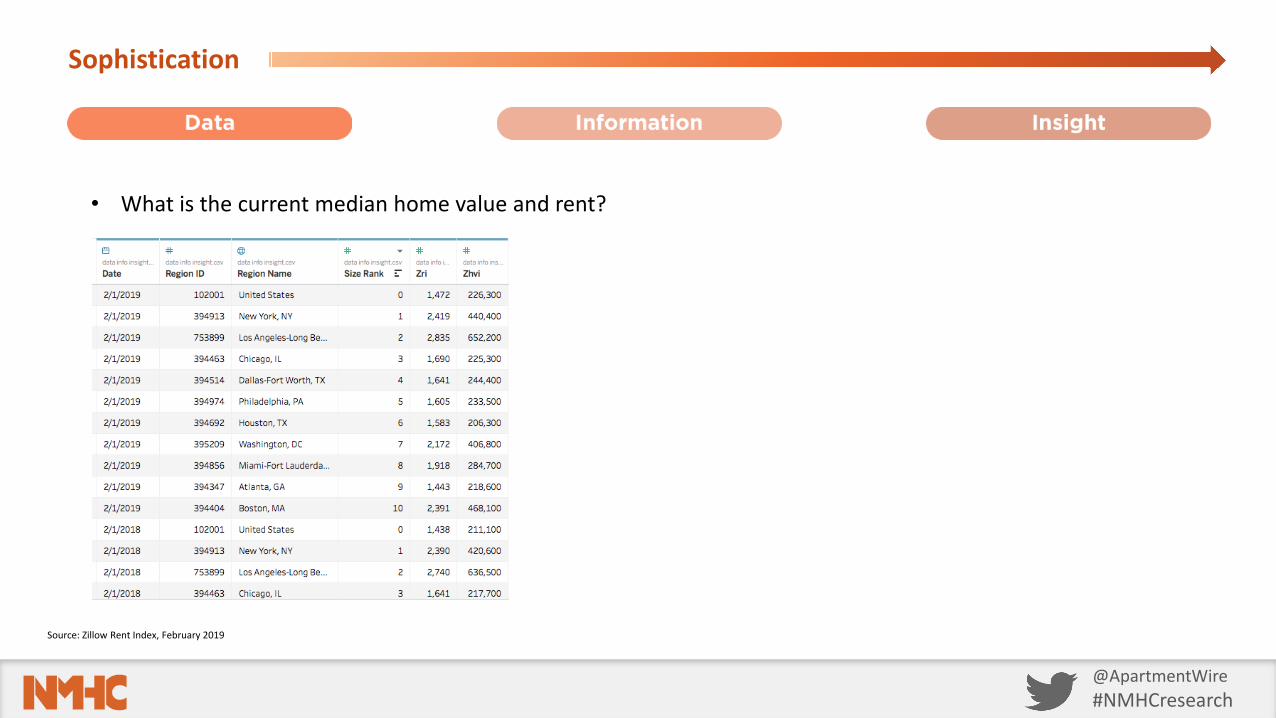
Sophistication
• What is the current median home value and rent?
Source: Zillow Rent Index, February 2019
@ApartmentWire#NMHCresearch
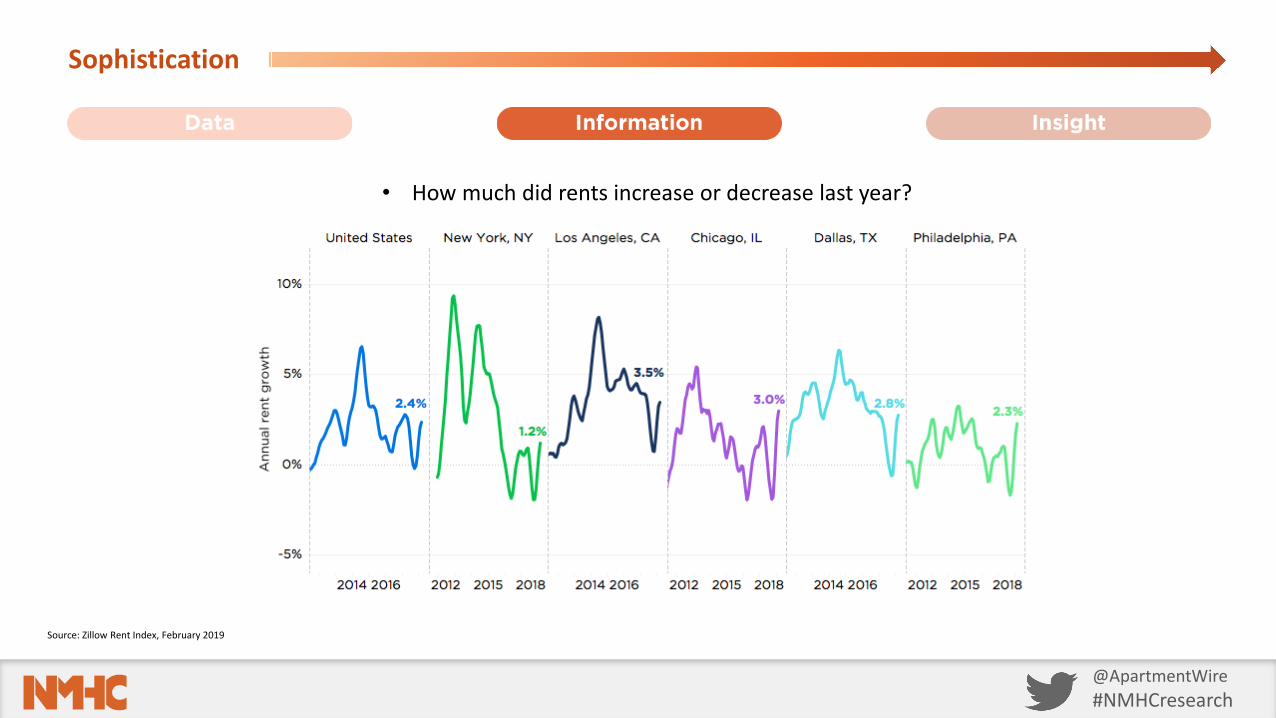
Sophistication
• How much did rents increase or decrease last year?
Source: Zillow Rent Index, February 2019
@ApartmentWire#NMHCresearch
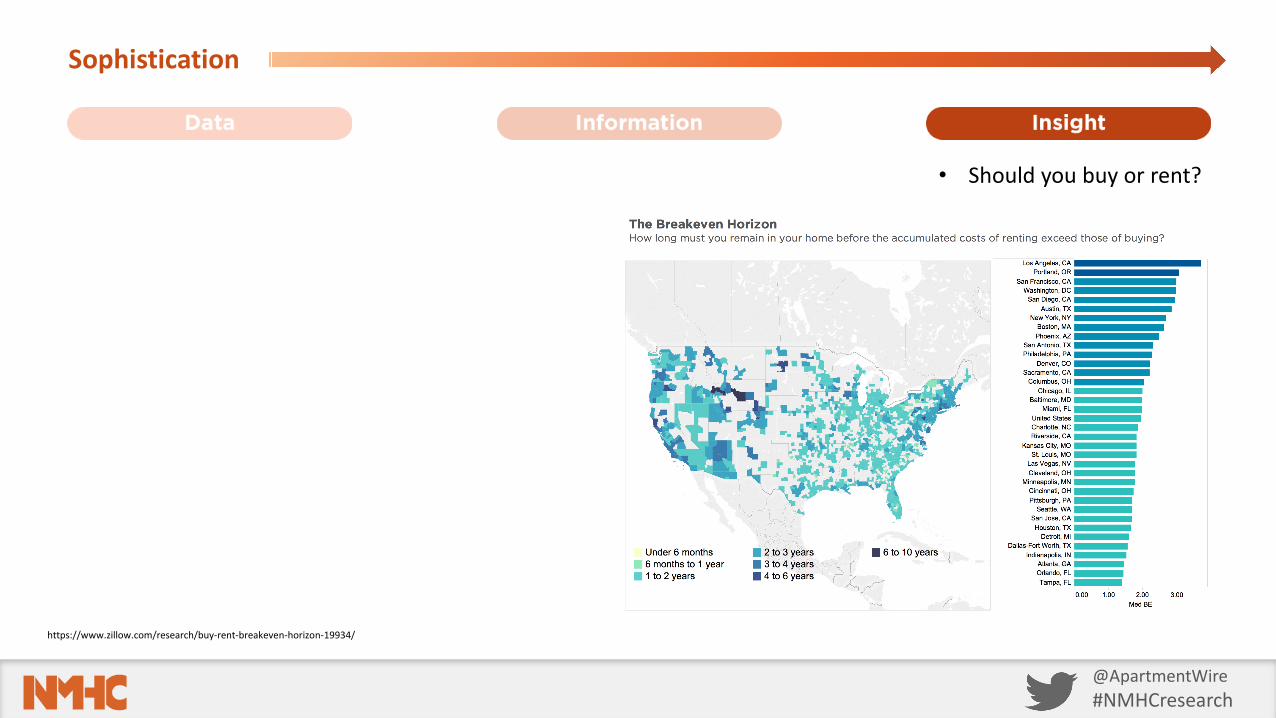
Sophistication
• Should you buy or rent?
https://www.zillow.com/research/buy-rent-breakeven-horizon-19934/
@ApartmentWire#NMHCresearch
DATA VISUALIZATION & HOUSING
@ApartmentWire#NMHCresearch
DATA STORYTELLING & HOUSING
@ApartmentWire#NMHCresearch
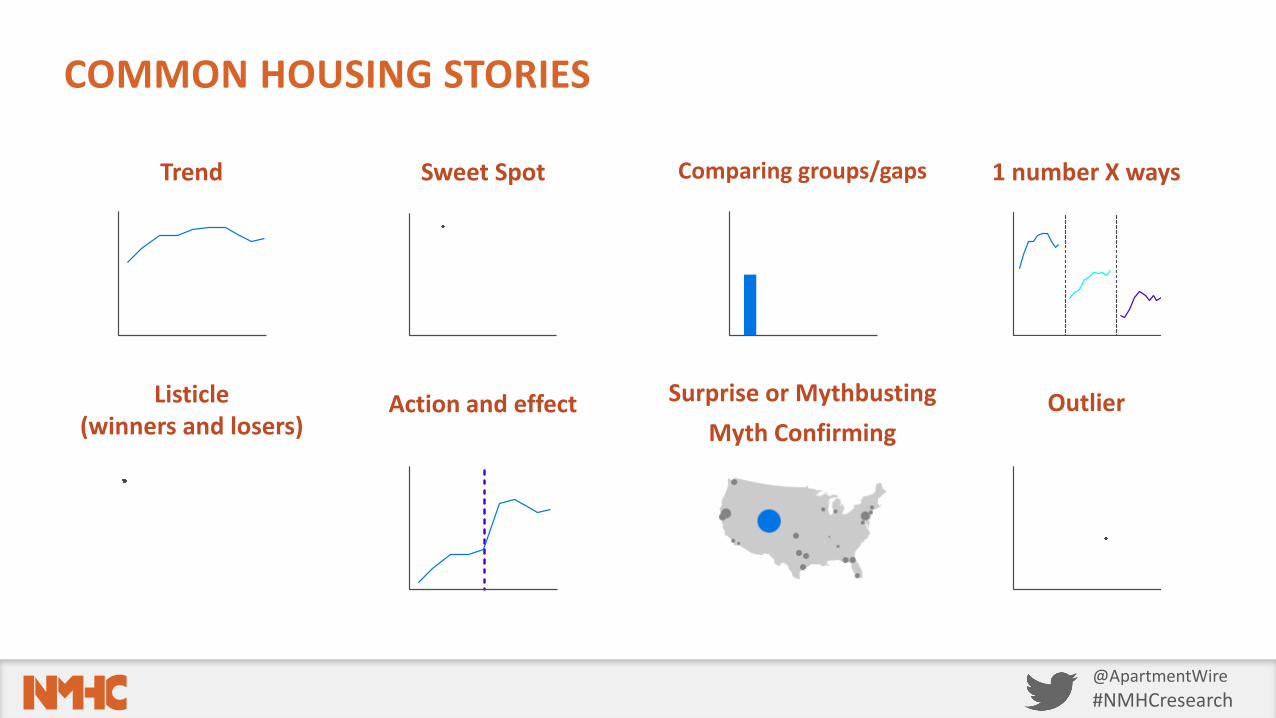
COMMON HOUSING STORIES
Trend
Listicle(winners and losers)
1 number X ways
Action and effect
Comparing groups/gaps
Surprise or MythbustingMyth Confirming
Sweet Spot
Outlier
@ApartmentWire#NMHCresearch
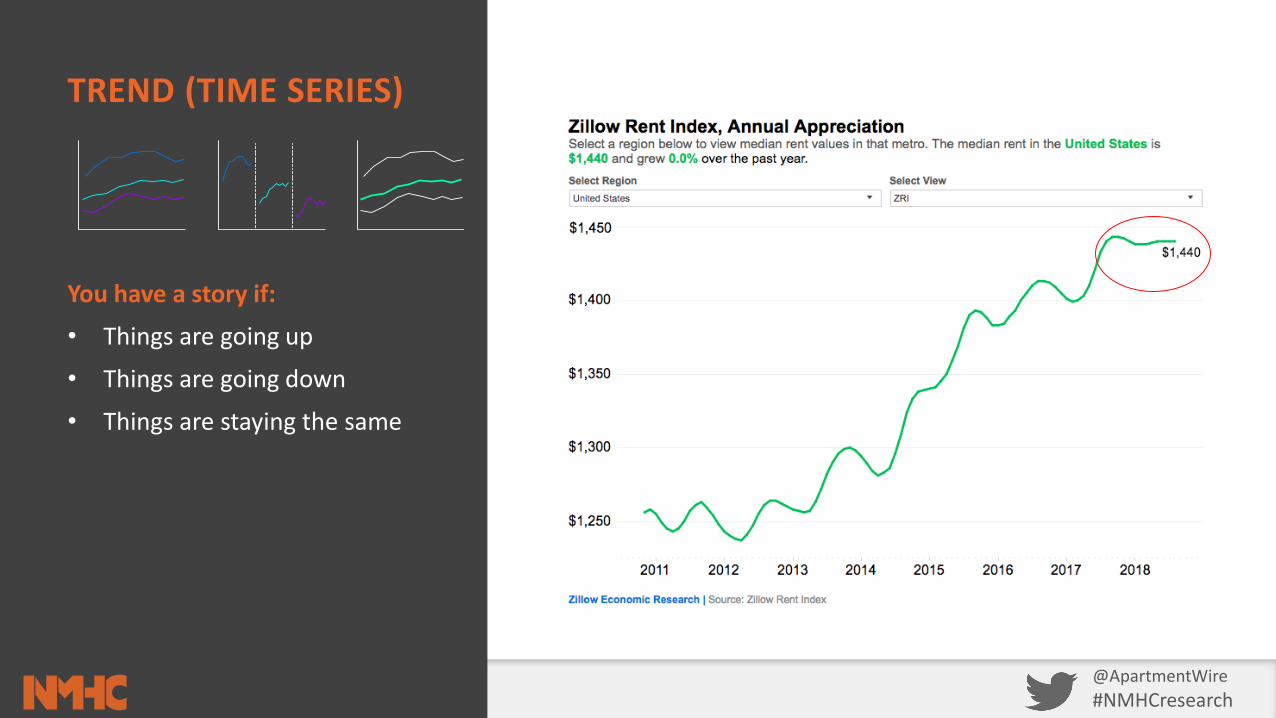
TREND (TIME SERIES)
You have a story if:
• Things are going up
• Things are going down
• Things are staying the same
@ApartmentWire#NMHCresearch
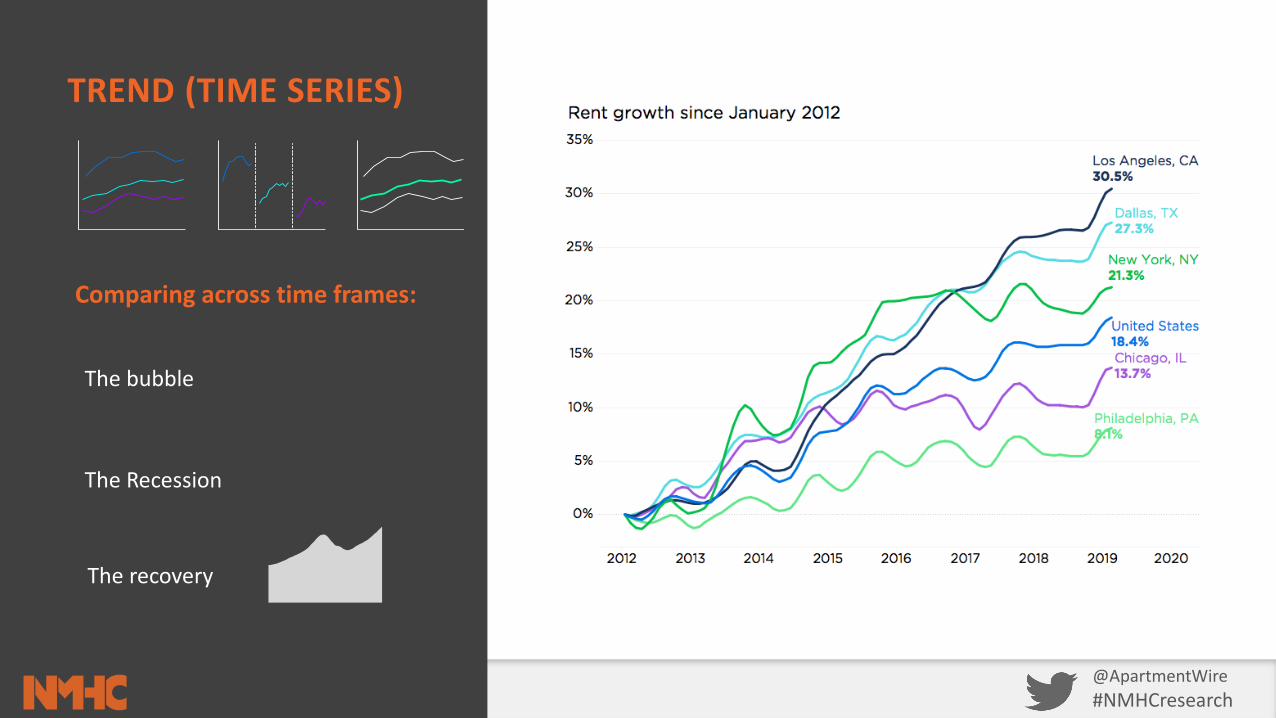
TREND (TIME SERIES)
Comparing across time frames:
The bubble
The Recession
The recovery
@ApartmentWire#NMHCresearch
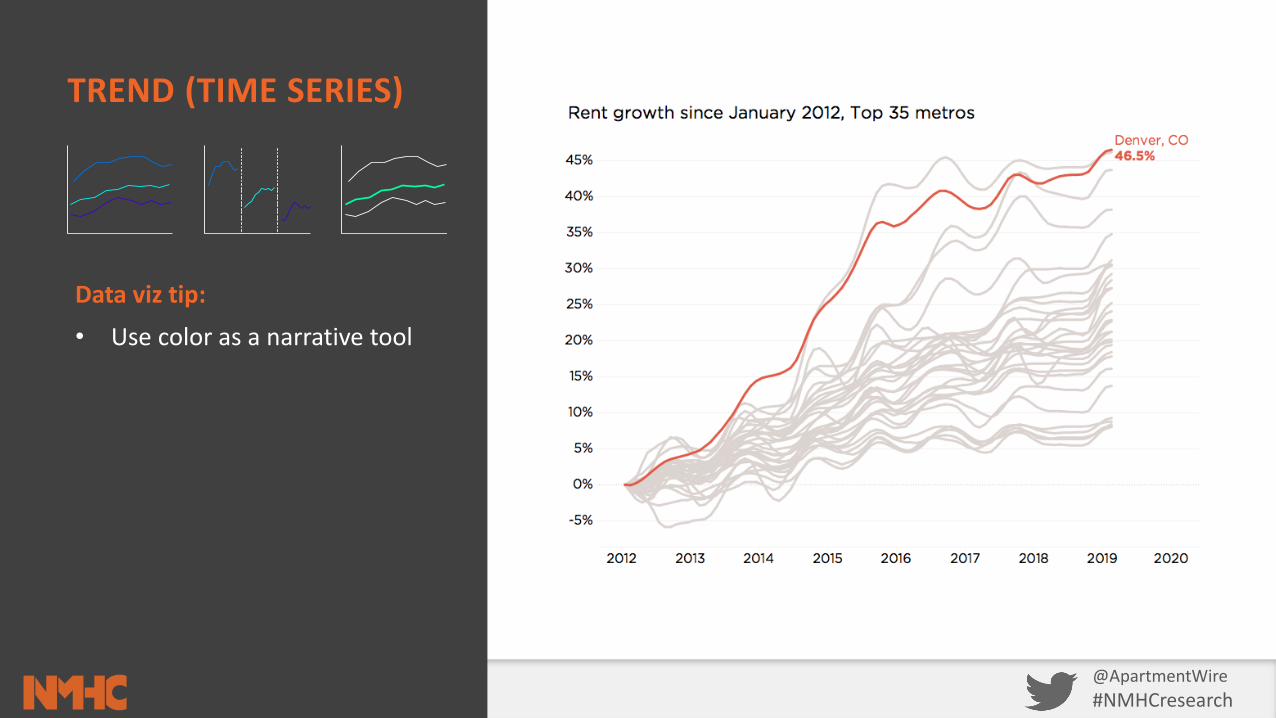
TREND (TIME SERIES)
Data viz tip:
• Use color as a narrative tool
@ApartmentWire#NMHCresearch
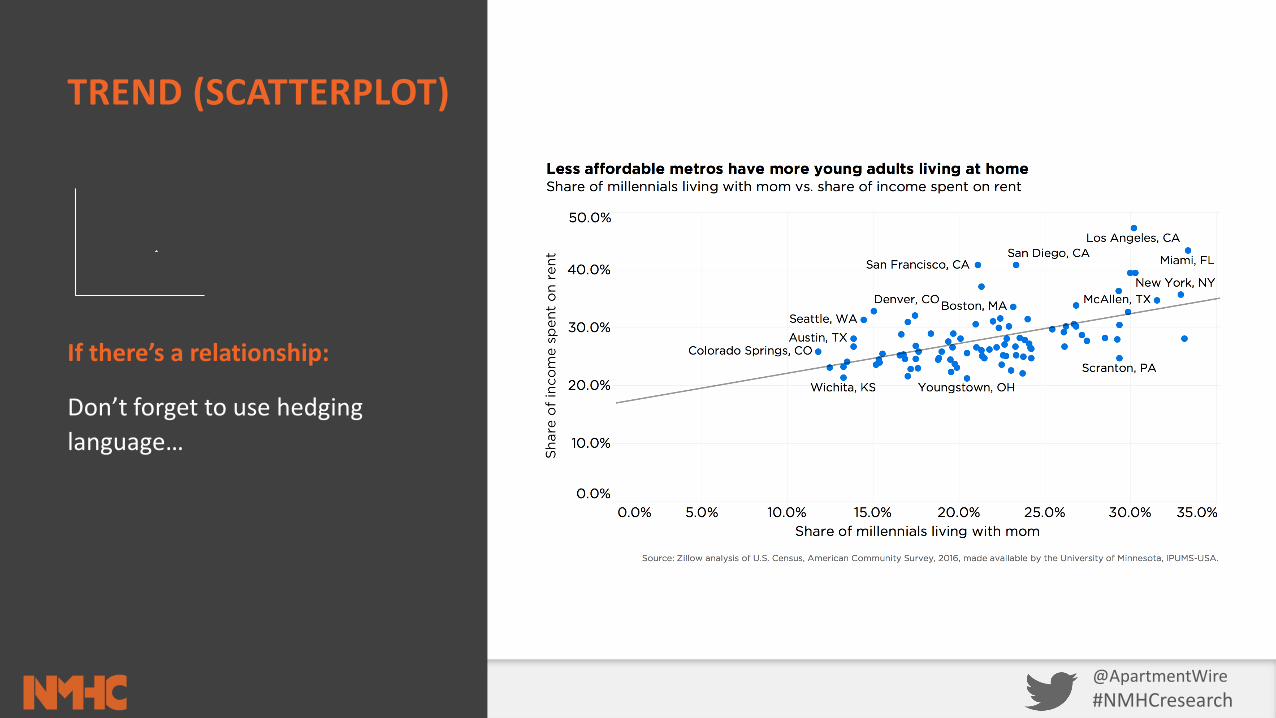
TREND (SCATTERPLOT)
If there’s a relationship:
Don’t forget to use hedging language…
@ApartmentWire#NMHCresearch
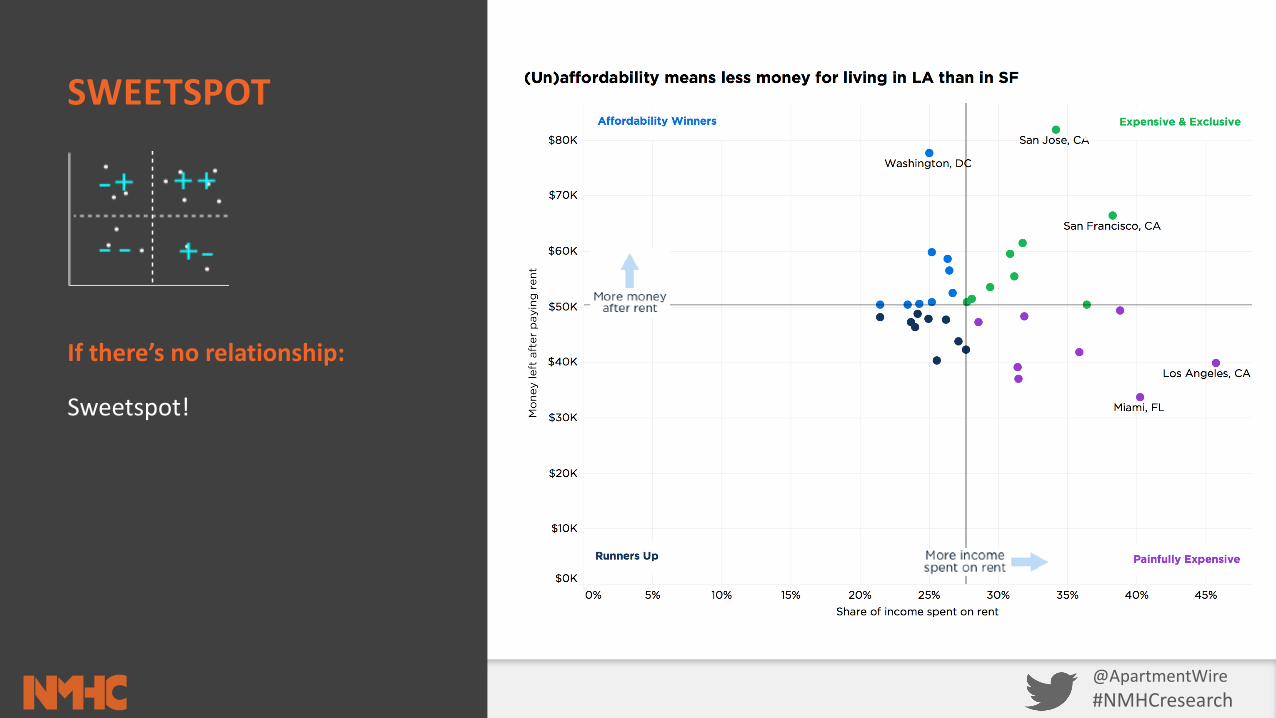
SWEETSPOT
If there’s no relationship:
Sweetspot!

@ApartmentWire#NMHCresearch
SWEETSPOT IN THE WILD
@ApartmentWire#NMHCresearch
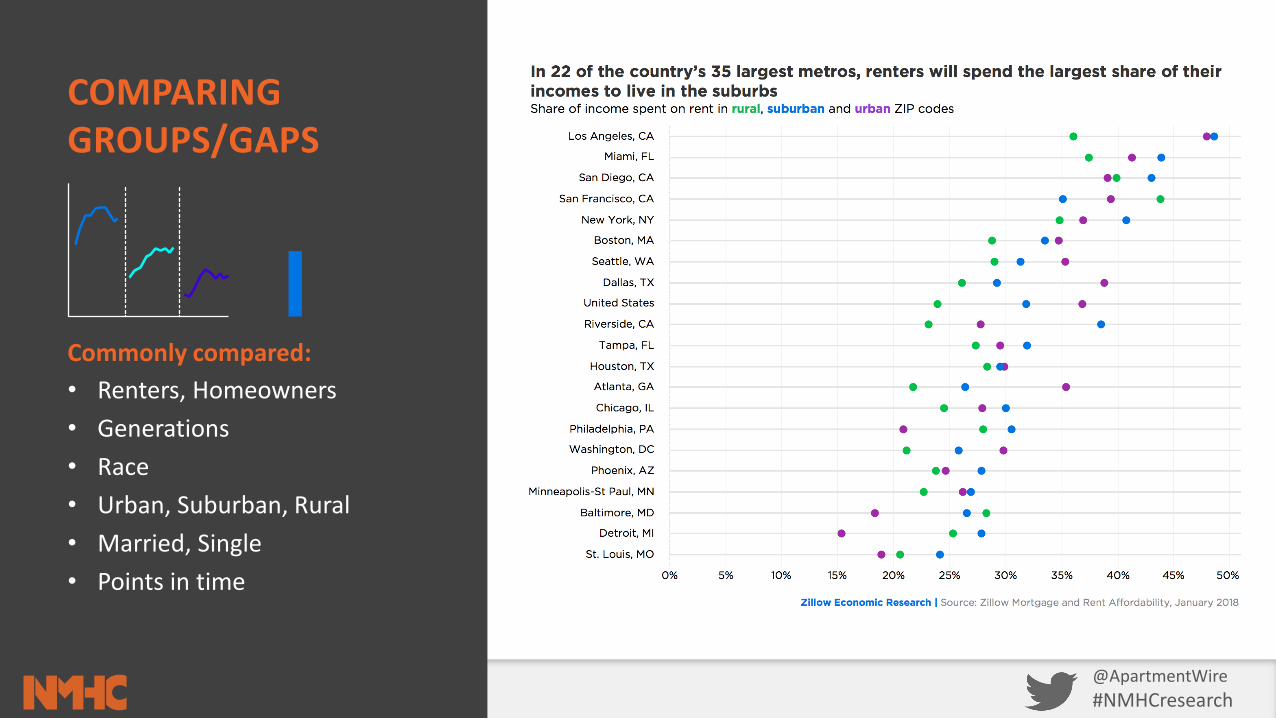
COMPARING GROUPS/GAPS
Commonly compared:• Renters, Homeowners• Generations• Race• Urban, Suburban, Rural• Married, Single• Points in time
@ApartmentWire#NMHCresearch
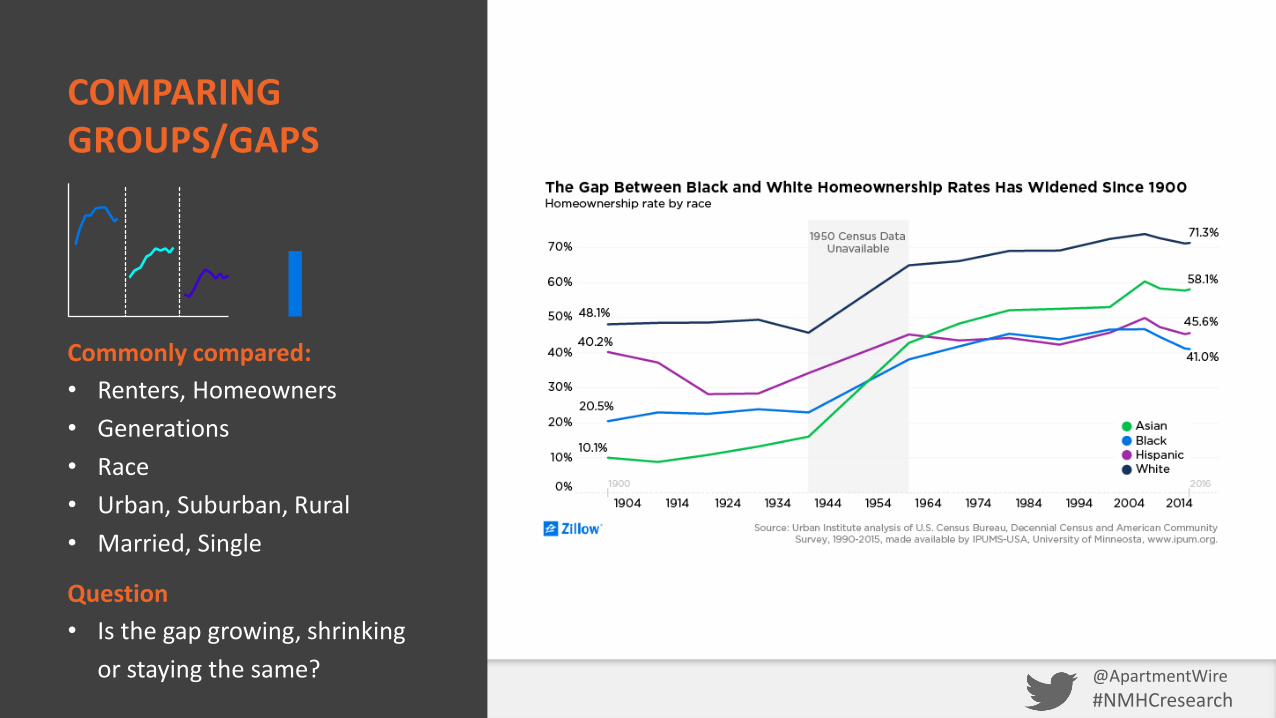
COMPARING GROUPS/GAPS
Commonly compared:• Renters, Homeowners• Generations• Race• Urban, Suburban, Rural• Married, Single
Question• Is the gap growing, shrinking
or staying the same?
@ApartmentWire#NMHCresearch
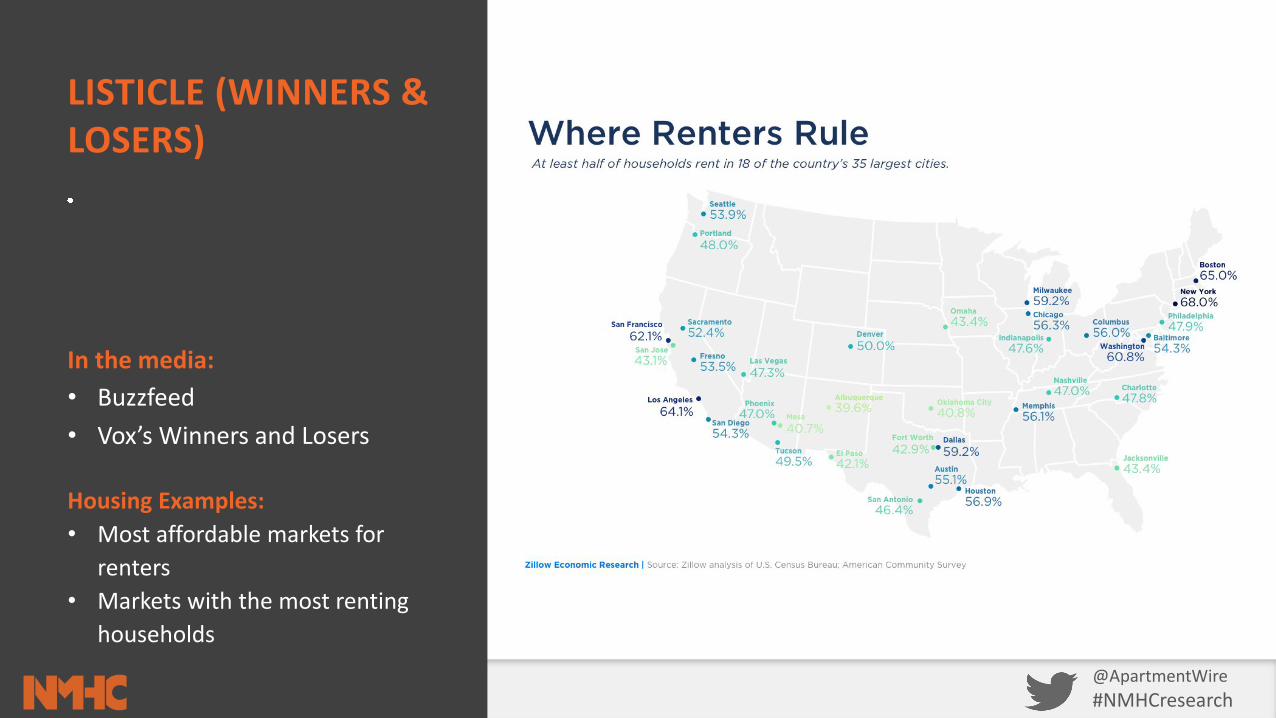
LISTICLE (WINNERS & LOSERS)
In the media: • Buzzfeed• Vox’s Winners and Losers
Housing Examples: • Most affordable markets for
renters• Markets with the most renting
households
@ApartmentWire#NMHCresearch
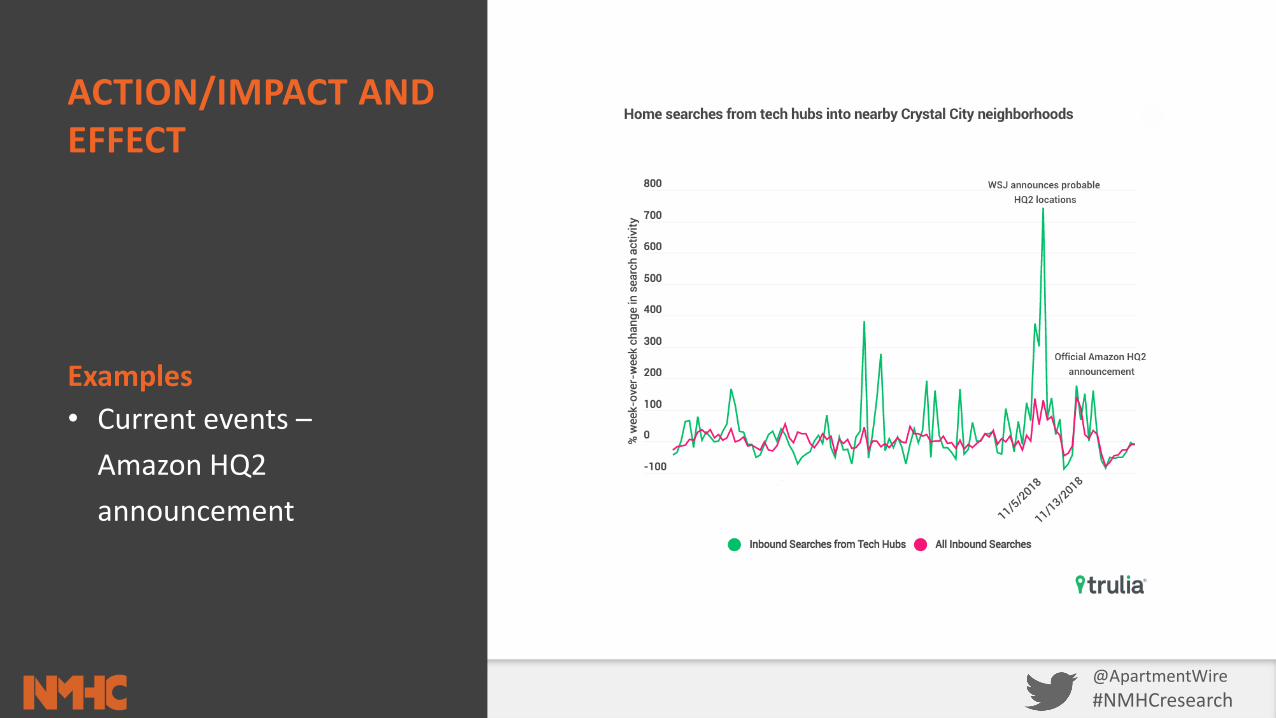
ACTION/IMPACT AND EFFECT
Examples• Current events –
Amazon HQ2 announcement
@ApartmentWire#NMHCresearch
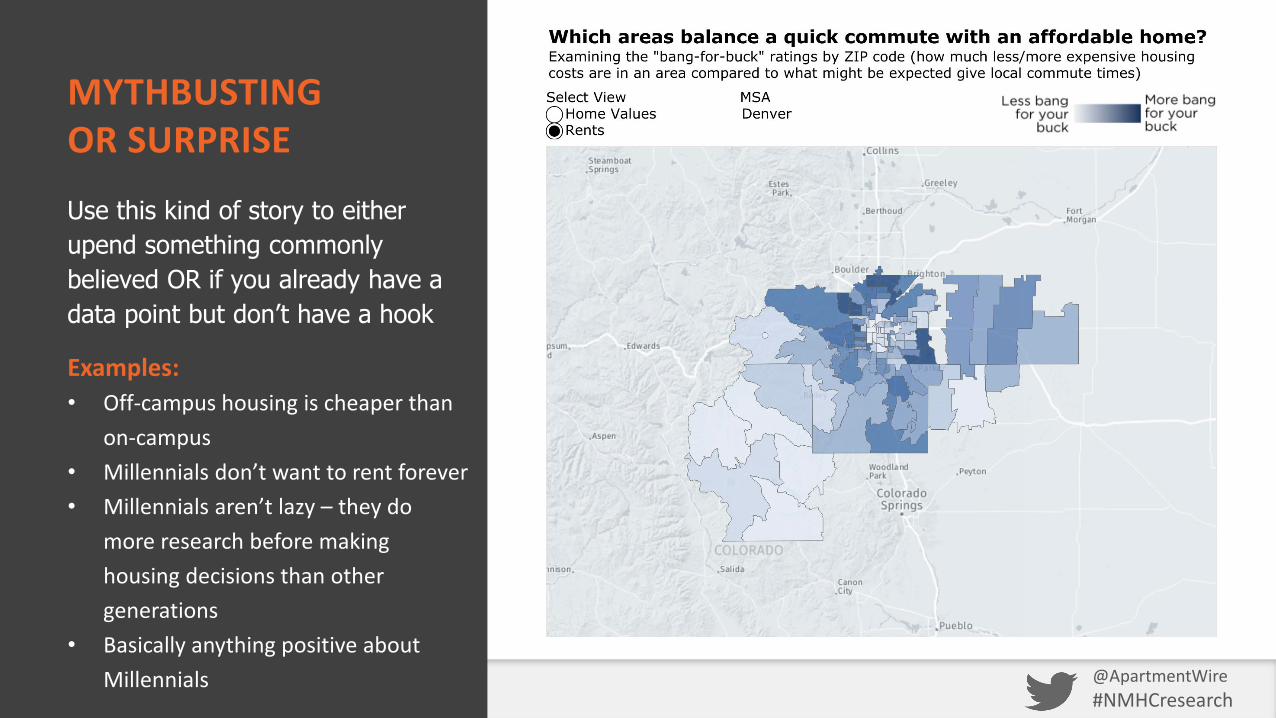
MYTHBUSTINGOR SURPRISE
Examples:• Off-campus housing is cheaper than
on-campus• Millennials don’t want to rent forever• Millennials aren’t lazy – they do
more research before making housing decisions than other generations
• Basically anything positive about Millennials
Use this kind of story to either upend something commonly believed OR if you already have a data point but don’t have a hook
@ApartmentWire#NMHCresearch
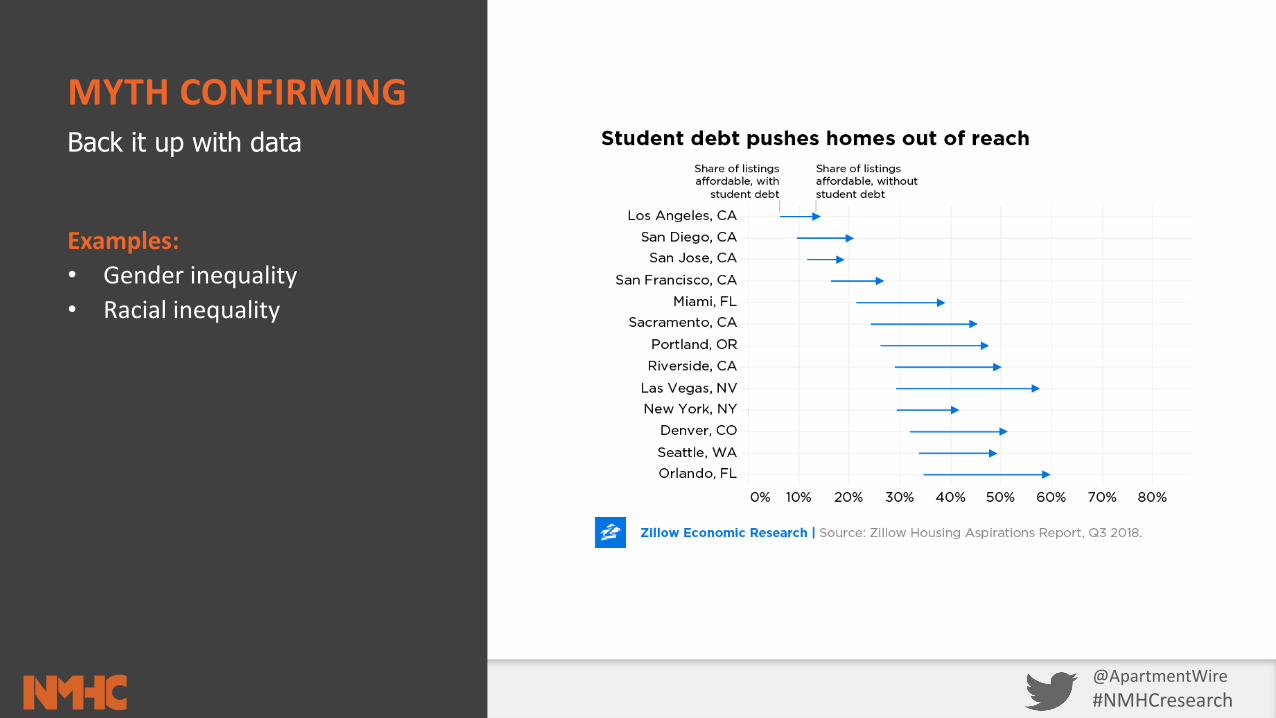
MYTH CONFIRMING
Examples:• Gender inequality• Racial inequality
Back it up with data
@ApartmentWire#NMHCresearch
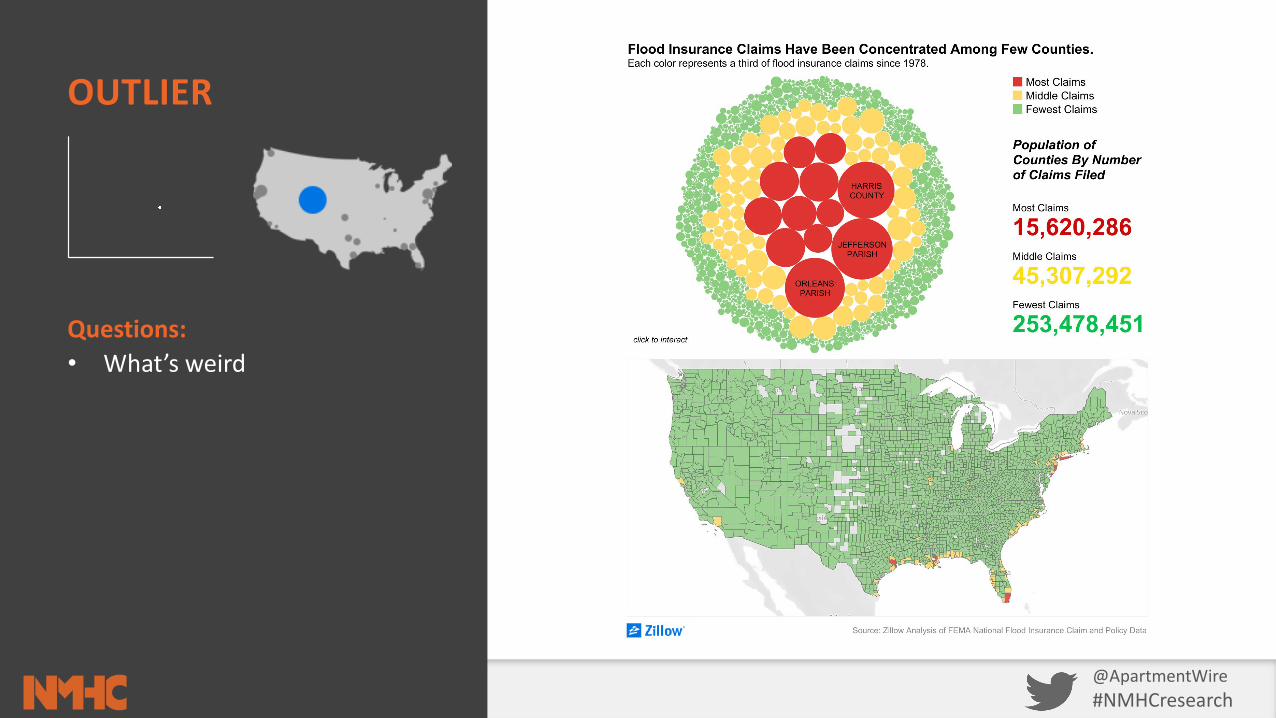
OUTLIER
Questions:• What’s weird
@ApartmentWire#NMHCresearch
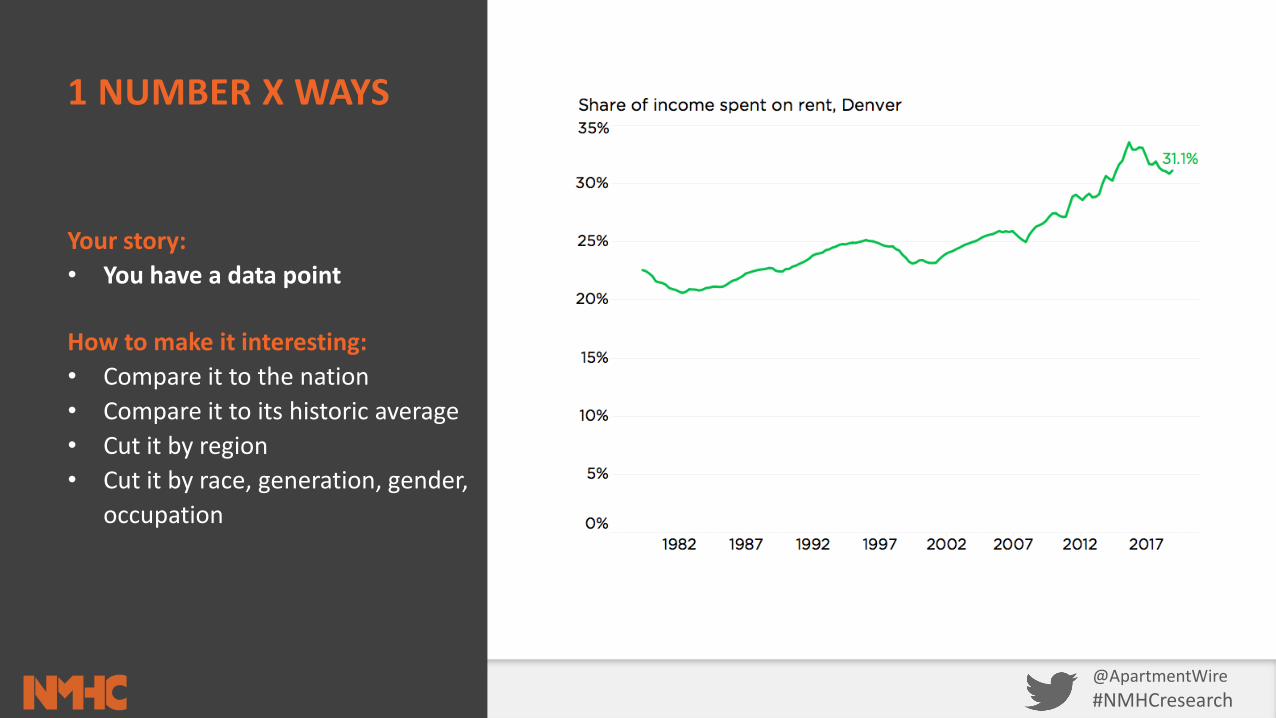
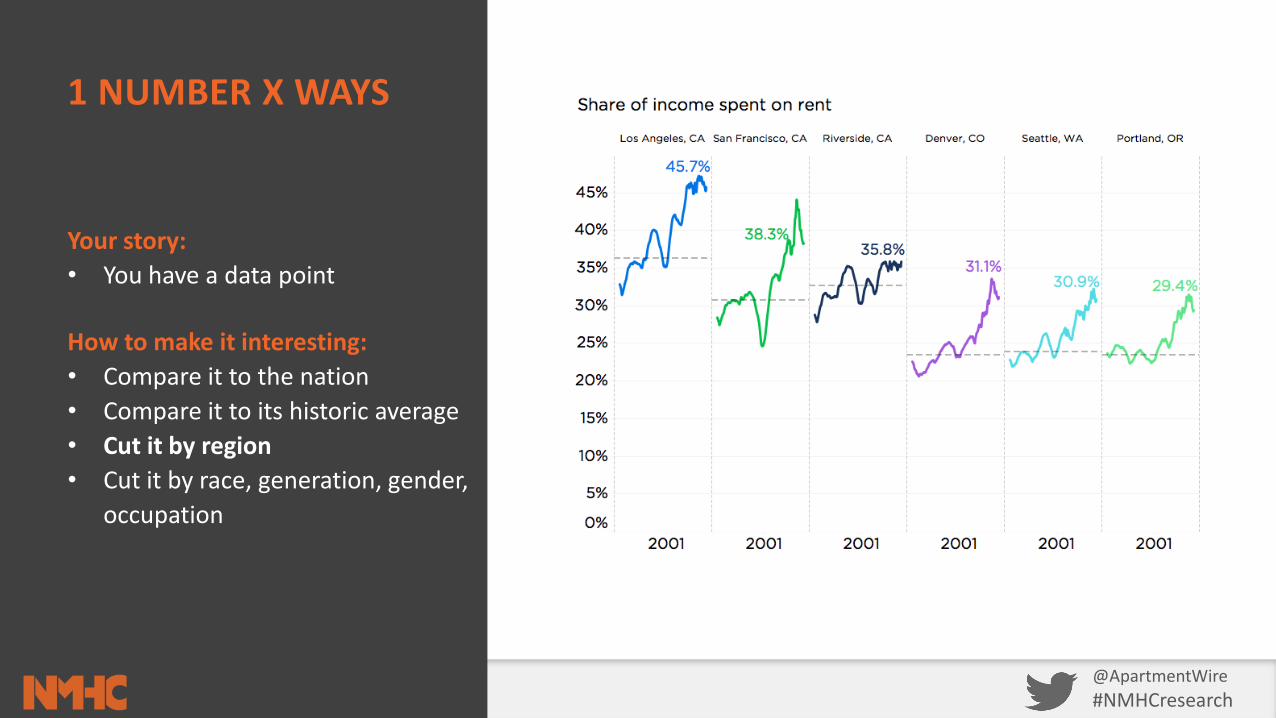
1 NUMBER X WAYS
Your story:• You have a data point
How to make it interesting:• Compare it to the nation• Compare it to its historic average• Cut it by region• Cut it by race, generation, gender,
occupation
@ApartmentWire#NMHCresearch
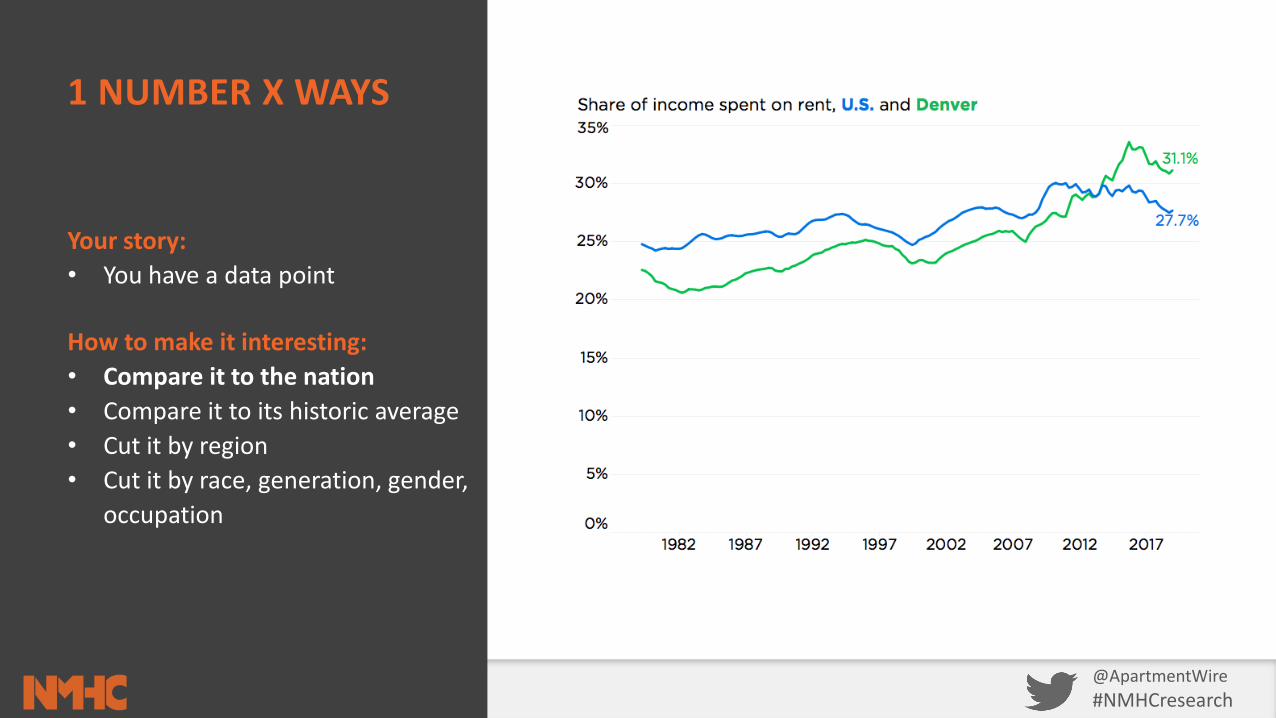
1 NUMBER X WAYS
Your story:• You have a data point
How to make it interesting:• Compare it to the nation• Compare it to its historic average• Cut it by region• Cut it by race, generation, gender,
occupation
@ApartmentWire#NMHCresearch
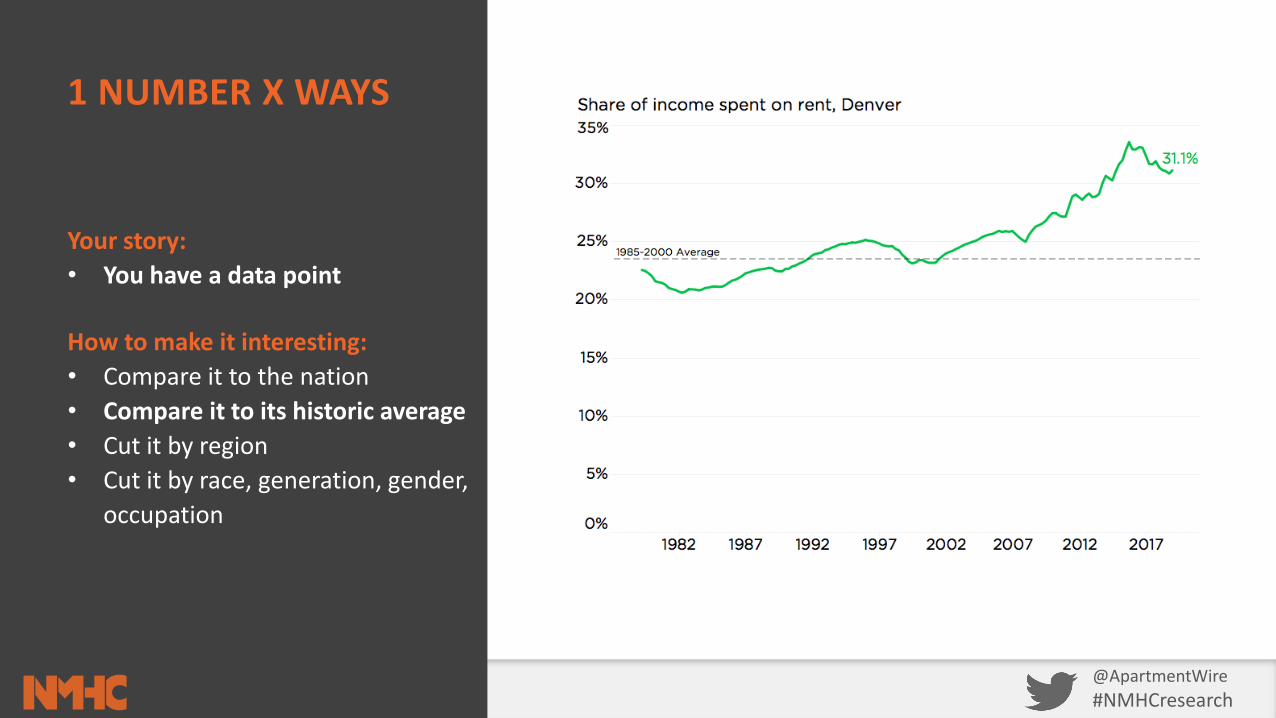
1 NUMBER X WAYS
Your story:• You have a data point
How to make it interesting:• Compare it to the nation• Compare it to its historic average• Cut it by region• Cut it by race, generation, gender,
occupation
@ApartmentWire#NMHCresearch
1 NUMBER X WAYS
Your story:• You have a data point
How to make it interesting:• Compare it to the nation• Compare it to its historic average• Cut it by region• Cut it by race, generation, gender,
occupation
@ApartmentWire#NMHCresearch
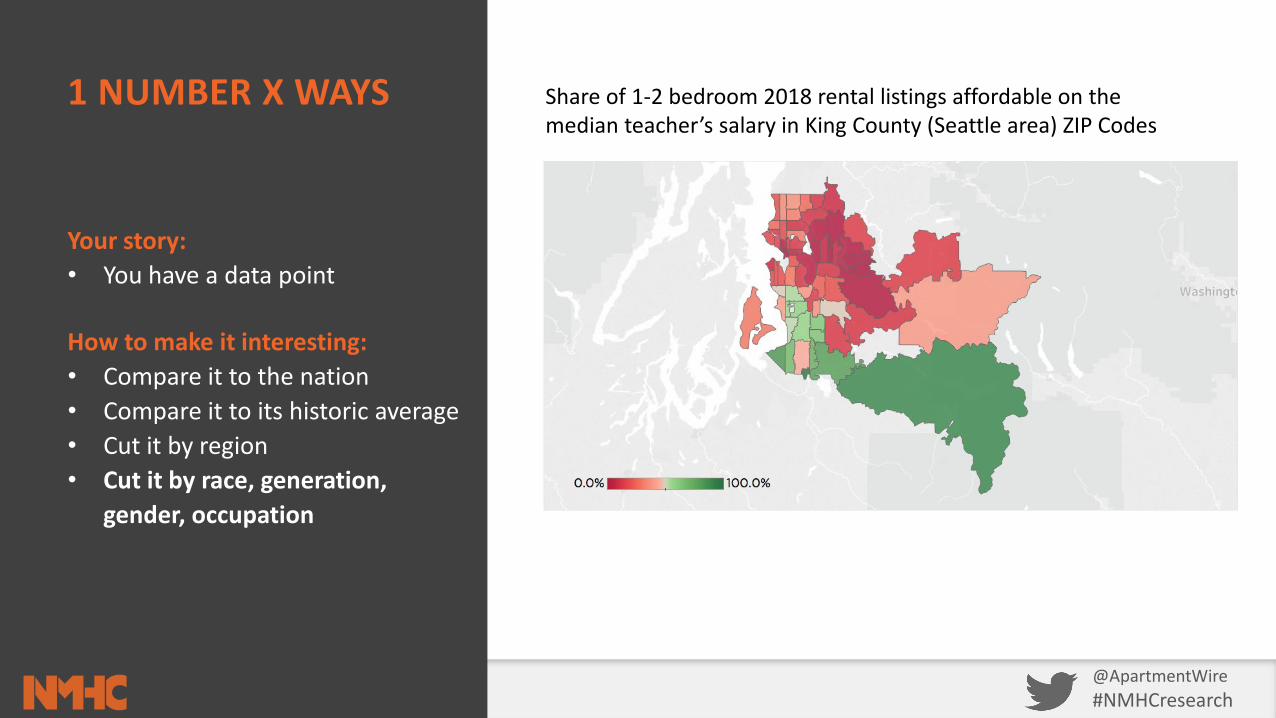
1 NUMBER X WAYS
Your story:• You have a data point
How to make it interesting:• Compare it to the nation• Compare it to its historic average• Cut it by region• Cut it by race, generation,
gender, occupation
Share of 1-2 bedroom 2018 rental listings affordable on the median teacher’s salary in King County (Seattle area) ZIP Codes

@ApartmentWire#NMHCresearch
COMMON HOUSING STORIES
Trend
Listicle(winners and losers)
1 number X ways
Action and effect
Comparing groups/gaps
Surprise or MythbustingMyth Confirming
Sweet Spot
Outlier
@ApartmentWire#NMHCresearch
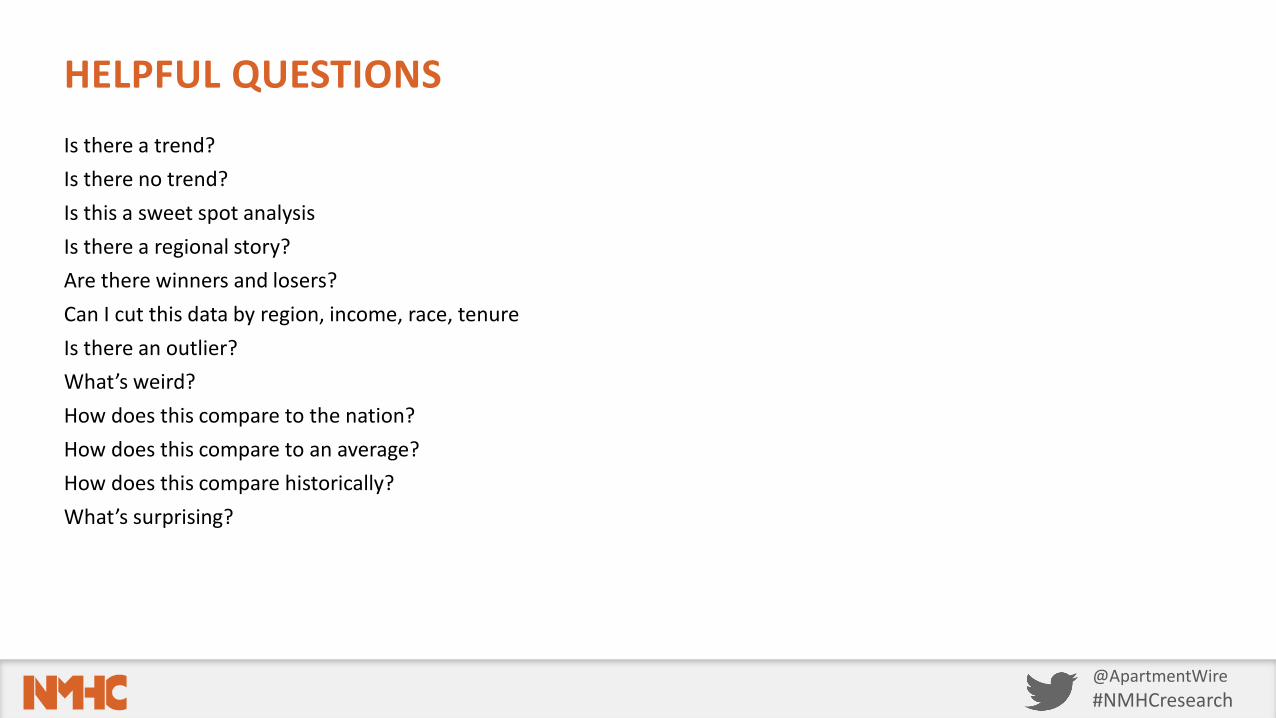
HELPFUL QUESTIONSIs there a trend?Is there no trend?Is this a sweet spot analysisIs there a regional story?Are there winners and losers?Can I cut this data by region, income, race, tenureIs there an outlier?What’s weird? How does this compare to the nation?How does this compare to an average?How does this compare historically?What’s surprising?
@ApartmentWire#NMHCresearch
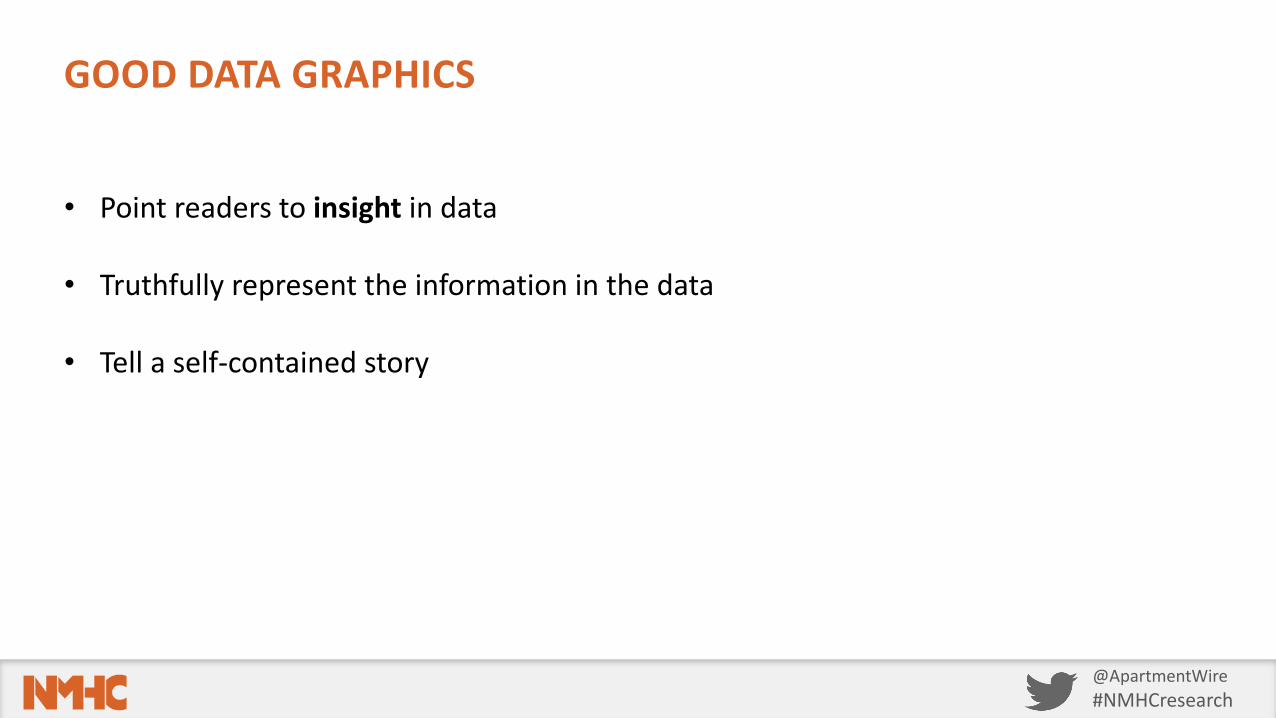
GOOD DATA GRAPHICS
• Point readers to insight in data
• Truthfully represent the information in the data
• Tell a self-contained story

@ApartmentWire#NMHCresearch
TODAY’S WORKSHOP
• Overview• Data Analytics• Data Visualization• Questions and
Discussion
Purpose:
Provide overview and examples of approaches to data analysis and data visualization for the multifamily sector.
@ApartmentWire#NMHCresearch
QUESTIONS AND DISCUSSION
Paul Vastag
Elizabeth Kimn
Zillow.com/research