Embed Size (px)
Citation preview

Data-Driven Smart City Insights: Intelligent Datasets and Urban Analytics for Digital Cities
Jean Pilon-Bignell Manager, Strategic Market Development Geotab Inc.
September 2017
Data-Driven Smart City Insights | 2
As urban population growth continues to outpace rural, cities across the globe continue to expand. In fact, the UN estimates that over 50% of the world’s population now lives in cities,1 and in the U.S. the number is closer to 80%.2 This trend towards urbanization poses new municipal challenges centered around safety, mobility, efficiency, and citizen engagement.
To address these challenges, city leaders are turning to nascent Internet of Things (IoT) technologies and data analytics. Municipalities are undergoing a digital transformation that will revolutionize the way cities are managed. New and exciting mobile and static infrastructure technologies are enabling intelligent low-emissions transportation systems, safer communities, new low-cost utility services, more efficient city operations, and much more.
As a result, municipalities across North America and the rest of the world are investing heavily in the concept of a “Smart City.” In June of last year, Columbus, Ohio was awarded $50M from the U.S. Federal Government to develop this concept,3 and is in the process of deploying new infrastructure to accommodate their “Smart Columbus Vision.” This trend will only accelerate in 2018 and beyond as communities discover the benefits of this urban movement.
Data-Driven Smart City Insights | 3
What is a Smart City?In academia, a Smart City is defined as “an urban development vision to integrate information and communication technology (ICT) and Internet of things (IoT) technology in a secure fashion to manage a city’s assets.”4 In reality however, a Smart City can mean a lot of different things. For example, the Government of Dubai5 will measure the success of its 2021 Smart City plan in terms of reductions of CO2 emissions, average emergency response times, and the number of road fatalities. Austin6 on the other hand is more focused on creating ladders of opportunity by connecting under-served communities to economic opportunities via smart transportation corridors to reduce the spread of poverty. Cities like Orlando7 and Denver8 are focused on improving efficiencies in city operations and transportation systems.
Further to the functional objectives above, Smart City initiatives can involve a varying degree of technology implementation. Everything from a simple public-facing downtown development map9 to a complicated deployment of Bluetooth sensors to track traffic patterns.10 In almost every case however, sensor data is critical to an effective Smart City strategy.
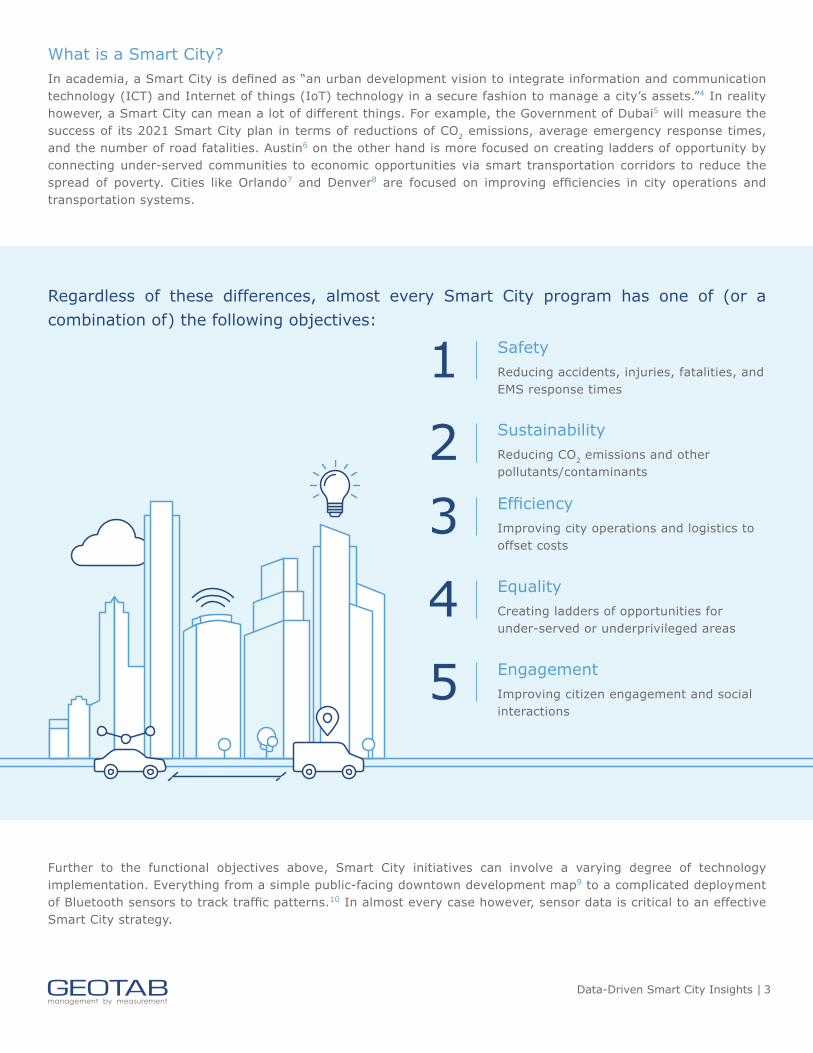
SafetyReducing accidents, injuries, fatalities, and EMS response times
1SustainabilityReducing CO2 emissions and other pollutants/contaminants
2EfficiencyImproving city operations and logistics to offset costs
3EqualityCreating ladders of opportunities for under-served or underprivileged areas
4EngagementImproving citizen engagement and social interactions
5
Regardless of these differences, almost every Smart City program has one of (or a combination of) the following objectives:
Data-Driven Smart City Insights | 4
Sensors Everywhere!Many of today’s Smart City programs involve some form of mass scale sensor deployment to gather the necessary data to justify and manage change. This is essential to any IoT program; you can’t manage what you don’t measure. The deployment of these sensors, however, can often be very expensive, especially when new city-wide infrastructure is required. Some municipalities chose to deploy smart sensors in their roadways to measure roadside temperature,11 while others deploy connected street lamps to collect real-time sensor data across the city.12 In either case, cities could save a lot of money if they were able to leverage existing sensor networks and avoid expensive infrastructure investments.
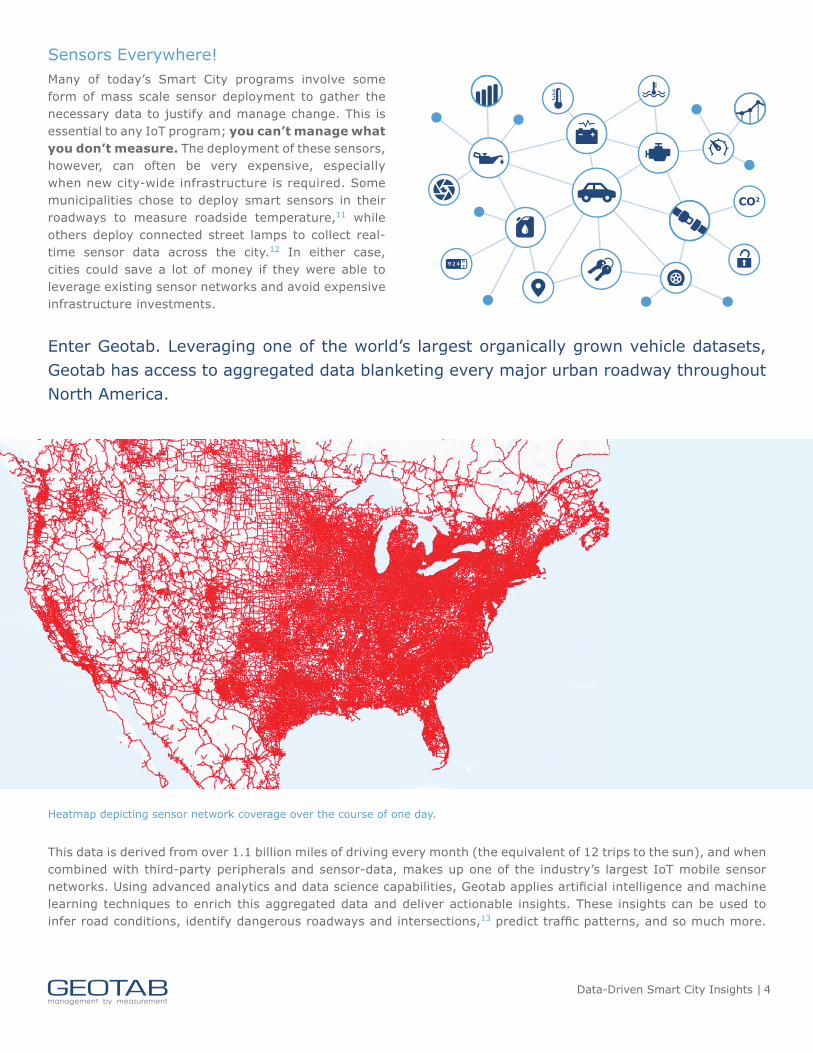
This data is derived from over 1.1 billion miles of driving every month (the equivalent of 12 trips to the sun), and when combined with third-party peripherals and sensor-data, makes up one of the industry’s largest IoT mobile sensor networks. Using advanced analytics and data science capabilities, Geotab applies artificial intelligence and machine learning techniques to enrich this aggregated data and deliver actionable insights. These insights can be used to infer road conditions, identify dangerous roadways and intersections,13 predict traffic patterns, and so much more.
Heatmap depicting sensor network coverage over the course of one day.
Enter Geotab. Leveraging one of the world’s largest organically grown vehicle datasets, Geotab has access to aggregated data blanketing every major urban roadway throughout North America.
Data-Driven Smart City Insights | 5
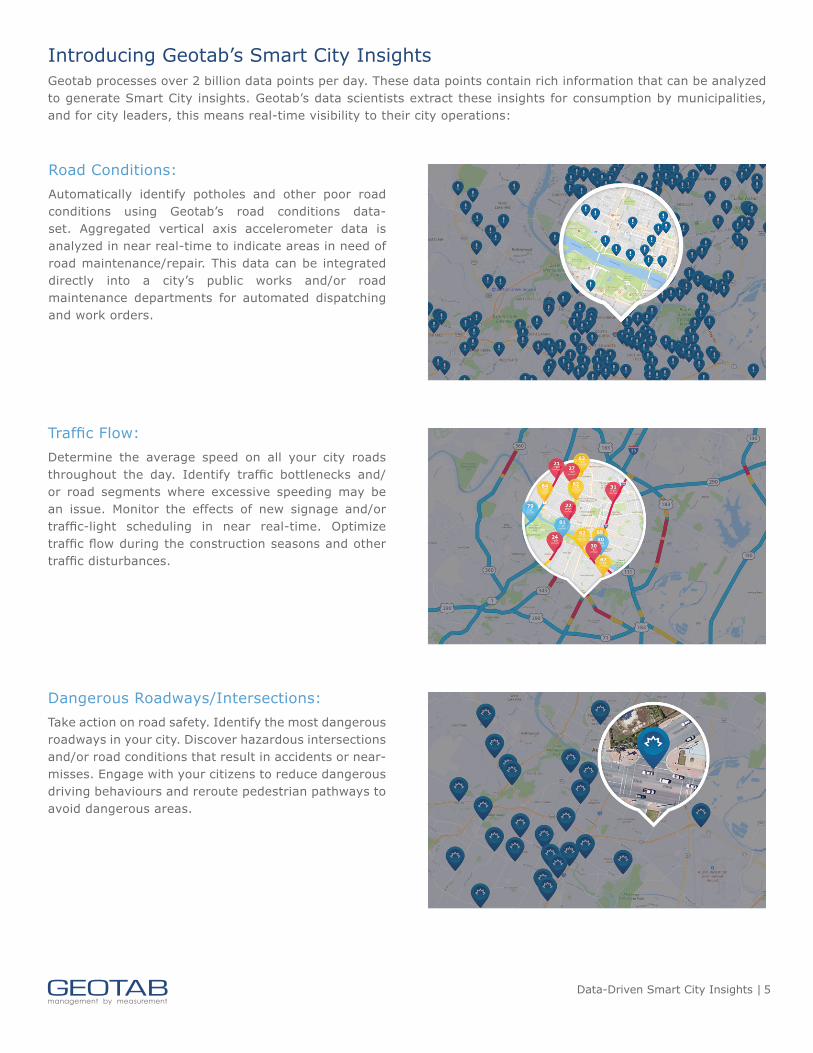
Introducing Geotab’s Smart City InsightsGeotab processes over 2 billion data points per day. These data points contain rich information that can be analyzed to generate Smart City insights. Geotab’s data scientists extract these insights for consumption by municipalities, and for city leaders, this means real-time visibility to their city operations:
Road Conditions: Automatically identify potholes and other poor road conditions using Geotab’s road conditions data-set. Aggregated vertical axis accelerometer data is analyzed in near real-time to indicate areas in need of road maintenance/repair. This data can be integrated directly into a city’s public works and/or road maintenance departments for automated dispatching and work orders.
Traffic Flow: Determine the average speed on all your city roads throughout the day. Identify traffic bottlenecks and/or road segments where excessive speeding may be an issue. Monitor the effects of new signage and/or traffic-light scheduling in near real-time. Optimize traffic flow during the construction seasons and other traffic disturbances.
Dangerous Roadways/Intersections: Take action on road safety. Identify the most dangerous roadways in your city. Discover hazardous intersections and/or road conditions that result in accidents or near-misses. Engage with your citizens to reduce dangerous driving behaviours and reroute pedestrian pathways to avoid dangerous areas.
Data-Driven Smart City Insights | 6
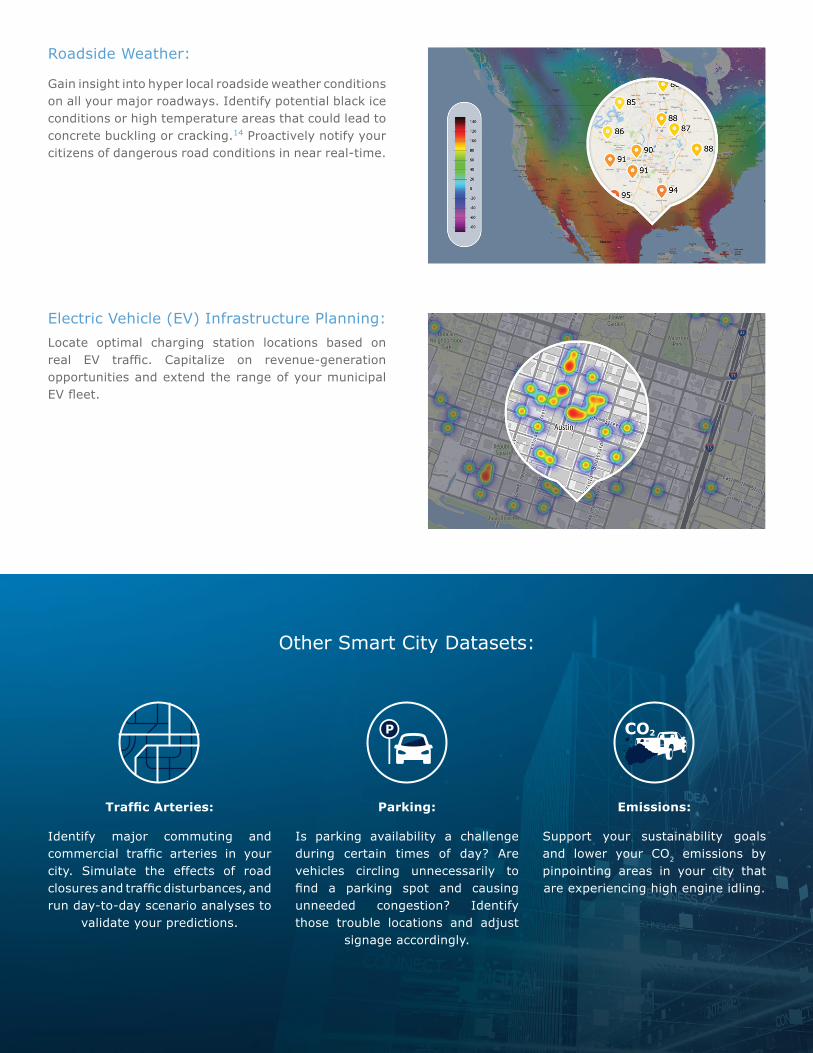
Roadside Weather:
Gain insight into hyper local roadside weather conditions on all your major roadways. Identify potential black ice conditions or high temperature areas that could lead to concrete buckling or cracking.14 Proactively notify your citizens of dangerous road conditions in near real-time.
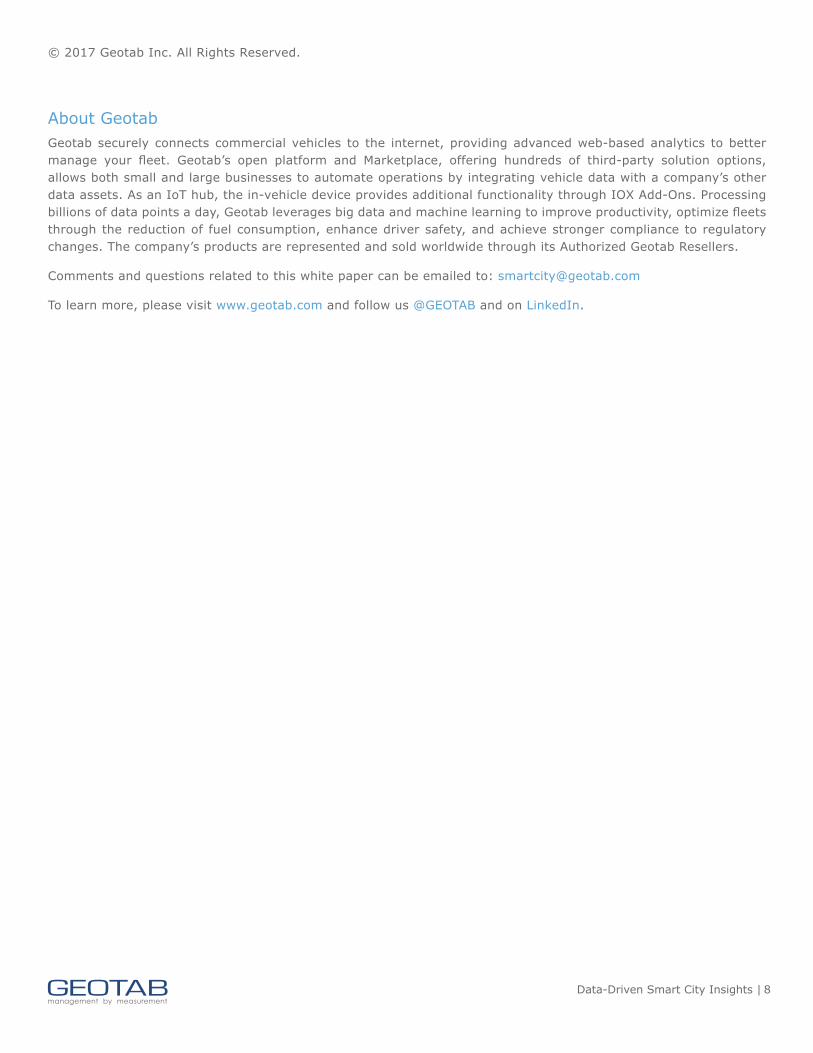
Other Smart City Datasets:
Traffic Arteries:
Identify major commuting and commercial traffic arteries in your city. Simulate the effects of road closures and traffic disturbances, and run day-to-day scenario analyses to
validate your predictions.
Parking:
Is parking availability a challenge during certain times of day? Are vehicles circling unnecessarily to find a parking spot and causing unneeded congestion? Identify those trouble locations and adjust
signage accordingly.
Emissions:
Support your sustainability goals and lower your CO2 emissions by pinpointing areas in your city that are experiencing high engine idling.
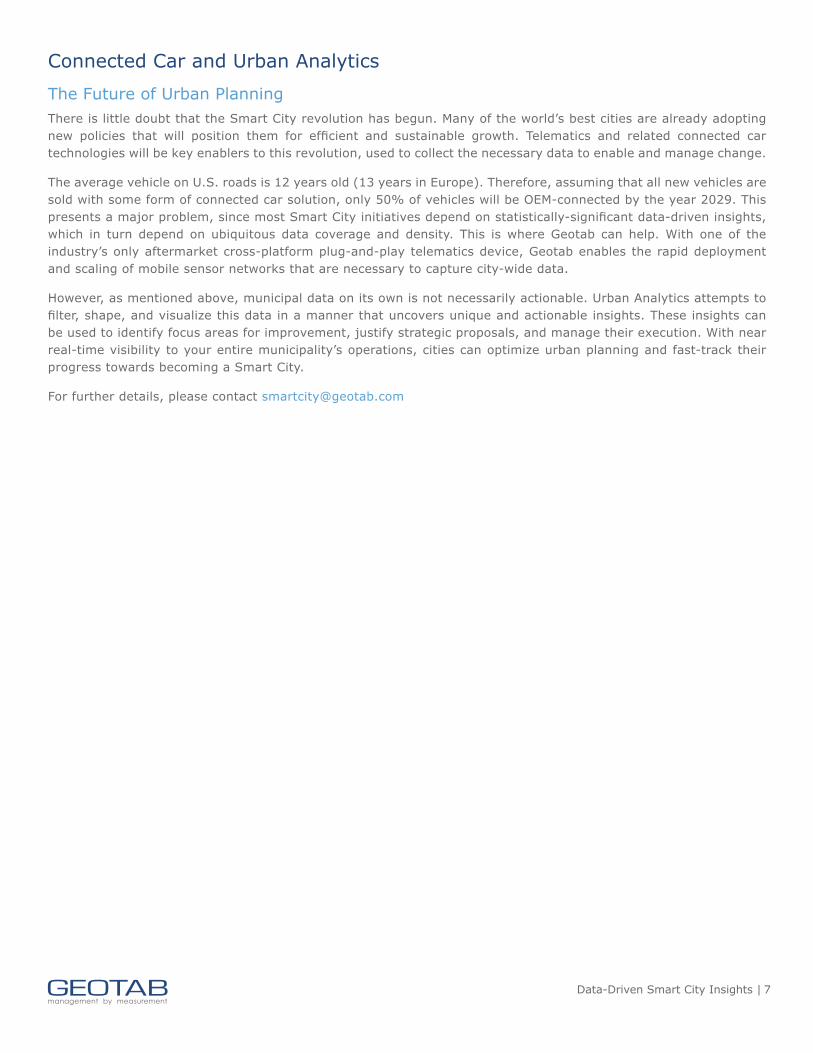
Electric Vehicle (EV) Infrastructure Planning: Locate optimal charging station locations based on real EV traffic. Capitalize on revenue-generation opportunities and extend the range of your municipal EV fleet.
Data-Driven Smart City Insights | 7
Connected Car and Urban Analytics
The Future of Urban PlanningThere is little doubt that the Smart City revolution has begun. Many of the world’s best cities are already adopting new policies that will position them for efficient and sustainable growth. Telematics and related connected car technologies will be key enablers to this revolution, used to collect the necessary data to enable and manage change.
The average vehicle on U.S. roads is 12 years old (13 years in Europe). Therefore, assuming that all new vehicles are sold with some form of connected car solution, only 50% of vehicles will be OEM-connected by the year 2029. This presents a major problem, since most Smart City initiatives depend on statistically-significant data-driven insights, which in turn depend on ubiquitous data coverage and density. This is where Geotab can help. With one of the industry’s only aftermarket cross-platform plug-and-play telematics device, Geotab enables the rapid deployment and scaling of mobile sensor networks that are necessary to capture city-wide data.
However, as mentioned above, municipal data on its own is not necessarily actionable. Urban Analytics attempts to filter, shape, and visualize this data in a manner that uncovers unique and actionable insights. These insights can be used to identify focus areas for improvement, justify strategic proposals, and manage their execution. With near real-time visibility to your entire municipality’s operations, cities can optimize urban planning and fast-track their progress towards becoming a Smart City.
For further details, please contact [email protected]
Data-Driven Smart City Insights | 8
© 2017 Geotab Inc. All Rights Reserved.
About GeotabGeotab securely connects commercial vehicles to the internet, providing advanced web-based analytics to better manage your fleet. Geotab’s open platform and Marketplace, offering hundreds of third-party solution options, allows both small and large businesses to automate operations by integrating vehicle data with a company’s other data assets. As an IoT hub, the in-vehicle device provides additional functionality through IOX Add-Ons. Processing billions of data points a day, Geotab leverages big data and machine learning to improve productivity, optimize fleets through the reduction of fuel consumption, enhance driver safety, and achieve stronger compliance to regulatory changes. The company’s products are represented and sold worldwide through its Authorized Geotab Resellers.
Comments and questions related to this white paper can be emailed to: [email protected]
To learn more, please visit www.geotab.com and follow us @GEOTAB and on LinkedIn.
Data-Driven Smart City Insights | 9
References1. United Nations. (2016). The World’s Cities in 2016. [Online]. Available:
http://www.un.org/en/development/desa/population/publications/pdf/urbanization/the_worlds_cities_in_2016_data_booklet.pdf
2. United States Census Bureau. (2012, Mar. 26). Growth in Urban Population Outpaces Rest of Nation, Census Bureau Reports. [Online]. Available: https://www.census.gov/newsroom/releases/archives/2010_census/cb12-50.html
3. H. Kelly and M. McFarland. (2016, Jun. 23). Columbus wins $50 million DoT Smart Cities Challenge. CNN. [Online]. Available: http://money.cnn.com/2016/06/23/technology/columbus-smart-cities/index.html
4. Dr. S. Musa. (2016, Jan.) Smart City Roadmap. [Online]. Available: http://www.academia.edu/21181336/Smart_City_Roadmap
5. S. Kinney. (2017, Jan. 23). Driving digital transformation in smart cities. RCR Wireless News. [Online]. Available: https://www.rcrwireless.com/20170123/fundamentals/digital-transformation-smart-cities-tag17-tag99
6. G. Goodin. (2016, Apr. 5). Austin, TX and the Smart Cities Challenge: Improving transportation, creating ladders of opportunity. [Online]. Available: https://austintexas.gov/blog/austin-tx-and-smart-cities-challenge-improving-transportation-creating-ladders-opportunity
7. B. Dyer. (2017, May 16). Using Digital Technologies to Improve City Operations. [Online]. Available: http://www.cityoforlando.net/mayor/2017/05/using-digital-technologies-to-improve-city-operations/
8. City and County of Denver. (2017). Denver Secures $6 Million Grant to Advance Smart Transportation Initiatives. [Online]. Available: http://www.denvergov.org/content/denvergov/en/transportation-mobility/smart-city.html
9. San Diego UbdDeZine. (2017). San Diego Downtown Development Map. [Online]. Available: https://sandiego.urbdezine.com/development-map/
10. J. M. Gitlin. (2017, Jul. 24). Concerned about connected car privacy? Bluetooth sensors used to track traffic. Ars Technica. [Online]. Available: https://arstechnica.com/cars/2017/07/a-danish-town-has-been-using-bluetooth-sensors-to-track-traffic-patterns/
11. High Sierra Electronics, Inc. (n.d.). Urban NTCIP Road Sensor Station Applications City and County of Denver, CO. [Online]. Available: https://www.highsierraelectronics.com/products/431
12. Current, powered by GE. (2017, Feb. 22). San Diego to Deploy World’s Largest Smart City IoT Platform with Current, powered by GE. [Online]. Available: http://www.marketwired.com/press-release/san-diego-depaoy-worlds-largest-smart-city-iot-platform-with-current-powered-ge-2197840.htm
13. Geotab. (n.d.). The Most Dangerous Highways in America. [Online]. Available: https://www.geotab.com/the-most-dangerous-highways-in-america/
14. Better Institutions. (2013, Jul. 18). Extreme temperatures are affecting every mode of transportation. [Online]. Available: http://www.betterinstitutions.com/blog/2013/07/extreme-temperatures-are-affecting