Embed Size (px)
Citation preview
GENERAL INFO
GROWING AREA
FIELD TREATMENT
MANAGEMENTif applicable: above
ground biomass
ENERGY & PROCESSING
TRANSPORT(optional)
YEAR
HARVESTEDYIELD
YIELD TOMARKET
CROP CROP AREA*
SOIL TEXTURE*
SOIL MOISTURE*
SOIL DRAINAGE*
SOIL PH*
SOILORGANICMATTER*
FERTILISER APPLICATIONS*
NUMBER OFPESTICIDE
APPLICATIONS
CROP RESIDUEMANAGEMENT*
LAND USE CHANGE*
TILLAGE CHANGE*
COVERCROP*
ENERGY USE* TRANSPORT MODE*
TRANSPORTWEIGHT
TRANSPORTDISTANCE
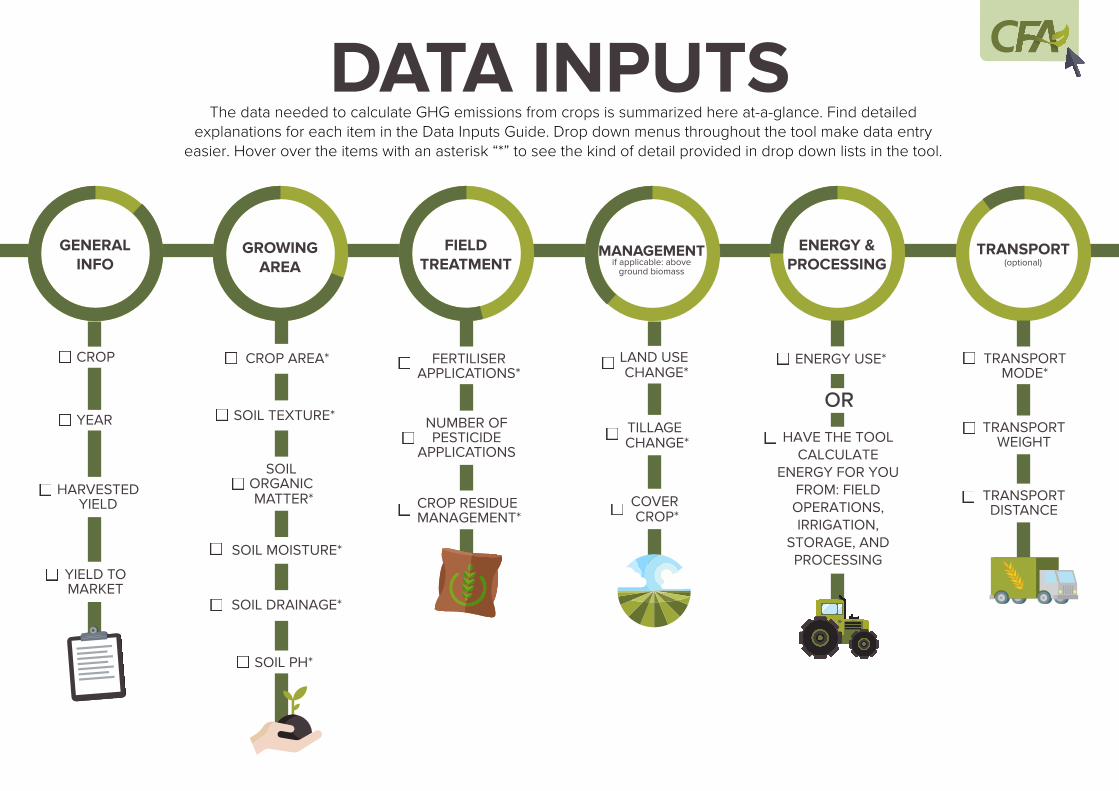
DATA INPUTSThe data needed to calculate GHG emissions from crops is summarized here at-a-glance. Find detailed
explanations for each item in the Data Inputs Guide. Drop down menus throughout the tool make data entry easier. Hover over the items with an asterisk “*” to see the kind of detail provided in drop down lists in the tool.
HAVE THE TOOL CALCULATE
ENERGY FOR YOU FROM: FIELD OPERATIONS, IRRIGATION,
STORAGE, AND PROCESSING
OR
!
The Cool Farm Tool Data Input Guide -- Crops
Cool Farm Alliance 2016
For more information, see www.coolfarmtool.org
1Cool Farm Alliance Community Interest Company The Stable Yard, Vicarage Road, Stony Stratford, MK11 1BN England. Website: www.coolfarmtool.org
The guide is organized in six sections:
1. General Information (year, product, yield)
2. Growing Area (size, soil texture, som, moisture, drainage, pH)
3. Field Treatment
4. Management (including land use change and above ground sequestration)
5. Field Energy Use (fuel use, electricity etc)
6. Transport
All values are annual figures. Energy use should be input based on the size of the field. For example if you’re modelling one hectare, input your per-hectare electricity and/or fuel use. If you’re modelling a 100-hectare field, input the electricity/fuel use for that field-size.
2Cool Farm Alliance Community Interest Company The Stable Yard, Vicarage Road, Stony Stratford, MK11 1BN England. Website: www.coolfarmtool.org
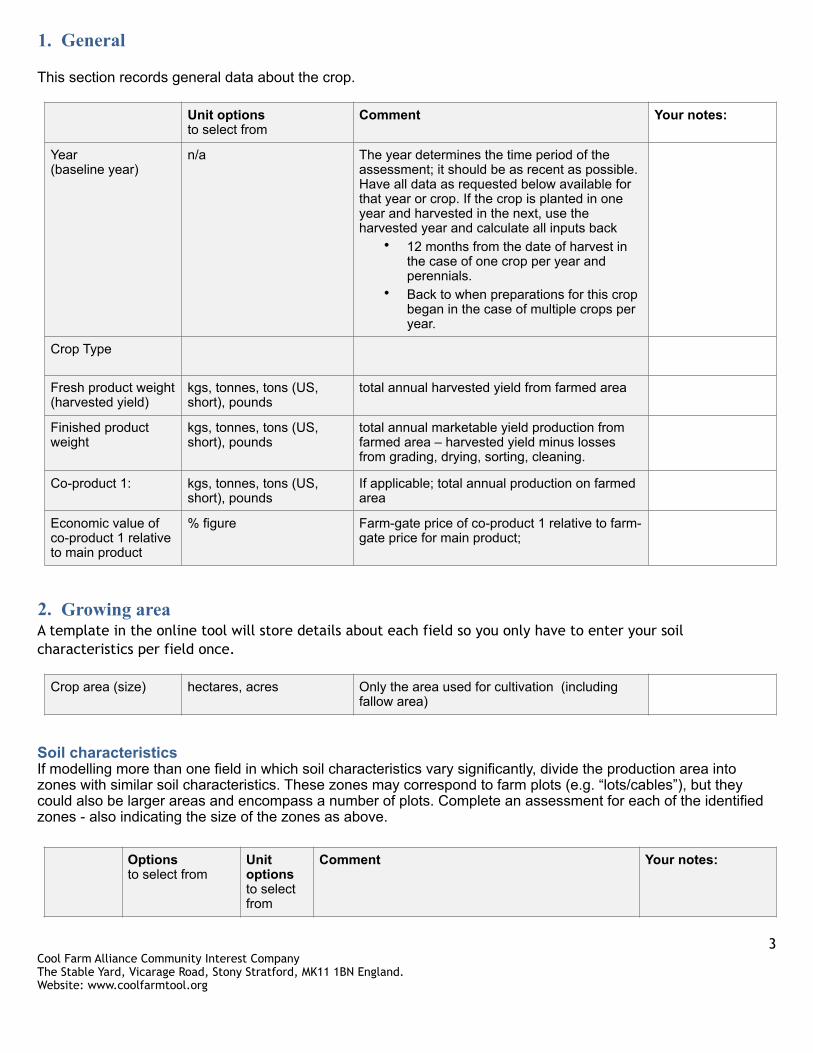
1. General
This section records general data about the crop.
2. Growing area A template in the online tool will store details about each field so you only have to enter your soil characteristics per field once.
Soil characteristics If modelling more than one field in which soil characteristics vary significantly, divide the production area into zones with similar soil characteristics. These zones may correspond to farm plots (e.g. “lots/cables”), but they could also be larger areas and encompass a number of plots. Complete an assessment for each of the identified zones - also indicating the size of the zones as above.
Unit options to select from
Comment Your notes:
Year (baseline year)
n/a The year determines the time period of the assessment; it should be as recent as possible. Have all data as requested below available for that year or crop. If the crop is planted in one year and harvested in the next, use the harvested year and calculate all inputs back
• 12 months from the date of harvest in the case of one crop per year and perennials.
• Back to when preparations for this crop began in the case of multiple crops per year.
Crop Type
Fresh product weight (harvested yield)
kgs, tonnes, tons (US, short), pounds
total annual harvested yield from farmed area
Finished product weight
kgs, tonnes, tons (US, short), pounds
total annual marketable yield production from farmed area – harvested yield minus losses from grading, drying, sorting, cleaning.
Co-product 1: kgs, tonnes, tons (US, short), pounds
If applicable; total annual production on farmed area
Economic value of co-product 1 relative to main product
% figure Farm-gate price of co-product 1 relative to farm-gate price for main product;
Crop area (size) hectares, acres Only the area used for cultivation (including fallow area)
Options to select from
Unit options to select from
Comment Your notes:
3Cool Farm Alliance Community Interest Company The Stable Yard, Vicarage Road, Stony Stratford, MK11 1BN England. Website: www.coolfarmtool.org
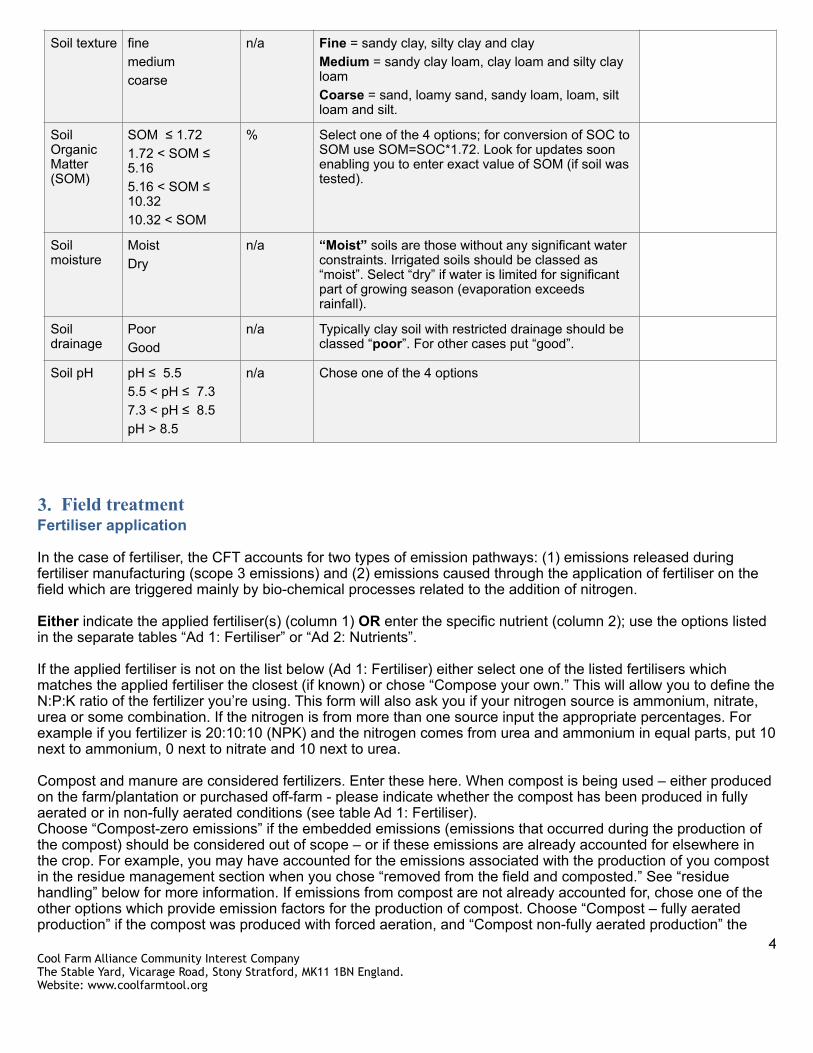
3. Field treatment Fertiliser application
In the case of fertiliser, the CFT accounts for two types of emission pathways: (1) emissions released during fertiliser manufacturing (scope 3 emissions) and (2) emissions caused through the application of fertiliser on the field which are triggered mainly by bio-chemical processes related to the addition of nitrogen.
Either indicate the applied fertiliser(s) (column 1) OR enter the specific nutrient (column 2); use the options listed in the separate tables “Ad 1: Fertiliser” or “Ad 2: Nutrients”.
If the applied fertiliser is not on the list below (Ad 1: Fertiliser) either select one of the listed fertilisers which matches the applied fertiliser the closest (if known) or chose “Compose your own.” This will allow you to define the N:P:K ratio of the fertilizer you’re using. This form will also ask you if your nitrogen source is ammonium, nitrate, urea or some combination. If the nitrogen is from more than one source input the appropriate percentages. For example if you fertilizer is 20:10:10 (NPK) and the nitrogen comes from urea and ammonium in equal parts, put 10 next to ammonium, 0 next to nitrate and 10 next to urea.
Compost and manure are considered fertilizers. Enter these here. When compost is being used – either produced on the farm/plantation or purchased off-farm - please indicate whether the compost has been produced in fully aerated or in non-fully aerated conditions (see table Ad 1: Fertiliser). Choose “Compost-zero emissions” if the embedded emissions (emissions that occurred during the production of the compost) should be considered out of scope – or if these emissions are already accounted for elsewhere in the crop. For example, you may have accounted for the emissions associated with the production of you compost in the residue management section when you chose “removed from the field and composted.” See “residue handling” below for more information. If emissions from compost are not already accounted for, chose one of the other options which provide emission factors for the production of compost. Choose “Compost – fully aerated production” if the compost was produced with forced aeration, and “Compost non-fully aerated production” the
Soil texture fine medium coarse
n/a Fine = sandy clay, silty clay and clay Medium = sandy clay loam, clay loam and silty clay loam Coarse = sand, loamy sand, sandy loam, loam, silt loam and silt.
Soil Organic Matter (SOM)
SOM ≤ 1.72 1.72 < SOM ≤ 5.16 5.16 < SOM ≤ 10.32 10.32 < SOM
% Select one of the 4 options; for conversion of SOC to SOM use SOM=SOC*1.72. Look for updates soon enabling you to enter exact value of SOM (if soil was tested).
Soil moisture
Moist Dry
n/a “Moist” soils are those without any significant water constraints. Irrigated soils should be classed as “moist”. Select “dry” if water is limited for significant part of growing season (evaporation exceeds rainfall).
Soil drainage
Poor Good
n/a Typically clay soil with restricted drainage should be classed “poor”. For other cases put “good”.
Soil pH pH ≤ 5.5 5.5 < pH ≤ 7.3 7.3 < pH ≤ 8.5 pH > 8.5
n/a Chose one of the 4 options
4Cool Farm Alliance Community Interest Company The Stable Yard, Vicarage Road, Stony Stratford, MK11 1BN England. Website: www.coolfarmtool.org
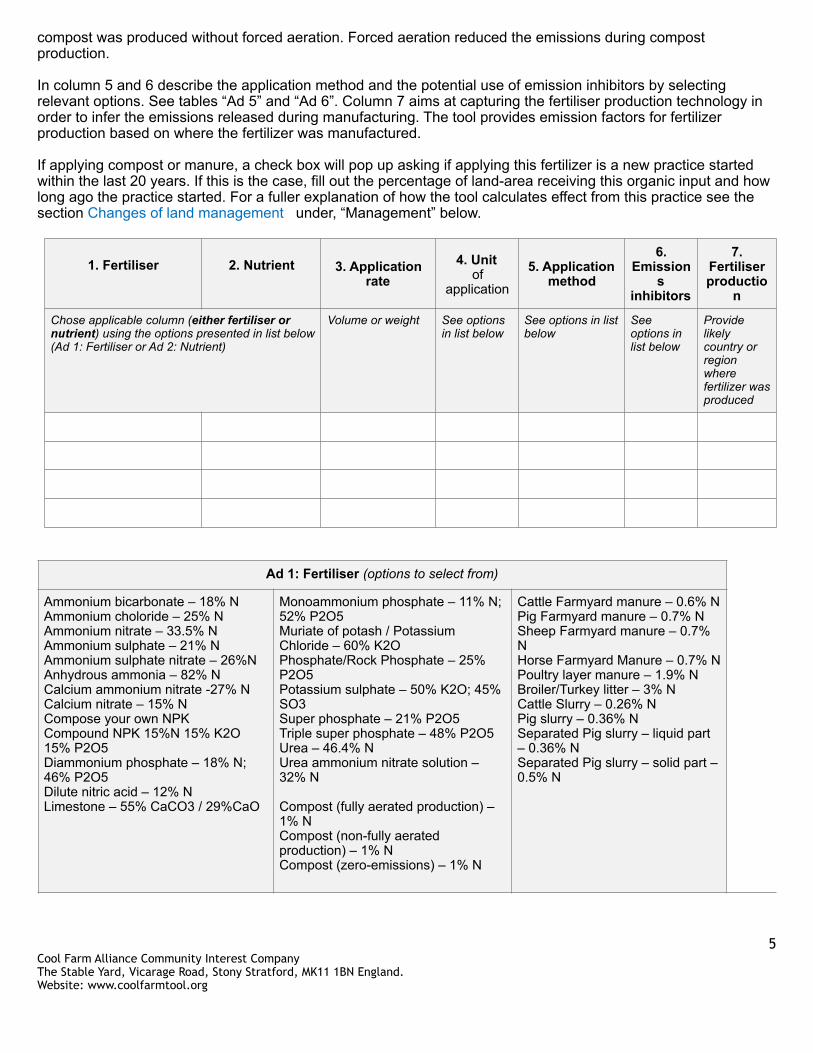
compost was produced without forced aeration. Forced aeration reduced the emissions during compost production.
In column 5 and 6 describe the application method and the potential use of emission inhibitors by selecting relevant options. See tables “Ad 5” and “Ad 6”. Column 7 aims at capturing the fertiliser production technology in order to infer the emissions released during manufacturing. The tool provides emission factors for fertilizer production based on where the fertilizer was manufactured.
If applying compost or manure, a check box will pop up asking if applying this fertilizer is a new practice started within the last 20 years. If this is the case, fill out the percentage of land-area receiving this organic input and how long ago the practice started. For a fuller explanation of how the tool calculates effect from this practice see the section Changes of land management under, “Management” below.
1. Fertiliser 2. Nutrient 3. Application rate
4. Unit of
application
5. Application method
6. Emission
s inhibitors
7. Fertiliser productio
n
Chose applicable column (either fertiliser or nutrient) using the options presented in list below (Ad 1: Fertiliser or Ad 2: Nutrient)
Volume or weight See options in list below
See options in list below
See options in list below
Provide likely country or region where fertilizer was produced
Ad 1: Fertiliser (options to select from)
Ammonium bicarbonate – 18% N Ammonium choloride – 25% N Ammonium nitrate – 33.5% N Ammonium sulphate – 21% N Ammonium sulphate nitrate – 26%N Anhydrous ammonia – 82% N Calcium ammonium nitrate -27% N Calcium nitrate – 15% N Compose your own NPK Compound NPK 15%N 15% K2O 15% P2O5 Diammonium phosphate – 18% N; 46% P2O5 Dilute nitric acid – 12% N Limestone – 55% CaCO3 / 29%CaO
Monoammonium phosphate – 11% N; 52% P2O5 Muriate of potash / Potassium Chloride – 60% K2O Phosphate/Rock Phosphate – 25% P2O5 Potassium sulphate – 50% K2O; 45% SO3 Super phosphate – 21% P2O5 Triple super phosphate – 48% P2O5 Urea – 46.4% N Urea ammonium nitrate solution – 32% N
Compost (fully aerated production) – 1% N Compost (non-fully aerated production) – 1% N Compost (zero-emissions) – 1% N
Cattle Farmyard manure – 0.6% N Pig Farmyard manure – 0.7% N Sheep Farmyard manure – 0.7% N Horse Farmyard Manure – 0.7% N Poultry layer manure – 1.9% N Broiler/Turkey litter – 3% N Cattle Slurry – 0.26% N Pig slurry – 0.36% N Separated Pig slurry – liquid part – 0.36% N Separated Pig slurry – solid part – 0.5% N
5Cool Farm Alliance Community Interest Company The Stable Yard, Vicarage Road, Stony Stratford, MK11 1BN England. Website: www.coolfarmtool.org
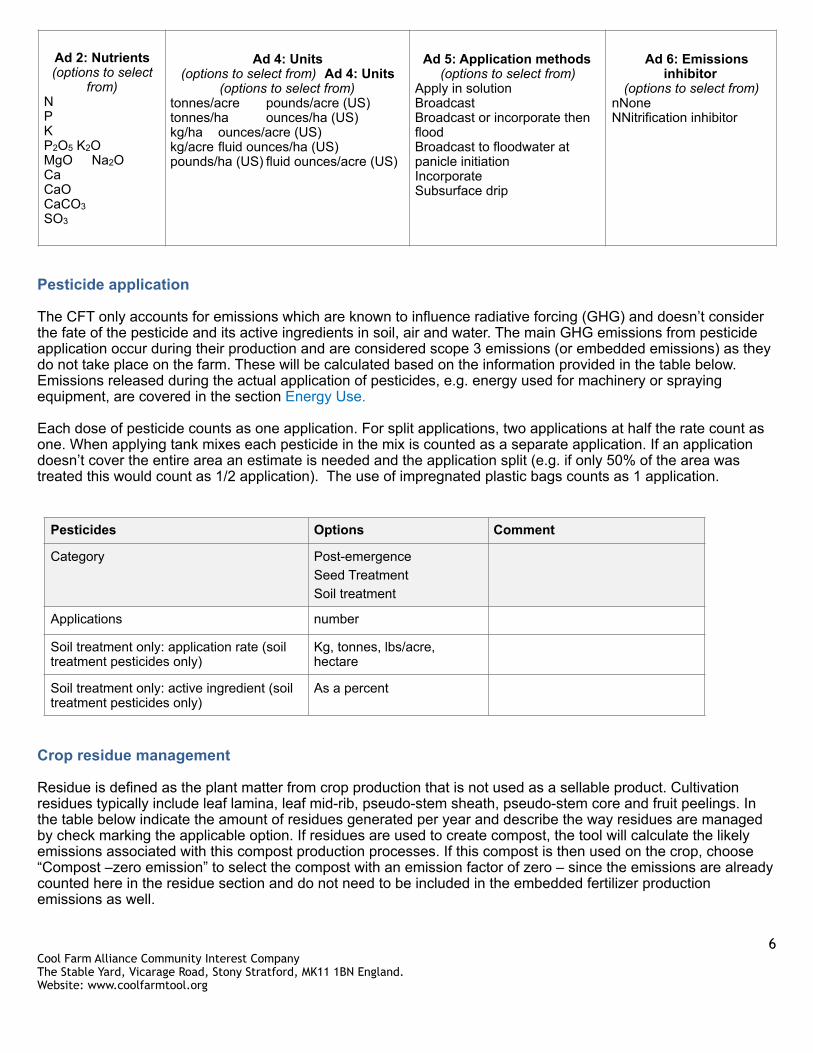
Pesticide application
The CFT only accounts for emissions which are known to influence radiative forcing (GHG) and doesn’t consider the fate of the pesticide and its active ingredients in soil, air and water. The main GHG emissions from pesticide application occur during their production and are considered scope 3 emissions (or embedded emissions) as they do not take place on the farm. These will be calculated based on the information provided in the table below. Emissions released during the actual application of pesticides, e.g. energy used for machinery or spraying equipment, are covered in the section Energy Use.
Each dose of pesticide counts as one application. For split applications, two applications at half the rate count as one. When applying tank mixes each pesticide in the mix is counted as a separate application. If an application doesn’t cover the entire area an estimate is needed and the application split (e.g. if only 50% of the area was treated this would count as 1/2 application). The use of impregnated plastic bags counts as 1 application.
Crop residue management
Residue is defined as the plant matter from crop production that is not used as a sellable product. Cultivation residues typically include leaf lamina, leaf mid-rib, pseudo-stem sheath, pseudo-stem core and fruit peelings. In the table below indicate the amount of residues generated per year and describe the way residues are managed by check marking the applicable option. If residues are used to create compost, the tool will calculate the likely emissions associated with this compost production processes. If this compost is then used on the crop, choose “Compost –zero emission” to select the compost with an emission factor of zero – since the emissions are already counted here in the residue section and do not need to be included in the embedded fertilizer production emissions as well.
Ad 2: Nutrients (options to select
from) N P KP2O5 K2OMgO Na2OCa CaOCaCO3 SO3
Ad 4: Units (options to select from) Ad 4: Units
(options to select from) tonnes/acre pounds/acre (US) tonnes/ha ounces/ha (US) kg/ha ounces/acre (US) kg/acre fluid ounces/ha (US) pounds/ha (US) fluid ounces/acre (US)
Ad 5: Application methods (options to select from)
Apply in solution Broadcast Broadcast or incorporate then flood Broadcast to floodwater at panicle initiation Incorporate Subsurface drip
Ad 6: Emissions inhibitor
(options to select from) nNone NNitrification inhibitor
Pesticides Options Comment
Category Post-emergence Seed Treatment Soil treatment
Applications number
Soil treatment only: application rate (soil treatment pesticides only)
Kg, tonnes, lbs/acre, hectare
Soil treatment only: active ingredient (soil treatment pesticides only)
As a percent
6Cool Farm Alliance Community Interest Company The Stable Yard, Vicarage Road, Stony Stratford, MK11 1BN England. Website: www.coolfarmtool.org
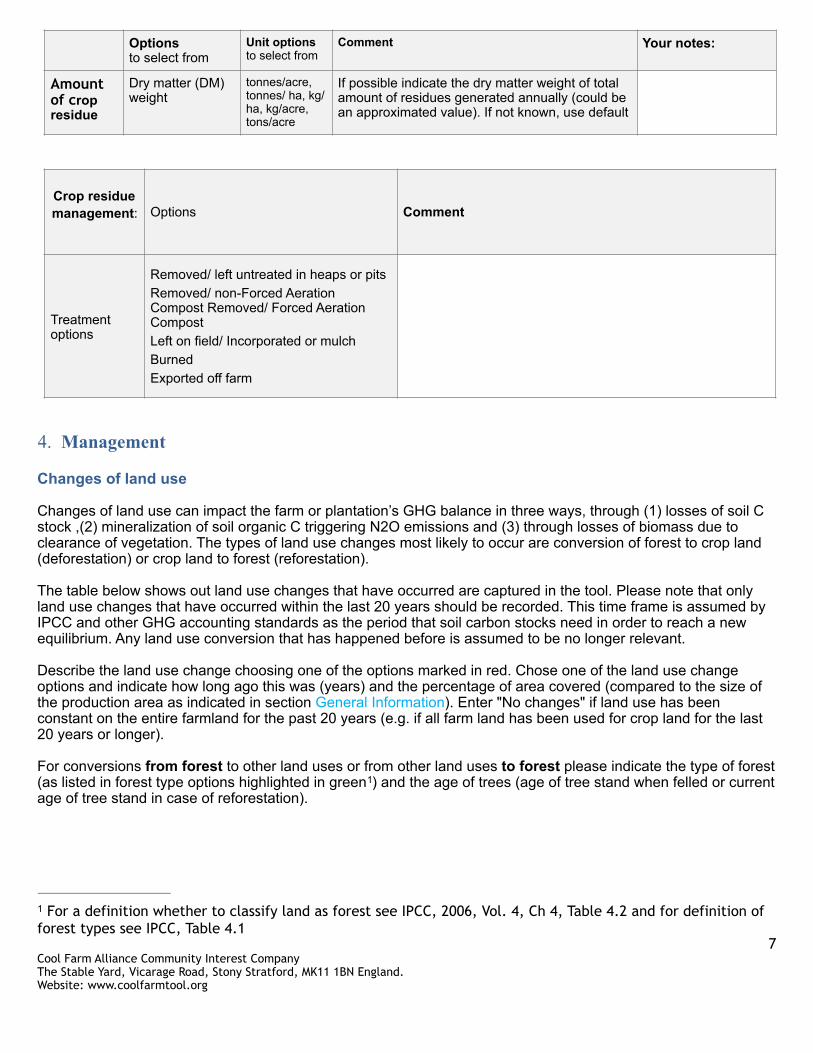
4. Management
Changes of land use
Changes of land use can impact the farm or plantation’s GHG balance in three ways, through (1) losses of soil C stock ,(2) mineralization of soil organic C triggering N2O emissions and (3) through losses of biomass due to clearance of vegetation. The types of land use changes most likely to occur are conversion of forest to crop land (deforestation) or crop land to forest (reforestation).
The table below shows out land use changes that have occurred are captured in the tool. Please note that only land use changes that have occurred within the last 20 years should be recorded. This time frame is assumed by IPCC and other GHG accounting standards as the period that soil carbon stocks need in order to reach a new equilibrium. Any land use conversion that has happened before is assumed to be no longer relevant.
Describe the land use change choosing one of the options marked in red. Chose one of the land use change options and indicate how long ago this was (years) and the percentage of area covered (compared to the size of the production area as indicated in section General Information). Enter "No changes" if land use has been constant on the entire farmland for the past 20 years (e.g. if all farm land has been used for crop land for the last 20 years or longer).
For conversions from forest to other land uses or from other land uses to forest please indicate the type of forest (as listed in forest type options highlighted in green ) and the age of trees (age of tree stand when felled or current 1
age of tree stand in case of reforestation).
Options to select from
Unit options to select from
Comment Your notes:
Amount of crop residue
Dry matter (DM) weight
tonnes/acre, tonnes/ ha, kg/ha, kg/acre, tons/acre
If possible indicate the dry matter weight of total amount of residues generated annually (could be an approximated value). If not known, use default
Crop residue management: Options Comment
Treatment options
Removed/ left untreated in heaps or pits Removed/ non-Forced Aeration Compost Removed/ Forced Aeration Compost Left on field/ Incorporated or mulch Burned Exported off farm
For a definition whether to classify land as forest see IPCC, 2006, Vol. 4, Ch 4, Table 4.2 and for definition of 1
forest types see IPCC, Table 4.1 7
Cool Farm Alliance Community Interest Company The Stable Yard, Vicarage Road, Stony Stratford, MK11 1BN England. Website: www.coolfarmtool.org
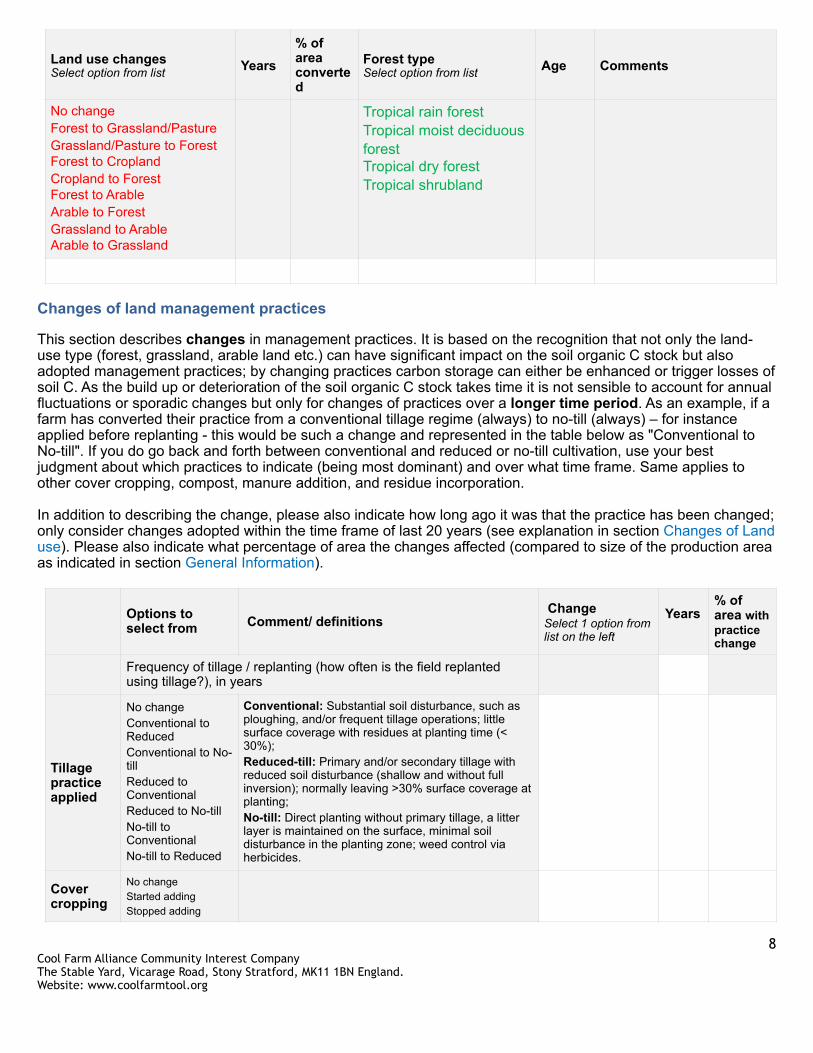
Changes of land management practices
This section describes changes in management practices. It is based on the recognition that not only the land-use type (forest, grassland, arable land etc.) can have significant impact on the soil organic C stock but also adopted management practices; by changing practices carbon storage can either be enhanced or trigger losses of soil C. As the build up or deterioration of the soil organic C stock takes time it is not sensible to account for annual fluctuations or sporadic changes but only for changes of practices over a longer time period. As an example, if a farm has converted their practice from a conventional tillage regime (always) to no-till (always) – for instance applied before replanting - this would be such a change and represented in the table below as "Conventional to No-till". If you do go back and forth between conventional and reduced or no-till cultivation, use your best judgment about which practices to indicate (being most dominant) and over what time frame. Same applies to other cover cropping, compost, manure addition, and residue incorporation.
In addition to describing the change, please also indicate how long ago it was that the practice has been changed; only consider changes adopted within the time frame of last 20 years (see explanation in section Changes of Land use). Please also indicate what percentage of area the changes affected (compared to size of the production area as indicated in section General Information).
Land use changes Select option from list Years
% of area converted
Forest type Select option from list Age Comments
No change Forest to Grassland/Pasture Grassland/Pasture to Forest Forest to Cropland Cropland to Forest Forest to Arable Arable to Forest Grassland to Arable Arable to Grassland
Tropical rain forest Tropical moist deciduous forest Tropical dry forest Tropical shrubland
Options to select from Comment/ definitions
Change Select 1 option from list on the left
Years % of area with practice change
Frequency of tillage / replanting (how often is the field replanted using tillage?), in years
Tillage practice applied
No change Conventional to Reduced Conventional to No-till Reduced to Conventional Reduced to No-till No-till to Conventional No-till to Reduced
Conventional: Substantial soil disturbance, such as ploughing, and/or frequent tillage operations; little surface coverage with residues at planting time (< 30%); Reduced-till: Primary and/or secondary tillage with reduced soil disturbance (shallow and without full inversion); normally leaving >30% surface coverage at planting; No-till: Direct planting without primary tillage, a litter layer is maintained on the surface, minimal soil disturbance in the planting zone; weed control via herbicides.
Cover cropping
No change Started adding Stopped adding
8Cool Farm Alliance Community Interest Company The Stable Yard, Vicarage Road, Stony Stratford, MK11 1BN England. Website: www.coolfarmtool.org
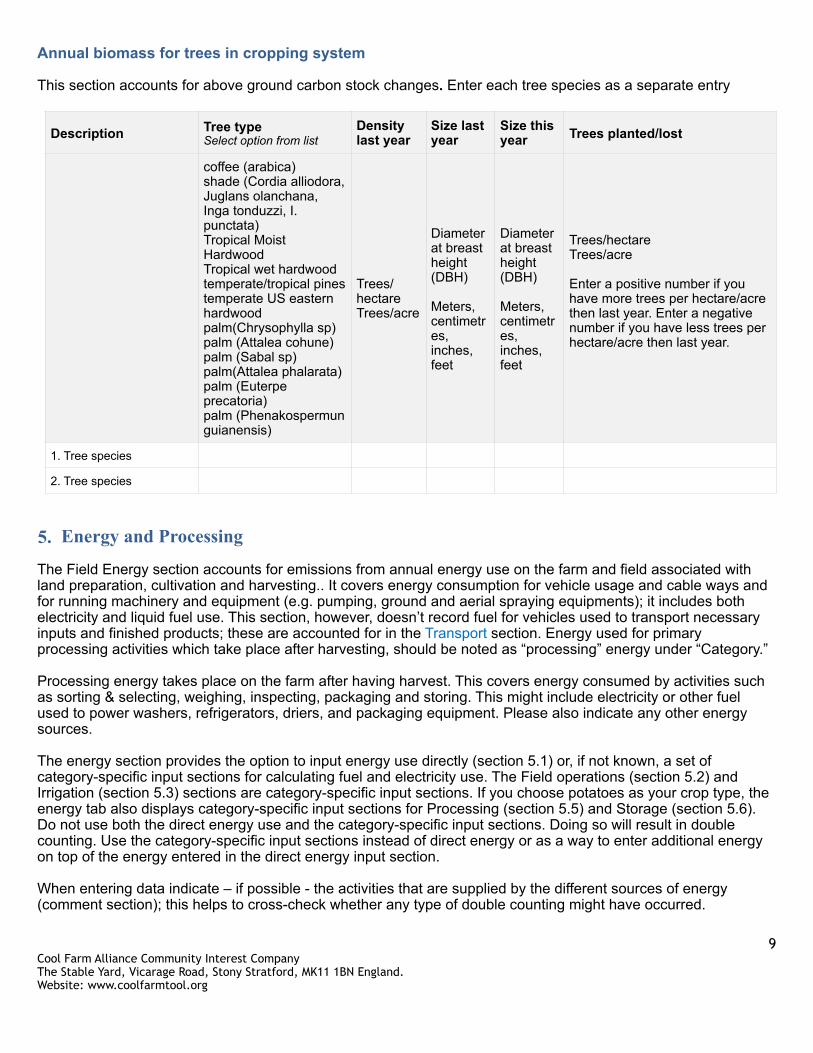
Annual biomass for trees in cropping system
This section accounts for above ground carbon stock changes. Enter each tree species as a separate entry
5. Energy and Processing
The Field Energy section accounts for emissions from annual energy use on the farm and field associated with land preparation, cultivation and harvesting.. It covers energy consumption for vehicle usage and cable ways and for running machinery and equipment (e.g. pumping, ground and aerial spraying equipments); it includes both electricity and liquid fuel use. This section, however, doesn’t record fuel for vehicles used to transport necessary inputs and finished products; these are accounted for in the Transport section. Energy used for primary processing activities which take place after harvesting, should be noted as “processing” energy under “Category.” Processing energy takes place on the farm after having harvest. This covers energy consumed by activities such as sorting & selecting, weighing, inspecting, packaging and storing. This might include electricity or other fuel used to power washers, refrigerators, driers, and packaging equipment. Please also indicate any other energy sources.
The energy section provides the option to input energy use directly (section 5.1) or, if not known, a set of category-specific input sections for calculating fuel and electricity use. The Field operations (section 5.2) and Irrigation (section 5.3) sections are category-specific input sections. If you choose potatoes as your crop type, the energy tab also displays category-specific input sections for Processing (section 5.5) and Storage (section 5.6). Do not use both the direct energy use and the category-specific input sections. Doing so will result in double counting. Use the category-specific input sections instead of direct energy or as a way to enter additional energy on top of the energy entered in the direct energy input section.
When entering data indicate – if possible - the activities that are supplied by the different sources of energy (comment section); this helps to cross-check whether any type of double counting might have occurred.
Description Tree type Select option from list
Density last year
Size last year
Size this year Trees planted/lost
coffee (arabica) shade (Cordia alliodora, Juglans olanchana, Inga tonduzzi, I. punctata) Tropical Moist Hardwood Tropical wet hardwood temperate/tropical pines temperate US eastern hardwood palm(Chrysophylla sp) palm (Attalea cohune) palm (Sabal sp) palm(Attalea phalarata) palm (Euterpe precatoria) palm (Phenakospermun guianensis)
Trees/hectare Trees/acre
Diameter at breast height (DBH)
Meters, centimetres, inches, feet
Diameter at breast height (DBH)
Meters, centimetres, inches, feet
Trees/hectare Trees/acre
Enter a positive number if you have more trees per hectare/acre then last year. Enter a negative number if you have less trees per hectare/acre then last year.
1. Tree species
2. Tree species
9Cool Farm Alliance Community Interest Company The Stable Yard, Vicarage Road, Stony Stratford, MK11 1BN England. Website: www.coolfarmtool.org
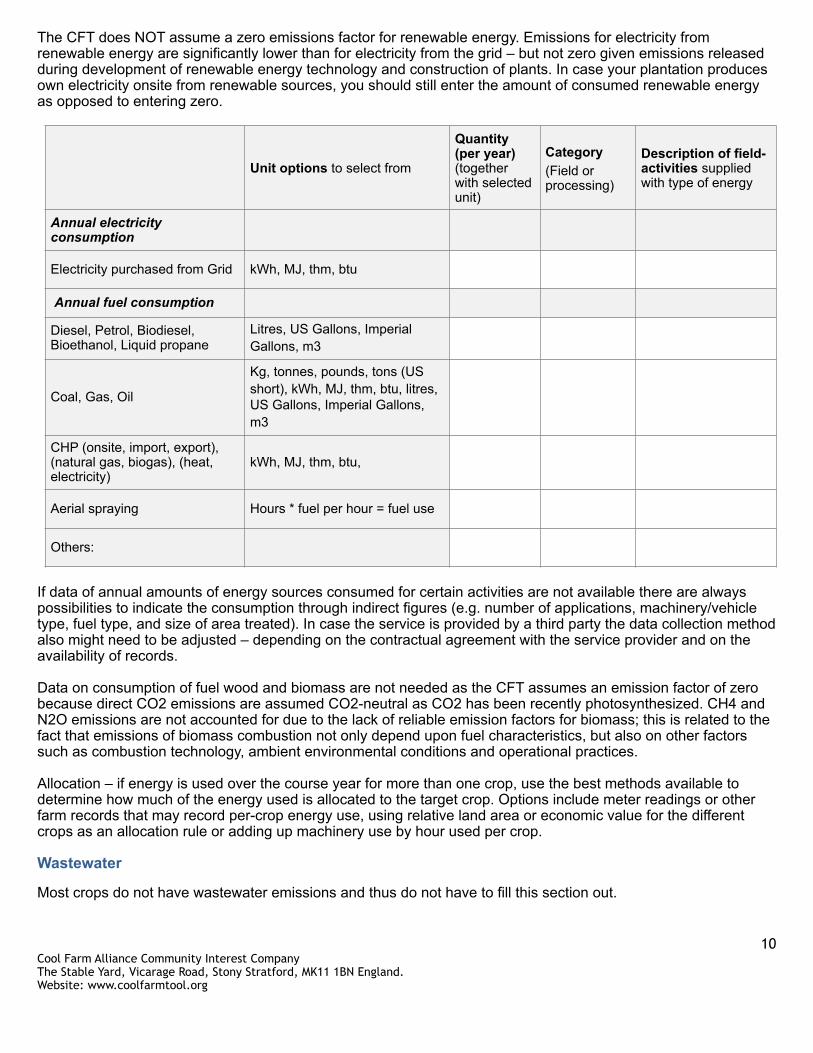
The CFT does NOT assume a zero emissions factor for renewable energy. Emissions for electricity from renewable energy are significantly lower than for electricity from the grid – but not zero given emissions released during development of renewable energy technology and construction of plants. In case your plantation produces own electricity onsite from renewable sources, you should still enter the amount of consumed renewable energy as opposed to entering zero.
If data of annual amounts of energy sources consumed for certain activities are not available there are always possibilities to indicate the consumption through indirect figures (e.g. number of applications, machinery/vehicle type, fuel type, and size of area treated). In case the service is provided by a third party the data collection method also might need to be adjusted – depending on the contractual agreement with the service provider and on the availability of records.
Data on consumption of fuel wood and biomass are not needed as the CFT assumes an emission factor of zero because direct CO2 emissions are assumed CO2-neutral as CO2 has been recently photosynthesized. CH4 and N2O emissions are not accounted for due to the lack of reliable emission factors for biomass; this is related to the fact that emissions of biomass combustion not only depend upon fuel characteristics, but also on other factors such as combustion technology, ambient environmental conditions and operational practices.
Allocation – if energy is used over the course year for more than one crop, use the best methods available to determine how much of the energy used is allocated to the target crop. Options include meter readings or other farm records that may record per-crop energy use, using relative land area or economic value for the different crops as an allocation rule or adding up machinery use by hour used per crop.
Wastewater
Most crops do not have wastewater emissions and thus do not have to fill this section out.
Unit options to select from
Quantity (per year) (together with selected unit)
Category (Field or processing)
Description of field-activities supplied with type of energy
Annual electricity consumption
Electricity purchased from Grid kWh, MJ, thm, btu
Annual fuel consumption
Diesel, Petrol, Biodiesel, Bioethanol, Liquid propane
Litres, US Gallons, Imperial Gallons, m3
Coal, Gas, Oil
Kg, tonnes, pounds, tons (US short), kWh, MJ, thm, btu, litres, US Gallons, Imperial Gallons, m3
CHP (onsite, import, export), (natural gas, biogas), (heat, electricity)
kWh, MJ, thm, btu,
Aerial spraying Hours * fuel per hour = fuel use
Others:
10Cool Farm Alliance Community Interest Company The Stable Yard, Vicarage Road, Stony Stratford, MK11 1BN England. Website: www.coolfarmtool.org
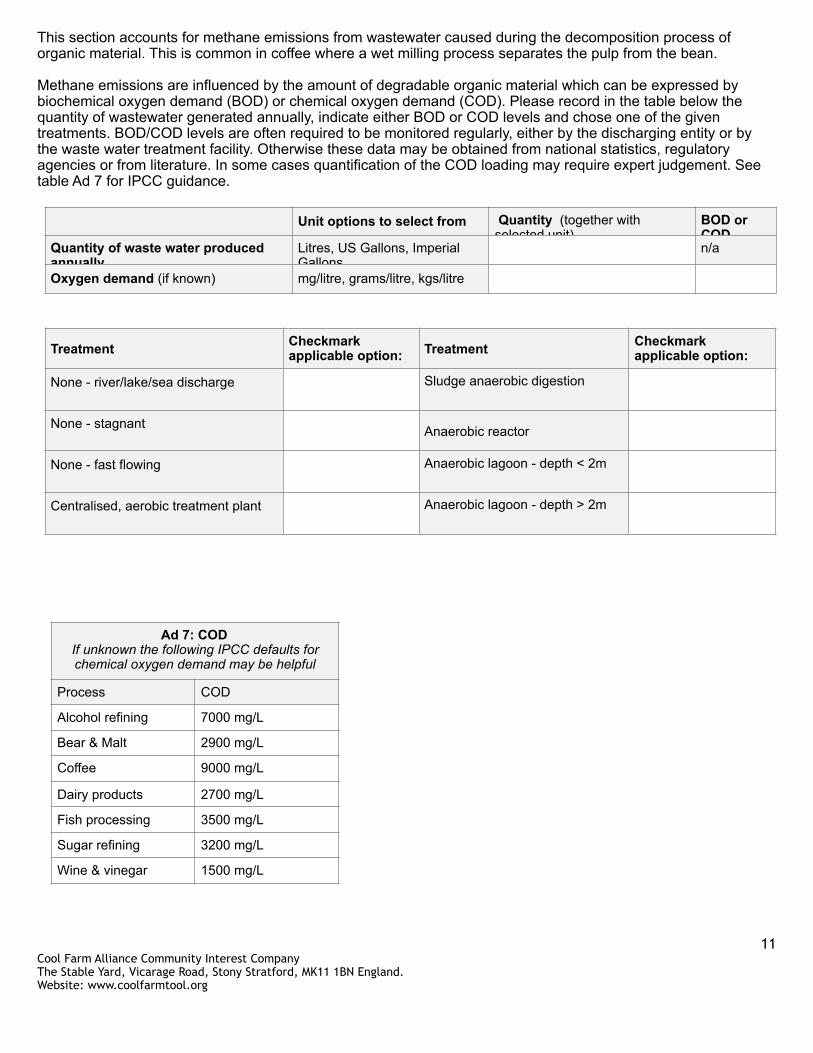
This section accounts for methane emissions from wastewater caused during the decomposition process of organic material. This is common in coffee where a wet milling process separates the pulp from the bean.
Methane emissions are influenced by the amount of degradable organic material which can be expressed by biochemical oxygen demand (BOD) or chemical oxygen demand (COD). Please record in the table below the quantity of wastewater generated annually, indicate either BOD or COD levels and chose one of the given treatments. BOD/COD levels are often required to be monitored regularly, either by the discharging entity or by the waste water treatment facility. Otherwise these data may be obtained from national statistics, regulatory agencies or from literature. In some cases quantification of the COD loading may require expert judgement. See table Ad 7 for IPCC guidance.
Unit options to select from Quantity (together with selected unit)
BOD or COD
Quantity of waste water produced annually
Litres, US Gallons, Imperial Gallons
n/a
Oxygen demand (if known) mg/litre, grams/litre, kgs/litre
Treatment Checkmark applicable option: Treatment Checkmark
applicable option:
None - river/lake/sea discharge Sludge anaerobic digestion
None - stagnant Anaerobic reactor
None - fast flowing Anaerobic lagoon - depth < 2m
Centralised, aerobic treatment plant Anaerobic lagoon - depth > 2m
Ad 7: COD If unknown the following IPCC defaults for chemical oxygen demand may be helpful
Process COD
Alcohol refining 7000 mg/L
Bear & Malt 2900 mg/L
Coffee 9000 mg/L
Dairy products 2700 mg/L
Fish processing 3500 mg/L
Sugar refining 3200 mg/L
Wine & vinegar 1500 mg/L
11Cool Farm Alliance Community Interest Company The Stable Yard, Vicarage Road, Stony Stratford, MK11 1BN England. Website: www.coolfarmtool.org
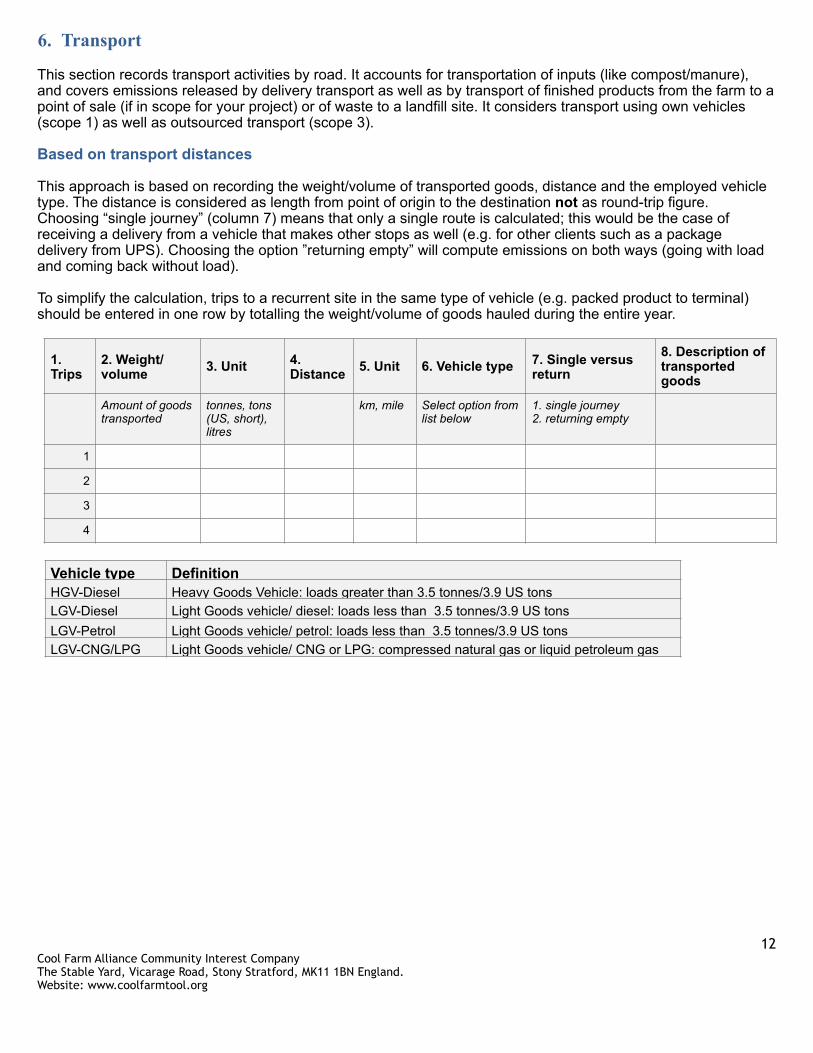
6. Transport
This section records transport activities by road. It accounts for transportation of inputs (like compost/manure), and covers emissions released by delivery transport as well as by transport of finished products from the farm to a point of sale (if in scope for your project) or of waste to a landfill site. It considers transport using own vehicles (scope 1) as well as outsourced transport (scope 3).
Based on transport distances
This approach is based on recording the weight/volume of transported goods, distance and the employed vehicle type. The distance is considered as length from point of origin to the destination not as round-trip figure. Choosing “single journey” (column 7) means that only a single route is calculated; this would be the case of receiving a delivery from a vehicle that makes other stops as well (e.g. for other clients such as a package delivery from UPS). Choosing the option ”returning empty” will compute emissions on both ways (going with load and coming back without load).
To simplify the calculation, trips to a recurrent site in the same type of vehicle (e.g. packed product to terminal) should be entered in one row by totalling the weight/volume of goods hauled during the entire year.
1. Trips
2. Weight/ volume 3. Unit 4.
Distance 5. Unit 6. Vehicle type 7. Single versus return
8. Description of transported goods
Amount of goods transported
tonnes, tons (US, short), litres
km, mile Select option from list below
1. single journey2. returning empty
1
2
3
4
Vehicle type DefinitionHGV-Diesel Heavy Goods Vehicle: loads greater than 3.5 tonnes/3.9 US tonsLGV-Diesel Light Goods vehicle/ diesel: loads less than 3.5 tonnes/3.9 US tonsLGV-Petrol Light Goods vehicle/ petrol: loads less than 3.5 tonnes/3.9 US tonsLGV-CNG/LPG Light Goods vehicle/ CNG or LPG: compressed natural gas or liquid petroleum gas
12Cool Farm Alliance Community Interest Company The Stable Yard, Vicarage Road, Stony Stratford, MK11 1BN England. Website: www.coolfarmtool.org