Embed Size (px)
Citation preview
Data Management in Dynamic
Environment-driven Computational Science
Yogesh L. Simmhan, Sangmi Lee Pallickara, Nithya N. Vijayakumar, andBeth Plale
Computer Science Department, Indiana University, Bloomington IN 47405 USA{ysimmhan,leesangm,nvijayak,plale}@cs.indiana.edu
Abstract. Advances in numerical modeling, computational hardware,and problem solving environments have driven the growth of computa-tional science over the past decades. Science gateways, based on serviceoriented architectures and scientific workflows, provide yet another stepin democratizing access to advanced numerical and scientific tools, com-putational resource and massive data storage, and fostering collabora-tions. Dynamic, data-driven applications, such as those found in weatherforecasting, present interesting challenges to Science Gateways, whichare being addresses as part of the LEAD Cyberinfrastructure project.In this article, we discuss three important data related problems facedby such adaptive data-driven environments: managing a user’s personalworkspace and metadata on the Grid, tracking the provenance of sci-entific workflows and data products, and continuous data mining overobservational weather data.
Key words: LEAD, science gateways, cyberinfrastructure, data & metadatamanagement, provenance, data quality, data mining, streams
1 Introduction
Science has evolved over the past several decades, from an empirical and the-oretical approach to one that includes simulations and modeling [4]. Addition-ally, scientific discoveries are increasingly propelled by large, inter-disciplinarygroups working across geographical boundaries [40]. For instance, projects suchas the Large Hadron Collider aim to solve grand-challenges in science througha collaboration of over 4000 scientists from 40 countries and having access to acentral particle accelerator facility costing over US$2 billion [32].
Several advancements in scientific application and computer science havecontributed to this evolution. Numerical techniques and algorithms have im-proved, allowing the real world to be modeled more accurately than ever before[16]. Weather forecasting models such as WRF, short for Weather Research andForecasting, can now accurately predict regional mesoscale weather at resolu-tions of 1Km grid spacing, with an accuracy of over 80%, 5 days in advance of
2 Simmhan, Y.L., Pallickara, S.L., Vijayakumar, N.N., and Plale, B.
the weather, by integrating data streams across dozens of physical dimensions[20].
Similar advances in computational hardware can now be leveraged trans-parently through Science Gateways [12] that are built on top of standards suchas the Common Component Architecture [3] and the Open Grid Services Ar-chitecture (OGSA) [10]. Science Gateways, also known as Grids or Cyberinfras-tructure, have democratized access to advanced numerical tools, computationalcycles, and data resources, that can be uniformly and conveniently accessed bythe average scientist through online Portal interfaces [21].
However, environmental sciences such as mesoscale meteorology pose specialchallenges to these Science Gateways since they are largely triggered by eventsoccurring in the external environment. A common requirement that exemplifiesthis is when a coarse-resolution regional weather forecasting simulation detectsa precursor signature of a tornado in a certain region, it should spawn offanother fine-resolution simulation in that specific geographical location to seeif a tornado is indeed going to form. There are three key implications of suchscientific applications that need to be addressed. One, scientific simulationshave to be designed such that their structure is dynamic. Secondly, computeand data resources provisioned for the scientific experiments need to adapt tosuch external events. And lastly, there should be the ability to manage largevolumes of data and associated metadata that are generated by various sensorsand instruments deployed globally and from the experiments themselves.
In the subsequent section, we delve deeper into the challenges posed by theadaptive and dynamic needs of environmental sciences, and use mesoscale mete-orology forecasting in the context of the Linked Environments for AtmosphericDiscovery (LEAD) [9] project as an example to motivate the problems. In Sec-tion 3, we discuss the LEAD Cyberinfrastructure that we are building and thevarious enabling technologies in it. In Sections 4, 5, and 6, we will look moreclosely at the data management problems when dealing with terascale data,and successively look at the myLEAD personal metadata catalog to describeand manage user’s data, the Karma provenance framework to track scientificdata products and execution of experiments, and the Calder data mining toolused with streaming data. Finally, in Section 7, we summarize and present ourconclusions.
2 Motivation: Mesoscale Weather Forecasting
Weather forecasting is a static process. Models ingest data generated from sen-sors like radars, mobile meso-nets, upper-air balloons, geostationary and polarorbiting satellites, commercial aircrafts, and surface observations, for a cer-tain temporal and spatial range required by the forecast model. Then, analysisand assimilation of these data sources take place by performing quality controlchecks, extrapolating missing data points, and creating a 3D model grid of theforecast region at the given resolution. This is followed by running the actual
Data Management in Dynamic Environment-driven Computational Science 3
prediction algorithms using weather models configured by the scientists, andmining of the data to detect abnormal weather patterns. The final step gener-ates 2D/3D images and animations of the forecast that can be disseminated tothe scientists and end users. A typical regional prediction of this nature takesabout 4 hours to complete, depending on the size of the region and resolutionof the forecast.
The key problem with such a model is that it is completely static and theforecast is pre-scheduled to run at certain intervals. Even if a hurricane signatureis detected during the data-mining part of the experiment, no action can betaken till the experiment completes, the weather researcher reviews the results,and manually configures and starts another forecast for that particular region.The LEAD project aims to take this well-oiled static computational sciencemesoscale meteorology forecasting process and tear it apart to be dynamic inresponse to the environment. There are several benefits to doing this and aresupported by recent advancements in weather research.
Firstly, regional observational models have better forecast accuracy for a re-gion than do continental models because the resolution of the latter has to becoarser in order to even run on today’s computer systems. The solution is toselectively nest regional forecasts within a larger continental model. Secondly,steerable radars, notably the CASA Radars, are now being deployed. These al-low the focus and collection of high-resolution data on narrow regions, insteadof performing 360◦ swathes all the time. These dynamically steered instrumentscan be leveraged to increase the forecasting accuracy. And lastly, democratiza-tion of scientific resources is now possible through community resources suchas Teragrid [6] and the availability of well established standards for accessingthem. High-schools students can now get access to and learn about the sametools and resources used by weather researchers.
These advances require concomitant advances in fundamental ways in whichcomputational science is done, before they can be leveraged to the fullest extent.These advancements include:
1. Adaptivity in computational models, allowing them to react to externalevents,
2. Adaptive detection and response to weather, through continuous data min-ing and instrument steering,
3. Adaptive use of available resources to respond to current computationaland data load, and priorities of tasks, and
4. Ability for the underlying data subsystem to mine, record, track, and an-notate data products in real time.
In the next section, we give an overview of the overall LEAD architecture. Anappreciation of the portal interface to the system and the experiment executiontool is useful for the understanding of the remainder of the paper; so we providethat as well.
4 Simmhan, Y.L., Pallickara, S.L., Vijayakumar, N.N., and Plale, B.
Gateway ServicesGateway Services
Core Grid ServicesCore Grid Services
Grid
Portal Server
Execution
ManagementInformation
Services
Self
Management
Data
Services
Resource
ManagementSecurity
Services
Resource Virtualization (OGSA)Resource Virtualization (OGSA)
Compute Resources Data Resources Instruments & Sensors
User Services & Grid DesktopUser Services & Grid Desktop
Proxy Certificate
Server (Vault)
Events & Messaging Resource BrokerCommunity & User
Metadata Catalog
Workflow Engine Resource
Registry
Application
Deployment
Application
Services
User’s Portal Home
[Web Browser]
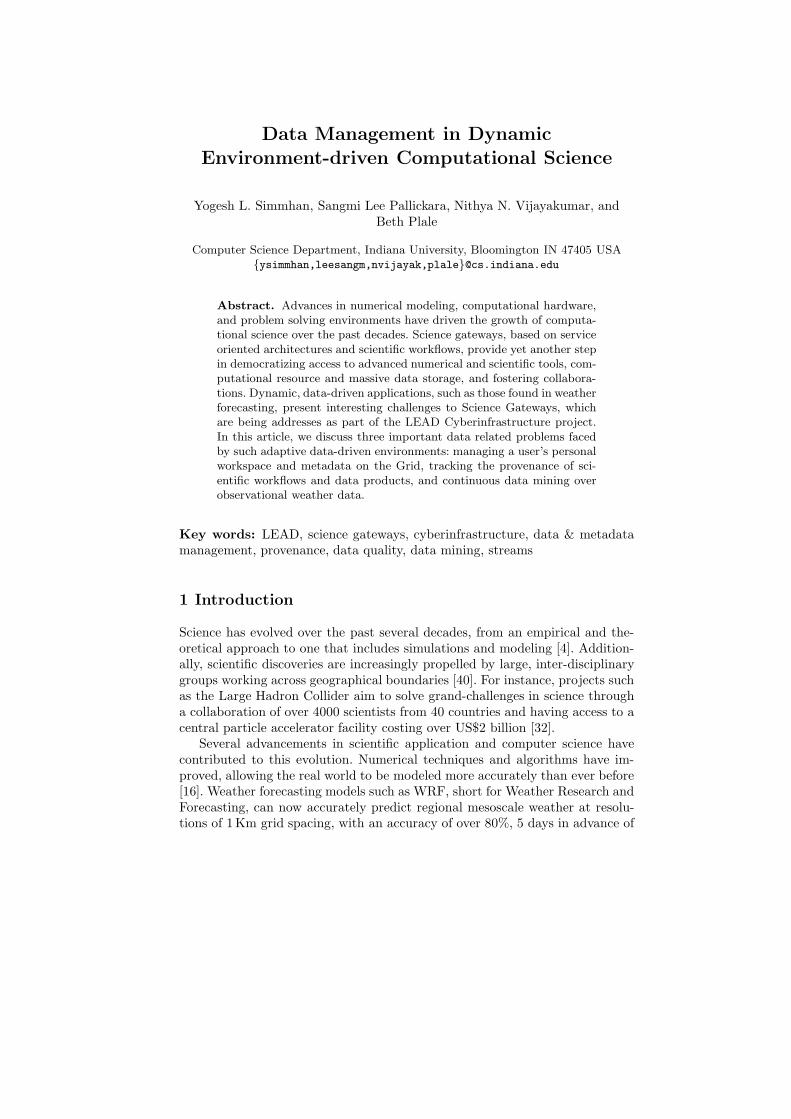
Fig. 1. The LEAD infrastructure is assembled as a set of services that interact withcompute, data, and sensor resources, and accessed by a user through a portal.
3 The LEAD Cyberinfrastructure
The LEAD vision is to effect a paradigm shift in the way computation sciencein mesoscale meteorology is performed, brought about by a service frameworkfor data search and model execution, for weather researchers, and studentsand teachers at K-12 levels and beyond. The LEAD Cyberinfrastructure buildsupon a Service Oriented Architecture (SOA) to provide a uniform and secureinterface to access resources of common interest to a distributed communityof users [12]. Figure 1 illustrates this architecture. At the bottom are physicalresources, such as computational clusters, mass-storage, instruments, and sen-sors. The service architecture virtualizes these resources so that they can beaccesses using standard protocols and interfaces, without worrying about theunderlying architecture or implementation. The OGSA standard [10] is com-monly used as the foundation for resource virtualization in many Grid systems.These resources can be grouped as a set of core services that include securityservices for authentication and identity mapping, data services for moving, stor-ing, replicating, searching, and accessing data, resource management servicesto schedule and monitor resources, and execution management services to plan,schedule, and manage the lifecycle of jobs run on the Grid.
On top of these core services are gateway services that provide value-addedfunctionality and are directly exposed to the user community. These include cer-tificate services for identity management and single sign-on capability, metadatacatalogs, resource registries, notification services, workflow engines, and appli-cation services. The LEAD Portal acts as an online desktop for the users ofthe gateway, and provides visual interfaces to interact with the various gatewayservices.
Data Management in Dynamic Environment-driven Computational Science 5
Surface
Pre-Processor
Terrain
Pre-Processor3D Model
Data Interpolator
ARPS to WRFData Interpolator
WRF
Forecast Model
WRF to ARPSData Interpolator
Postscript to
Image Converter
Workflow Engine
(e.g. BPEL, Jython)
ARPS Plotting
Program
Workflow engine
orchestrates
invocation &
message passing
between services
Scientific Apps
wrapped as Web
Services
Dataflow simulated thro’service invocation sequence
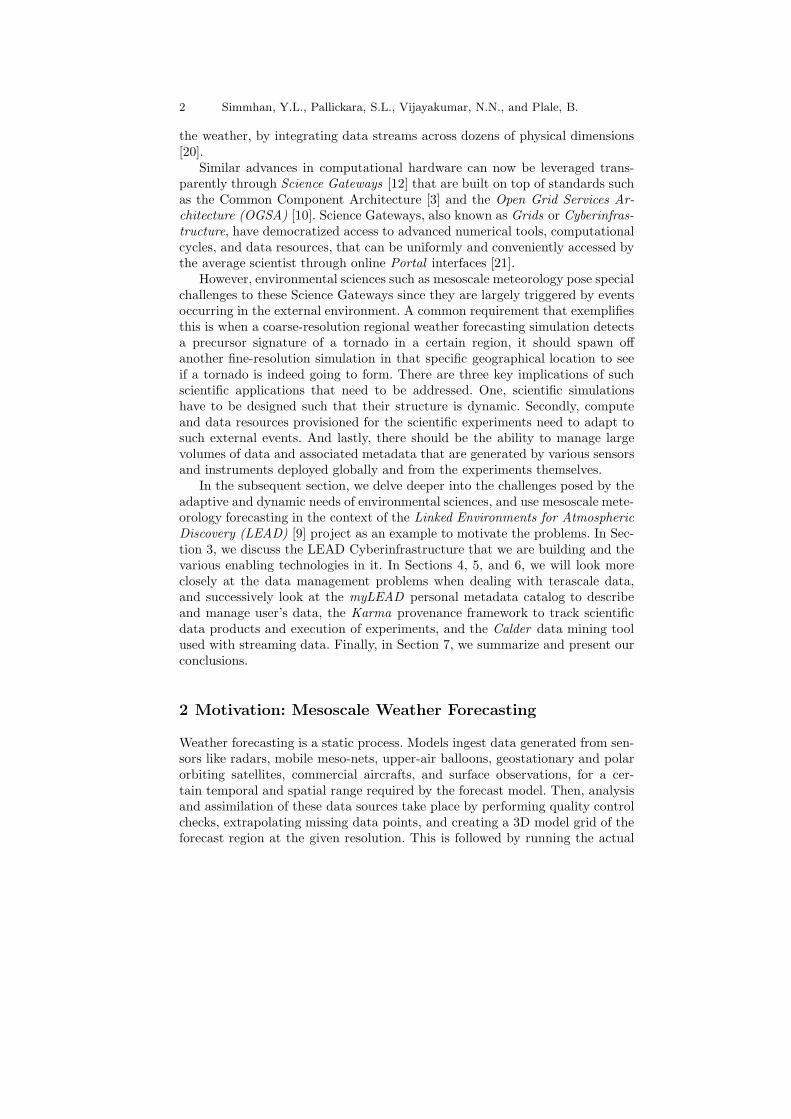
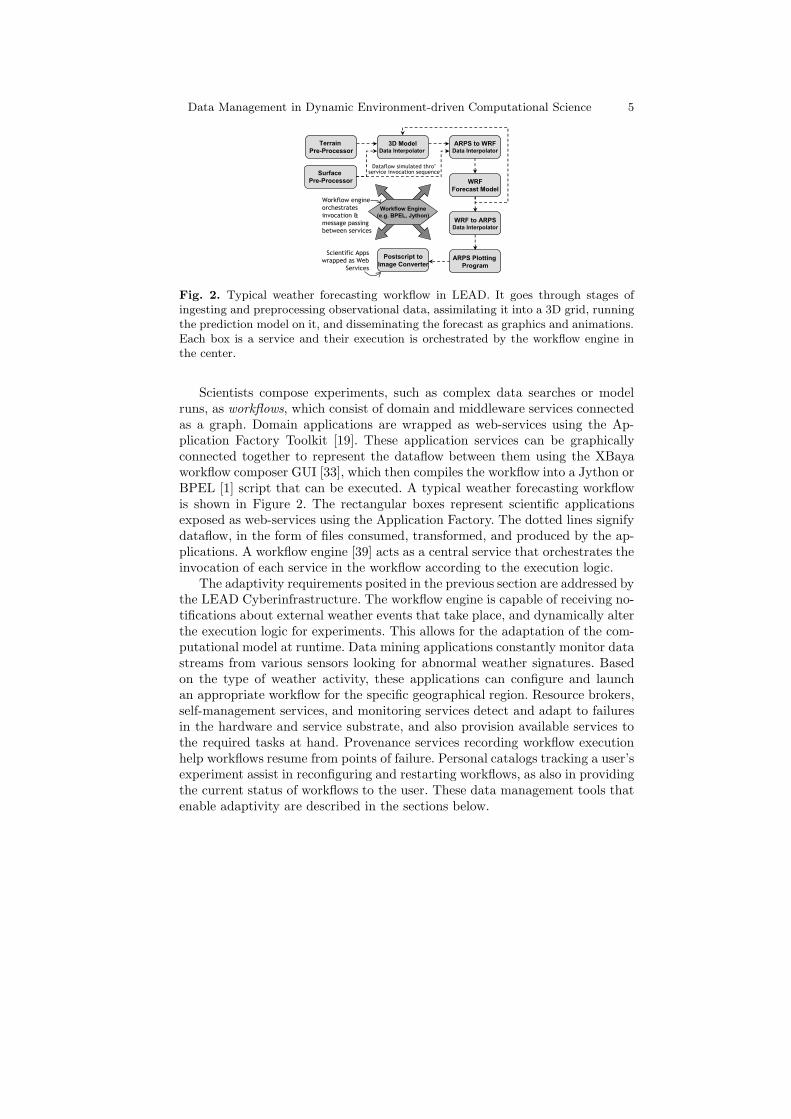
Fig. 2. Typical weather forecasting workflow in LEAD. It goes through stages ofingesting and preprocessing observational data, assimilating it into a 3D grid, runningthe prediction model on it, and disseminating the forecast as graphics and animations.Each box is a service and their execution is orchestrated by the workflow engine inthe center.
Scientists compose experiments, such as complex data searches or modelruns, as workflows, which consist of domain and middleware services connectedas a graph. Domain applications are wrapped as web-services using the Ap-plication Factory Toolkit [19]. These application services can be graphicallyconnected together to represent the dataflow between them using the XBayaworkflow composer GUI [33], which then compiles the workflow into a Jython orBPEL [1] script that can be executed. A typical weather forecasting workflowis shown in Figure 2. The rectangular boxes represent scientific applicationsexposed as web-services using the Application Factory. The dotted lines signifydataflow, in the form of files consumed, transformed, and produced by the ap-plications. A workflow engine [39] acts as a central service that orchestrates theinvocation of each service in the workflow according to the execution logic.
The adaptivity requirements posited in the previous section are addressed bythe LEAD Cyberinfrastructure. The workflow engine is capable of receiving no-tifications about external weather events that take place, and dynamically alterthe execution logic for experiments. This allows for the adaptation of the com-putational model at runtime. Data mining applications constantly monitor datastreams from various sensors looking for abnormal weather signatures. Basedon the type of weather activity, these applications can configure and launchan appropriate workflow for the specific geographical region. Resource brokers,self-management services, and monitoring services detect and adapt to failuresin the hardware and service substrate, and also provision available services tothe required tasks at hand. Provenance services recording workflow executionhelp workflows resume from points of failure. Personal catalogs tracking a user’sexperiment assist in reconfiguring and restarting workflows, as also in providingthe current status of workflows to the user. These data management tools thatenable adaptivity are described in the sections below.
6 Simmhan, Y.L., Pallickara, S.L., Vijayakumar, N.N., and Plale, B.
4 myLEAD: Personal Metadata Catalog
The myLEAD personal workspace comprises of a metadata catalog service anda separate back end storage manager. The notion of a separate DBMS hostedcatalog for metadata is gaining a foothold in computational science throughtools such as myGrid [14], MCS [38], and SRB [31], in distributed computingthrough Lustre [15], and even in enterprise networks through the Acopia ARX[26].
The myLEAD metadata catalog accepts data product descriptions on awide range of data products including text, binary, images, workflow scripts,and input parameters. Data product descriptions arrive at the catalog as XMLdocuments coded according to the LEAD Metadata Schema (LMS) [30]. A thinservice layer provides atomic inserts into the catalog and back end, and performsother duties in cooperation with the workflow system [13]. Early inspiration forthe metadata catalog is the Globus MCS metadata catalog [38], and it utilizesthe service interfaces provided by the UK e-Science OGSA-DAI tool [2]. Itis a distributed service with an instance located at each site in the LEADCyberinfrastructure [9]. A user’s personal workspace resides at one LEAD Gridsite, and is backed up to a master site. Metadata descriptions reside in themetadata catalog, as do smaller data products. Larger products are stored to astorage service, currently the Distributed Replica Service (DRS) [7].
An early estimate of usage of myLEAD is 500 users, where, at any one mo-ment, 25 users are executing a large-scale ensemble computational model. Suchensemble workflows are capable of having up to 1,200 functional applications,and consume and produce up to 10,000 data products [28].
4.1 Data Model
The logical data model for a personal workspace consists of projects, exper-iments, collections, logical files, and attributes. Users can store one or moreprojects in their workspace. Under the projects, one or more experiments, whichcan themselves can contain several collections, can be included. Logical files canbelong to one or more collections, experiments, or projects. The structure ofa personal workspace can vary based on the user’s preference or the design ofthe applications that cooperate with the metadata catalog. These logical datamodel objects can be described by attributes associated with them. Attributescan be keywords, or simple or complex name-value pairs that are added duringthe creation of the objects and enhanced during future accesses to it.
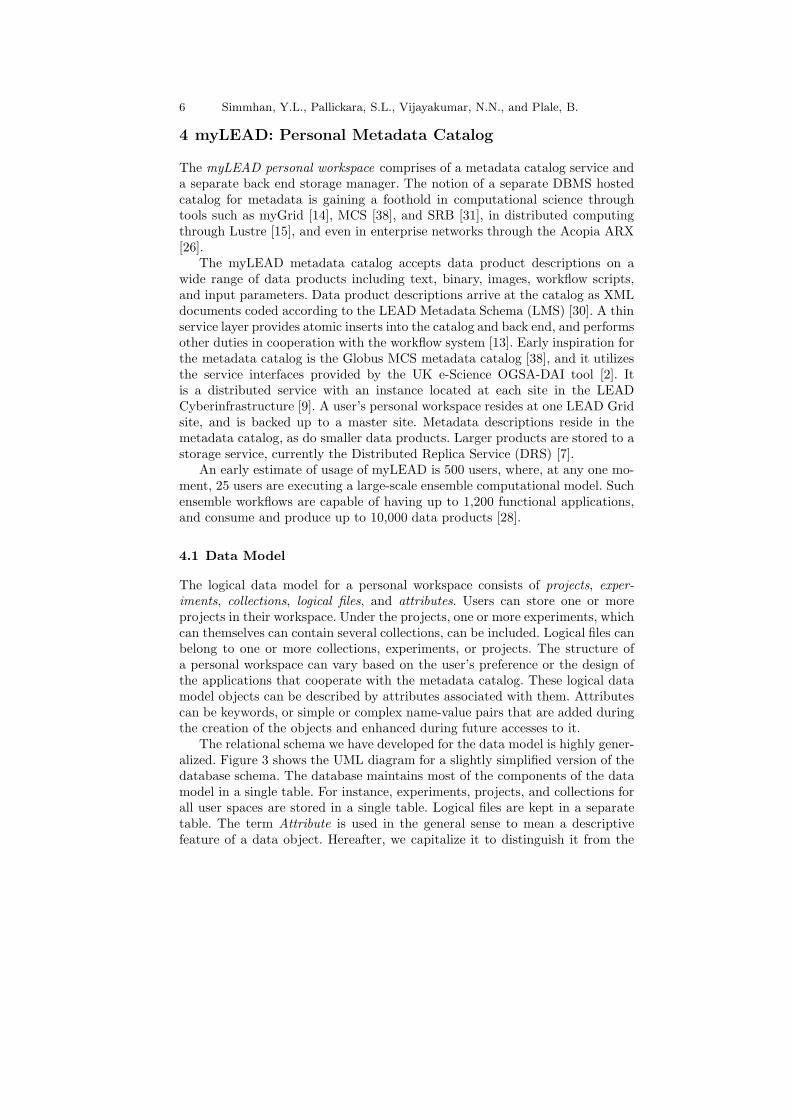
The relational schema we have developed for the data model is highly gener-alized. Figure 3 shows the UML diagram for a slightly simplified version of thedatabase schema. The database maintains most of the components of the datamodel in a single table. For instance, experiments, projects, and collections forall user spaces are stored in a single table. Logical files are kept in a separatetable. The term Attribute is used in the general sense to mean a descriptivefeature of a data object. Hereafter, we capitalize it to distinguish it from the
Data Management in Dynamic Environment-driven Computational Science 7
Fig. 3. Simplified relational schema of the myLEAD database. The organizationaldetails (experiments, projects, etc.) and application attributes are coded in the dataand not in the schema. This gives the catalog independence from the scientific domain.
database table of the same name. As depicted in the Figure 3, an Attribute isimplemented in the database schema as attribute and element tables. In theattribute table, the name and structure (i.e., data type) of a possibly complexAttribute are defined. The element table specifies a 〈name, value〉 pair belongingto one or more entries in the attribute table.
The attribute table defines attributes as containing one or more elements.Here, an attribute can be added on-the-fly by adding a new row to the attributetable. Although it is slightly more complicated because the attribute must bedeclared before an instance is created, this design decision reflects the balancewe maintain between support for annotations after-the-fact and efficient query-ing. Additional details on the schema and database support can be found in[18].
4.2 Storing and Querying Metadata by a Hybrid Approach
In the myLEAD metadata catalog, the metadata of the data product is shreddedinto both Character Large Objects (CLOB) and relational tables. Due to thefocus of the catalog on locating data objects that meet a specified criteria,the XML LMS document is stored using a hybrid technique employing bothinlining and shredding [18]. Parts of the document received at the catalog arestored as CLOBs in the database for faster reconstruction. Key pieces of theschema are shredded (broken apart) for fast querying. This eliminates the needfor achieving lossless shredding from XML since the shredded data is no longerneeded to construct the XML documents returned in query responses.
4.3 Service Architecture
The myLEAD personal workspace is a distributed tool as depicted in Figure 4.At the lowest layer, there are set of distributed storage services such as the Dis-tributed Replica Service (DRS) [7] for the personal data products and Unidata’s
8 Simmhan, Y.L., Pallickara, S.L., Vijayakumar, N.N., and Plale, B.
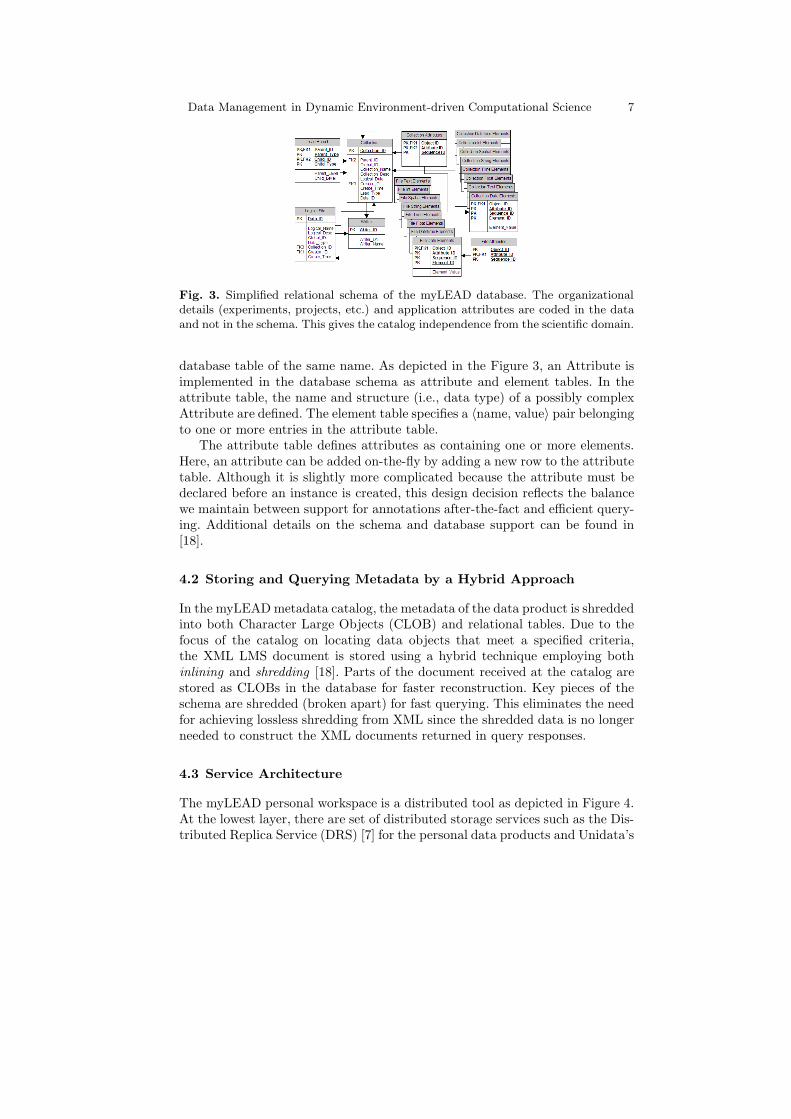
Fig. 4. Architecture of myLEAD personal workspace. The agent is a single servicelayer on top of the storage repository and the metadata catalog. It intercepts workflowactivities by listening on event notification channels.
THREDDS Data Server (TDS) [8] for the public data products. Metadata onpersonal data products is managed by the myLEAD service and stored to arelational database. Much of the logic is implemented as database stored pro-cedures. The data products themselves are either co-located with the metadatain the database (as in the case of workflow scripts), or passed to a replica man-ager, such as DRS. We envision providing support for TDS in the future, whichprovides features specific to the meteorology domain, such as sub-setting andaggregating files, and extracting fields from binary netCDF file. The server isa long-lived grid service built on top of a relational database. It is built on theOGSA-DAI service [2] interface layer.
The myLEAD agent provides client-side services for human users workinginteractively through the portal, and to other services in the LEAD system,particularly the workflow execution engine. The myLEAD agent responds toactivities being carried out on the LEAD Cyberinfrastructure by listening on anevent notification channel [17] on which status events about workflow progressare published. The agent uses the notification messages to determine the cur-rent state of a particular workflow, and actively manages the user space by,for instance, creating a new collection when a major mode transition has takenplace [29]. Users interact with the tools primarily through the LEAD Cyber-infrastructure [11]. However, we are building user interactive features beyondthe portal, such as to download and visualize archived experiments on theirlaptops.
5 Karma: Provenance Framework
Provenance [34, 5] is a form of metadata that describes the causality of anevent, and the context within which to interpret it. Provenance about workflowexecutions is vital for scientific workflows and experiments to ensure that theexact sequence of tasks executed in the experiment is recorded [34]. This log,called the workflow provenance, describes the events that took place during
Data Management in Dynamic Environment-driven Computational Science 9
the course of a workflow’s execution and tries to address the questions of whatservices were invoked, where the workflow and services ran, what their inputsand outputs were (including data products used and produced), who invoked theworkflow, and so on. This type of provenance is necessary to verify and validatethe experiments at a later time, and brings in accountability. It is a usefuldebugging tool post-execution and a monitoring tool while the experiment isrunning. It can also be used to track resource usage and help with schedulingfuture runs of the workflow.
Provenance about data generated by and used in workflows is termed dataprovenance. It attempts to answers questions about the origin of the data (inthe form of workflows or services that created it), the input data that weretransformed to create this data, and the usage trail for the data product. Thisform of provenance is necessary to discover the creator of the data, to provideinsight on its quality, and may also help determine its copyright. The data usagetrail also comes in handy when users of the data need to be notified of potentialerrors in the creation of the data.
The Karma provenance framework [35] collects both these forms of prove-nance for the scientific workflows running in the LEAD Cyberinfrastructure.The provenance model is designed around an abstract workflow model and ac-tivities defined at different parts of the workflow help collect provenance. A keyapplication of the collected provenance is in estimating the quality of workflowderived data products in the LEAD system.
5.1 Provenance Model
The Karma provenance framework [35] used in the LEAD project uses an ab-stract model of a workflow, which it considers as a directed graph, with nodesrepresenting services and edges representing the dataflow between them. Ser-vices are used as a layer of abstraction on top of scientific tasks to enable theiruse in a SOA [19]. As a workflow executes, different services are invoked insequence by a workflow engine interpreting the workflow logic. Data productsand other parameters are passed as inputs to the service, which subsequentlyemits the generated data products. Invoking a service consists of staging theinput files to the service location, launching the scientific task that the servicewraps (usually as a command-line application), monitoring the execution of thescientific application, registering the output result from the application withthe myLEAD catalog, and staging the data to a central data repository. Thesefiles may be used by subsequent services invoked by that workflow or otherworkflows.
As can be seen, the workflow execution takes place at 3 levels: at the work-flow engine level, at the service level, and at the scientific application level.The Karma provenance framework tracks provenance as activities that takeplace at different stages of the workflow. These activities in a workflow aredistributed across various dimensions, one of them being the level. The ac-tivities, such as WorkflowStarts/Finishes, ServiceStarts/Finishes, and
10 Simmhan, Y.L., Pallickara, S.L., Vijayakumar, N.N., and Plale, B.
Workflow Instance
10 Data Products Consumed & Produced by each Service
Service
2…
Service
1
Service
10
Service
9
10P/10C
10C
10P 10C 10P/10C
10P
Workflow
Engine
Message Bus Notification Broker
Subscribe & Listen to
Activity Notifications
Publish Provenance
Activities as NotificationsApplication–Started & –Finished,
Data–Produced & –Consumed
Activities
Workflow–Started &
–Finished Activities
Karma Provenance Service
Provenance
Listener
Provenance
Query API
Activity
DB
Provenance
Browser Client
Query for Workflow, Process,
& Data Provenance
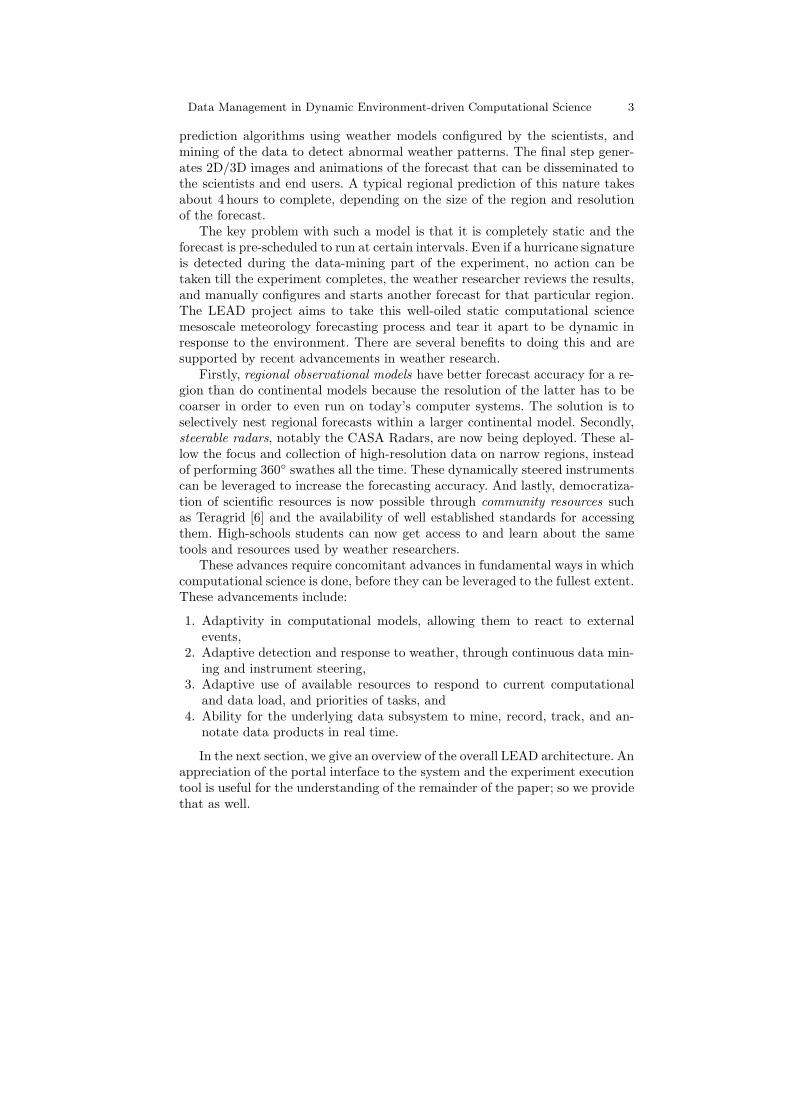
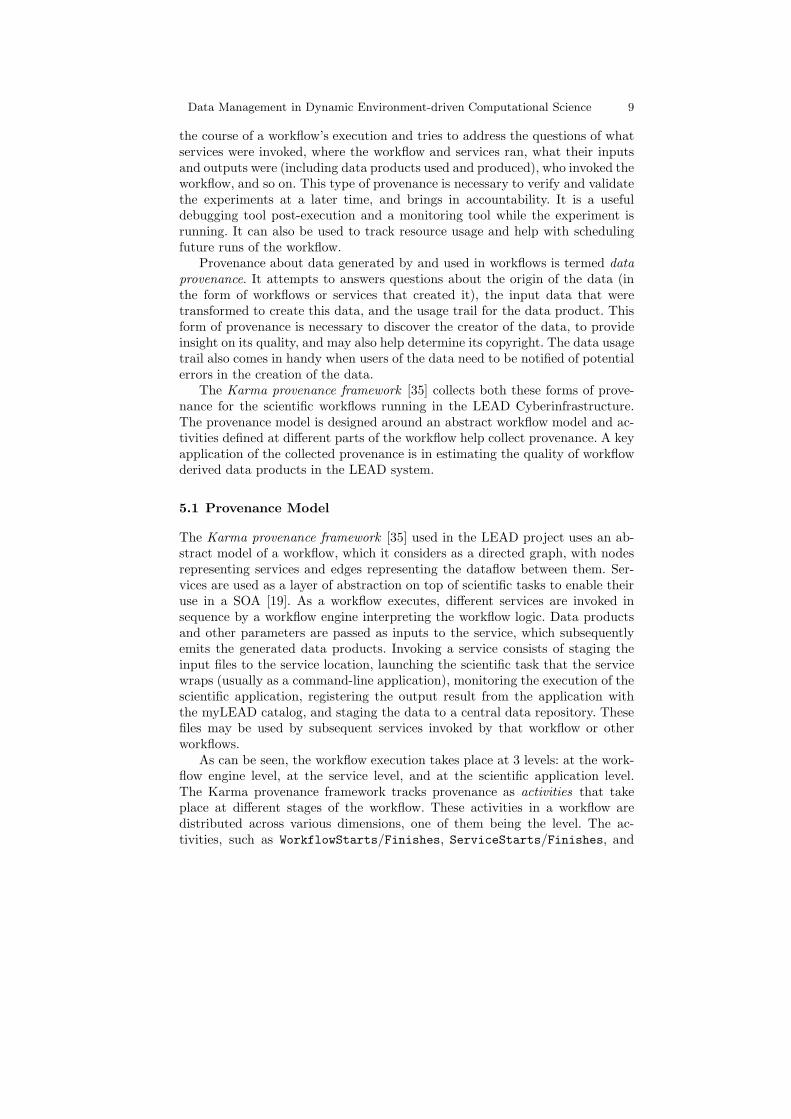
Fig. 5. The Karma Provenance Architecture. Workflows executing at the bottompublish provenance activities to a notification broker in the middle. These XML ac-tivities are subscribed to by the Karma provenance service at the top and recordedin a database. The provenance graph is reconstructed just-in-time and disseminatedwhen queried for by clients.
ApplicationStarts/Finishes, take place at the boundaries between differentlevels. In addition, the activities contain a logical timestamp that helps orderthem and tracks the causality of the events. A third parameter present in theactivity is the host where the event took place, which captures the distributednature of the execution across organizational boundaries. Finally, two activi-ties, DataProduced/Consumed, generated by the applications, help to track thedataflow between the applications.
Based on these activities generated by the various components of the work-flow, a dynamic model of the workflow execution and the dataflow betweenthe services can be constructed at workflow runtime. These activities are col-lected by the central provenance service, and used to build the workflow anddata provenance graphs, and query upon them. Figure 5 shows the architectureof Karma. As the workflow executes at the bottom, its components produceactivities, represented as XML notifications published to a pub-sub notifica-tion system [17]. The Karma provenance service subscribes to these activitiesand records them in a relational database. When a client queries the Karmaservice for workflow or data provenance through its web-service interface, theactivities are reconstructed and composed together to form the workflow ordataflow graph, and returned to the client as an XML provenance document.Client libraries and the Application Service Toolkit [19] automate and ease theuser’s burden of generating these activities. Empirical performance measureshave shown the overhead for collecting provenance activities to be under 1% ofthe application run time [36].
5.2 Provenance and Data Quality
One novel use that provenance is being applied to in LEAD is in predicting thequality of data products generated from the workflows. It is intuitive that theway a data is created has a bearing on its quality. Since provenance describes the
Data Management in Dynamic Environment-driven Computational Science 11
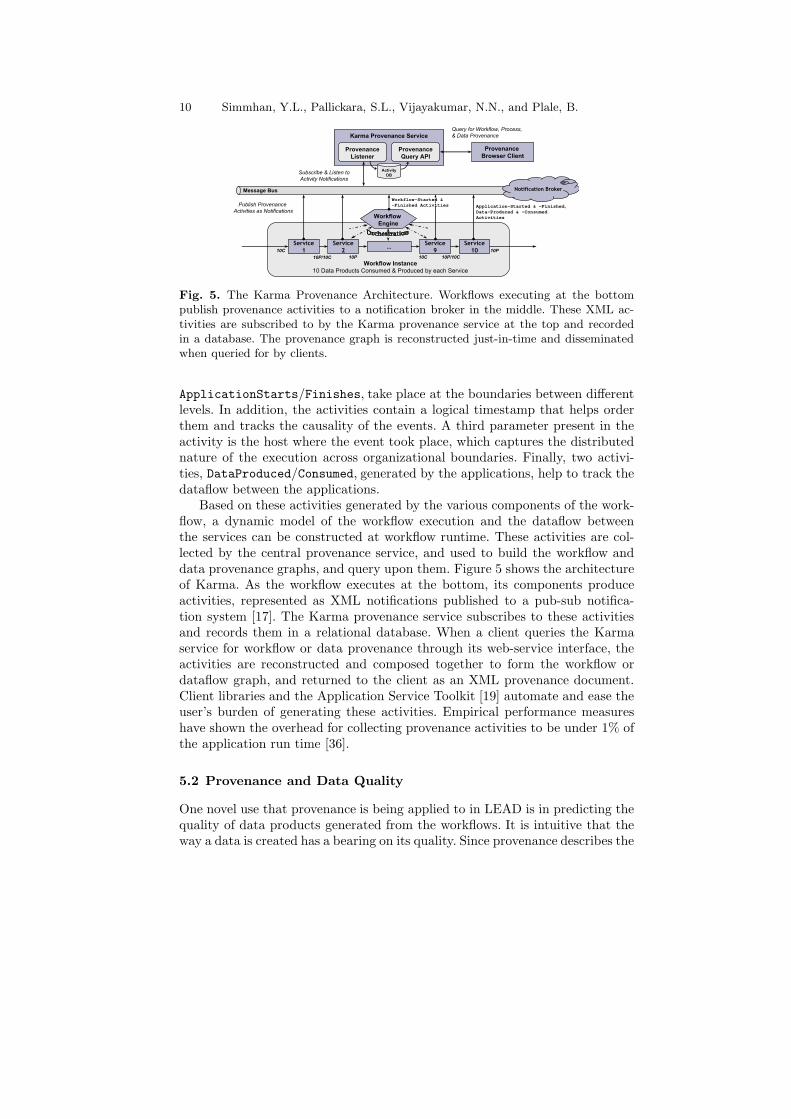
Fig. 6. Model to evaluate quality score of data product using various metrics appliedto metadata attributes based on user-defined quality constraints. At the bottom arethe attributes that affect the data’s quality, and they are aggregated, using variousmetrics and user-defined constraints, to the overall quality score for the data at thetop.
derivation history of data created by a workflow, it can be leveraged to estimatethe data quality. Provenance forms a key attribute in the generic quality model[37] being used to quantify the quality of data products in LEAD. Such aquantification is necessary to allow comparison of data products when a user istrying to locate data for input to a workflow or for visualization and analysis.Typical search techniques for scientific data depend on the user to providevalues for attributes that are then matched. These usually end up being toobroad resulting in a large number results with little to distinguish betweenthem. Our quality model brings in not just the intrinsic metadata available forthe data product, but also hidden (or indirect) metadata such as the quality ofservice of accessing the data product, the community’s perception of the data,and data provenance.
Recognizing that quality is a very subjective matter, our quality model al-lows the users to define quality constraints on the intrinsic and hidden attributesof data products at a fine granularity [37]. The constraints are rules that definethe relative importance of each attribute, which can then be evaluated for eachmatching data product and aggregated into a numerical quality score for thedata product. This score then forms the basis for filtering query results andpresenting only the most relevant data products in a sorted order to the user.
The quality model [37] used to evaluate the user’s quality constraint isshown in Figure 6. Starting at the bottom, we have various intrinsic meta-data attributes and indirect attributes available for a data product, includingthe provenance, represented as process metadata and input parameters. Basedon the type of the attribute, different techniques are used to measured andconverted them into a numerical estimate. For example, provenance is used toconstruct a quality model for the process deriving that data, and this modelis used to generate a provenance quality score for the data. Quality metricsmodeled as weighting functions are applied to the quality scores for attributes,guided by the user’s constraints. These result in an aggregate quality scores for
12 Simmhan, Y.L., Pallickara, S.L., Vijayakumar, N.N., and Plale, B.
GDS
GDS
GDS
service factory
rowset service
handlers
for incoming
channels
query
one per event typeruntime
container
query
query
rowset request
response chunkquery
execution
engine
continuous querydynamic deployment
querycontinuous
service
query
planner
data sources
point of presence
− ring buffers hold results
channels,
Pub−sub System
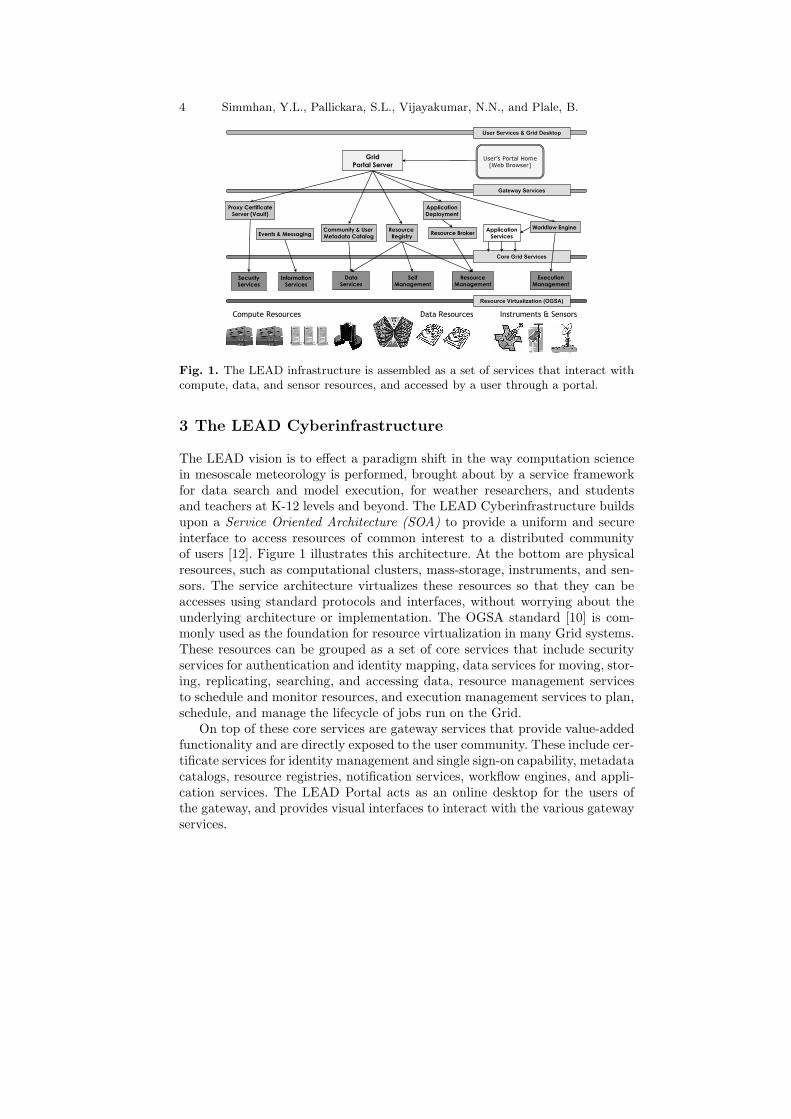
Calder System
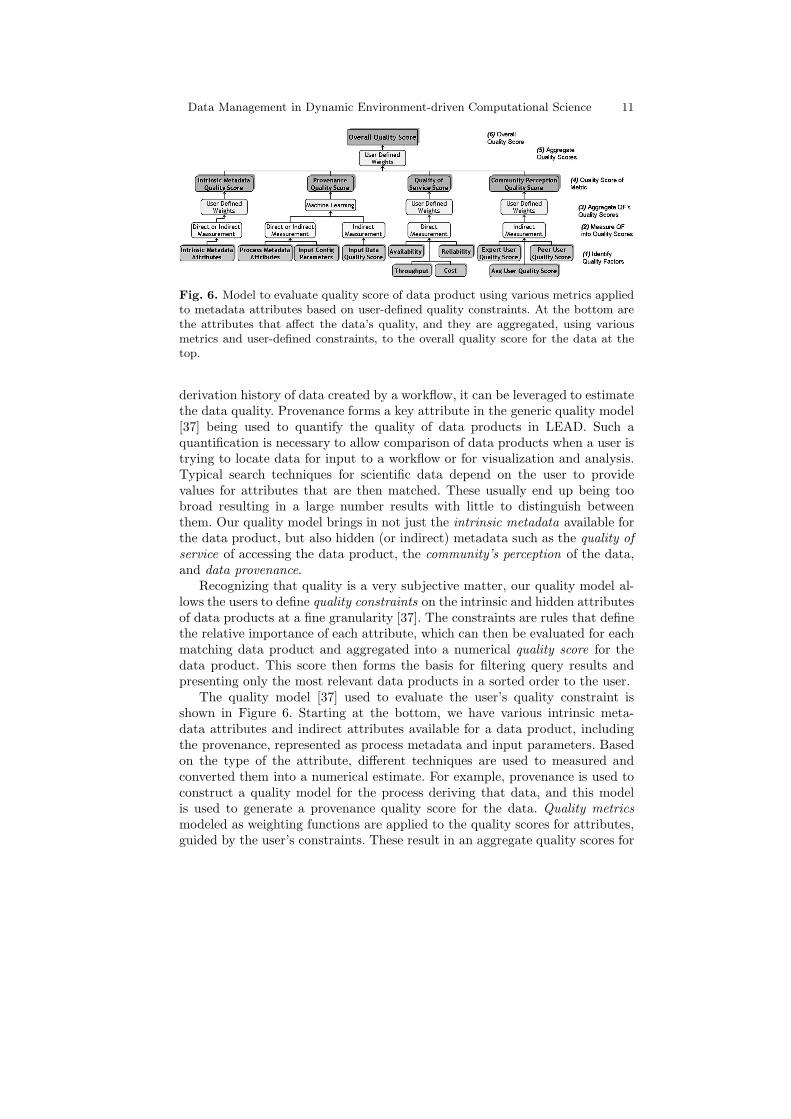
Fig. 7. Calder Architecture.
each metric, that are further combined into a single overall quality score for thedata product. This score can then be used to rank the data product and helpin the data search process.
6 Calder: Stream Mining of Environmental Data
In LEAD, the forecasting application is a special kind of data driven applica-tion that is triggered when an abnormal weather event is detected. Dynamicexecution of forecast models is specified using a rule-action paradigm. A rule,defined by a user and run for a specific period of time, is a combination of filter-ing tasks and data mining actions triggered by the occurrence of certain events.The action portion of the rule-action paradigm is an invocation that kicks offa latent forecast model. Continuous data mining is performed in LEAD usingthe Calder system. A brief description of the dynamic adaptation scenario inLEAD is provided in [43].
Calder [41, 25] is a web-service that performs continuous query executionover real time streams of observational data (Figure 7). The query submis-sion, modeled on OGSA-DAI [2], is through a data service that implementsan extended realization of the GGF DAIS specification to stream systems [24].Queries are expressed as event-action SQL queries deployed into the system dy-namically at runtime with an associated lifetime. Calder is responsive to asyn-chronous stream rates and has sophisticated event scheduling mechanisms thatimprove the service time compared to conventional stream processing [27]. TheCalder system contains a distributed query service and a stream provenance ser-vice. The distributed query planner optimizes the queries and distributes themamong computational resources using a cost-efficient model [23]. The prove-nance service uses different models [42] to track the provenance of streams andqueries in the system.
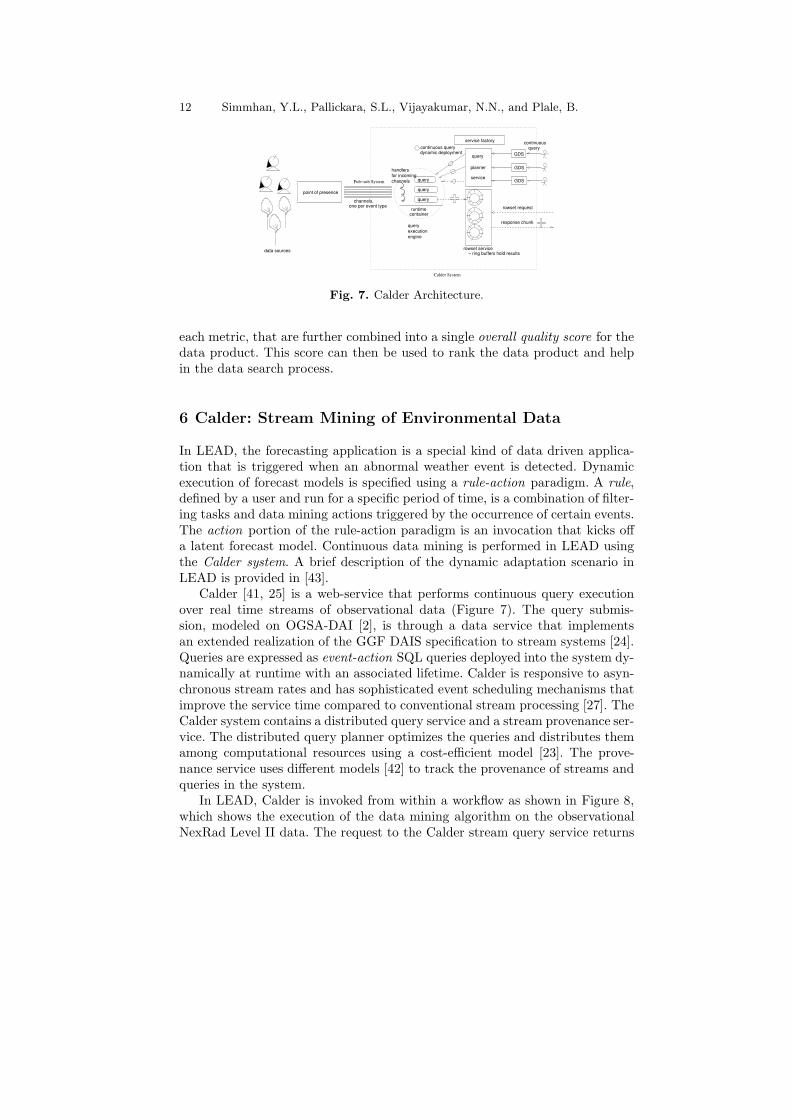
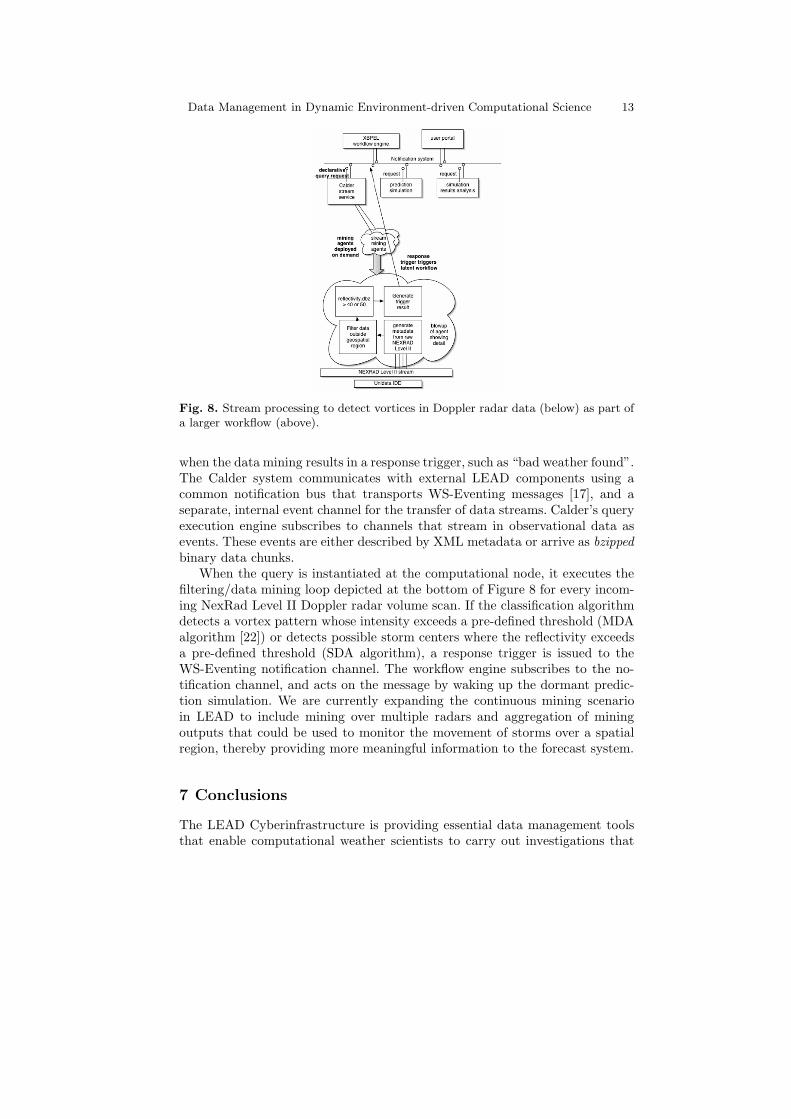
In LEAD, Calder is invoked from within a workflow as shown in Figure 8,which shows the execution of the data mining algorithm on the observationalNexRad Level II data. The request to the Calder stream query service returns
Data Management in Dynamic Environment-driven Computational Science 13
Fig. 8. Stream processing to detect vortices in Doppler radar data (below) as part ofa larger workflow (above).
when the data mining results in a response trigger, such as “bad weather found”.The Calder system communicates with external LEAD components using acommon notification bus that transports WS-Eventing messages [17], and aseparate, internal event channel for the transfer of data streams. Calder’s queryexecution engine subscribes to channels that stream in observational data asevents. These events are either described by XML metadata or arrive as bzippedbinary data chunks.
When the query is instantiated at the computational node, it executes thefiltering/data mining loop depicted at the bottom of Figure 8 for every incom-ing NexRad Level II Doppler radar volume scan. If the classification algorithmdetects a vortex pattern whose intensity exceeds a pre-defined threshold (MDAalgorithm [22]) or detects possible storm centers where the reflectivity exceedsa pre-defined threshold (SDA algorithm), a response trigger is issued to theWS-Eventing notification channel. The workflow engine subscribes to the no-tification channel, and acts on the message by waking up the dormant predic-tion simulation. We are currently expanding the continuous mining scenarioin LEAD to include mining over multiple radars and aggregation of miningoutputs that could be used to monitor the movement of storms over a spatialregion, thereby providing more meaningful information to the forecast system.
7 Conclusions
The LEAD Cyberinfrastructure is providing essential data management toolsthat enable computational weather scientists to carry out investigations that
14 Simmhan, Y.L., Pallickara, S.L., Vijayakumar, N.N., and Plale, B.
are dynamically adaptive to weather. These tools, described in this article, al-low scientists to manage experimental data in a grid-embedded workspace byautomatically cataloging all pieces in the e-Science experiment; precisely trackthe execution of the workflow and creation of the data products as provenanceto help scientists verify their results at a later time and to help the commu-nity in evaluating and reusing the data through quality metrics; and in miningobservational weather data in real time to automatically respond to weatherevents by configuring and running computational models, the results of whichcould potentially save lives.
LEAD has a major commitment to providing facilities to educational users.The same tools being developed for weather researchers can also be configuredfor students and teachers to run simple weather forecasting models through theLEAD portal as part of class assignments. Glossaries and ontological dictio-naries are being developed to assist beginners in learning key concepts aboutweather, and techniques such as community quality perception indices used bythe quality model can possibly serve as means for knowledge transfer betweenresearchers and students.
The data management tools developed for LEAD are also being appliedto other data driven computational science domains with similar dynamic andadaptive properties. Our contributions, highlighted in this article, make it easierfor the scientist to locate, understand, and use their data, allowing them toadvance the frontiers of science more rapidly.
8 Acknowledgments
The authors would like to thank our collaborators in the LEAD project, no-tably Dennis Gannon, Kelvin Droegemeier, Dan Reed, Mohan Ramamurthy,Bob Wilhelmson, Sara Graves, and Rich Clark; students who contributed tothis work, Scott Jensen, Ying Liu, and Yiming Sun; and the National ScienceFoundation (ATM-0331480, CDA-0116050, EIA-0202048) and the Departmentof Energy (DE-FG02-04ER25600) whose grants enabled this work.
References
1. Tony Andrews, Francisco Curbera, Hitesh Dholakia, Yaron Goland, JohannesKlein, Frank Leymann, Kevin Liu, Dieter Roller, Doug Smith, Satish Thatte,Ivana Trickovic, and Sanjiva Weerawarana. Business Process Execution Language
for Web Services Version 1.1. BEA Systems and International Business MachinesCorporation andMicrosoft Corporation and SAP AG and Siebel Systems, 2003.
2. Mario Antonioletti, Malcolm Atkinson, Rob Baxter, Andrew Borley, Neil P. ChueHong, Brian Collins, Neil Hardman, Alastair C. Hume, Alan Knox, Mike Jackson,Amy Krause, Simon Laws, James Magowan, Norman W. Paton, Dave Pearson,Tom Sugden, Paul Watson, and Martin Westhead. The design and implemen-tation of grid database services in ogsa-dai: Research articles. Concurrency and
Computation: Practice and Experience, 17(2-4):357–376, 2005.
Data Management in Dynamic Environment-driven Computational Science 15
3. Rob Armstrong, Dennis Gannon, Al Geist, Katarzyna Keahey, Scott Kohn, LoisMcInnes, Steve Parker, and Brent Smolinski. Toward a common component ar-chitecture for high-performance scientific computing. In High Performance Dis-
tributed Computing Conference, 1999.4. Gordon Bell, Jim Gray, and Alex Szalay. Petascale computational systems. Com-
puter, 39(1):110–112, 2006.5. Rajendra Bose and James Frew. Lineage Retrieval for Scientific Data Processing:
A Survey. ACM Computing Surveys, 37(1):1–28, 2005.6. Charlie Catlett. The TeraGrid: A Primer. TeraGrid, 2002.7. Ann Chervenak, Robert Schuler, Carl Kesselman, Scott Koranda, and Brian Moe.
Wide area data replication for scientific collaborations. In Workshop on Grid
Computing, 2005.8. Ben Domenico, John Caron, Ethan Davis, Robb Kambic, and Stefano Nativi. The-
matic real-time environmental distributed data services (thredds): Incorporatinginteractive analysis tools into nsdl. Digital Information, 2(4), 2002.
9. Kelvin K. Droegemeier, Dennis Gannon, Daniel Reed, Beth Plale, Jay Alameda,Tom Baltzer, Keith Brewster, Richard Clark, Ben Domenico, Sara Graves, Ev-erette Joseph, Donald Murray, Rahul Ramachandran, Mohan Ramamurthy, La-vanya Ramakrishnan, John A. Rushing, Daniel Weber, Robert Wilhelmson, AnneWilson, Ming Xue, and Sepideh Yalda. Service-oriented environments for dynam-ically interacting with mesoscale weather. Computing in Science and Engineering,7(6):12–29, 2005.
10. Ian Foster, Hiro Kishimoto, Andreas Savva, Dave Berry, Andrew Grimshaw, BillHorn, Fred Maciel, Frank Siebenlist, Ravi Subramaniam, Jem Treadwell, andJeffrin Von Reich. The Open Grid Services Architecture, Version 1.5. GlobalGrid Forum, 2006.
11. Dennis Gannon, Jay Alameda, Octav Chipara, Marcus Christie, Vinayak Dukle,Liang Fang, Matthew Farellee, Geoffrey Fox, Shawn Hampton, Gopi Kandaswamy,Deepti Kodeboyina, Charlie Moad, Marlon Pierce, Beth Plale, Albert Rossi, Yo-gesh Simmhan, Anuraag Sarangi, Aleksander Slominski, Satoshi Shirasauna, andThomas Thomas. Building grid portal applications from a web-service componentarchitecture. Proceedings of the IEEE, 93(3):551–563, 2005.
12. Dennis Gannon, Beth Plale, Marcus Christie, Liang Fang, Yi Huang, Scott Jensen,Gopi Kandaswamy, Suresh Marru, Sangmi Lee Pallickara, Satoshi Shirasuna, Yo-gesh Simmhan, Aleksander Slominski, and Yiming Sun. Service oriented archi-tectures for science gateways on grid systems. In International Conference on
Service Oriented Computing, 2005.13. Dennis Gannon, Beth Plale, Suresh Marru, Gopi Kandaswamy, Yogesh Simmhan,
and Satoshi Shirasuna. Workflows for eScience: Scientific Workflows for Grids,chapter Dynamic, Adaptive Workflows for Mesoscale Meteorology. Springer-Verlag, 2006.
14. Carole Goble, Chris Wroe, Robert Stevens, and the myGrid consortium. The my-grid project: services, architecture and demonstrator. In UK e-Science programme
All Hands Meeting, 2003.15. N. Halbwachs, P. Caspi, P. Raymond, and D. Pilaud. The synchronous data-
flow programming language LUSTRE. Proceedings of the IEEE, 79(9):1305–1320,1991.
16. Elias N. Houstis, John R. Rice, Efstratios Gallopoulos, and Randall Bramley, edi-tors. Enabling Technologies for Computational Science: Frameworks, Middleware
and Environments, chapter 1, pages 7–17. Kluwer Academic, 2000.
16 Simmhan, Y.L., Pallickara, S.L., Vijayakumar, N.N., and Plale, B.
17. Yi Huang, Alek Slominski, Chatura Herath, and Dennis Gannon. WS-Messenger:A Web Services based Messaging System for Service-Oriented Grid Computing.In Cluster Computing and Grid Conference, 2006.
18. Scott Jensen, Beth Plale, Sangmi Lee Pallickara, and Yiming Sun. A hybridxml-relational grid metadata catalog. In International Conference Workshops on
Parallel Processing, 2006.19. Gopi Kandaswamy, Liang Fang, Yi Huang, Satoshi Shirasuna, Suresh Marru, and
Dennis Gannon. Building Web Services for Scientific Grid Applications. IBM
Journal of Research and Development, 50(2/3):249–260, 2006.20. Richard A. Kerr. Storm-in-a-box forecasting. Science, 304(5673):946–468, 2004.21. Sriram Krishnan, Randall Bramley, Dennis Gannon, Rachana Ananthakrish-
nan, Madhusudhan Govindaraju, Aleksander Slominski, Yogesh Simmhan, JayAlameda, Richard Alkire, Timothy Drews, and Eric Webb. The xcat scienceportal. Journal of Scientific Programming, 10(4):303–317, 2002.
22. Xiang Li, Rahul Ramachandran, John Rushing, Sara Graves, Kevin Kelleher,S. Lakshmivarahan, Douglas Kennedy, and Jason Levit. Mining nexrad radardata: An investigative study. In Interactive Information and Processing Systems.American Meteorological Society, 2004.
23. Ying Liu and Beth Plale. Query optimization for distributed data streams. InSoftware Engineering and Data Engineering Conference, 2006.
24. Ying Liu, Beth Plale, and Nithya Vijayakumar. Realization of ggf dais dataservice interface for grid access to data streams. Technical Report 613, IndianaUniversity, Computer Science Department, 2005.
25. Ying Liu, Nithya N. Vijayakumar, and Beth Plale. Stream processing in data-driven computational science. In Grid Conference, 2006.
26. Acopia Networks. File virtualization with the acopia arx. Technical report, AcopiaNetworks, 2005.
27. Beth Plale. Leveraging run time knowledge about event rates to improve memoryutilization in wide area data stream filtering. In High Performance Distributed
Computing Conference, 2002.28. Beth Plale. Usage study for data storage repository in lead. Technical Report
001, LEAD, 2005.29. Beth Plale, Dennis Gannon, Yi Huang, Gopi Kandaswamy, Sangmi Lee Pallickara,
and Aleksander Slominski. Cooperating services for data-driven computationalexperimentation. Computing in Science and Engineering, 07(5):34–43, 2005.
30. Beth Plale, Rahul Ramachandran, and Steve Tanner. Data management supportfor adaptive analysis and prediction of the atmosphere in lead. In Conference on
Interactive Information Processing Systems for Meteorology, Oceanography, and
Hydrology, 2006.31. Arcot Rajasekar, Michael Wan, and Reagan Moore. Mysrb & srb: Components
of a data grid. In High Performance Distributed Computing Conference, 2002.32. Kurt Riesselmann. 600 US scientists + 3500 scientists from other countries = The
New High-Energy Frontier. Symmetry, 2(3):18–21, 2005.33. Satoshi Shirasuna and Dennis Gannon. Xbaya: A graphical workflow composer
for the web services architecture. Technical Report 004, LEAD, 2006.34. Yogesh Simmhan, Beth Plale, and Dennis Gannon. A survey of data provenance
in e-science. SIGMOD Record, 34(3):31–36, 2005.35. Yogesh L. Simmhan, Beth Plale, and Dennis Gannon. A Framework for Collecting
Provenance in Data-Centric Scientific Workflows. In International Conference on
Web Services, 2006.
Data Management in Dynamic Environment-driven Computational Science 17
36. Yogesh L. Simmhan, Beth Plale, and Dennis Gannon. Performance evaluation ofthe karma provenance framework for scientific workflows. LNCS, 4145, 2006.
37. Yogesh L. Simmhan, Beth Plale, and Dennis Gannon. Towards a Quality Modelfor Effective Data Selection in Collaboratories. In IEEE Workshop on Scientific
Workflows and Dataflows, 2006.38. Gurmeet Singh, Shishir Bharathi, Ann Chervenak, Ewa Deelman, Carl Kesselman,
Mary Manohar, Sonal Patil, and Laura Pearlman. A metadata catalog service fordata intensive applications. In ACM Supercomputing Conference, 2003.
39. Alek Slominski. Workflows for e-Science, chapter Adapting BPEL to ScientificWorkflows. Springer-Verlag, 2006. In Press.
40. Dennis E. Stevenson. Science, computational science, and computer science: at acrossroads. In Conference on Computer Science. ACM Press, 1993.
41. Nithya N. Vijayakumar, Ying Liu, and Beth Plale. Calder query grid service:Insights and experimental evaluation. In Cluster Computing and Grid Conference,2006.
42. Nithya N. Vijayakumar and Beth Plale. Towards low overhead provenance track-ing in near real-time stream filtering. LNCS, 4145, 2006.
43. Nithya N. Vijayakumar, Beth Plale, Rahul Ramachandran, and Xiang Li. Dy-namic filtering and mining triggers in mesoscale meteorology forecasting. In In-
ternational Geoscience and Remote Sensing Symposium, 2006.