Embed Size (px)
Citation preview
Data representation techniques for adaptation
Alexandra I. CristeaUSI intensive course “Adaptive Systems” April-May 2003
Overview: Data representation
1. Data or knowledge?
2. Subsymbolic vs. symbolic techniques
3. Symbolic representation
4. Example
5. Subsymbolic reprensentation
6. Example
Data or knowledge?
• Data for AS becomes often knowledge– data < information < knowledge
• We divide into:– Symbolic– Sub-symbolic knowledge representation
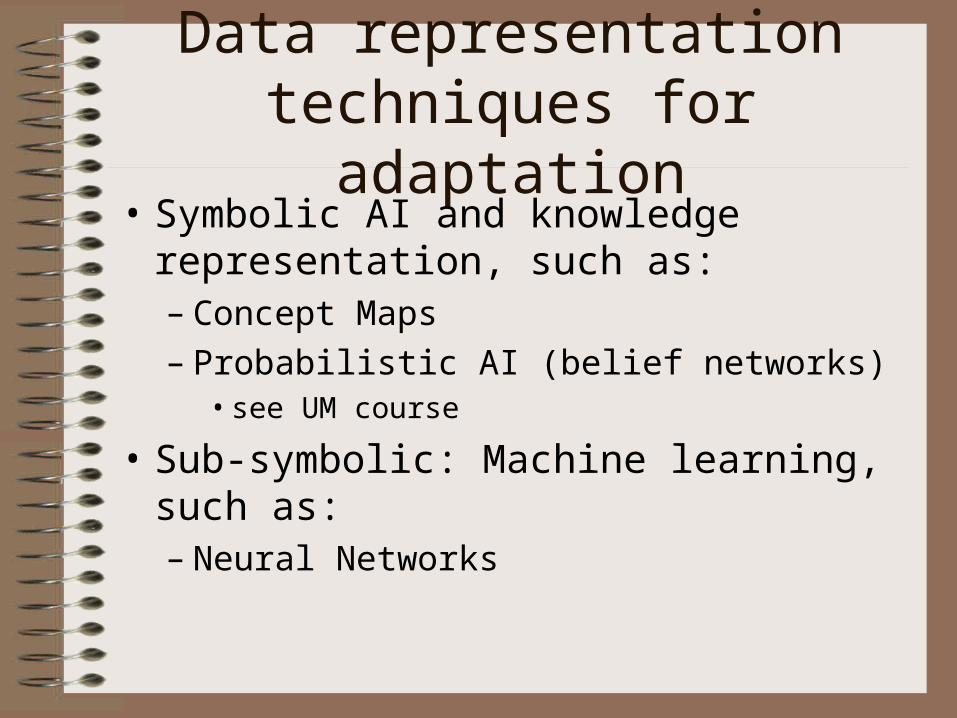
Data representation techniques for adaptation
• Symbolic AI and knowledge representation, such as:– Concept Maps – Probabilistic AI (belief networks)
• see UM course
• Sub-symbolic: Machine learning, such as:– Neural Networks
Symbolic Knowledge Representation
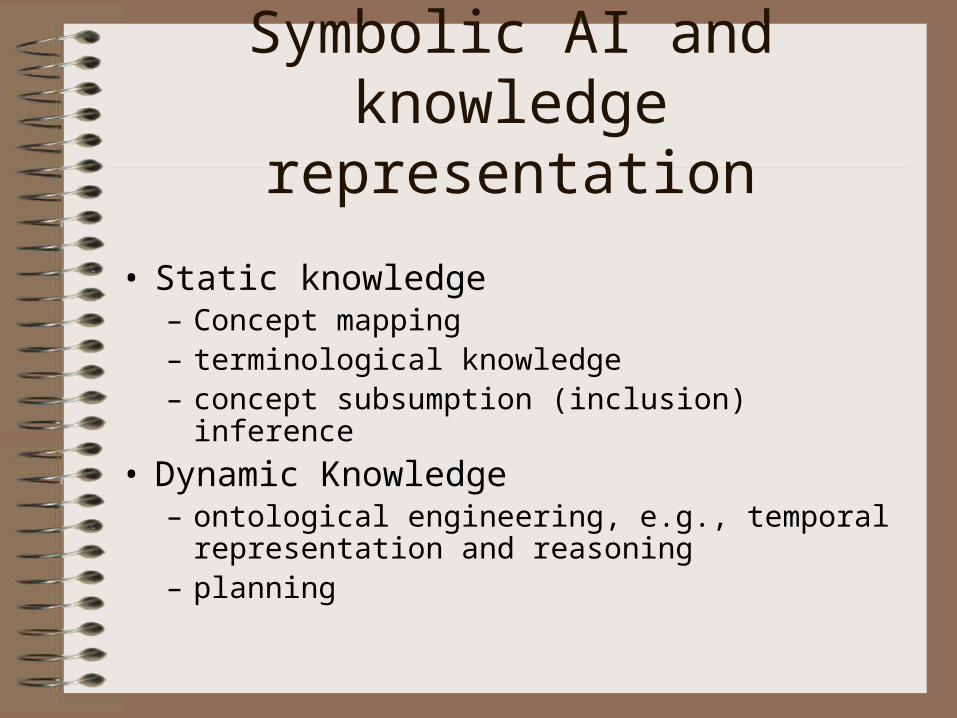
Symbolic AI and knowledge representation
• Static knowledge– Concept mapping– terminological knowledge– concept subsumption (inclusion) inference
• Dynamic Knowledge– ontological engineering, e.g., temporal representation
and reasoning– planning
Concept Maps
Example
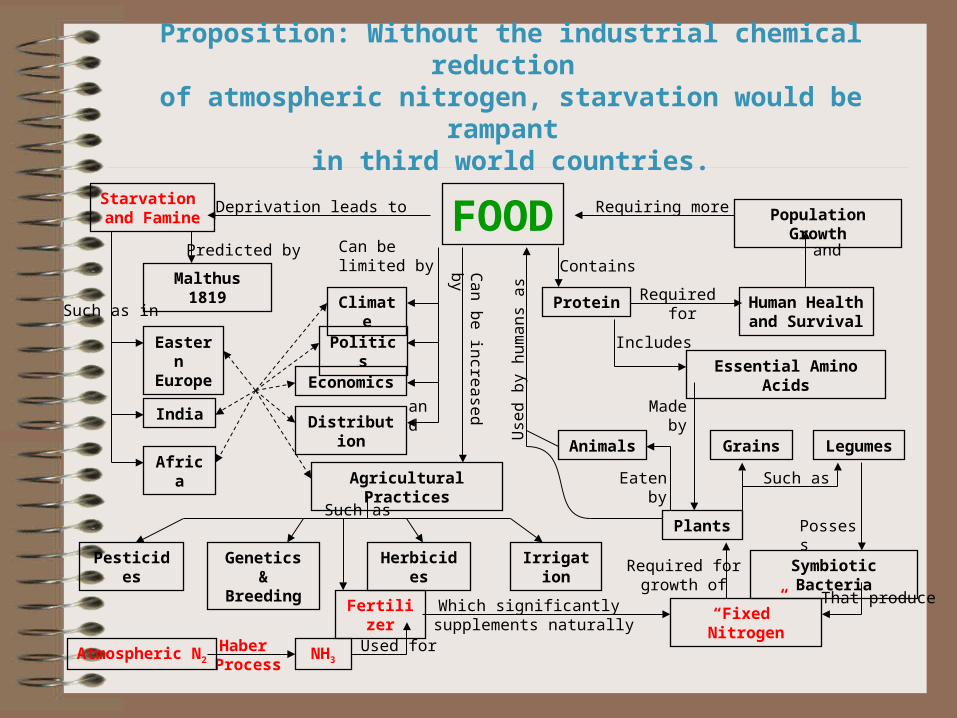
Proposition: Without the industrial chemical reduction
of atmospheric nitrogen, starvation would be rampant
in third world countries.
FOOD
Human Healthand Survival
Contains
Required for
and
Requiring more
Essential Amino Acids
Animals
Used for
Such as
Madeby
Plants
Grains Legumes
Required forgrowth of
Symbiotic Bacteria
“Fixed” Nitrogen
Possess
That produce
Agricultural Practices
Population Growth
Politics
Economics
Distribution
Climate
Starvation and Famine
Malthus 1819
Eastern Europe
India
Africa
Deprivation leads to
Can be limited by
and
Such as in
Pesticides HerbicidesGenetics & Breeding
Irrigation
Fertilizer Which significantly supplements naturally
Such as
Predicted by
Ca
n b
e in
crea
sed
by
NH3Haber
ProcessAtmospheric N2
Protein
Includes
Eatenby
Use
d b
y h
um
an
s a
s
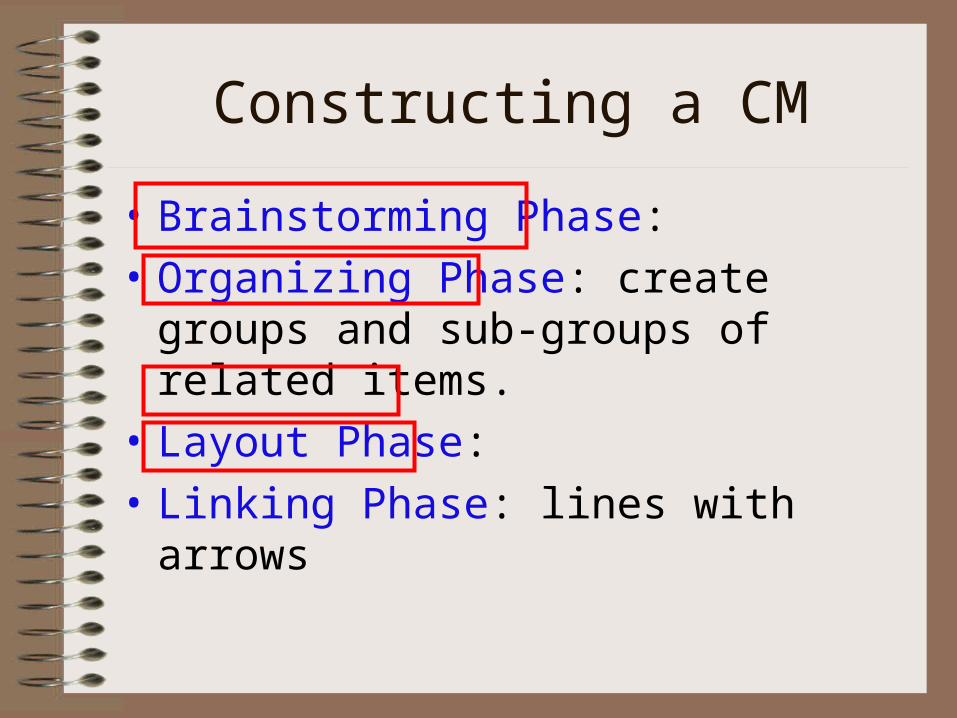
Constructing a CM
• Brainstorming Phase:
• Organizing Phase: create groups and sub-groups of related items.
• Layout Phase:
• Linking Phase: lines with arrows
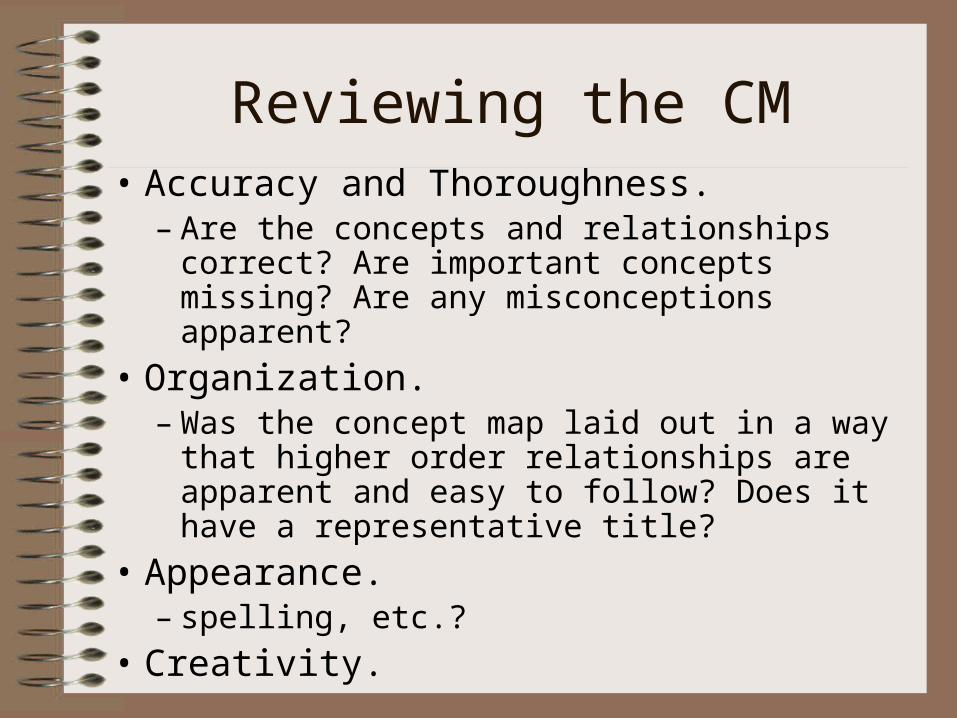
Reviewing the CM• Accuracy and Thoroughness.
– Are the concepts and relationships correct? Are important concepts missing? Are any misconceptions apparent?
• Organization. – Was the concept map laid out in a way that
higher order relationships are apparent and easy to follow? Does it have a representative title?
• Appearance. – spelling, etc.?
• Creativity.
Sub-symbolic knowledge representation
Subsymbolic systems
• human-like information processing:
• learning from examples,
• context sensitivity,
• generalization,
• robustness of behaviour, and
• intuitive reasoning
Some notes on NNExample
Why NN?
• To learn how our brain works (!!)
• High computation rate technology
• Intelligence
• User-friendly-ness
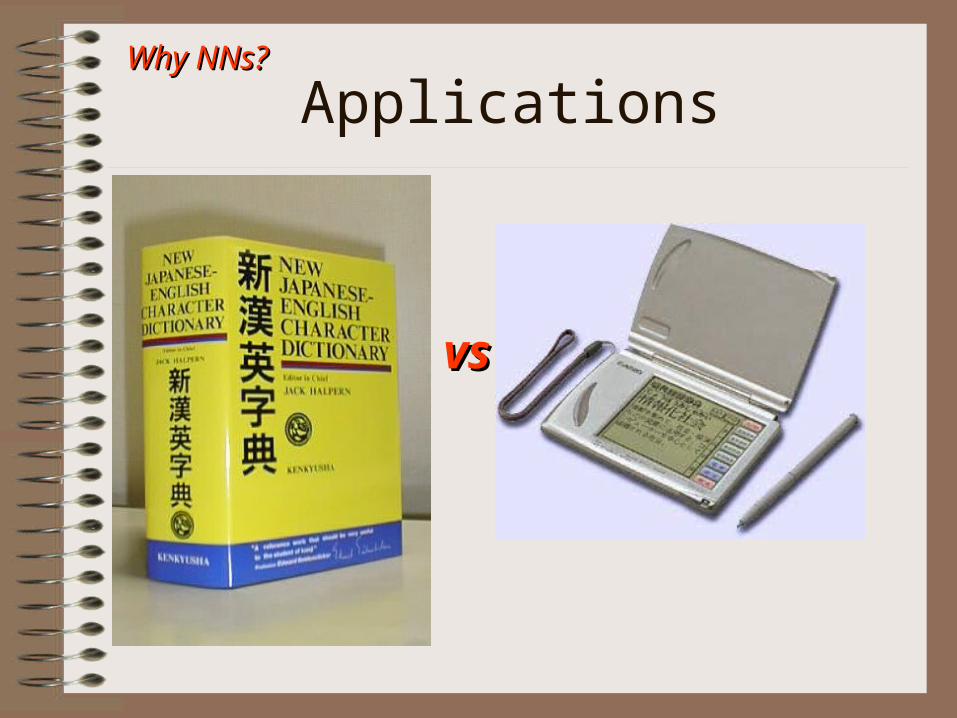
Applications
vsvs
Why NNs?Why NNs?
ApplicationsWhy NNs?Why NNs?
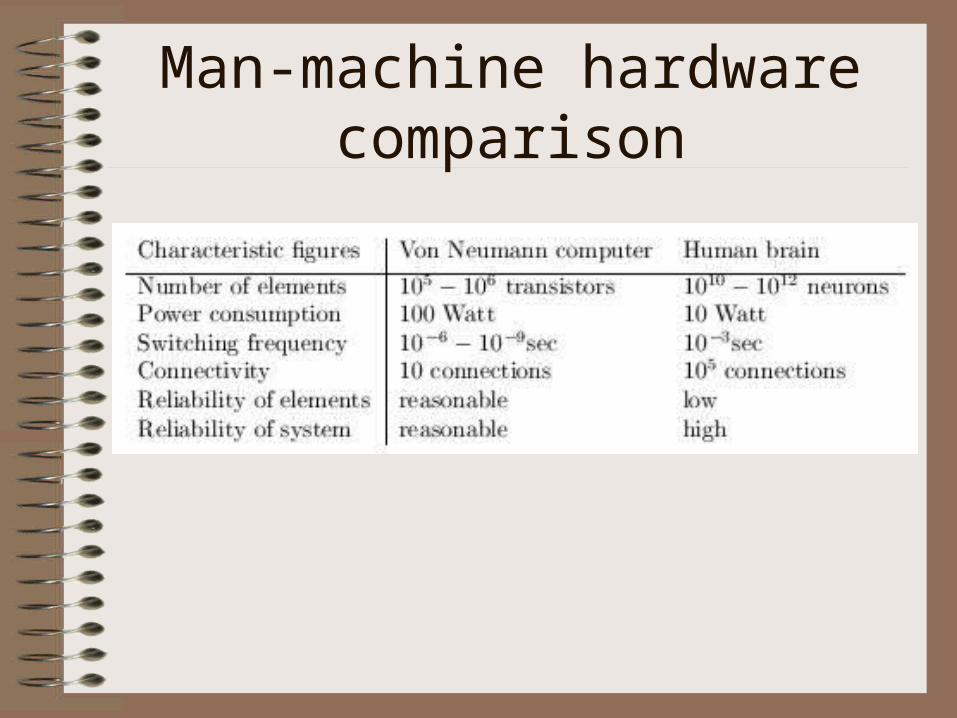
Man-machine hardware comparison
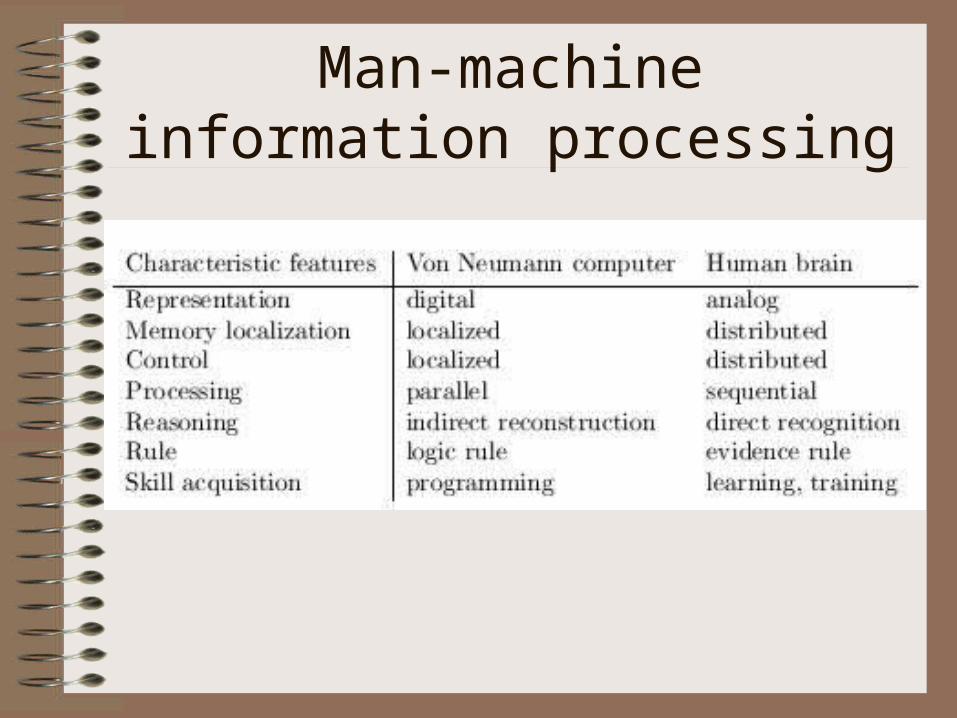
Man-machine information processing
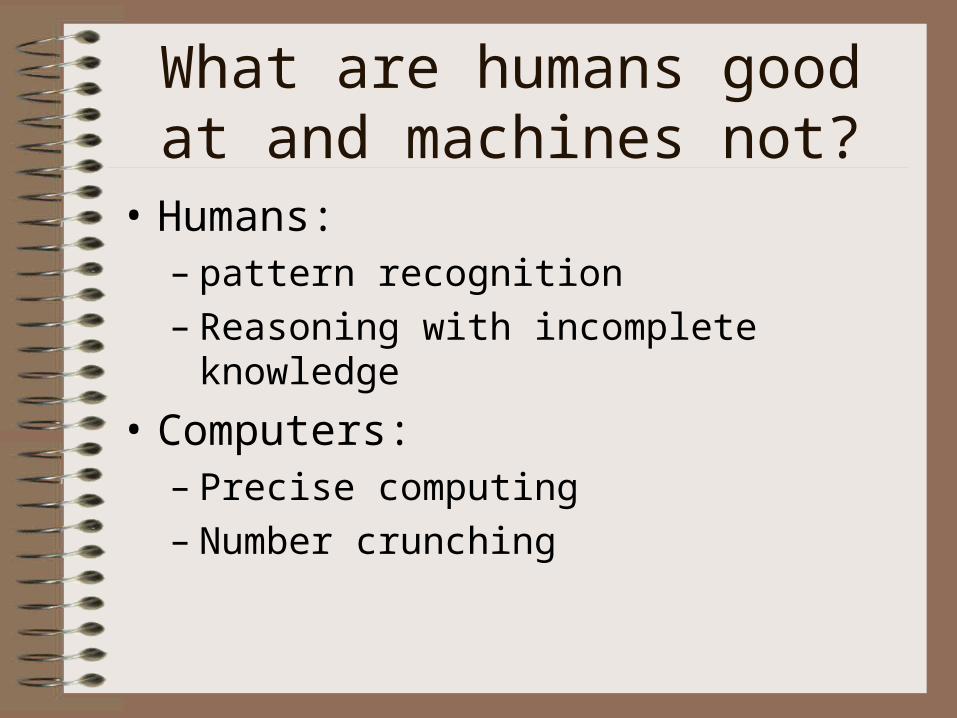
What are humans good at and machines not?
• Humans: – pattern recognition– Reasoning with incomplete knowledge
• Computers:– Precise computing– Number crunching

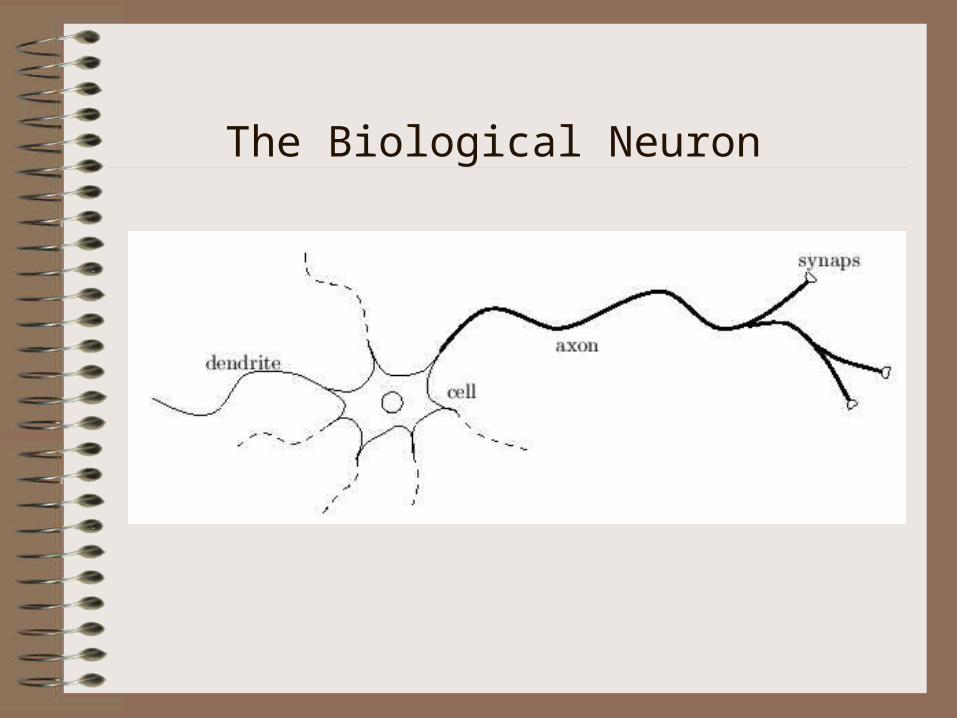
The Biological Neuron
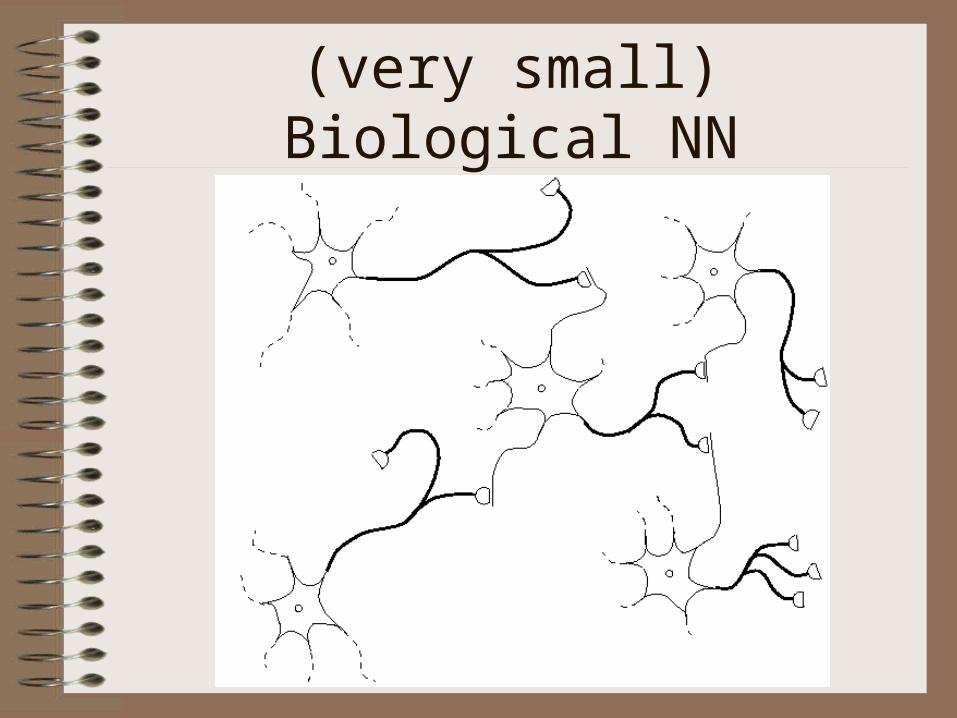
(very small) Biological NN
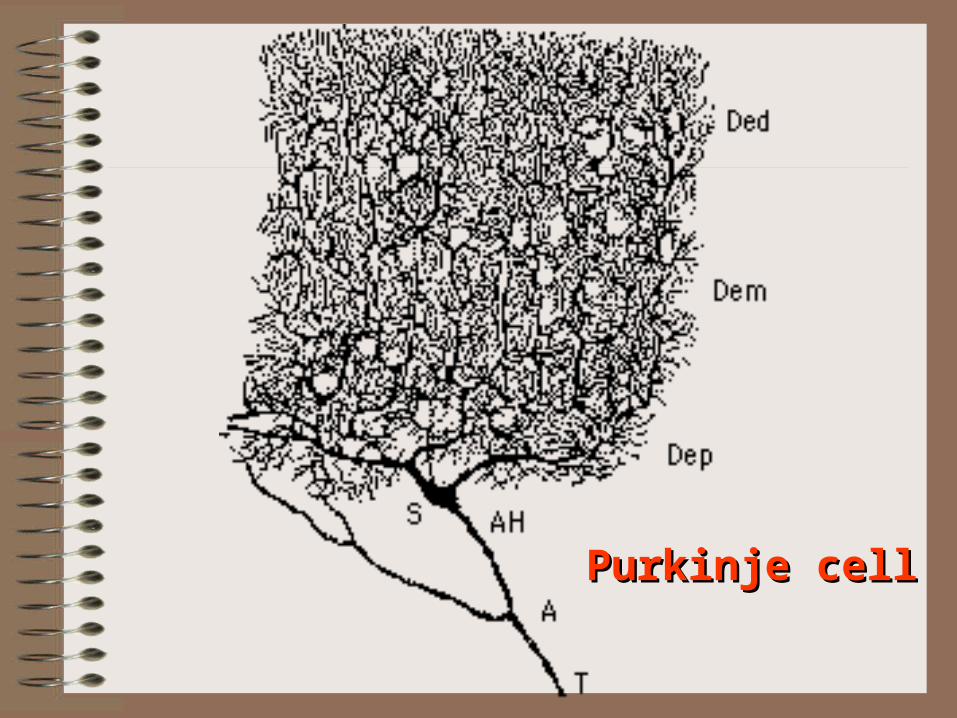
Purkinje cellPurkinje cell
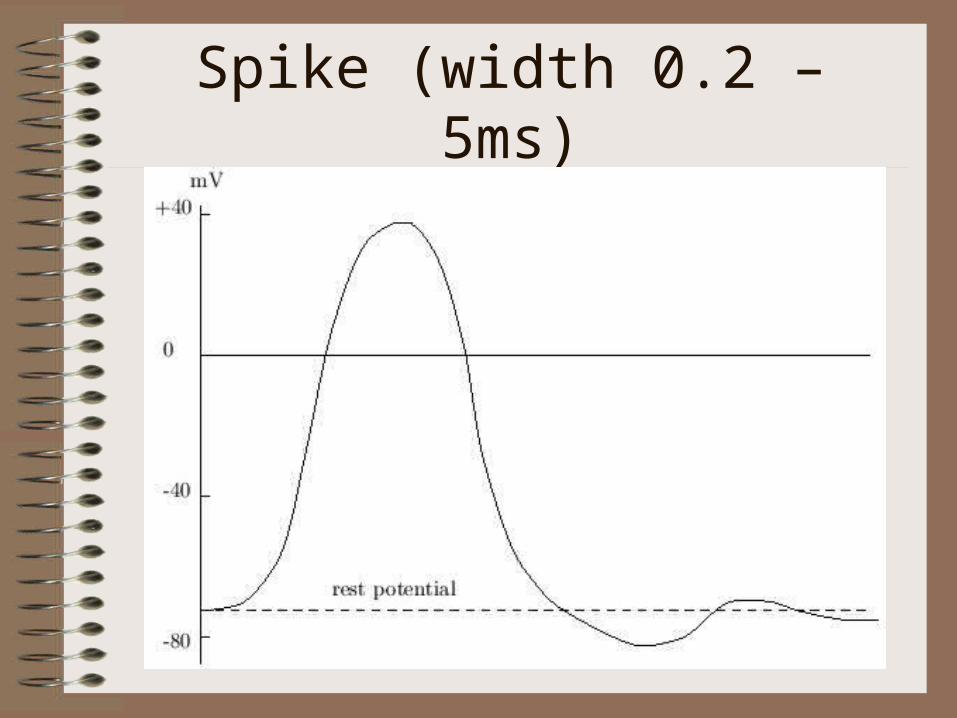
Spike (width 0.2 – 5ms)
Firing
• Resulting signal– Excitatory:
• encourages firing of the next neuron
– Inhibitory:• Discourages firing of the next neuron
What does a neuron do?
• Sums its inputs• Decides if to fire or not with respect to
a threshold• But: limited capacity:
– Neuron cannot fire all the time– Refractory period: 10ms – min time to
fire again– So: max. firing frequency: 100 spikes/
sec
Hebbian learning rule (1949)
• If neuron A repeatedly and persistently contributes to the firing of neuron B, than the connection between A and B will get stronger.
• If neuron A does not contribute to the firing of neuron B for a long period of time, than the connection between A and B becomes weaker.
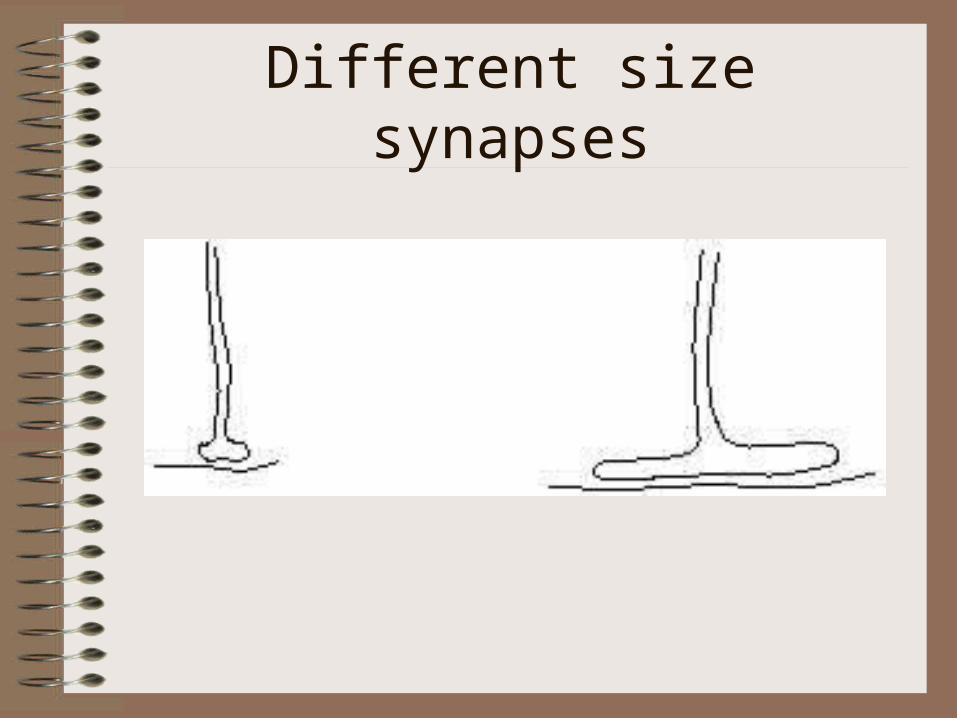
Different size synapses
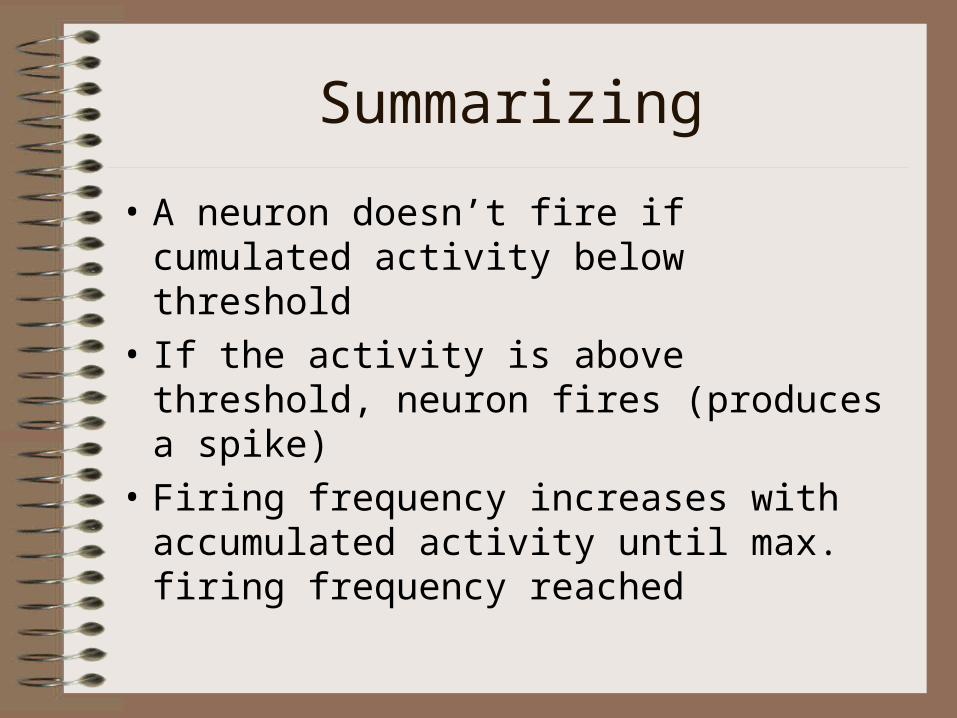
Summarizing
• A neuron doesn’t fire if cumulated activity below threshold
• If the activity is above threshold, neuron fires (produces a spike)
• Firing frequency increases with accumulated activity until max. firing frequency reached
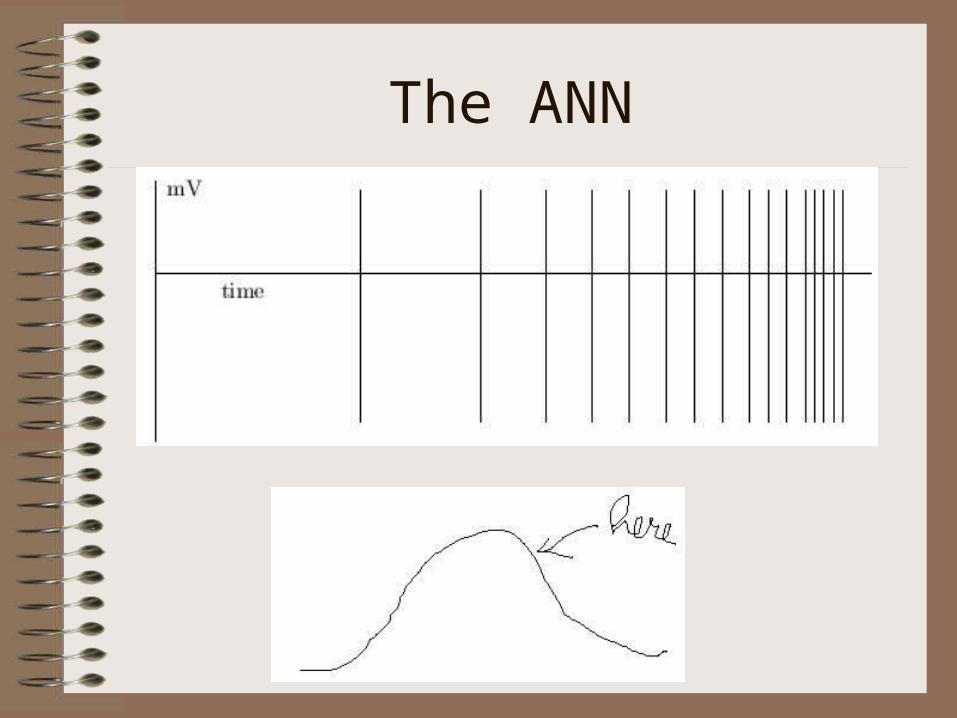
The ANN
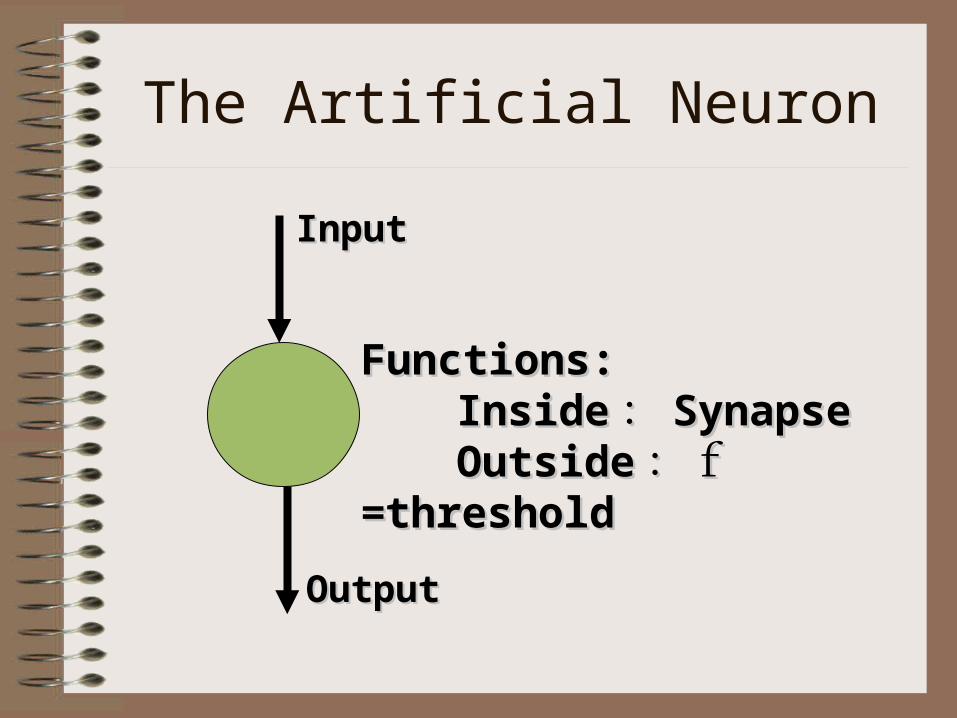
The Artificial Neuron
InputInput
OutputOutput
Functions:Functions: InsideInside :: SynapseSynapseOutsideOutside ::f f
==thresholdthreshold
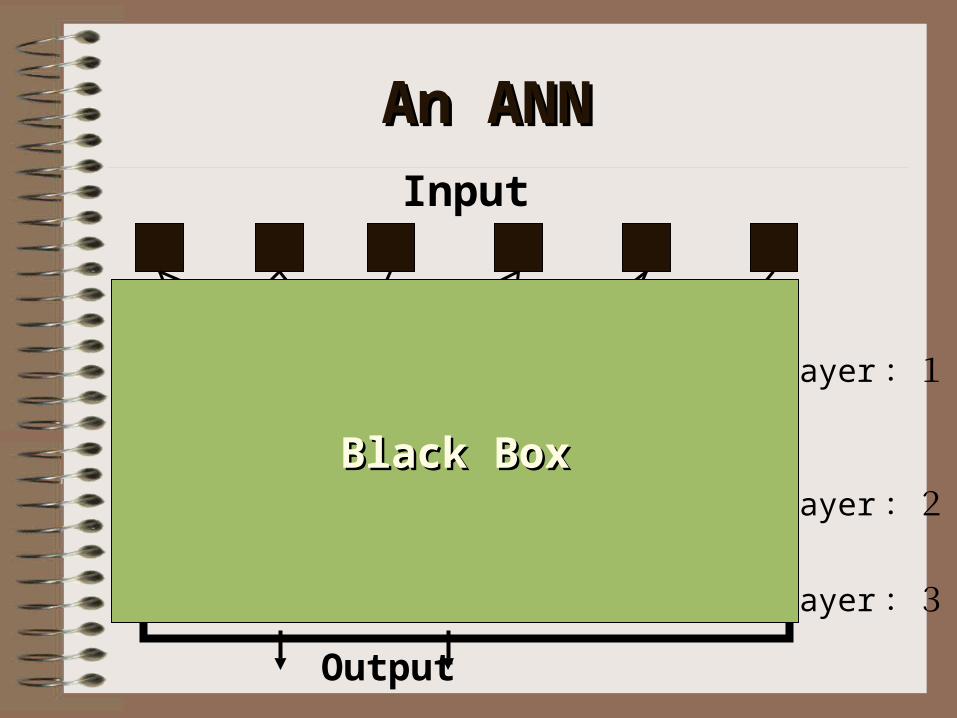
An ANNAn ANN
Input
Output
Layer :1
Layer :2
Layer :3
Black BoxBlack Box

• Let’s look in the Black Box!
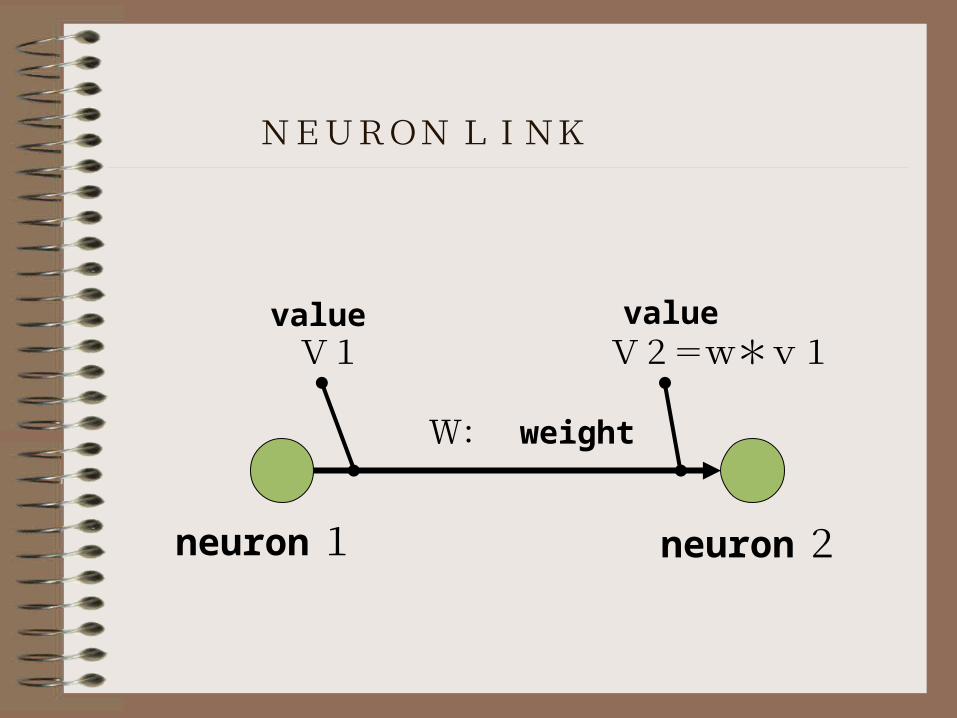
NEURON LINK
W: weight
neuron 1 neuron 2
V1value
V2=w*v1value
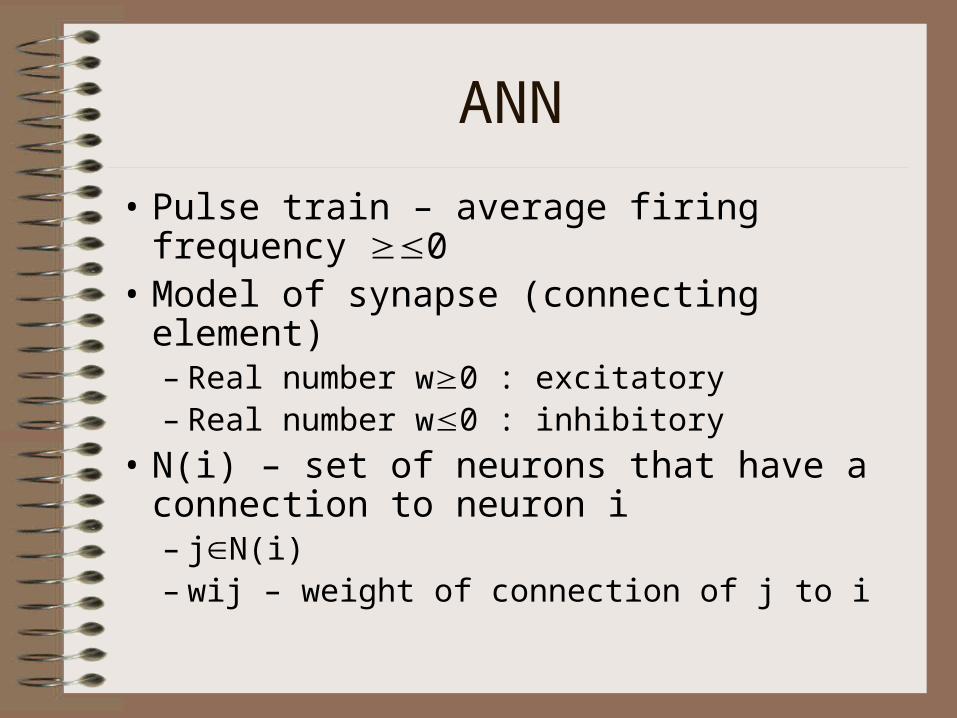
ANN
• Pulse train – average firing frequency 0• Model of synapse (connecting element)
– Real number w0 : excitatory– Real number w0 : inhibitory
• N(i) – set of neurons that have a connection to neuron i– jN(i)– wij – weight of connection of j to i
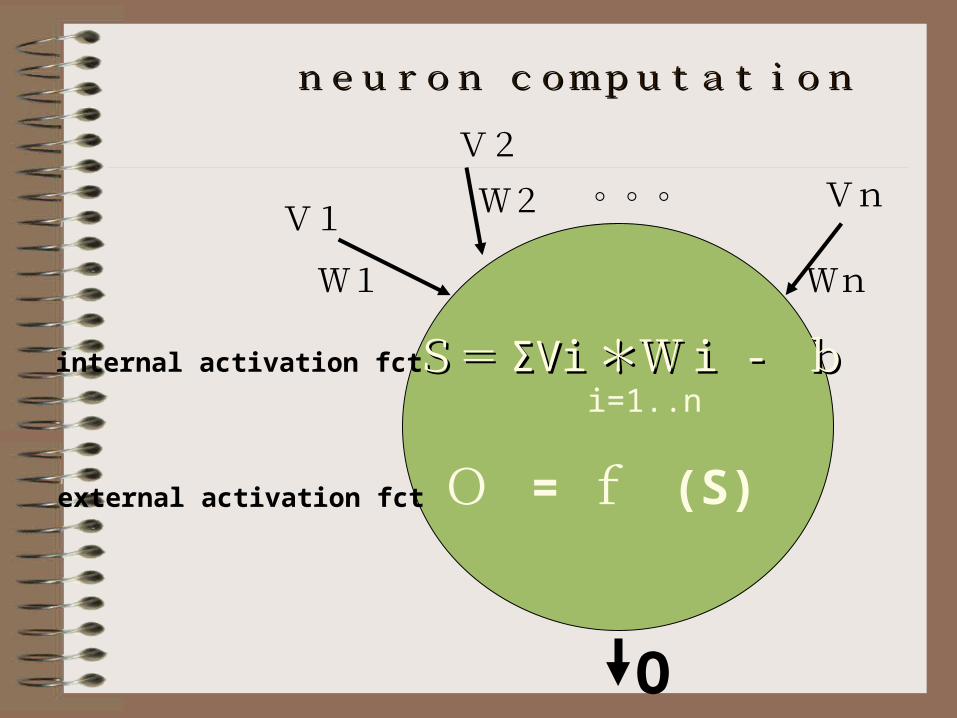
neuron computation neuron computation
V1
W1
V2
W2 。。。 Vn
Wn
O
S=S= ΣViΣVi **WW i - i - bb i=1..n
internal activation fct
O = f (S)external activation fct
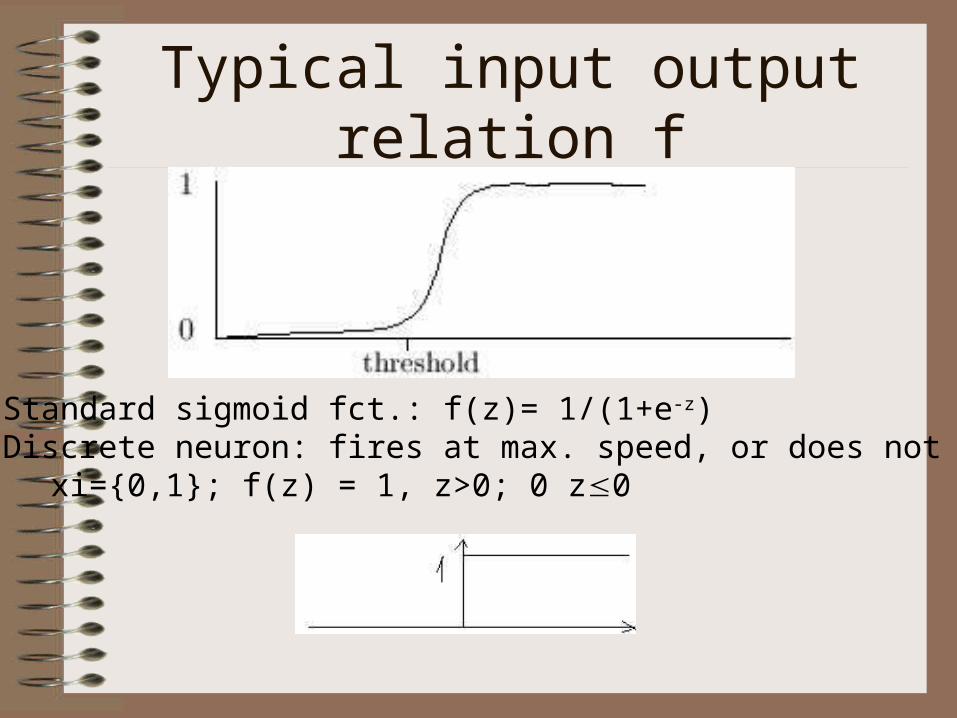
Typical input output relation f
1. Standard sigmoid fct.: f(z)= 1/(1+e-z)2. Discrete neuron: fires at max. speed, or does not fire
xi={0,1}; f(z) = 1, z>0; 0 z0
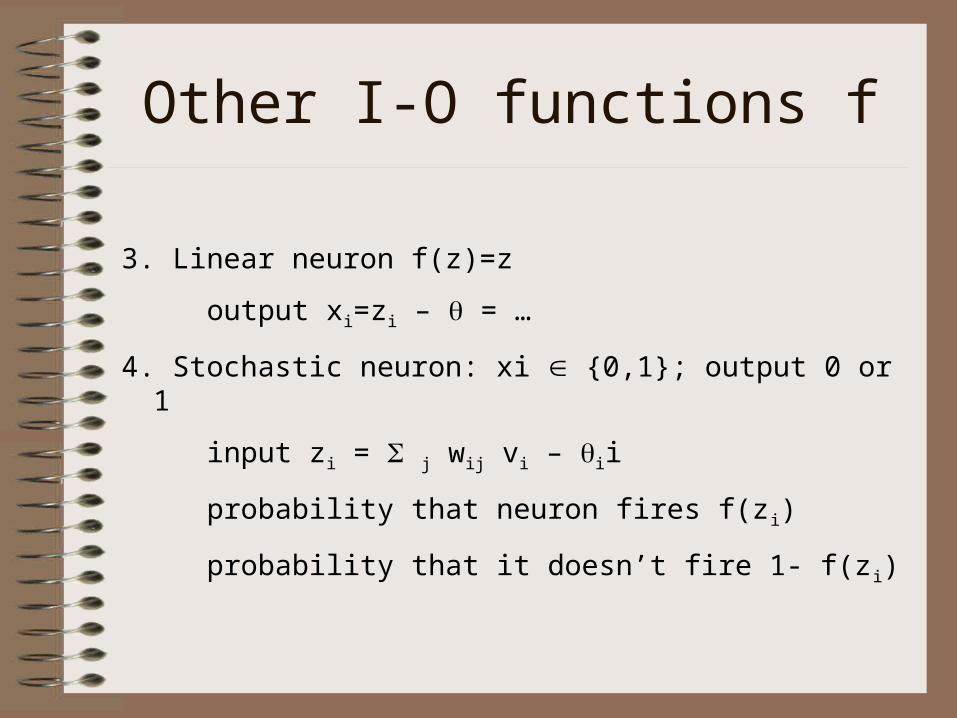
Other I-O functions f
3. Linear neuron f(z)=z
output xi=zi – = …
4. Stochastic neuron: xi {0,1}; output 0 or 1
input zi = j wij vi – ii
probability that neuron fires f(zi)
probability that it doesn’t fire 1- f(zi)
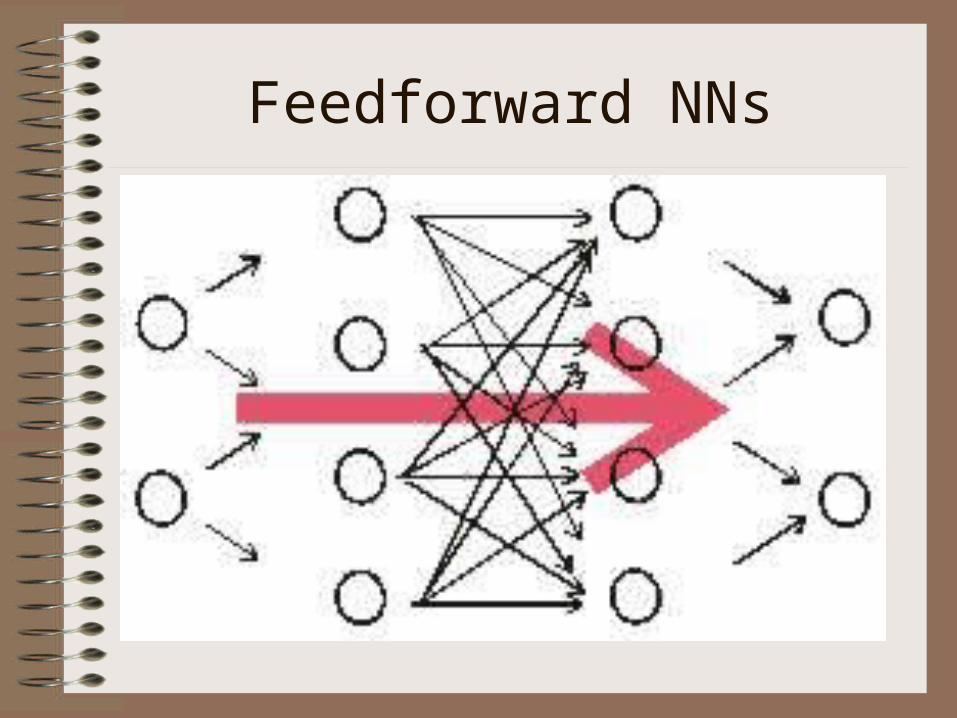
Feedforward NNs
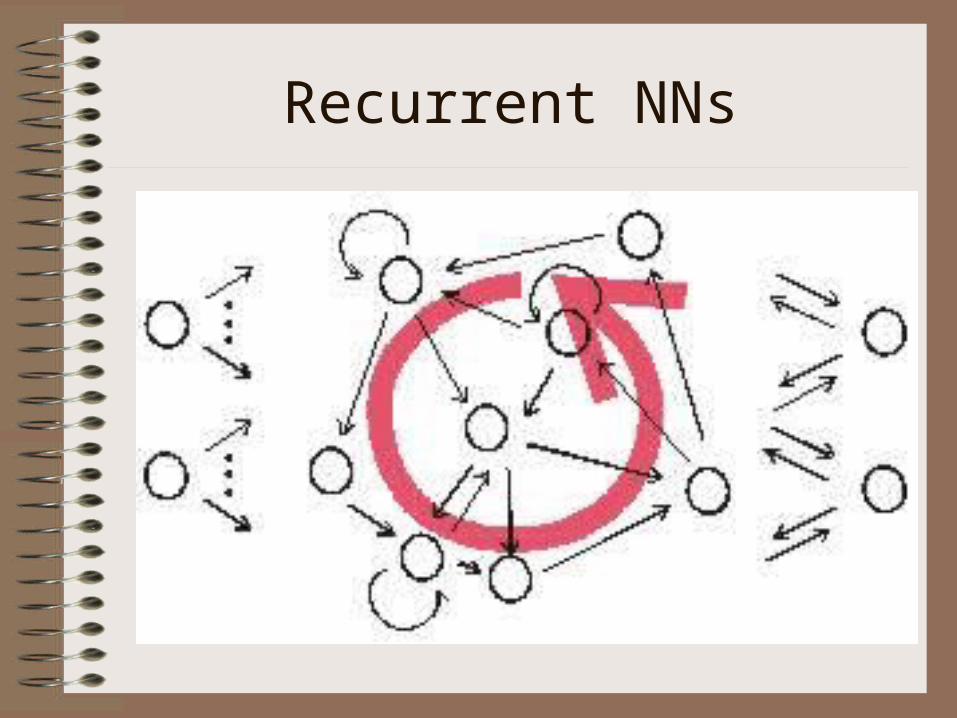
Recurrent NNs
Summarizing ANNs
• Feedforward network, layered– No connection from the output to the input, at
each layer but also at neuron level
• Recurrent network– Anything is allowed – cycles, etc.