Embed Size (px)
Citation preview
7/27/2019 Day Trading With Pivots
http://slidepdf.com/reader/full/day-trading-with-pivots 1/8
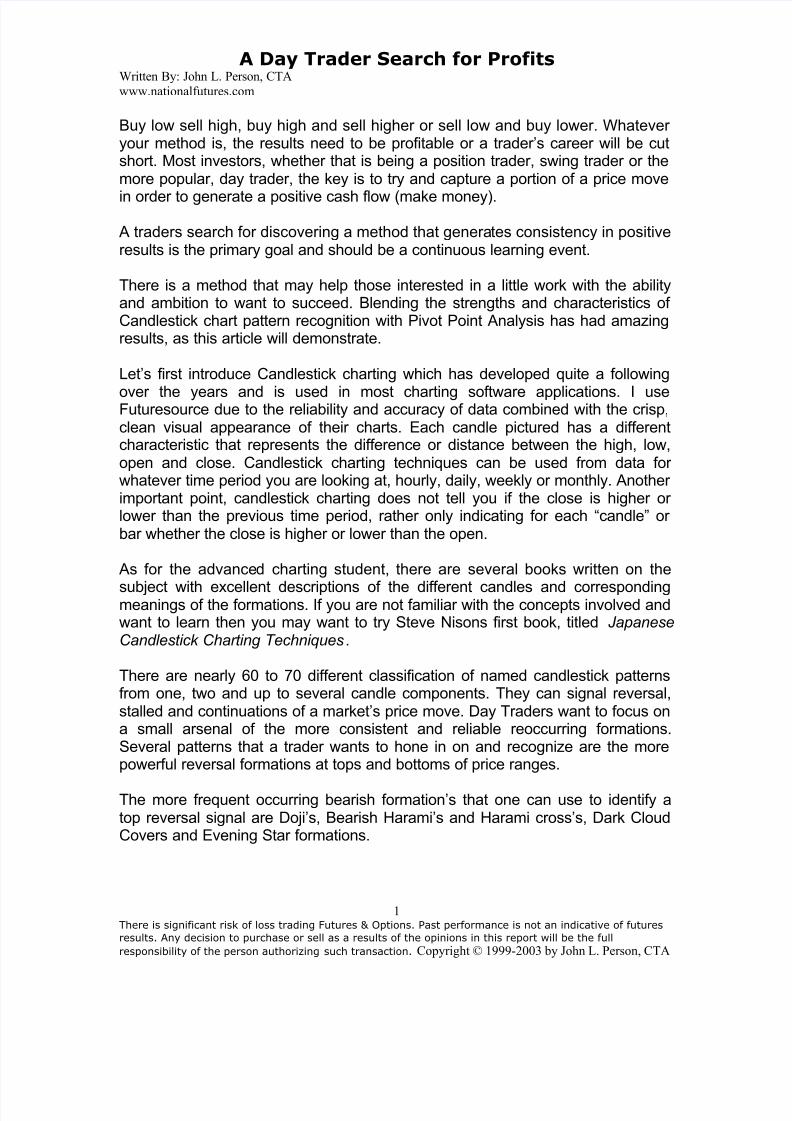
A Day Trader Search for ProfitsWritten By: John L. Person, CTA
www.nationalfutures.com
1
There is significant risk of loss trading Futures & Options. Past performance is not an indicative of futures
results. Any decision to purchase or sell as a results of the opinions in this report will be the full
responsibility of the person authorizing such transaction. Copyright © 1999-2003 by John L. Person, CTA
Buy low sell high, buy high and sell higher or sell low and buy lower. Whatever your method is, the results need to be profitable or a trader’s career will be cutshort. Most investors, whether that is being a position trader, swing trader or themore popular, day trader, the key is to try and capture a portion of a price move
in order to generate a positive cash flow (make money).
A traders search for discovering a method that generates consistency in positiveresults is the primary goal and should be a continuous learning event.
There is a method that may help those interested in a little work with the abilityand ambition to want to succeed. Blending the strengths and characteristics of Candlestick chart pattern recognition with Pivot Point Analysis has had amazingresults, as this article will demonstrate.
Let’s first introduce Candlestick charting which has developed quite a following
over the years and is used in most charting software applications. I useFuturesource due to the reliability and accuracy of data combined with the crisp,clean visual appearance of their charts. Each candle pictured has a differentcharacteristic that represents the difference or distance between the high, low,open and close. Candlestick charting techniques can be used from data for whatever time period you are looking at, hourly, daily, weekly or monthly. Another important point, candlestick charting does not tell you if the close is higher or lower than the previous time period, rather only indicating for each “candle” or bar whether the close is higher or lower than the open.
As for the advanced charting student, there are several books written on the
subject with excellent descriptions of the different candles and correspondingmeanings of the formations. If you are not familiar with the concepts involved andwant to learn then you may want to try Steve Nisons first book, titled JapaneseCandlestick Charting Techniques.
There are nearly 60 to 70 different classification of named candlestick patternsfrom one, two and up to several candle components. They can signal reversal,stalled and continuations of a market’s price move. Day Traders want to focus ona small arsenal of the more consistent and reliable reoccurring formations.Several patterns that a trader wants to hone in on and recognize are the morepowerful reversal formations at tops and bottoms of price ranges.
The more frequent occurring bearish formation’s that one can use to identify atop reversal signal are Doji’s, Bearish Harami’s and Harami cross’s, Dark CloudCovers and Evening Star formations.
7/27/2019 Day Trading With Pivots
http://slidepdf.com/reader/full/day-trading-with-pivots 2/8
A Day Trader Search for ProfitsWritten By: John L. Person, CTA
www.nationalfutures.com
2
There is significant risk of loss trading Futures & Options. Past performance is not an indicative of futures
results. Any decision to purchase or sell as a results of the opinions in this report will be the full
responsibility of the person authorizing such transaction. Copyright © 1999-2003 by John L. Person, CTA
As for bottom formations, Names such as Bullish Harami Cross’s, BullishPiercing Patterns and Bullish Engulfing patterns and Morning Star formations arethe more reliable two and three candle patterns. They are distinctly recognizable.
When candlestick chart pattern recognition skills are learned and then applied
with the use of Pivot Point Calculations, a host of benefits will be gained. Just tomention a few, consider the targeted support and resistance numbers like anearly warning system. Becoming aware of an important price target level, whenaccompanied with a candlestick pattern one can then swiftly, and best of all,confidently act on, an informed, calculated, trading decision.
I wrote an 18 page booklet titled Swing Trading Using Candlesticks combined with Pivot Point Analysis. For those interested in a continued learning experiencego to my private website www.nationalfutures.com and click on the request linkfor your free copy. This booklet covers the top candlestick patterns as well asreveals the pivot Point calculations.
One important aspect that I find extremely important is the use of multiple timeframe analysis. For those who are familiar with the “numbers” from the PivotPoint calculations the idea of applying them from any other time period other thanthe prior days session may make little or no sense. However, I propose that theDaily, Weekly and even Monthly target numbers can and should be incorporatedin a traders “tool box”. Often traders will comment, “if I am a day trader whatwould I want to be concerned with a monthly or weekly market outlook”?Consider this in every month there will be a High, a Low and the Close will besomewhere in between. Right? In one week, a high or low will be established andin one day of the week the market will form that point of interest and potentially,
more often than not, in an hour or so trades will take place that will establish thathigh and subsequently that low!
Now that the means of market analysis has been introduced, the “weapons” needto be used on a market. I want to introduce to you the e-mini-size Dow Futuresas a galleria in which to participate and illustrate the techniques used to show anexcellent trading vehicle. Charles Dow, first established the Dow, in 1896, itoriginally consisted of only 12 stocks. It has the longest and most establishednotoriety of any stock index.
I always believed in three main ingredients are needed to maintain a successful
futures market. One is participation by professional large traders, one isparticipation by Commercials, in this case Hedge Funds, banks or institutionsand the third is activity-involving speculators. The mini-size Dow has thoseingredients as well as the accessibility of an online trading vehicle. CombiningCandlestick charting with Pivot point analysis has had amazing results with thisproduct.
7/27/2019 Day Trading With Pivots
http://slidepdf.com/reader/full/day-trading-with-pivots 3/8
A Day Trader Search for ProfitsWritten By: John L. Person, CTA
www.nationalfutures.com
3
There is significant risk of loss trading Futures & Options. Past performance is not an indicative of futures
results. Any decision to purchase or sell as a results of the opinions in this report will be the full
responsibility of the person authorizing such transaction. Copyright © 1999-2003 by John L. Person, CTA
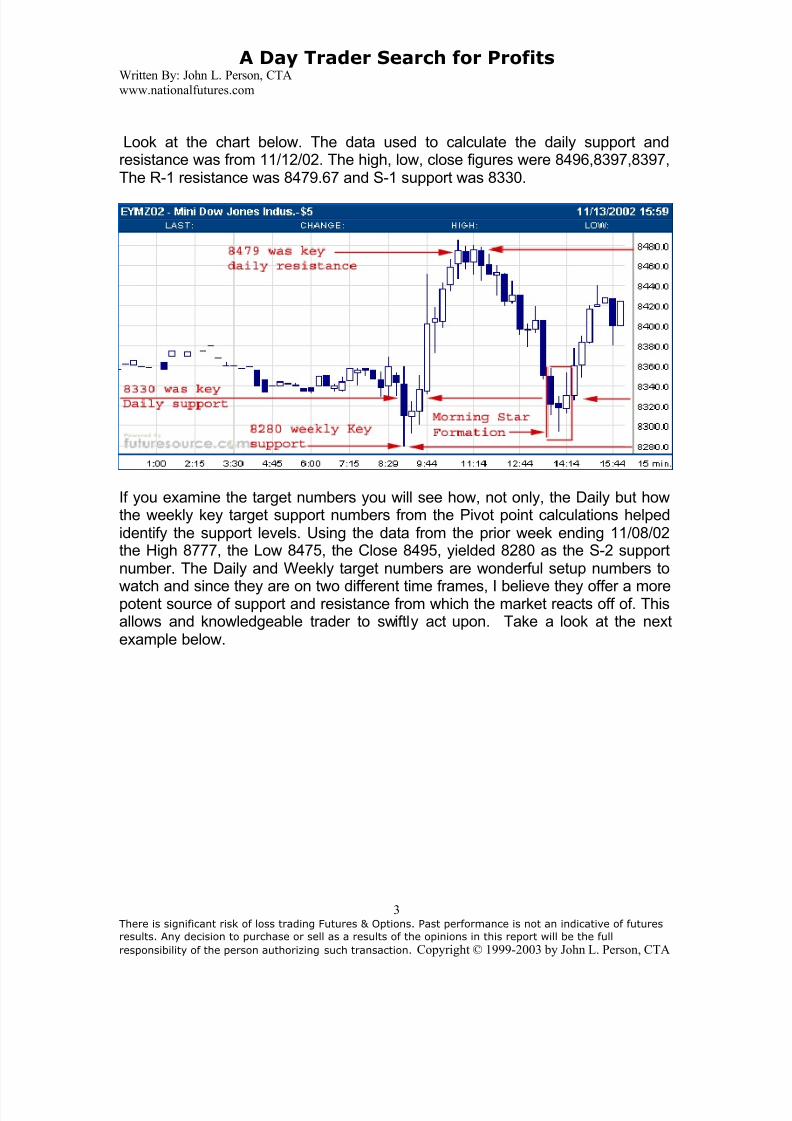
Look at the chart below. The data used to calculate the daily support andresistance was from 11/12/02. The high, low, close figures were 8496,8397,8397,The R-1 resistance was 8479.67 and S-1 support was 8330.
If you examine the target numbers you will see how, not only, the Daily but howthe weekly key target support numbers from the Pivot point calculations helpedidentify the support levels. Using the data from the prior week ending 11/08/02the High 8777, the Low 8475, the Close 8495, yielded 8280 as the S-2 supportnumber. The Daily and Weekly target numbers are wonderful setup numbers to
watch and since they are on two different time frames, I believe they offer a morepotent source of support and resistance from which the market reacts off of. Thisallows and knowledgeable trader to swiftly act upon. Take a look at the nextexample below.
7/27/2019 Day Trading With Pivots
http://slidepdf.com/reader/full/day-trading-with-pivots 4/8
A Day Trader Search for ProfitsWritten By: John L. Person, CTA
www.nationalfutures.com
4
There is significant risk of loss trading Futures & Options. Past performance is not an indicative of futures
results. Any decision to purchase or sell as a results of the opinions in this report will be the full
responsibility of the person authorizing such transaction. Copyright © 1999-2003 by John L. Person, CTA
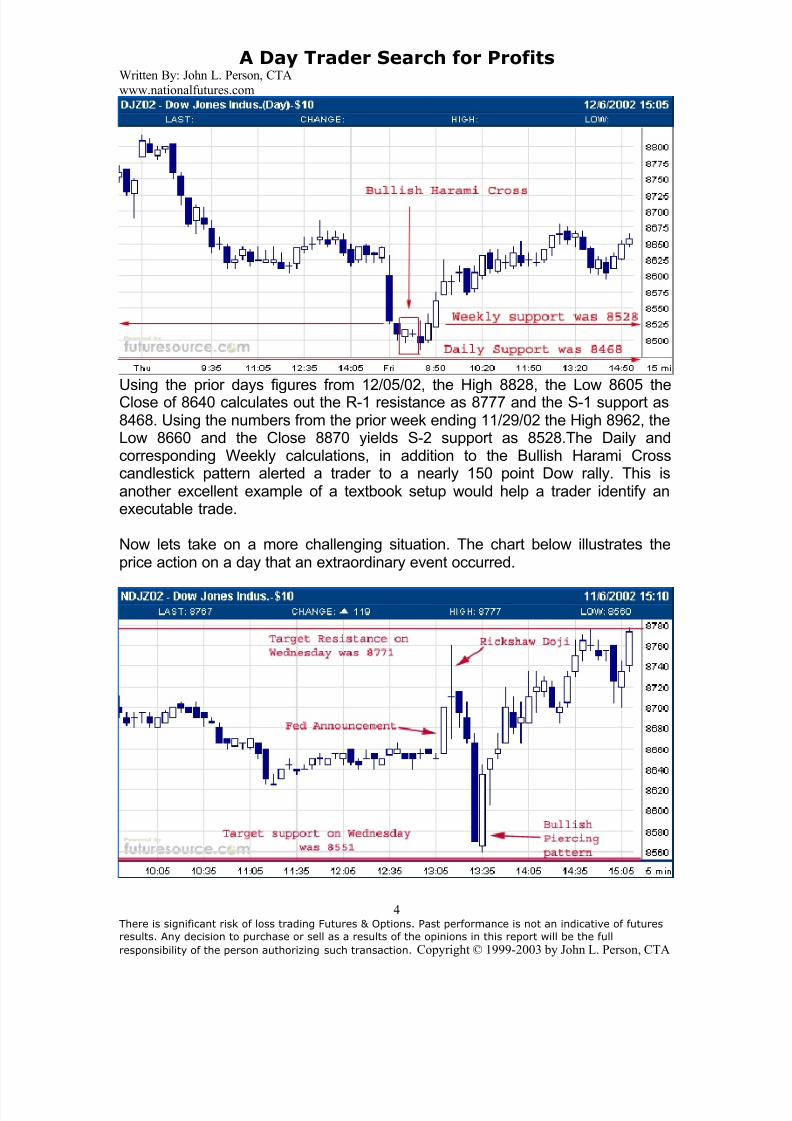
Using the prior days figures from 12/05/02, the High 8828, the Low 8605 theClose of 8640 calculates out the R-1 resistance as 8777 and the S-1 support as8468. Using the numbers from the prior week ending 11/29/02 the High 8962, theLow 8660 and the Close 8870 yields S-2 support as 8528.The Daily andcorresponding Weekly calculations, in addition to the Bullish Harami Crosscandlestick pattern alerted a trader to a nearly 150 point Dow rally. This isanother excellent example of a textbook setup would help a trader identify anexecutable trade.
Now lets take on a more challenging situation. The chart below illustrates theprice action on a day that an extraordinary event occurred.
7/27/2019 Day Trading With Pivots
http://slidepdf.com/reader/full/day-trading-with-pivots 5/8
A Day Trader Search for ProfitsWritten By: John L. Person, CTA
www.nationalfutures.com
5
There is significant risk of loss trading Futures & Options. Past performance is not an indicative of futures
results. Any decision to purchase or sell as a results of the opinions in this report will be the full
responsibility of the person authorizing such transaction. Copyright © 1999-2003 by John L. Person, CTA
That was the day the Federal Reserve policy setting arm, the Federal OpenMarket Committee, surprised the world with a .50% decrease in Interest Rates.That was the first interest rate adjustment for all of 2002. Would that have beena catalyst to incite volatility? You bet! But the Pivot Point Numbers still identifiedthe potential range for that day too! Taking the data from the prior days session
from 11/05/02 the High 8675, the Low, 8515 the Close of 8648 provided the R-2resistance at 8771 and the S-2 support at 8551.
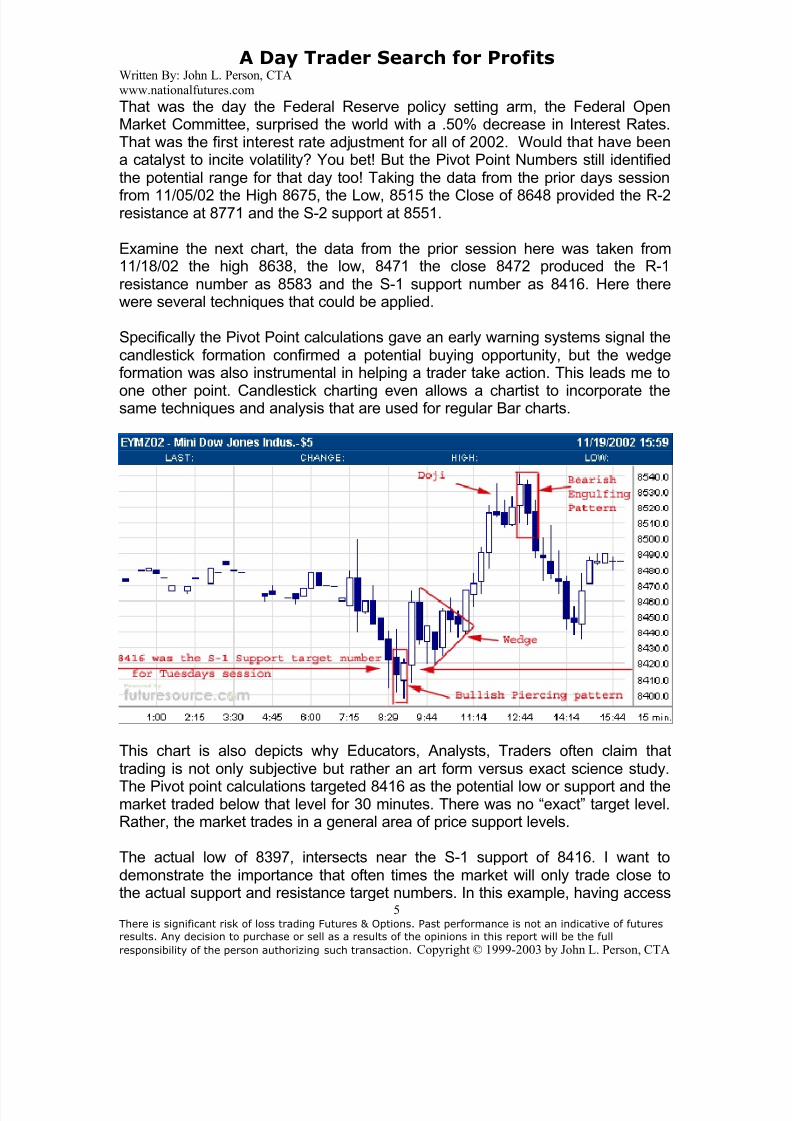
Examine the next chart, the data from the prior session here was taken from11/18/02 the high 8638, the low, 8471 the close 8472 produced the R-1resistance number as 8583 and the S-1 support number as 8416. Here therewere several techniques that could be applied.
Specifically the Pivot Point calculations gave an early warning systems signal thecandlestick formation confirmed a potential buying opportunity, but the wedgeformation was also instrumental in helping a trader take action. This leads me to
one other point. Candlestick charting even allows a chartist to incorporate thesame techniques and analysis that are used for regular Bar charts.
This chart is also depicts why Educators, Analysts, Traders often claim thattrading is not only subjective but rather an art form versus exact science study.
The Pivot point calculations targeted 8416 as the potential low or support and themarket traded below that level for 30 minutes. There was no “exact” target level.Rather, the market trades in a general area of price support levels.
The actual low of 8397, intersects near the S-1 support of 8416. I want todemonstrate the importance that often times the market will only trade close tothe actual support and resistance target numbers. In this example, having access
7/27/2019 Day Trading With Pivots
http://slidepdf.com/reader/full/day-trading-with-pivots 6/8
A Day Trader Search for ProfitsWritten By: John L. Person, CTA
www.nationalfutures.com
6
There is significant risk of loss trading Futures & Options. Past performance is not an indicative of futures
results. Any decision to purchase or sell as a results of the opinions in this report will be the full
responsibility of the person authorizing such transaction. Copyright © 1999-2003 by John L. Person, CTA
to these support and resistance number plus combining the Bullish Candlestickset-up pattern’s a positive trade result may have occurred.
In this example, even if you were not convinced that a reversal would occur, thenat least the “breakout” from the wedge pattern would have enabled a day trader
to capture a portion of the ensuing rally.
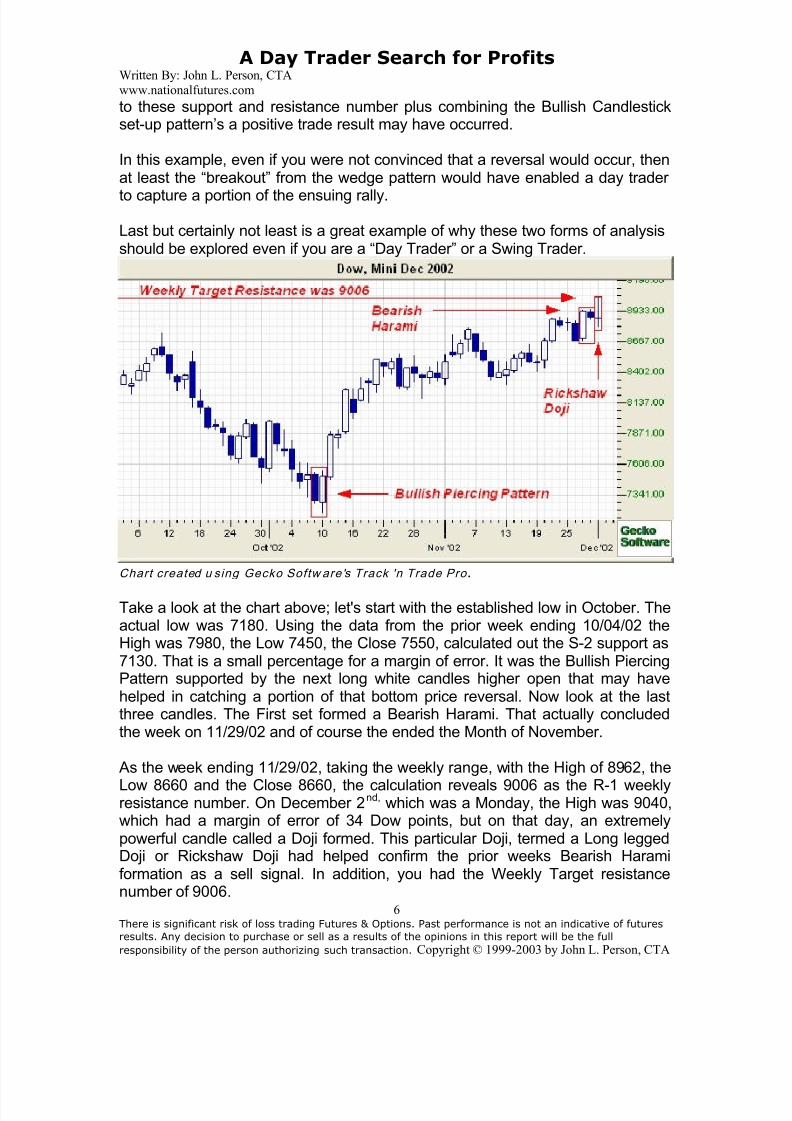
Last but certainly not least is a great example of why these two forms of analysisshould be explored even if you are a “Day Trader” or a Swing Trader.
Chart created u sing Gecko Softw are's Track 'n Trade Pro .
Take a look at the chart above; let's start with the established low in October. Theactual low was 7180. Using the data from the prior week ending 10/04/02 theHigh was 7980, the Low 7450, the Close 7550, calculated out the S-2 support as7130. That is a small percentage for a margin of error. It was the Bullish PiercingPattern supported by the next long white candles higher open that may havehelped in catching a portion of that bottom price reversal. Now look at the lastthree candles. The First set formed a Bearish Harami. That actually concludedthe week on 11/29/02 and of course the ended the Month of November.
As the week ending 11/29/02, taking the weekly range, with the High of 8962, the
Low 8660 and the Close 8660, the calculation reveals 9006 as the R-1 weeklyresistance number. On December 2nd, which was a Monday, the High was 9040,which had a margin of error of 34 Dow points, but on that day, an extremelypowerful candle called a Doji formed. This particular Doji, termed a Long leggedDoji or Rickshaw Doji had helped confirm the prior weeks Bearish Haramiformation as a sell signal. In addition, you had the Weekly Target resistancenumber of 9006.
7/27/2019 Day Trading With Pivots
http://slidepdf.com/reader/full/day-trading-with-pivots 7/8
A Day Trader Search for ProfitsWritten By: John L. Person, CTA
www.nationalfutures.com
7
There is significant risk of loss trading Futures & Options. Past performance is not an indicative of futures
results. Any decision to purchase or sell as a results of the opinions in this report will be the full
responsibility of the person authorizing such transaction. Copyright © 1999-2003 by John L. Person, CTA
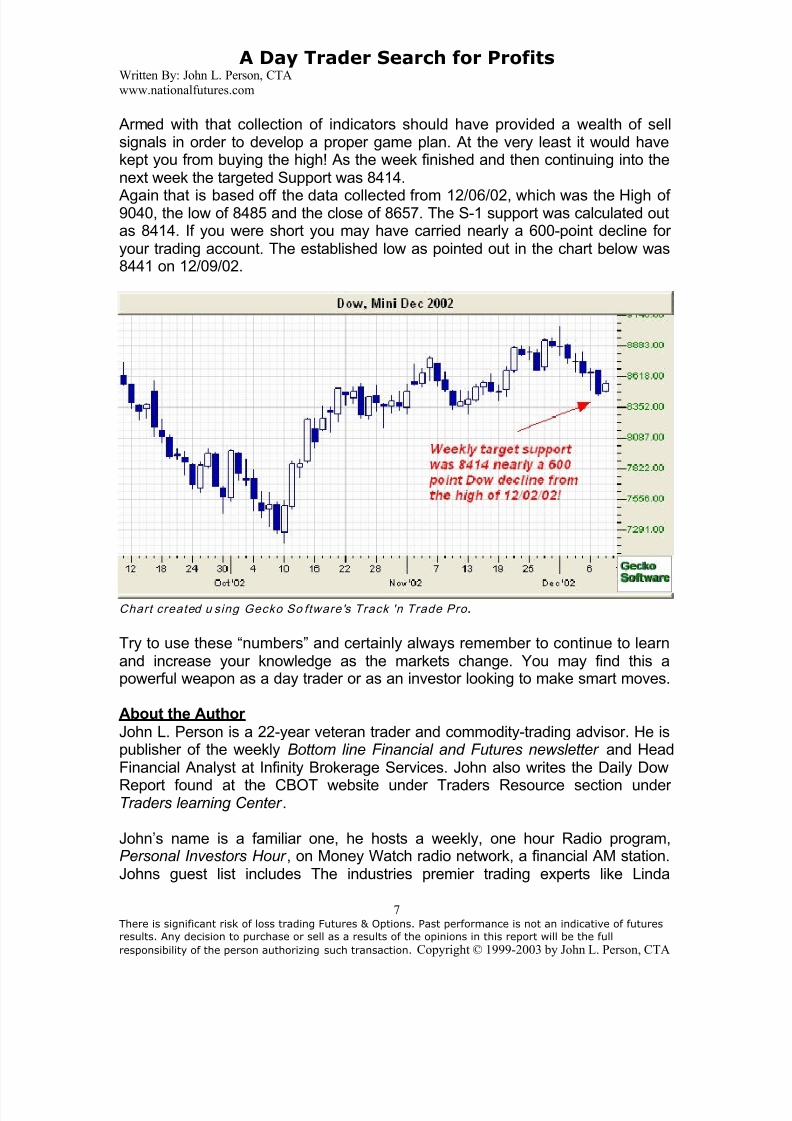
Armed with that collection of indicators should have provided a wealth of sellsignals in order to develop a proper game plan. At the very least it would havekept you from buying the high! As the week finished and then continuing into thenext week the targeted Support was 8414.
Again that is based off the data collected from 12/06/02, which was the High of 9040, the low of 8485 and the close of 8657. The S-1 support was calculated outas 8414. If you were short you may have carried nearly a 600-point decline for your trading account. The established low as pointed out in the chart below was8441 on 12/09/02.
Chart created u sing Gecko So ftware's Track 'n Trade Pro .
Try to use these “numbers” and certainly always remember to continue to learnand increase your knowledge as the markets change. You may find this apowerful weapon as a day trader or as an investor looking to make smart moves.
About the Author
John L. Person is a 22-year veteran trader and commodity-trading advisor. He ispublisher of the weekly Bottom line Financial and Futures newsletter and HeadFinancial Analyst at Infinity Brokerage Services. John also writes the Daily Dow
Report found at the CBOT website under Traders Resource section under Traders learning Center .
John’s name is a familiar one, he hosts a weekly, one hour Radio program,Personal Investors Hour , on Money Watch radio network, a financial AM station.Johns guest list includes The industries premier trading experts like Linda

7/27/2019 Day Trading With Pivots
http://slidepdf.com/reader/full/day-trading-with-pivots 8/8
A Day Trader Search for ProfitsWritten By: John L. Person, CTA
www.nationalfutures.com
8
There is significant risk of loss trading Futures & Options. Past performance is not an indicative of futures
results. Any decision to purchase or sell as a results of the opinions in this report will be the full
responsibility of the person authorizing such transaction. Copyright © 1999-2003 by John L. Person, CTA
Bradford-Rashke, Martin Pring, John Murphy, Steve Nison, Larry Pesavento,John Bollinger and others.
He also appears in many news articles as the world’s top journalists, such asReuters, CBS, Forbes, The New York Times and Dow Jones rely on his market
insights. He has written articles for Futures magazine and has just concludedwriting a Book on Technical Analysis, soon to be released. John presents privateseminars and Appears at the Industries top Expos as a guest speaker.
John may be reached at [email protected] or at his private researchsite www.nationalfutures.com