Embed Size (px)
Citation preview
DC Economic and Revenue Trends: June 2015 1 DC Office of Revenue Analysis
DC hotel demand and revenues up sharply the last 12 months, the best year of the past decade Highlights:
Wage and salary employment..…2
Sectors of the DC economy ..…...3
Resident employment and unem‐ployment …..……………….….…. 4
Wages and income………....…....5
Residen al real estate…….…….….6
Commercial office space…….…..10
Hospitality .……………..…...…......12
US economy …………….……...…..13
DC tax collec ons……….…....…..14
DC revenue es mate..…….....…..18
ORA reports , documents, & blog………………………………………...21
ORA contact informa on.……..21
US and DC forecasts…….….......16
About this report…...............…….21
District of Columbia Economic and Revenue Trends: June 2015
GOVERNMENT OF THE DISTRICT OF COLUMBIA OFFICE OF THE CHIEF FINANCIAL OFFICER
OFFICE OF REVENUE ANALYSIS
Muriel Bowser, Mayor Fitzroy Lee, Deputy CFO & Chief Economist Jeffrey S. DeWi , Chief Financial Officer Stephen Swaim, Senior Economist
Indicator updates:
Job growth con nues in DC and the suburbs………….2
Housing permits rise…. 9
Strong tax collec ons..14
More people are staying in DC hotels and they are paying more for their rooms. According to STR, Inc. total demand for DC hotel rooms for the 12-months ending May 2015 was 6.2% higher than in the prior 12-month period. Combined with an average room rate 4.3% above the prior year’s, hotel revenue grew a remarkable 10.7%.
The increase in hotel sales added to DC’s tax revenue. Hotel accommodations are taxed at 14.5%, about one-third of which is used to pay for Convention Center bonds and tourism promotion. In FY 2014 the hotel tax generated $226 million in revenue, 19.2% of all sales taxes. The 10.7 % gain in hotel sales translates to roughly $22 million in additional tax revenue over the May 2014 to May 2015 peri-od, accounting for about a quarter of the $84 million increase in all DC sales tax collections over the past 12-months. (See the table on p.14).
The gain in hotel room demand and revenue appears, however, to have done little for employment in the industry. According to the US Bureau of Labor Statistics, the annual average number of full and part-time hotel workers in DC’s accommo-dation sector actually declined 0.2% from May 2014 to May 2015. (Cont’d on p. 19)
Room demand increased 6.2% over the prior year for the 12 months ending May 2015, and room revenue grew 10.7%
Compared to the same periods of the prior year, the increases in room demand and revenue at DC hotels grew larger as the year progressed from May 2014 to May 2015
DC hotel room demand (room‐days sold): May 2014 to May 2015 (% change from the prior year in the 12‐month moving total)
DC hotel revenue from room sales: May 2014 to May 2015 (% change from the prior year in the 12‐month moving total)
DC Economic and Revenue Trends: June 2015 2 DC Office of Revenue Analysis
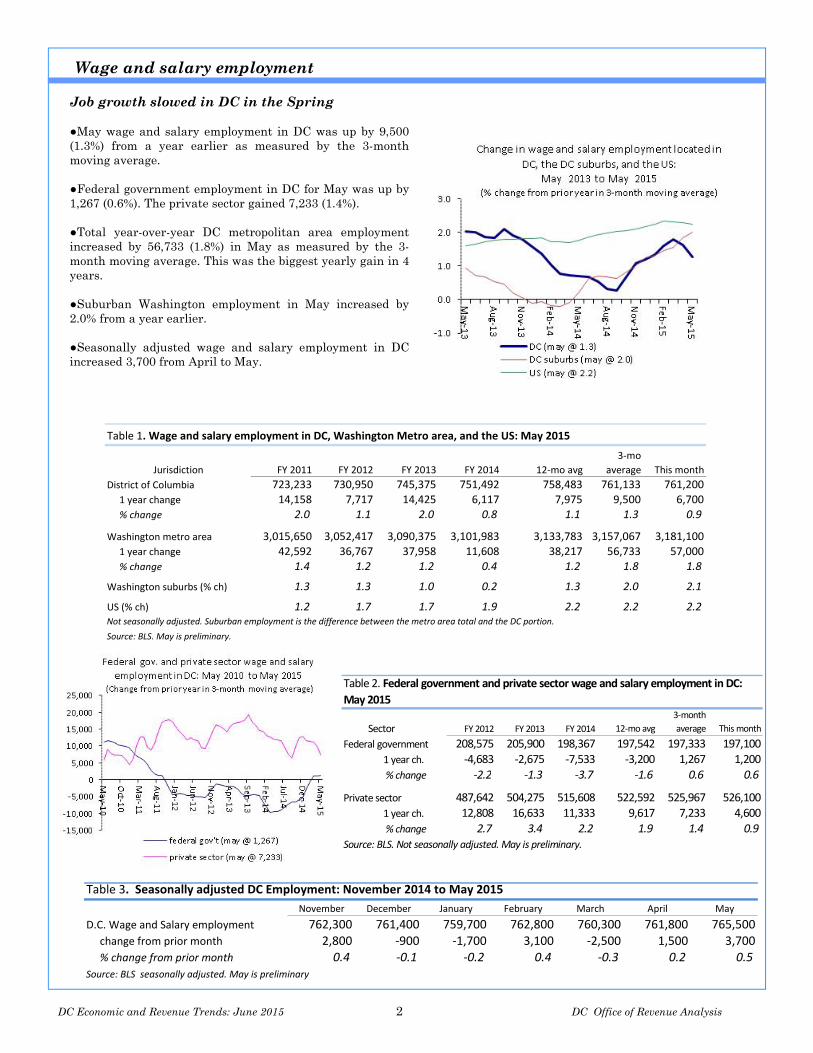
Job growth slowed in DC in the Spring ●May wage and salary employment in DC was up by 9,500 (1.3%) from a year earlier as measured by the 3-month moving average. ●Federal government employment in DC for May was up by 1,267 (0.6%). The private sector gained 7,233 (1.4%). ●Total year-over-year DC metropolitan area employment increased by 56,733 (1.8%) in May as measured by the 3-month moving average. This was the biggest yearly gain in 4 years. ●Suburban Washington employment in May increased by 2.0% from a year earlier. ●Seasonally adjusted wage and salary employment in DC increased 3,700 from April to May.
Wage and salary employment
Table 1. Wage and salary employment in DC, Washington Metro area, and the US: May 2015
Jurisdiction FY 2011 FY 2012 FY 2013 FY 2014 12‐mo avg
3‐mo
average This month
District of Columbia 723,233 730,950 745,375 751,492 758,483 761,133 761,200 1 year change 14,158 7,717 14,425 6,117 7,975 9,500 6,700 % change 2.0 1.1 2.0 0.8 1.1 1.3 0.9
Washington metro area 3,015,650 3,052,417 3,090,375 3,101,983 3,133,783 3,157,067 3,181,100 1 year change 42,592 36,767 37,958 11,608 38,217 56,733 57,000 % change 1.4 1.2 1.2 0.4 1.2 1.8 1.8
Washington suburbs (% ch) 1.3 1.3 1.0 0.2 1.3 2.0 2.1
US (% ch) 1.2 1.7 1.7 1.9 2.2 2.2 2.2Not seasonally adjusted. Suburban employment is the difference between the metro area total and the DC portion.
Source: BLS. May is preliminary.
Table 3. Seasonally adjusted DC Employment: November 2014 to May 2015
November December January February March April May
D.C. Wage and Salary employment 762,300 761,400 759,700 762,800 760,300 761,800 765,500 change from prior month 2,800 ‐900 ‐1,700 3,100 ‐2,500 1,500 3,700 % change from prior month 0.4 ‐0.1 ‐0.2 0.4 ‐0.3 0.2 0.5Source: BLS seasonally adjusted. May is preliminary
Sector FY 2012 FY 2013 FY 2014 12‐mo avg
3‐month
average This month
Federal government 208,575 205,900 198,367 197,542 197,333 197,100 1 year ch. ‐4,683 ‐2,675 ‐7,533 ‐3,200 1,267 1,200
% change ‐2.2 ‐1.3 ‐3.7 ‐1.6 0.6 0.6
Private sector 487,642 504,275 515,608 522,592 525,967 526,100 1 year ch. 12,808 16,633 11,333 9,617 7,233 4,600
% change 2.7 3.4 2.2 1.9 1.4 0.9Source: BLS. Not seasonally adjusted. May is preliminary.
Table 2. Federal government and private sector wage and salary employment in DC:
May 2015
DC Economic and Revenue Trends: June 2015 3 DC Office of Revenue Analysis
Jobs by sectors of the economy
Non-lawyer professional services and business ser-vices top DC’s private sector job growth
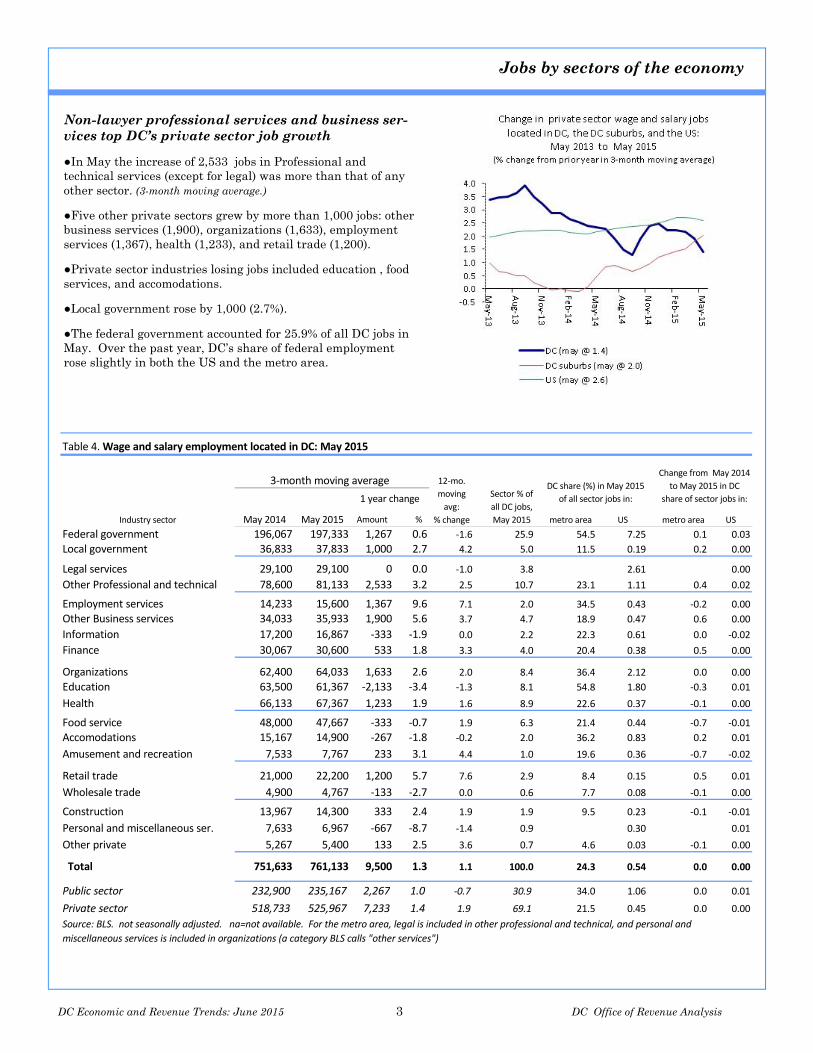
●In May the increase of 2,533 jobs in Professional and technical services (except for legal) was more than that of any other sector. (3-month moving average.)
●Five other private sectors grew by more than 1,000 jobs: other business services (1,900), organizations (1,633), employment services (1,367), health (1,233), and retail trade (1,200).
●Private sector industries losing jobs included education , food services, and accomodations.
●Local government rose by 1,000 (2.7%).
●The federal government accounted for 25.9% of all DC jobs in May. Over the past year, DC’s share of federal employment rose slightly in both the US and the metro area.
Amount % metro area US metro area US
Federal government 196,067 197,333 1,267 0.6 ‐1.6 25.9 54.5 7.25 0.1 0.03
Local government 36,833 37,833 1,000 2.7 4.2 5.0 11.5 0.19 0.2 0.00
Legal services 29,100 29,100 0 0.0 ‐1.0 3.8 2.61 0.00
Other Professional and technical 78,600 81,133 2,533 3.2 2.5 10.7 23.1 1.11 0.4 0.02
Employment services 14,233 15,600 1,367 9.6 7.1 2.0 34.5 0.43 ‐0.2 0.00
Other Business services 34,033 35,933 1,900 5.6 3.7 4.7 18.9 0.47 0.6 0.00
Information 17,200 16,867 ‐333 ‐1.9 0.0 2.2 22.3 0.61 0.0 ‐0.02
Finance 30,067 30,600 533 1.8 3.3 4.0 20.4 0.38 0.5 0.00
Organizations 62,400 64,033 1,633 2.6 2.0 8.4 36.4 2.12 0.0 0.00
Education 63,500 61,367 ‐2,133 ‐3.4 ‐1.3 8.1 54.8 1.80 ‐0.3 0.01
Health 66,133 67,367 1,233 1.9 1.6 8.9 22.6 0.37 ‐0.1 0.00
Food service 48,000 47,667 ‐333 ‐0.7 1.9 6.3 21.4 0.44 ‐0.7 ‐0.01
Accomodations 15,167 14,900 ‐267 ‐1.8 ‐0.2 2.0 36.2 0.83 0.2 0.01
Amusement and recreation 7,533 7,767 233 3.1 4.4 1.0 19.6 0.36 ‐0.7 ‐0.02
Retail trade 21,000 22,200 1,200 5.7 7.6 2.9 8.4 0.15 0.5 0.01
Wholesale trade 4,900 4,767 ‐133 ‐2.7 0.0 0.6 7.7 0.08 ‐0.1 0.00
Construction 13,967 14,300 333 2.4 1.9 1.9 9.5 0.23 ‐0.1 ‐0.01
Personal and miscellaneous ser. 7,633 6,967 ‐667 ‐8.7 ‐1.4 0.9 0.30 0.01
Other private 5,267 5,400 133 2.5 3.6 0.7 4.6 0.03 ‐0.1 0.00
Total 751,633 761,133 9,500 1.3 1.1 100.0 24.3 0.54 0.0 0.00
Public sector 232,900 235,167 2,267 1.0 ‐0.7 30.9 34.0 1.06 0.0 0.01
Private sector 518,733 525,967 7,233 1.4 1.9 69.1 21.5 0.45 0.0 0.00
Table 4. Wage and salary employment located in DC: May 2015
May 2015
12‐mo.
moving
avg:
% change
Change from May 2014
to May 2015 in DC
share of sector jobs in:
Source: BLS. not seasonally adjusted. na=not available. For the metro area, legal is included in other professional and technical, and personal and
miscellaneous services is included in organizations (a category BLS calls "other services")
Sector % of
all DC jobs,
May 2015
DC share (%) in May 2015
of all sector jobs in:
Industry sector
3‐month moving average
1 year change
May 2014
DC Economic and Revenue Trends: June 2015 4 DC Office of Revenue Analysis
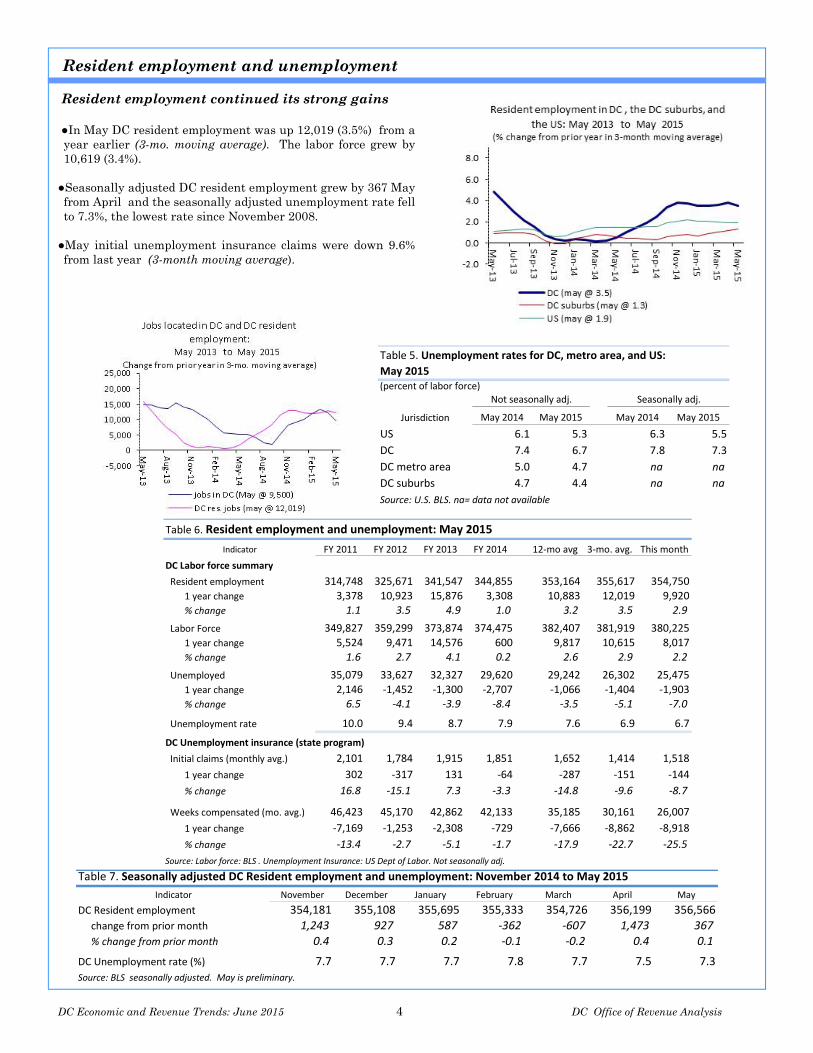
Resident employment continued its strong gains ●In May DC resident employment was up 12,019 (3.5%) from a year earlier (3-mo. moving average). The labor force grew by 10,619 (3.4%).
●Seasonally adjusted DC resident employment grew by 367 May from April and the seasonally adjusted unemployment rate fell to 7.3%, the lowest rate since November 2008.
●May initial unemployment insurance claims were down 9.6% from last year (3-month moving average).
Resident employment and unemployment
Table 7. Seasonally adjusted DC Resident employment and unemployment: November 2014 to May 2015
Indicator November December January February March April May
DC Resident employment 354,181 355,108 355,695 355,333 354,726 356,199 356,566 change from prior month 1,243 927 587 ‐362 ‐607 1,473 367 % change from prior month 0.4 0.3 0.2 ‐0.1 ‐0.2 0.4 0.1
DC Unemployment rate (%) 7.7 7.7 7.7 7.8 7.7 7.5 7.3Source: BLS seasonally adjusted. May is preliminary.
Indicator FY 2011 FY 2012 FY 2013 FY 2014 12‐mo avg 3‐mo. avg. This month
DC Labor force summary
Resident employment 314,748 325,671 341,547 344,855 353,164 355,617 354,750
1 year change 3,378 10,923 15,876 3,308 10,883 12,019 9,920 % change 1.1 3.5 4.9 1.0 3.2 3.5 2.9
Labor Force 349,827 359,299 373,874 374,475 382,407 381,919 380,225
1 year change 5,524 9,471 14,576 600 9,817 10,615 8,017 % change 1.6 2.7 4.1 0.2 2.6 2.9 2.2
Unemployed 35,079 33,627 32,327 29,620 29,242 26,302 25,475
1 year change 2,146 ‐1,452 ‐1,300 ‐2,707 ‐1,066 ‐1,404 ‐1,903 % change 6.5 ‐4.1 ‐3.9 ‐8.4 ‐3.5 ‐5.1 ‐7.0
Unemployment rate 10.0 9.4 8.7 7.9 7.6 6.9 6.7
DC Unemployment insurance (state program)
Initial claims (monthly avg.) 2,101 1,784 1,915 1,851 1,652 1,414 1,518
1 year change 302 ‐317 131 ‐64 ‐287 ‐151 ‐144
% change 16.8 ‐15.1 7.3 ‐3.3 ‐14.8 ‐9.6 ‐8.7
Weeks compensated (mo. avg.) 46,423 45,170 42,862 42,133 35,185 30,161 26,007
1 year change ‐7,169 ‐1,253 ‐2,308 ‐729 ‐7,666 ‐8,862 ‐8,918
% change ‐13.4 ‐2.7 ‐5.1 ‐1.7 ‐17.9 ‐22.7 ‐25.5
Source: Labor force: BLS . Unemployment Insurance: US Dept of Labor. Not seasonally adj.
Table 6. Resident employment and unemployment: May 2015
(percent of labor force)
May 2014 May 2015 May 2014 May 2015
US 6.1 5.3 6.3 5.5
DC 7.4 6.7 7.8 7.3
DC metro area 5.0 4.7 na na
DC suburbs 4.7 4.4 na na
Source: U.S. BLS. na= data not available
Not seasonally adj. Seasonally adj.
Jurisdiction
Table 5. Unemployment rates for DC, metro area, and US:
May 2015
DC Economic and Revenue Trends: June 2015 5 DC Office of Revenue Analysis
Wages and salaries of DC residents continue to grow faster than all wages earned in DC
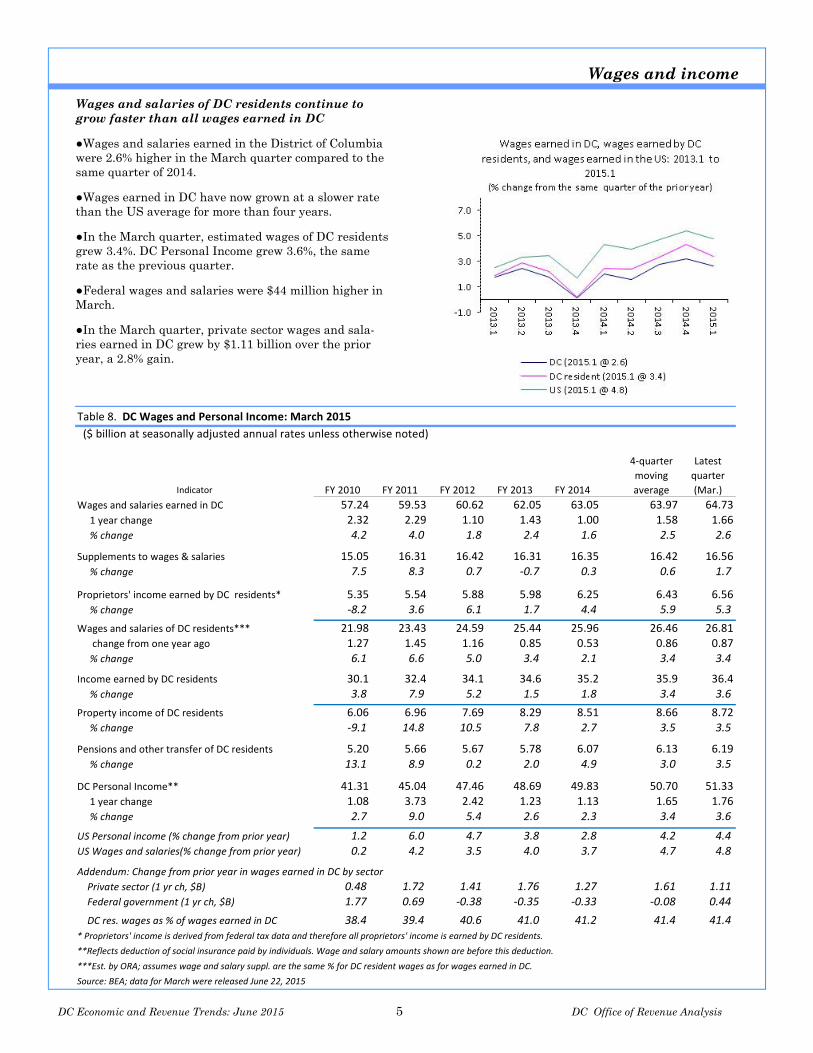
●Wages and salaries earned in the District of Columbia were 2.6% higher in the March quarter compared to the same quarter of 2014.
●Wages earned in DC have now grown at a slower rate than the US average for more than four years.
●In the March quarter, estimated wages of DC residents grew 3.4%. DC Personal Income grew 3.6%, the same rate as the previous quarter.
●Federal wages and salaries were $44 million higher in March.
●In the March quarter, private sector wages and sala-ries earned in DC grew by $1.11 billion over the prior year, a 2.8% gain.
Wages and income
Table 8. DC Wages and Personal Income: March 2015
($ billion at seasonally adjusted annual rates unless otherwise noted)
Indicator FY 2010 FY 2011 FY 2012 FY 2013 FY 2014
4‐quarter
moving
average
Latest
quarter
(Mar.)
Wages and salaries earned in DC 57.24 59.53 60.62 62.05 63.05 63.97 64.73 1 year change 2.32 2.29 1.10 1.43 1.00 1.58 1.66 % change 4.2 4.0 1.8 2.4 1.6 2.5 2.6
Supplements to wages & salaries 15.05 16.31 16.42 16.31 16.35 16.42 16.56 % change 7.5 8.3 0.7 ‐0.7 0.3 0.6 1.7
Proprietors' income earned by DC residents* 5.35 5.54 5.88 5.98 6.25 6.43 6.56 % change ‐8.2 3.6 6.1 1.7 4.4 5.9 5.3
Wages and salaries of DC residents*** 21.98 23.43 24.59 25.44 25.96 26.46 26.81 change from one year ago 1.27 1.45 1.16 0.85 0.53 0.86 0.87 % change 6.1 6.6 5.0 3.4 2.1 3.4 3.4
Income earned by DC residents 30.1 32.4 34.1 34.6 35.2 35.9 36.4 % change 3.8 7.9 5.2 1.5 1.8 3.4 3.6
Property income of DC residents 6.06 6.96 7.69 8.29 8.51 8.66 8.72 % change ‐9.1 14.8 10.5 7.8 2.7 3.5 3.5
Pensions and other transfer of DC residents 5.20 5.66 5.67 5.78 6.07 6.13 6.19 % change 13.1 8.9 0.2 2.0 4.9 3.0 3.5
DC Personal Income** 41.31 45.04 47.46 48.69 49.83 50.70 51.33 1 year change 1.08 3.73 2.42 1.23 1.13 1.65 1.76 % change 2.7 9.0 5.4 2.6 2.3 3.4 3.6
US Personal income (% change from prior year) 1.2 6.0 4.7 3.8 2.8 4.2 4.4US Wages and salaries(% change from prior year) 0.2 4.2 3.5 4.0 3.7 4.7 4.8
Addendum: Change from prior year in wages earned in DC by sector
Private sector (1 yr ch, $B) 0.48 1.72 1.41 1.76 1.27 1.61 1.11 Federal government (1 yr ch, $B) 1.77 0.69 ‐0.38 ‐0.35 ‐0.33 ‐0.08 0.44
DC res. wages as % of wages earned in DC 38.4 39.4 40.6 41.0 41.2 41.4 41.4* Proprietors' income is derived from federal tax data and therefore all proprietors' income is earned by DC residents.
**Reflects deduction of social insurance paid by individuals. Wage and salary amounts shown are before this deduction.
***Est. by ORA; assumes wage and salary suppl. are the same % for DC resident wages as for wages earned in DC.
Source: BEA; data for March were released June 22, 2015
DC Economic and Revenue Trends: June 2015 6 DC Office of Revenue Analysis
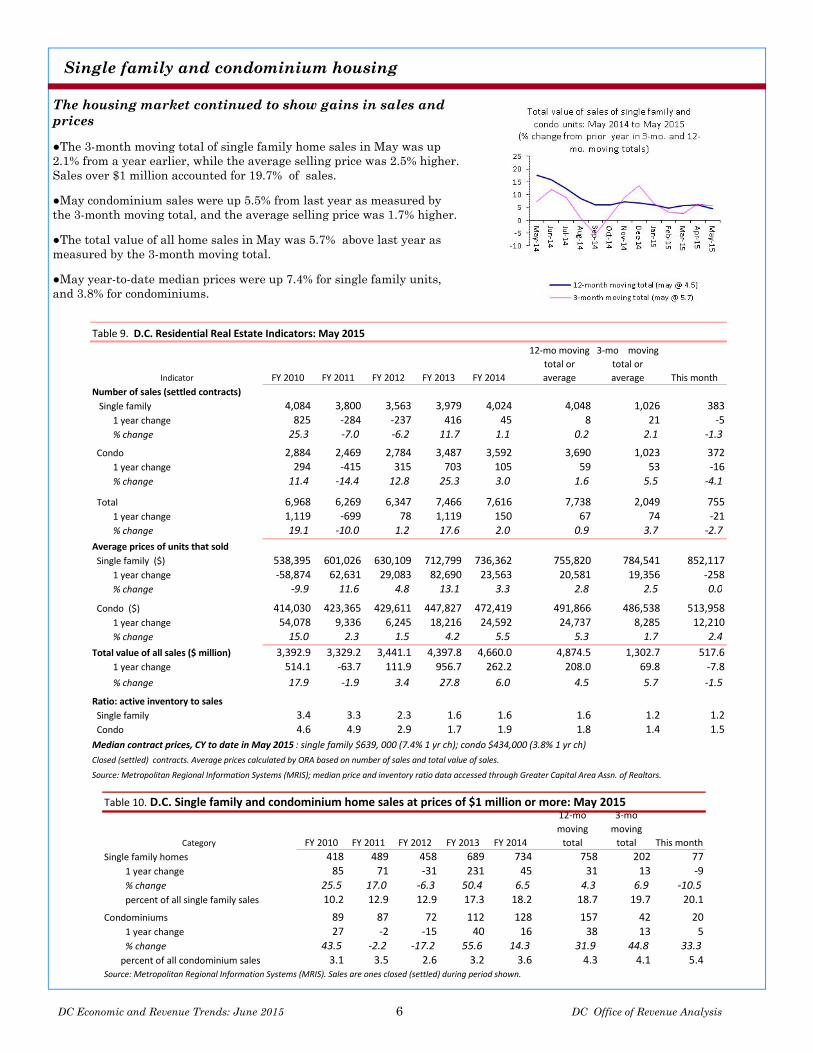
The housing market continued to show gains in sales and prices
●The 3-month moving total of single family home sales in May was up 2.1% from a year earlier, while the average selling price was 2.5% higher. Sales over $1 million accounted for 19.7% of sales.
●May condominium sales were up 5.5% from last year as measured by the 3-month moving total, and the average selling price was 1.7% higher.
●The total value of all home sales in May was 5.7% above last year as measured by the 3-month moving total.
●May year-to-date median prices were up 7.4% for single family units, and 3.8% for condominiums.
Single family and condominium housing
Category FY 2010 FY 2011 FY 2012 FY 2013 FY 2014
12‐mo
moving
total
3‐mo
moving
total This month
Single family homes 418 489 458 689 734 758 202 77 1 year change 85 71 ‐31 231 45 31 13 ‐9 % change 25.5 17.0 ‐6.3 50.4 6.5 4.3 6.9 ‐10.5 percent of all single family sales 10.2 12.9 12.9 17.3 18.2 18.7 19.7 20.1
Condominiums 89 87 72 112 128 157 42 20 1 year change 27 ‐2 ‐15 40 16 38 13 5 % change 43.5 ‐2.2 ‐17.2 55.6 14.3 31.9 44.8 33.3 percent of all condominium sales 3.1 3.5 2.6 3.2 3.6 4.3 4.1 5.4Source: Metropolitan Regional Information Systems (MRIS). Sales are ones closed (settled) during period shown.
Table 10. D.C. Single family and condominium home sales at prices of $1 million or more: May 2015
Indicator FY 2010 FY 2011 FY 2012 FY 2013 FY 2014
12‐mo moving
total or
average
3‐mo moving
total or
average This month
Number of sales (settled contracts)
Single family 4,084 3,800 3,563 3,979 4,024 4,048 1,026 383
1 year change 825 ‐284 ‐237 416 45 8 21 ‐5 % change 25.3 ‐7.0 ‐6.2 11.7 1.1 0.2 2.1 ‐1.3
Condo 2,884 2,469 2,784 3,487 3,592 3,690 1,023 372 1 year change 294 ‐415 315 703 105 59 53 ‐16
% change 11.4 ‐14.4 12.8 25.3 3.0 1.6 5.5 ‐4.1
Total 6,968 6,269 6,347 7,466 7,616 7,738 2,049 755 1 year change 1,119 ‐699 78 1,119 150 67 74 ‐21 % change 19.1 ‐10.0 1.2 17.6 2.0 0.9 3.7 ‐2.7
Average prices of units that sold
Single family ($) 538,395 601,026 630,109 712,799 736,362 755,820 784,541 852,117 1 year change ‐58,874 62,631 29,083 82,690 23,563 20,581 19,356 ‐258 % change ‐9.9 11.6 4.8 13.1 3.3 2.8 2.5 0.0
Condo ($) 414,030 423,365 429,611 447,827 472,419 491,866 486,538 513,958 1 year change 54,078 9,336 6,245 18,216 24,592 24,737 8,285 12,210 % change 15.0 2.3 1.5 4.2 5.5 5.3 1.7 2.4
Total value of all sales ($ million) 3,392.9 3,329.2 3,441.1 4,397.8 4,660.0 4,874.5 1,302.7 517.6 1 year change 514.1 ‐63.7 111.9 956.7 262.2 208.0 69.8 ‐7.8
% change 17.9 ‐1.9 3.4 27.8 6.0 4.5 5.7 ‐1.5
Ratio: active inventory to sales
Single family 3.4 3.3 2.3 1.6 1.6 1.6 1.2 1.2 Condo 4.6 4.9 2.9 1.7 1.9 1.8 1.4 1.5
Source: Metropolitan Regional Information Systems (MRIS); median price and inventory ratio data accessed through Greater Capital Area Assn. of Realtors.
Median contract prices, CY to date in May 2015 : single family $639, 000 (7.4% 1 yr ch); condo $434,000 (3.8% 1 yr ch)
Closed (settled) contracts. Average prices calculated by ORA based on number of sales and total value of sales.
Table 9. D.C. Residential Real Estate Indicators: May 2015
DC Economic and Revenue Trends: June 2015 7 DC Office of Revenue Analysis
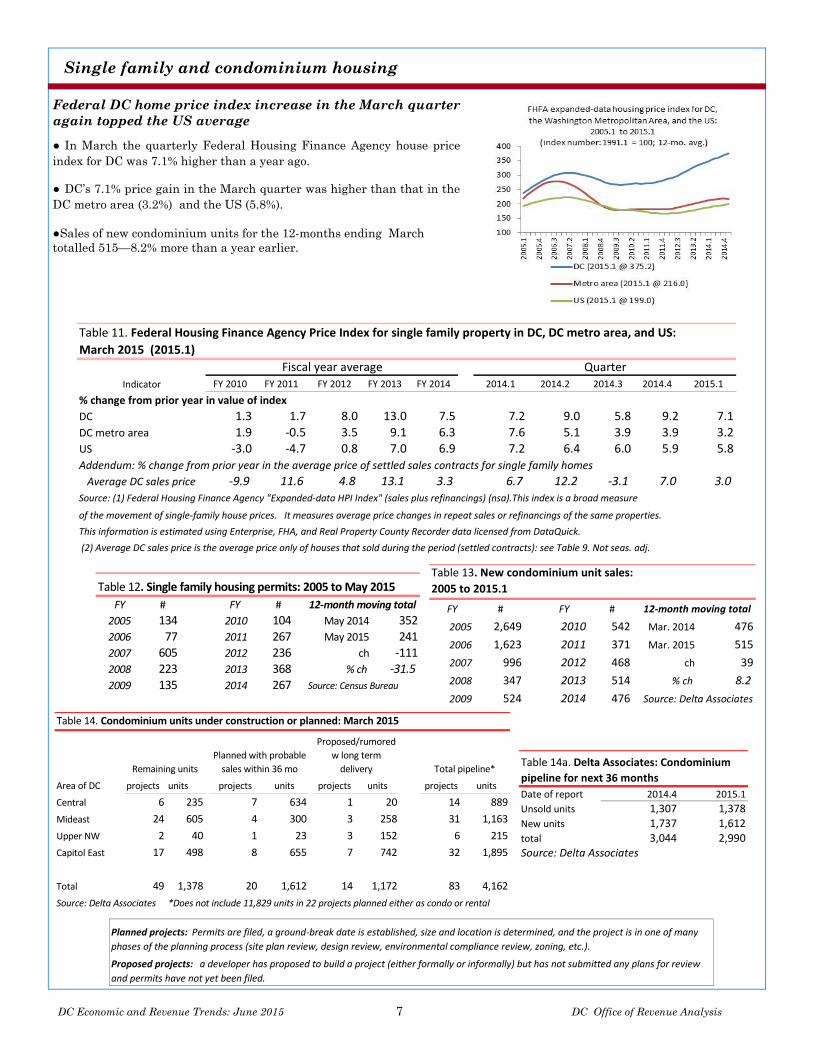
Federal DC home price index increase in the March quarter again topped the US average
● In March the quarterly Federal Housing Finance Agency house price index for DC was 7.1% higher than a year ago. ● DC’s 7.1% price gain in the March quarter was higher than that in the DC metro area (3.2%) and the US (5.8%). ●Sales of new condominium units for the 12-months ending March totalled 515—8.2% more than a year earlier.
Single family and condominium housing
Planned projects: Permits are filed, a ground‐break date is established, size and location is determined, and the project is in one of many
phases of the planning process (site plan review, design review, environmental compliance review, zoning, etc.).
Proposed projects: a developer has proposed to build a project (either formally or informally) but has not submitted any plans for review
and permits have not yet been filed.
FY # FY # 12‐month moving total
2005 2,649 2010 542 Mar. 2014 476
2006 1,623 2011 371 Mar. 2015 515
2007 996 2012 468 ch 39
2008 347 2013 514 % ch 8.2
2009 524 2014 476 Source: Delta Associates
Table 13. New condominium unit sales:
2005 to 2015.1
Area of DC projects units projects units projects units projects units
Central 6 235 7 634 1 20 14 889
Mideast 24 605 4 300 3 258 31 1,163
Upper NW 2 40 1 23 3 152 6 215
Capitol East 17 498 8 655 7 742 32 1,895
Total 49 1,378 20 1,612 14 1,172 83 4,162
Source: Delta Associates *Does not include 11,829 units in 22 projects planned either as condo or rental
Table 14. Condominium units under construction or planned: March 2015
Remaining units
Planned with probable
sales within 36 mo
Proposed/rumored
w long term
delivery Total pipeline*
Date of report 2014.4 2015.1
Unsold units 1,307 1,378New units 1,737 1,612total 3,044 2,990Source: Delta Associates
Table 14a. Delta Associates: Condominium
pipeline for next 36 months
FY 2010 FY 2011 FY 2012 FY 2013 FY 2014 2014.1 2014.2 2014.3 2014.4 2015.1
% change from prior year in value of index
DC 1.3 1.7 8.0 13.0 7.5 7.2 9.0 5.8 9.2 7.1DC metro area 1.9 ‐0.5 3.5 9.1 6.3 7.6 5.1 3.9 3.9 3.2US ‐3.0 ‐4.7 0.8 7.0 6.9 7.2 6.4 6.0 5.9 5.8Addendum: % change from prior year in the average price of settled sales contracts for single family homes
Average DC sales price ‐9.9 11.6 4.8 13.1 3.3 6.7 12.2 ‐3.1 7.0 3.0Source: (1) Federal Housing Finance Agency "Expanded‐data HPI Index" (sales plus refinancings) (nsa).This index is a broad measure
This information is estimated using Enterprise, FHA, and Real Property County Recorder data licensed from DataQuick.
(2) Average DC sales price is the average price only of houses that sold during the period (settled contracts): see Table 9. Not seas. adj.
Indicator
Quarter
of the movement of single‐family house prices. It measures average price changes in repeat sales or refinancings of the same properties.
Table 11. Federal Housing Finance Agency Price Index for single family property in DC, DC metro area, and US:
March 2015 (2015.1)
Fiscal year average
FY # FY #
2005 134 2010 104 May 2014 3522006 77 2011 267 May 2015 2412007 605 2012 236 ch ‐1112008 223 2013 368 % ch ‐31.5
2009 135 2014 267 Source: Census Bureau
Table 12. Single family housing permits: 2005 to May 2015
12‐month moving total
DC Economic and Revenue Trends: June 2015 8 DC Office of Revenue Analysis
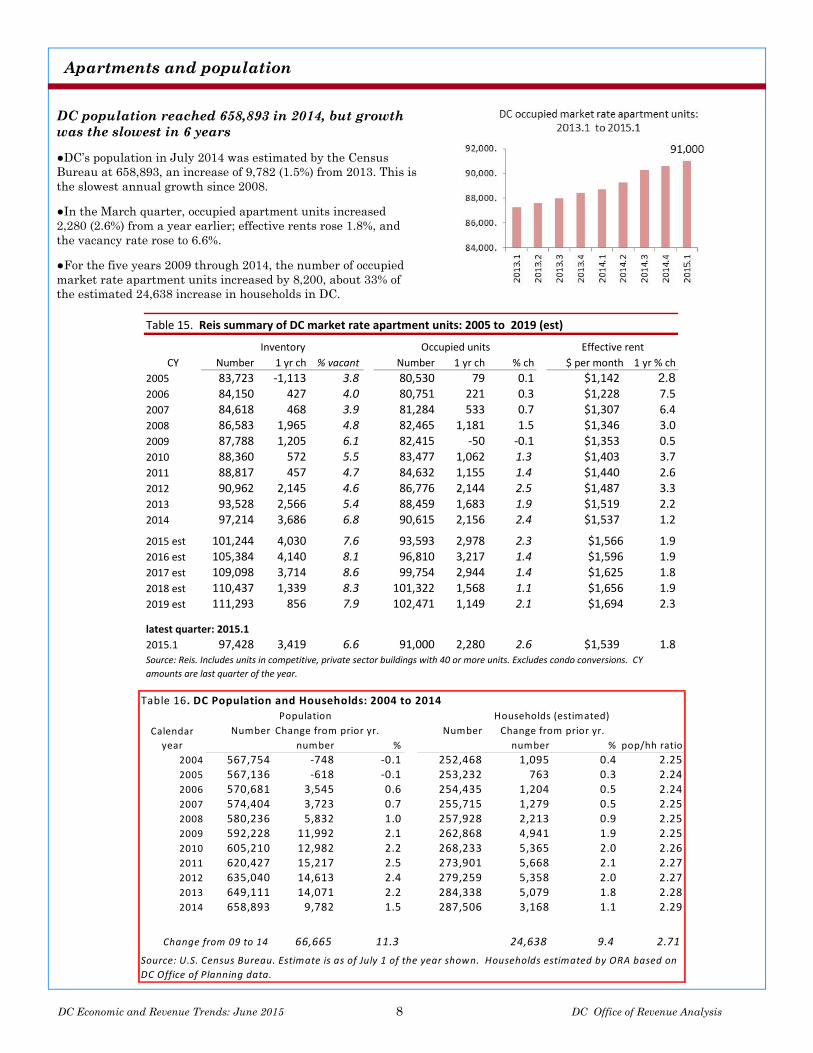
DC population reached 658,893 in 2014, but growth was the slowest in 6 years
●DC’s population in July 2014 was estimated by the Census Bureau at 658,893, an increase of 9,782 (1.5%) from 2013. This is the slowest annual growth since 2008.
●In the March quarter, occupied apartment units increased 2,280 (2.6%) from a year earlier; effective rents rose 1.8%, and the vacancy rate rose to 6.6%.
●For the five years 2009 through 2014, the number of occupied market rate apartment units increased by 8,200, about 33% of the estimated 24,638 increase in households in DC.
Apartments and population
Number Change from prior yr. Number
number % number %
2004 567,754 ‐748 ‐0.1 252,468 1,095 0.4 2.252005 567,136 ‐618 ‐0.1 253,232 763 0.3 2.242006 570,681 3,545 0.6 254,435 1,204 0.5 2.242007 574,404 3,723 0.7 255,715 1,279 0.5 2.252008 580,236 5,832 1.0 257,928 2,213 0.9 2.252009 592,228 11,992 2.1 262,868 4,941 1.9 2.252010 605,210 12,982 2.2 268,233 5,365 2.0 2.262011 620,427 15,217 2.5 273,901 5,668 2.1 2.272012 635,040 14,613 2.4 279,259 5,358 2.0 2.272013 649,111 14,071 2.2 284,338 5,079 1.8 2.282014 658,893 9,782 1.5 287,506 3,168 1.1 2.29
66,665 11.3 24,638 9.4 2.71
Source: U.S. Census Bureau. Estimate is as of July 1 of the year shown. Households estimated by ORA based on
DC Office of Planning data.
Table 16. DC Population and Households: 2004 to 2014
Population Households (estimated)
Change from prior yr.
Change from 09 to 14
Calendar
year pop/hh ratio
CY Number 1 yr ch % vacant Number 1 yr ch % ch $ per month 1 yr % ch
2005 83,723 ‐1,113 3.8 80,530 79 0.1 $1,142 2.82006 84,150 427 4.0 80,751 221 0.3 $1,228 7.52007 84,618 468 3.9 81,284 533 0.7 $1,307 6.4
2008 86,583 1,965 4.8 82,465 1,181 1.5 $1,346 3.0
2009 87,788 1,205 6.1 82,415 ‐50 ‐0.1 $1,353 0.5
2010 88,360 572 5.5 83,477 1,062 1.3 $1,403 3.7
2011 88,817 457 4.7 84,632 1,155 1.4 $1,440 2.62012 90,962 2,145 4.6 86,776 2,144 2.5 $1,487 3.32013 93,528 2,566 5.4 88,459 1,683 1.9 $1,519 2.22014 97,214 3,686 6.8 90,615 2,156 2.4 $1,537 1.2
2015 est 101,244 4,030 7.6 93,593 2,978 2.3 $1,566 1.92016 est 105,384 4,140 8.1 96,810 3,217 1.4 $1,596 1.92017 est 109,098 3,714 8.6 99,754 2,944 1.4 $1,625 1.8
2018 est 110,437 1,339 8.3 101,322 1,568 1.1 $1,656 1.9
2019 est 111,293 856 7.9 102,471 1,149 2.1 $1,694 2.3
latest quarter: 2015.1
2015.1 97,428 3,419 6.6 91,000 2,280 2.6 $1,539 1.8
Table 15. Reis summary of DC market rate apartment units: 2005 to 2019 (est)
Source: Reis. Includes units in competitive, private sector buildings with 40 or more units. Excludes condo conversions. CY
amounts are last quarter of the year.
Inventory Occupied units Effective rent
DC Economic and Revenue Trends: June 2015 9 DC Office of Revenue Analysis
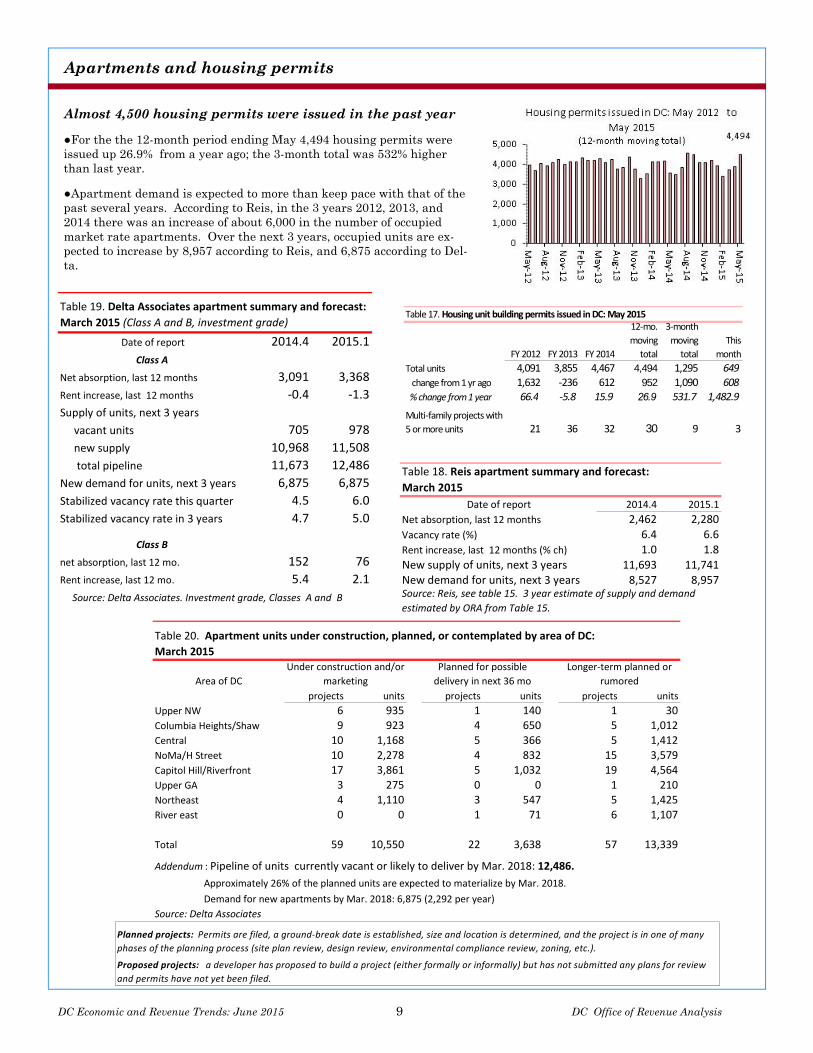
Almost 4,500 housing permits were issued in the past year
●For the the 12-month period ending May 4,494 housing permits were issued up 26.9% from a year ago; the 3-month total was 532% higher than last year.
●Apartment demand is expected to more than keep pace with that of the past several years. According to Reis, in the 3 years 2012, 2013, and 2014 there was an increase of about 6,000 in the number of occupied market rate apartments. Over the next 3 years, occupied units are ex-pected to increase by 8,957 according to Reis, and 6,875 according to Del-ta.
Apartments and housing permits
Planned projects: Permits are filed, a ground‐break date is established, size and location is determined, and the project is in one of many
phases of the planning process (site plan review, design review, environmental compliance review, zoning, etc.).
Proposed projects: a developer has proposed to build a project (either formally or informally) but has not submitted any plans for review
and permits have not yet been filed.
Date of report 2014.4 2015.1
Class A
Net absorption, last 12 months 3,091 3,368
Rent increase, last 12 months ‐0.4 ‐1.3
Supply of units, next 3 years
vacant units 705 978
new supply 10,968 11,508
total pipeline 11,673 12,486
New demand for units, next 3 years 6,875 6,875
Stabilized vacancy rate this quarter 4.5 6.0
Stabilized vacancy rate in 3 years 4.7 5.0
Class B
net absorption, last 12 mo. 152 76
Rent increase, last 12 mo. 5.4 2.1
Table 19. Delta Associates apartment summary and forecast:
March 2015 (Class A and B, investment grade)
Source: Delta Associates. Investment grade, Classes A and B
Date of report 2014.4 2015.1
Net absorption, last 12 months 2,462 2,280
Vacancy rate (%) 6.4 6.6Rent increase, last 12 months (% ch) 1.0 1.8New supply of units, next 3 years 11,693 11,741New demand for units, next 3 years 8,527 8,957
Table 18. Reis apartment summary and forecast:
March 2015
Source: Reis, see table 15. 3 year estimate of supply and demand
estimated by ORA from Table 15.
Area of DC
projects units projects units projects units
Upper NW 6 935 1 140 1 30Columbia Heights/Shaw 9 923 4 650 5 1,012Central 10 1,168 5 366 5 1,412NoMa/H Street 10 2,278 4 832 15 3,579Capitol Hill/Riverfront 17 3,861 5 1,032 19 4,564Upper GA 3 275 0 0 1 210Northeast 4 1,110 3 547 5 1,425River east 0 0 1 71 6 1,107
Total 59 10,550 22 3,638 57 13,339
Source: Delta Associates
Demand for new apartments by Mar. 2018: 6,875 (2,292 per year)
Approximately 26% of the planned units are expected to materialize by Mar. 2018.
Table 20. Apartment units under construction, planned, or contemplated by area of DC:
March 2015 Under construction and/or
marketing
Planned for possible
delivery in next 36 mo
Longer‐term planned or
rumored
Addendum : Pipeline of units currently vacant or likely to deliver by Mar. 2018: 12,486.
FY 2012 FY 2013 FY 2014
12‐mo.
moving
total
3‐month
moving
total
This
month
Total units 4,091 3,855 4,467 4,494 1,295 649
change from 1 yr ago 1,632 ‐236 612 952 1,090 608 % change from 1 year 66.4 ‐5.8 15.9 26.9 531.7 1,482.9
Multi‐family projects with
5 or more units 21 36 32 30 9 3
Table 17. Housing unit building permits issued in DC: May 2015
DC Economic and Revenue Trends: June 2015 10 DC Office of Revenue Analysis
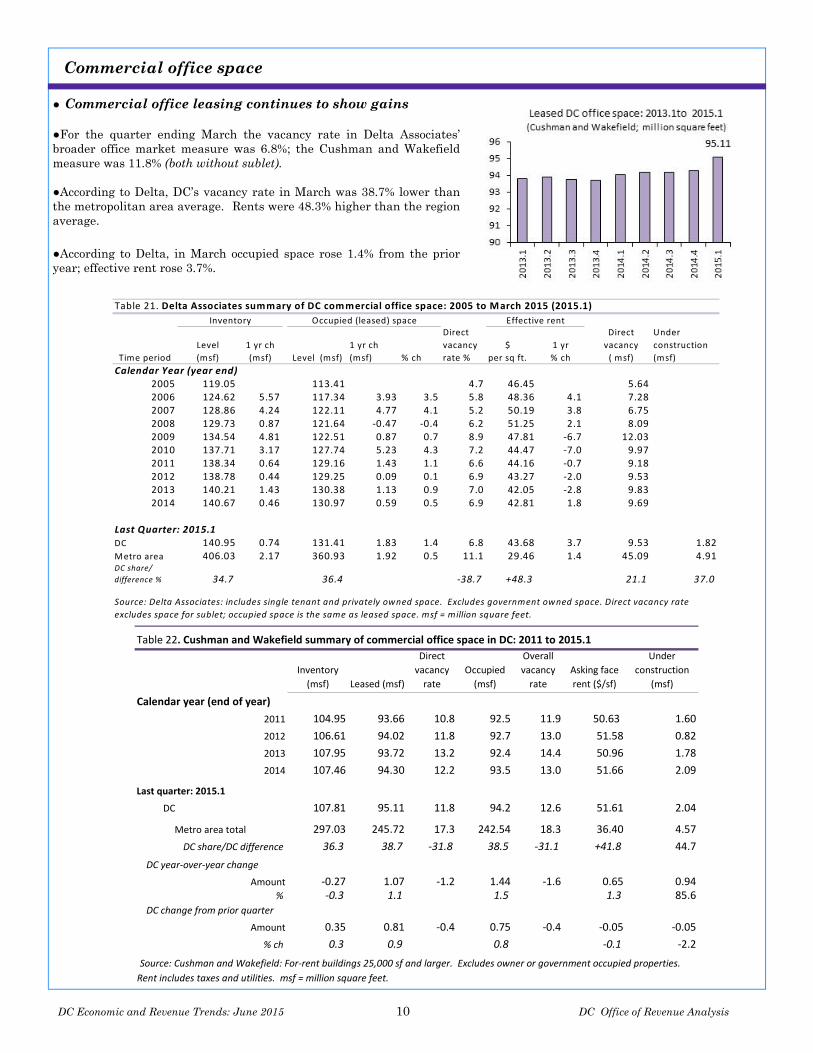
● Commercial office leasing continues to show gains ●For the quarter ending March the vacancy rate in Delta Associates’ broader office market measure was 6.8%; the Cushman and Wakefield measure was 11.8% (both without sublet). ●According to Delta, DC’s vacancy rate in March was 38.7% lower than the metropolitan area average. Rents were 48.3% higher than the region average. ●According to Delta, in March occupied space rose 1.4% from the prior year; effective rent rose 3.7%.
Commercial office space
Time period
Level
(msf)
1 yr ch
(msf) Level (msf)
1 yr ch
(msf) % ch
$
per sq ft.
1 yr
% ch
Calendar Year (year end)2005 119.05 113.41 4.7 46.45 5.642006 124.62 5.57 117.34 3.93 3.5 5.8 48.36 4.1 7.282007 128.86 4.24 122.11 4.77 4.1 5.2 50.19 3.8 6.752008 129.73 0.87 121.64 ‐0.47 ‐0.4 6.2 51.25 2.1 8.092009 134.54 4.81 122.51 0.87 0.7 8.9 47.81 ‐6.7 12.032010 137.71 3.17 127.74 5.23 4.3 7.2 44.47 ‐7.0 9.972011 138.34 0.64 129.16 1.43 1.1 6.6 44.16 ‐0.7 9.182012 138.78 0.44 129.25 0.09 0.1 6.9 43.27 ‐2.0 9.532013 140.21 1.43 130.38 1.13 0.9 7.0 42.05 ‐2.8 9.832014 140.67 0.46 130.97 0.59 0.5 6.9 42.81 1.8 9.69
Last Quarter: 2015.1DC 140.95 0.74 131.41 1.83 1.4 6.8 43.68 3.7 9.53 1.82Metro area 406.03 2.17 360.93 1.92 0.5 11.1 29.46 1.4 45.09 4.91DC share/
difference % 34.7 36.4 ‐38.7 +48.3 21.1 37.0
Source: Delta Associates: includes single tenant and privately owned space. Excludes government owned space. Direct vacancy rate
excludes space for sublet; occupied space is the same as leased space. msf = million square feet.
Table 21. Delta Associates summary of DC commercial office space: 2005 to March 2015 (2015.1)
Inventory Occupied (leased) spaceDirect
vacancy
rate %
Effective rentDirect
vacancy
( msf)
Under
construction
(msf)
Inventory
(msf) Leased (msf)
Direct
vacancy
rate
Occupied
(msf)
Overall
vacancy
rate
Asking face
rent ($/sf)
Under
construction
(msf)
Calendar year (end of year)
2011 104.95 93.66 10.8 92.5 11.9 50.63 1.60
2012 106.61 94.02 11.8 92.7 13.0 51.58 0.82
2013 107.95 93.72 13.2 92.4 14.4 50.96 1.78
2014 107.46 94.30 12.2 93.5 13.0 51.66 2.09
Last quarter: 2015.1
DC 107.81 95.11 11.8 94.2 12.6 51.61 2.04
Metro area total 297.03 245.72 17.3 242.54 18.3 36.40 4.57
DC share/DC difference 36.3 38.7 ‐31.8 38.5 ‐31.1 +41.8 44.7
DC year‐over‐year change
Amount ‐0.27 1.07 ‐1.2 1.44 ‐1.6 0.65 0.94 % ‐0.3 1.1 1.5 1.3 85.6
DC change from prior quarter
Amount 0.35 0.81 ‐0.4 0.75 ‐0.4 ‐0.05 ‐0.05
% ch 0.3 0.9 0.8 ‐0.1 ‐2.2
Table 22. Cushman and Wakefield summary of commercial office space in DC: 2011 to 2015.1
Source: Cushman and Wakefield: For‐rent buildings 25,000 sf and larger. Excludes owner or government occupied properties.
Rent includes taxes and utilities. msf = million square feet.
DC Economic and Revenue Trends: June 2015 11 DC Office of Revenue Analysis
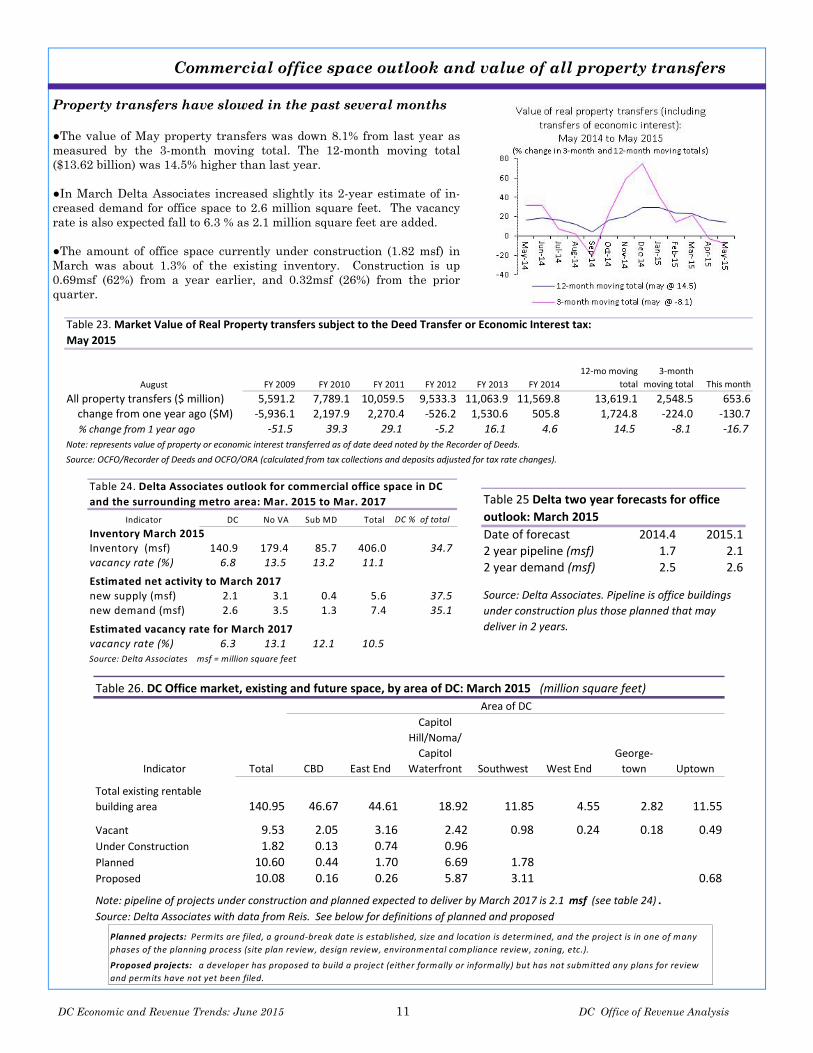
Property transfers have slowed in the past several months ●The value of May property transfers was down 8.1% from last year as measured by the 3-month moving total. The 12-month moving total ($13.62 billion) was 14.5% higher than last year. ●In March Delta Associates increased slightly its 2-year estimate of in-creased demand for office space to 2.6 million square feet. The vacancy rate is also expected fall to 6.3 % as 2.1 million square feet are added. ●The amount of office space currently under construction (1.82 msf) in March was about 1.3% of the existing inventory. Construction is up 0.69msf (62%) from a year earlier, and 0.32msf (26%) from the prior quarter.
Commercial office space outlook and value of all property transfers
Planned projects: Permits are filed, a ground‐break date is established, size and location is determined, and the project is in one of many
phases of the planning process (site plan review, design review, environmental compliance review, zoning, etc.).
Proposed projects: a developer has proposed to build a project (either formally or informally) but has not submitted any plans for review
and permits have not yet been filed.
Date of forecast 2014.4 2015.12 year pipeline (msf) 1.7 2.12 year demand (msf) 2.5 2.6
Table 25 Delta two year forecasts for office
outlook: March 2015
Source: Delta Associates. Pipeline is office buildings
under construction plus those planned that may
deliver in 2 years.
Indicator CBD East End
Capitol
Hill/Noma/
Capitol
Waterfront Southwest West End
George‐
town Uptown
Total existing rentable
building area 140.95 46.67 44.61 18.92 11.85 4.55 2.82 11.55
Vacant 9.53 2.05 3.16 2.42 0.98 0.24 0.18 0.49Under Construction 1.82 0.13 0.74 0.96Planned 10.60 0.44 1.70 6.69 1.78Proposed 10.08 0.16 0.26 5.87 3.11 0.68
Note: pipeline of projects under construction and planned expected to deliver by March 2017 is 2.1 msf (see table 24) .
Source: Delta Associates with data from Reis. See below for definitions of planned and proposed
Table 26. DC Office market, existing and future space, by area of DC: March 2015 (million square feet)
Total
Area of DC
Indicator DC No VA Sub MD Total DC % of total
Inventory March 2015Inventory (msf) 140.9 179.4 85.7 406.0 34.7vacancy rate (%) 6.8 13.5 13.2 11.1
Estimated net activity to March 2017new supply (msf) 2.1 3.1 0.4 5.6 37.5new demand (msf) 2.6 3.5 1.3 7.4 35.1
Estimated vacancy rate for March 2017vacancy rate (%) 6.3 13.1 12.1 10.5Source: Delta Associates msf = million square feet
Table 24. Delta Associates outlook for commercial office space in DC
and the surrounding metro area: Mar. 2015 to Mar. 2017
August FY 2009 FY 2010 FY 2011 FY 2012 FY 2013 FY 2014
12‐mo moving
total
3‐month
moving total This month
All property transfers ($ million) 5,591.2 7,789.1 10,059.5 9,533.3 11,063.9 11,569.8 13,619.1 2,548.5 653.6 change from one year ago ($M) ‐5,936.1 2,197.9 2,270.4 ‐526.2 1,530.6 505.8 1,724.8 ‐224.0 ‐130.7 % change from 1 year ago ‐51.5 39.3 29.1 ‐5.2 16.1 4.6 14.5 ‐8.1 ‐16.7Note: represents value of property or economic interest transferred as of date deed noted by the Recorder of Deeds.
Source: OCFO/Recorder of Deeds and OCFO/ORA (calculated from tax collections and deposits adjusted for tax rate changes).
Table 23. Market Value of Real Property transfers subject to the Deed Transfer or Economic Interest tax:
May 2015
DC Economic and Revenue Trends: June 2015 12 DC Office of Revenue Analysis
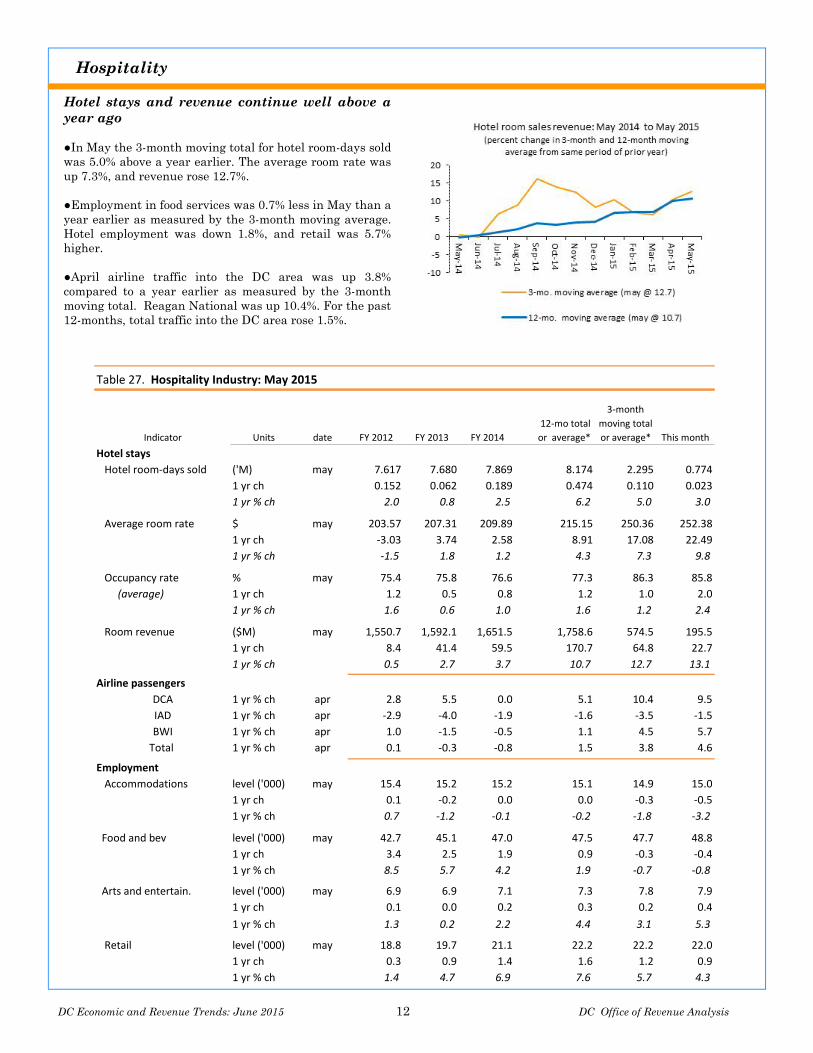
Hotel stays and revenue continue well above a year ago ●In May the 3-month moving total for hotel room-days sold was 5.0% above a year earlier. The average room rate was up 7.3%, and revenue rose 12.7%. ●Employment in food services was 0.7% less in May than a year earlier as measured by the 3-month moving average. Hotel employment was down 1.8%, and retail was 5.7% higher. ●April airline traffic into the DC area was up 3.8% compared to a year earlier as measured by the 3-month moving total. Reagan National was up 10.4%. For the past 12-months, total traffic into the DC area rose 1.5%.
Hospitality
Table 27. Hospitality Industry: May 2015
Hotel stays
Hotel room‐days sold ('M) may 7.617 7.680 7.869 8.174 2.295 0.774
1 yr ch 0.152 0.062 0.189 0.474 0.110 0.023
1 yr % ch 2.0 0.8 2.5 6.2 5.0 3.0
Average room rate $ may 203.57 207.31 209.89 215.15 250.36 252.38
1 yr ch ‐3.03 3.74 2.58 8.91 17.08 22.49
1 yr % ch ‐1.5 1.8 1.2 4.3 7.3 9.8
Occupancy rate % may 75.4 75.8 76.6 77.3 86.3 85.8
(average) 1 yr ch 1.2 0.5 0.8 1.2 1.0 2.0
1 yr % ch 1.6 0.6 1.0 1.6 1.2 2.4
Room revenue ($M) may 1,550.7 1,592.1 1,651.5 1,758.6 574.5 195.5
1 yr ch 8.4 41.4 59.5 170.7 64.8 22.7
1 yr % ch 0.5 2.7 3.7 10.7 12.7 13.1
Airline passengers
DCA 1 yr % ch apr 2.8 5.5 0.0 5.1 10.4 9.5
IAD 1 yr % ch apr ‐2.9 ‐4.0 ‐1.9 ‐1.6 ‐3.5 ‐1.5
BWI 1 yr % ch apr 1.0 ‐1.5 ‐0.5 1.1 4.5 5.7
Total 1 yr % ch apr 0.1 ‐0.3 ‐0.8 1.5 3.8 4.6
Employment
Accommodations level ('000) may 15.4 15.2 15.2 15.1 14.9 15.0
1 yr ch 0.1 ‐0.2 0.0 0.0 ‐0.3 ‐0.5
1 yr % ch 0.7 ‐1.2 ‐0.1 ‐0.2 ‐1.8 ‐3.2
Food and bev level ('000) may 42.7 45.1 47.0 47.5 47.7 48.8
1 yr ch 3.4 2.5 1.9 0.9 ‐0.3 ‐0.4
1 yr % ch 8.5 5.7 4.2 1.9 ‐0.7 ‐0.8
Arts and entertain. level ('000) may 6.9 6.9 7.1 7.3 7.8 7.9
1 yr ch 0.1 0.0 0.2 0.3 0.2 0.4
1 yr % ch 1.3 0.2 2.2 4.4 3.1 5.3
Retail level ('000) may 18.8 19.7 21.1 22.2 22.2 22.0
1 yr ch 0.3 0.9 1.4 1.6 1.2 0.9
1 yr % ch 1.4 4.7 6.9 7.6 5.7 4.3
Indicator Units date
3‐month
moving total
or average*FY 2012 This month
12‐mo total
or average* FY 2013 FY 2014
DC Economic and Revenue Trends: June 2015 13 DC Office of Revenue Analysis
US economic growth down 0.2% in the first quarter of 2015
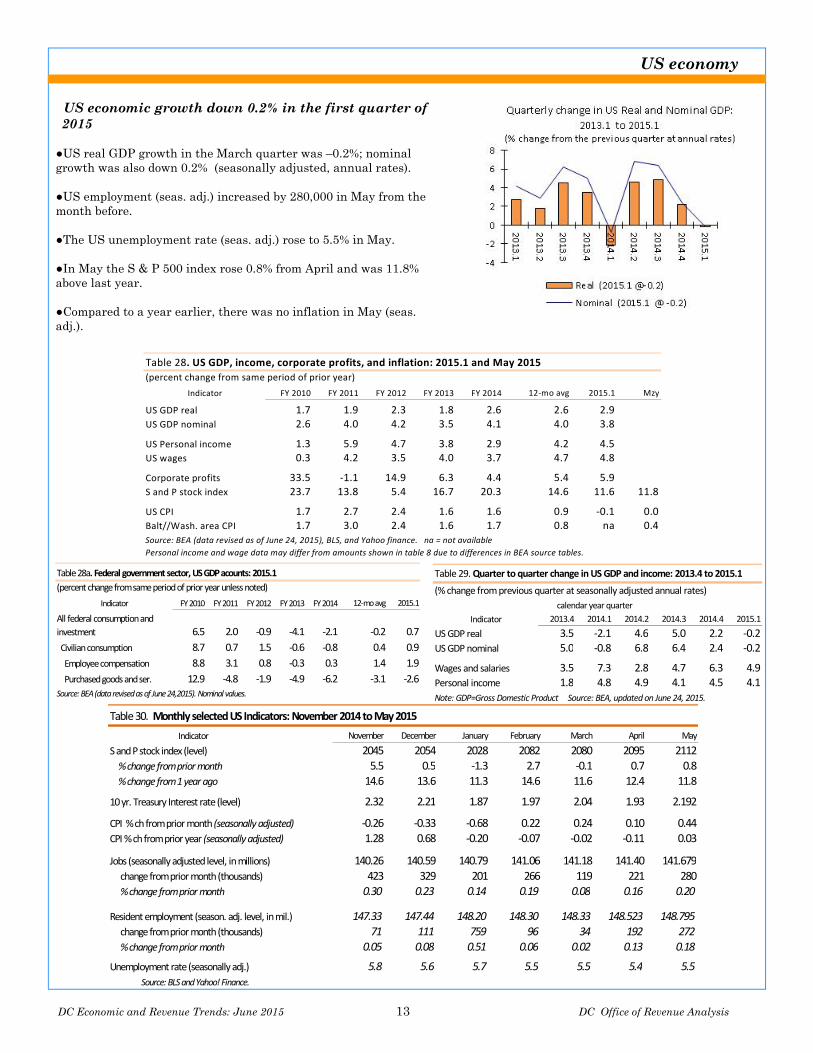
●US real GDP growth in the March quarter was –0.2%; nominal growth was also down 0.2% (seasonally adjusted, annual rates). ●US employment (seas. adj.) increased by 280,000 in May from the month before. ●The US unemployment rate (seas. adj.) rose to 5.5% in May. ●In May the S & P 500 index rose 0.8% from April and was 11.8% above last year. ●Compared to a year earlier, there was no inflation in May (seas. adj.).
US economy
(percent change from same period of prior year unless noted)
Indicator FY 2010 FY 2011 FY 2012 FY 2013 FY 2014 12‐mo avg 2015.1
All federal consumption and
investment 6.5 2.0 ‐0.9 ‐4.1 ‐2.1 ‐0.2 0.7
Civilian consumption 8.7 0.7 1.5 ‐0.6 ‐0.8 0.4 0.9
Employee compensation 8.8 3.1 0.8 ‐0.3 0.3 1.4 1.9
Purchased goods and ser. 12.9 ‐4.8 ‐1.9 ‐4.9 ‐6.2 ‐3.1 ‐2.6Source: BEA (data revised as of June 24,2015). Nominal values.
Table 28a. Federal government sector, US GDP acounts: 2015.1 Table 29. Quarter to quarter change in US GDP and income: 2013.4 to 2015.1
(% change from previous quarter at seasonally adjusted annual rates)
2013.4 2014.1 2014.2 2014.3 2014.4 2015.1
US GDP real 3.5 ‐2.1 4.6 5.0 2.2 ‐0.2US GDP nominal 5.0 ‐0.8 6.8 6.4 2.4 ‐0.2
Wages and salaries 3.5 7.3 2.8 4.7 6.3 4.9Personal income 1.8 4.8 4.9 4.1 4.5 4.1Note: GDP=Gross Domestic Product Source: BEA, updated on June 24, 2015.
calendar year quarter
Indicator
(percent change from same period of prior year)
Indicator FY 2010 FY 2011 FY 2012 FY 2013 FY 2014 12‐mo avg 2015.1 Mzy
US GDP real 1.7 1.9 2.3 1.8 2.6 2.6 2.9US GDP nominal 2.6 4.0 4.2 3.5 4.1 4.0 3.8
US Personal income 1.3 5.9 4.7 3.8 2.9 4.2 4.5US wages 0.3 4.2 3.5 4.0 3.7 4.7 4.8
Corporate profits 33.5 ‐1.1 14.9 6.3 4.4 5.4 5.9S and P stock index 23.7 13.8 5.4 16.7 20.3 14.6 11.6 11.8
US CPI 1.7 2.7 2.4 1.6 1.6 0.9 ‐0.1 0.0Balt//Wash. area CPI 1.7 3.0 2.4 1.6 1.7 0.8 na 0.4Source: BEA (data revised as of June 24, 2015), BLS, and Yahoo finance. na = not available
Personal income and wage data may differ from amounts shown in table 8 due to differences in BEA source tables.
Table 28. US GDP, income, corporate profits, and inflation: 2015.1 and May 2015
Table 30. Monthly selected US Indicators: November 2014 to May 2015
Indicator November December January February March April May
S and P stock index (level) 2045 2054 2028 2082 2080 2095 2112 % change from prior month 5.5 0.5 ‐1.3 2.7 ‐0.1 0.7 0.8 % change from 1 year ago 14.6 13.6 11.3 14.6 11.6 12.4 11.8
10 yr. Treasury Interest rate (level) 2.32 2.21 1.87 1.97 2.04 1.93 2.192
CPI % ch from prior month (seasonally adjusted) ‐0.26 ‐0.33 ‐0.68 0.22 0.24 0.10 0.44CPI % ch from prior year (seasonally adjusted) 1.28 0.68 ‐0.20 ‐0.07 ‐0.02 ‐0.11 0.03
Jobs (seasonally adjusted level, in millions) 140.26 140.59 140.79 141.06 141.18 141.40 141.679 change from prior month (thousands) 423 329 201 266 119 221 280 % change from prior month 0.30 0.23 0.14 0.19 0.08 0.16 0.20
Resident employment (season. adj. level, in mil.) 147.33 147.44 148.20 148.30 148.33 148.523 148.795 change from prior month (thousands) 71 111 759 96 34 192 272 % change from prior month 0.05 0.08 0.51 0.06 0.02 0.13 0.18
Unemployment rate (seasonally adj.) 5.8 5.6 5.7 5.5 5.5 5.4 5.5 Source: BLS and Yahoo! Finance.
DC Economic and Revenue Trends: June 2015 14 DC Office of Revenue Analysis
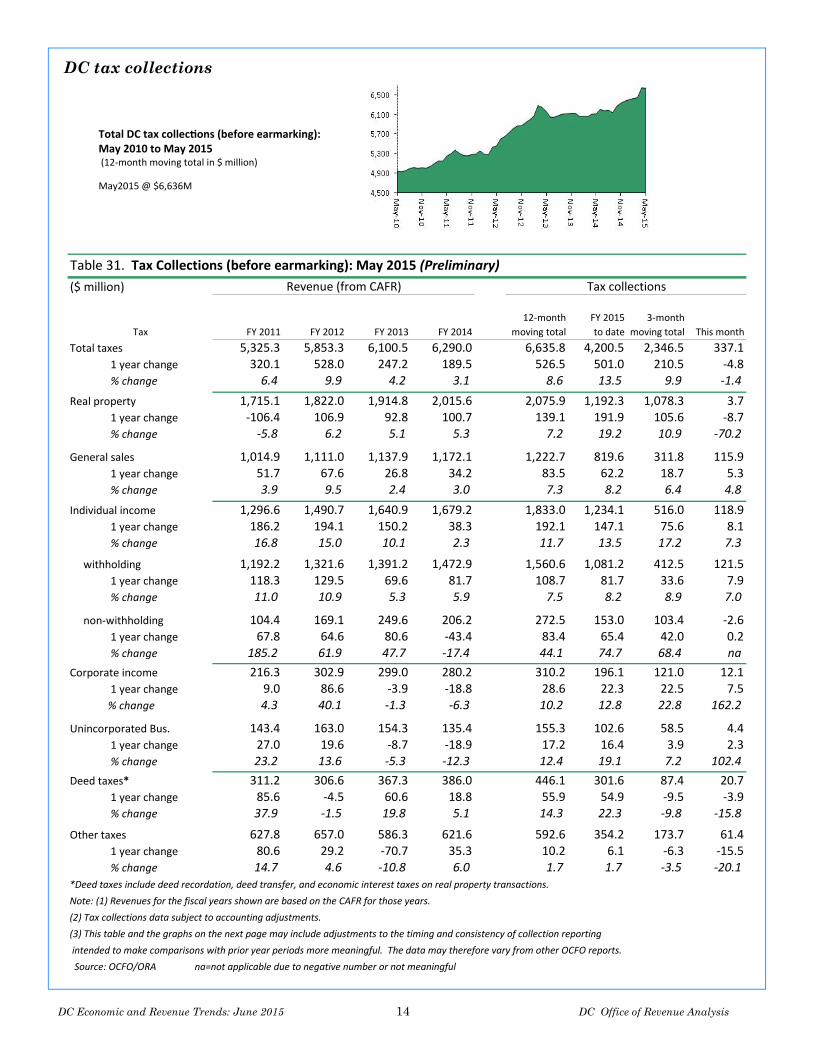
DC tax collections
Total DC tax collec ons (before earmarking): May 2010 to May 2015 (12‐month moving total in $ million)
May2015 @ $6,636M
Table 31. Tax Collections (before earmarking): May 2015 (Preliminary)
($ million)
Total taxes 5,325.3 5,853.3 6,100.5 6,290.0 6,635.8 4,200.5 2,346.5 337.1 1 year change 320.1 528.0 247.2 189.5 526.5 501.0 210.5 ‐4.8 % change 6.4 9.9 4.2 3.1 8.6 13.5 9.9 ‐1.4
Real property 1,715.1 1,822.0 1,914.8 2,015.6 2,075.9 1,192.3 1,078.3 3.7 1 year change ‐106.4 106.9 92.8 100.7 139.1 191.9 105.6 ‐8.7 % change ‐5.8 6.2 5.1 5.3 7.2 19.2 10.9 ‐70.2
General sales 1,014.9 1,111.0 1,137.9 1,172.1 1,222.7 819.6 311.8 115.9 1 year change 51.7 67.6 26.8 34.2 83.5 62.2 18.7 5.3 % change 3.9 9.5 2.4 3.0 7.3 8.2 6.4 4.8
Individual income 1,296.6 1,490.7 1,640.9 1,679.2 1,833.0 1,234.1 516.0 118.9 1 year change 186.2 194.1 150.2 38.3 192.1 147.1 75.6 8.1 % change 16.8 15.0 10.1 2.3 11.7 13.5 17.2 7.3
withholding 1,192.2 1,321.6 1,391.2 1,472.9 1,560.6 1,081.2 412.5 121.5 1 year change 118.3 129.5 69.6 81.7 108.7 81.7 33.6 7.9 % change 11.0 10.9 5.3 5.9 7.5 8.2 8.9 7.0
non‐withholding 104.4 169.1 249.6 206.2 272.5 153.0 103.4 ‐2.6 1 year change 67.8 64.6 80.6 ‐43.4 83.4 65.4 42.0 0.2 % change 185.2 61.9 47.7 ‐17.4 44.1 74.7 68.4 na
Corporate income 216.3 302.9 299.0 280.2 310.2 196.1 121.0 12.1 1 year change 9.0 86.6 ‐3.9 ‐18.8 28.6 22.3 22.5 7.5 % change 4.3 40.1 ‐1.3 ‐6.3 10.2 12.8 22.8 162.2
Unincorporated Bus. 143.4 163.0 154.3 135.4 155.3 102.6 58.5 4.4 1 year change 27.0 19.6 ‐8.7 ‐18.9 17.2 16.4 3.9 2.3 % change 23.2 13.6 ‐5.3 ‐12.3 12.4 19.1 7.2 102.4
Deed taxes* 311.2 306.6 367.3 386.0 446.1 301.6 87.4 20.7 1 year change 85.6 ‐4.5 60.6 18.8 55.9 54.9 ‐9.5 ‐3.9 % change 37.9 ‐1.5 19.8 5.1 14.3 22.3 ‐9.8 ‐15.8
Other taxes 627.8 657.0 586.3 621.6 592.6 354.2 173.7 61.4 1 year change 80.6 29.2 ‐70.7 35.3 10.2 6.1 ‐6.3 ‐15.5 % change 14.7 4.6 ‐10.8 6.0 1.7 1.7 ‐3.5 ‐20.1
Note: (1) Revenues for the fiscal years shown are based on the CAFR for those years.
(2) Tax collections data subject to accounting adjustments.
(3) This table and the graphs on the next page may include adjustments to the timing and consistency of collection reporting
intended to make comparisons with prior year periods more meaningful. The data may therefore vary from other OCFO reports.
Revenue (from CAFR) Tax collections
Source: OCFO/ORA na=not applicable due to negative number or not meaningful
*Deed taxes include deed recordation, deed transfer, and economic interest taxes on real property transactions.
Tax
12‐month
moving total
FY 2015
to date
3‐month
moving total This monthFY 2011 FY 2012 FY 2013 FY 2014
DC Economic and Revenue Trends: June 2015 15 DC Office of Revenue Analysis
DC tax collections
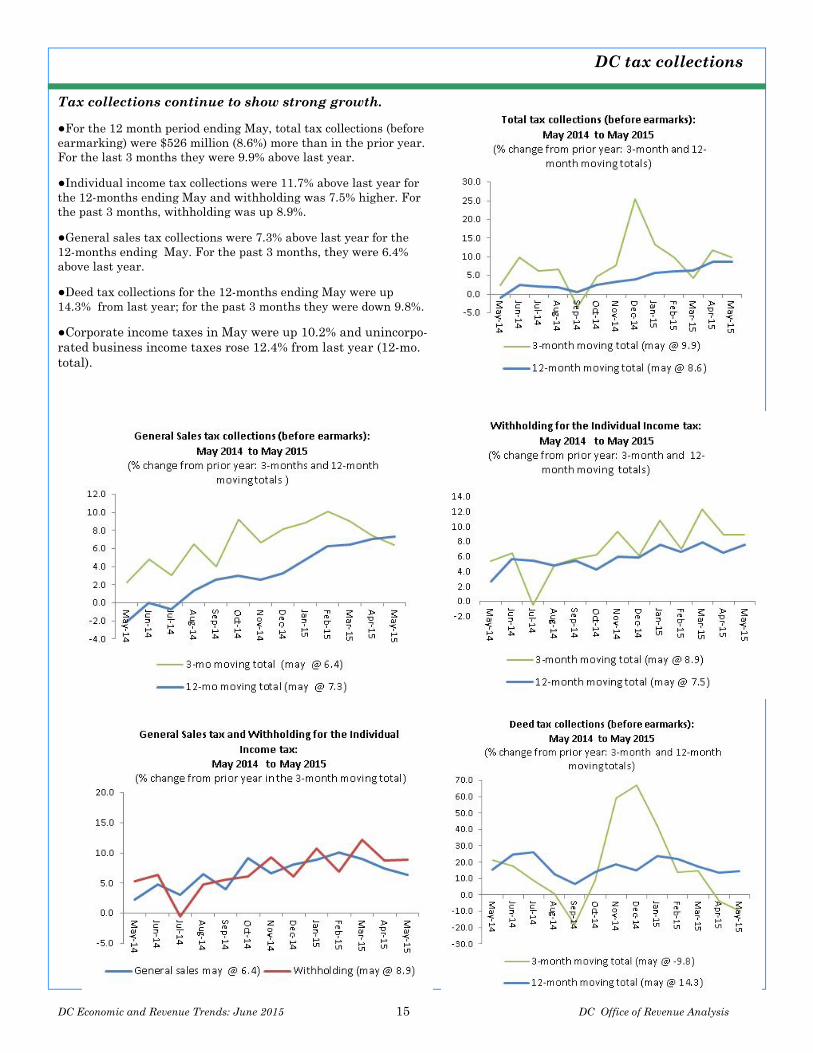
Tax collections continue to show strong growth.
●For the 12 month period ending May, total tax collections (before earmarking) were $526 million (8.6%) more than in the prior year. For the last 3 months they were 9.9% above last year.
●Individual income tax collections were 11.7% above last year for the 12-months ending May and withholding was 7.5% higher. For the past 3 months, withholding was up 8.9%.
●General sales tax collections were 7.3% above last year for the 12-months ending May. For the past 3 months, they were 6.4% above last year.
●Deed tax collections for the 12-months ending May were up 14.3% from last year; for the past 3 months they were down 9.8%.
●Corporate income taxes in May were up 10.2% and unincorpo-rated business income taxes rose 12.4% from last year (12-mo. total).
DC Economic and Revenue Trends: June 2015 16 DC Office of Revenue Analysis
US economic forecasts
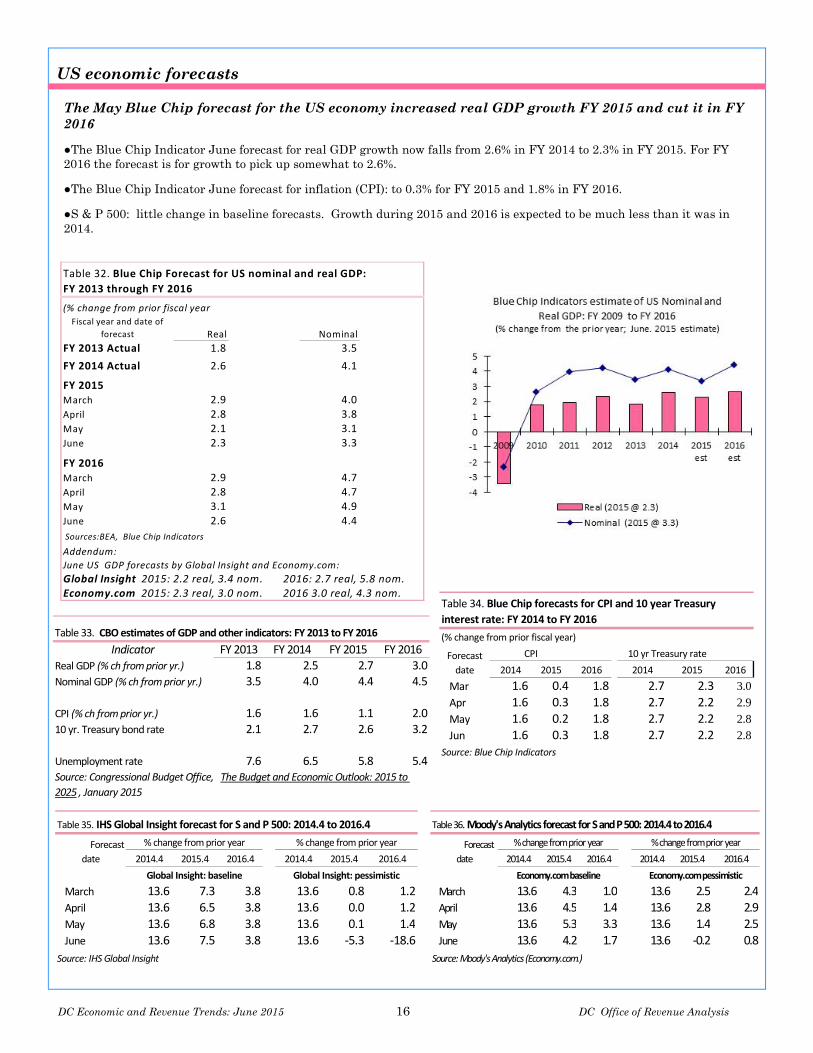
The May Blue Chip forecast for the US economy increased real GDP growth FY 2015 and cut it in FY 2016
●The Blue Chip Indicator June forecast for real GDP growth now falls from 2.6% in FY 2014 to 2.3% in FY 2015. For FY 2016 the forecast is for growth to pick up somewhat to 2.6%.
●The Blue Chip Indicator June forecast for inflation (CPI): to 0.3% for FY 2015 and 1.8% in FY 2016.
●S & P 500: little change in baseline forecasts. Growth during 2015 and 2016 is expected to be much less than it was in 2014.
Indicator FY 2013 FY 2014 FY 2015 FY 2016Real GDP (% ch from prior yr.) 1.8 2.5 2.7 3.0Nominal GDP (% ch from prior yr.) 3.5 4.0 4.4 4.5
CPI (% ch from prior yr.) 1.6 1.6 1.1 2.010 yr. Treasury bond rate 2.1 2.7 2.6 3.2
Unemployment rate 7.6 6.5 5.8 5.4
Table 33. CBO estimates of GDP and other indicators: FY 2013 to FY 2016
Source: Congressional Budget Office, The Budget and Economic Outlook: 2015 to
2025 , January 2015
Fiscal year and date of
forecast Real Nominal
FY 2013 Actual 1.8 3.5
FY 2014 Actual 2.6 4.1
FY 2015March 2.9 4.0
April 2.8 3.8May 2.1 3.1June 2.3 3.3
FY 2016
March 2.9 4.7April 2.8 4.7May 3.1 4.9
June 2.6 4.4
Addendum:
Sources:BEA, Blue Chip Indicators
Table 32. Blue Chip Forecast for US nominal and real GDP:
FY 2013 through FY 2016
Global Insight 2015: 2.2 real, 3.4 nom. 2016: 2.7 real, 5.8 nom.Economy.com 2015: 2.3 real, 3.0 nom. 2016 3.0 real, 4.3 nom.
June US GDP forecasts by Global Insight and Economy.com:
(% change from prior fiscal year
(% change from prior fiscal year)
2014 2015 2016 2014 2015 2016
Mar 1.6 0.4 1.8 2.7 2.3 3.0 Apr 1.6 0.3 1.8 2.7 2.2 2.9 May 1.6 0.2 1.8 2.7 2.2 2.8 Jun 1.6 0.3 1.8 2.7 2.2 2.8
Forecast
date
Source: Blue Chip Indicators
CPI 10 yr Treasury rate
Table 34. Blue Chip forecasts for CPI and 10 year Treasury
interest rate: FY 2014 to FY 2016
2014.4 2015.4 2016.4 2014.4 2015.4 2016.4
March 13.6 4.3 1.0 13.6 2.5 2.4 April 13.6 4.5 1.4 13.6 2.8 2.9 May 13.6 5.3 3.3 13.6 1.4 2.5 June 13.6 4.2 1.7 13.6 ‐0.2 0.8
Source: Moody's Analytics (Economy.com.)
Table 36. Moody's Analytics forecast for S and P 500: 2014.4 to 2016.4
% change from prior year % change from prior year
Economy.com baseline Economy.com pessimistic
Forecast
date2014.4 2015.4 2016.4 2014.4 2015.4 2016.4
March 13.6 7.3 3.8 13.6 0.8 1.2 April 13.6 6.5 3.8 13.6 0.0 1.2 May 13.6 6.8 3.8 13.6 0.1 1.4 June 13.6 7.5 3.8 13.6 ‐5.3 ‐18.6
Source: IHS Global Insight
Table 35. IHS Global Insight forecast for S and P 500: 2014.4 to 2016.4
% change from prior year % change from prior year
Global Insight: baseline Global Insight: pessimistic
Forecast
date
DC Economic and Revenue Trends: June 2015 17 DC Office of Revenue Analysis
DC economic forecasts
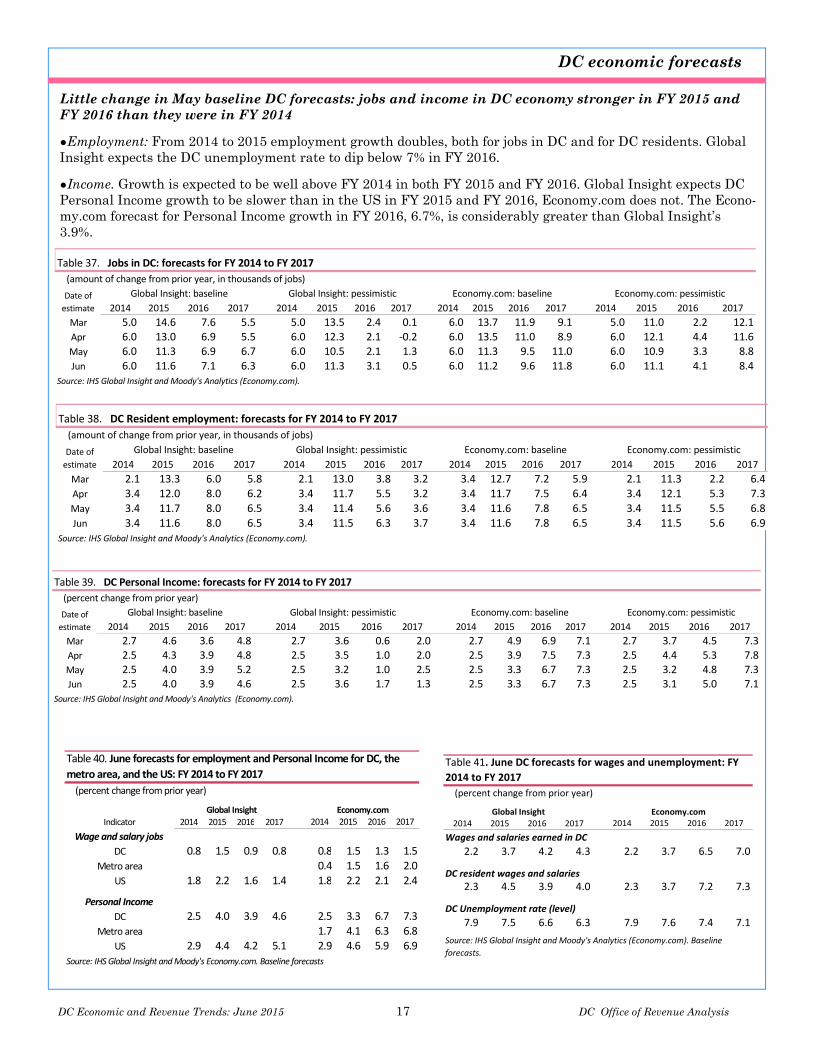
Little change in May baseline DC forecasts: jobs and income in DC economy stronger in FY 2015 and FY 2016 than they were in FY 2014
●Employment: From 2014 to 2015 employment growth doubles, both for jobs in DC and for DC residents. Global Insight expects the DC unemployment rate to dip below 7% in FY 2016.
●Income. Growth is expected to be well above FY 2014 in both FY 2015 and FY 2016. Global Insight expects DC Personal Income growth to be slower than in the US in FY 2015 and FY 2016, Economy.com does not. The Econo-my.com forecast for Personal Income growth in FY 2016, 6.7%, is considerably greater than Global Insight’s 3.9%.
(amount of change from prior year, in thousands of jobs)
2014 2015 2016 2017 2014 2015 2016 2017 2014 2015 2016 2017 2014 2015 2016 2017
Mar 5.0 14.6 7.6 5.5 5.0 13.5 2.4 0.1 6.0 13.7 11.9 9.1 5.0 11.0 2.2 12.1Apr 6.0 13.0 6.9 5.5 6.0 12.3 2.1 ‐0.2 6.0 13.5 11.0 8.9 6.0 12.1 4.4 11.6May 6.0 11.3 6.9 6.7 6.0 10.5 2.1 1.3 6.0 11.3 9.5 11.0 6.0 10.9 3.3 8.8Jun 6.0 11.6 7.1 6.3 6.0 11.3 3.1 0.5 6.0 11.2 9.6 11.8 6.0 11.1 4.1 8.4
Source: IHS Global Insight and Moody's Analytics (Economy.com).
Date of
estimate
Table 37. Jobs in DC: forecasts for FY 2014 to FY 2017
Global Insight: baseline Global Insight: pessimistic Economy.com: baseline Economy.com: pessimistic
(amount of change from prior year, in thousands of jobs)
2014 2015 2016 2017 2014 2015 2016 2017 2014 2015 2016 2017 2014 2015 2016 2017
Mar 2.1 13.3 6.0 5.8 2.1 13.0 3.8 3.2 3.4 12.7 7.2 5.9 2.1 11.3 2.2 6.4Apr 3.4 12.0 8.0 6.2 3.4 11.7 5.5 3.2 3.4 11.7 7.5 6.4 3.4 12.1 5.3 7.3May 3.4 11.7 8.0 6.5 3.4 11.4 5.6 3.6 3.4 11.6 7.8 6.5 3.4 11.5 5.5 6.8Jun 3.4 11.6 8.0 6.5 3.4 11.5 6.3 3.7 3.4 11.6 7.8 6.5 3.4 11.5 5.6 6.9
Source: IHS Global Insight and Moody's Analytics (Economy.com).
Date of
estimate
Table 38. DC Resident employment: forecasts for FY 2014 to FY 2017
Global Insight: baseline Global Insight: pessimistic Economy.com: baseline Economy.com: pessimistic
(percent change from prior year)
2014 2015 2016 2017 2014 2015 2016 2017 2014 2015 2016 2017 2014 2015 2016 2017
Mar 2.7 4.6 3.6 4.8 2.7 3.6 0.6 2.0 2.7 4.9 6.9 7.1 2.7 3.7 4.5 7.3Apr 2.5 4.3 3.9 4.8 2.5 3.5 1.0 2.0 2.5 3.9 7.5 7.3 2.5 4.4 5.3 7.8May 2.5 4.0 3.9 5.2 2.5 3.2 1.0 2.5 2.5 3.3 6.7 7.3 2.5 3.2 4.8 7.3Jun 2.5 4.0 3.9 4.6 2.5 3.6 1.7 1.3 2.5 3.3 6.7 7.3 2.5 3.1 5.0 7.1
Source: IHS Global Insight and Moody's Analytics (Economy.com).
Table 39. DC Personal Income: forecasts for FY 2014 to FY 2017
Global Insight: baseline Global Insight: pessimistic Economy.com: baseline Economy.com: pessimisticDate of
estimate
(percent change from prior year)
2014 2015 2016 2017 2014 2015 2016 2017
Wages and salaries earned in DC
2.2 3.7 4.2 4.3 2.2 3.7 6.5 7.0
DC resident wages and salaries
2.3 4.5 3.9 4.0 2.3 3.7 7.2 7.3
DC Unemployment rate (level)
7.9 7.5 6.6 6.3 7.9 7.6 7.4 7.1
Global Insight Economy.com
Table 41. June DC forecasts for wages and unemployment: FY
2014 to FY 2017
Source: IHS Global Insight and Moody's Analytics (Economy.com). Baseline
forecasts.
(percent change from prior year)
2014 2015 2016 2017 2014 2015 2016 2017
Wage and salary jobs
DC 0.8 1.5 0.9 0.8 0.8 1.5 1.3 1.5Metro area 0.4 1.5 1.6 2.0
US 1.8 2.2 1.6 1.4 1.8 2.2 2.1 2.4
Personal Income
DC 2.5 4.0 3.9 4.6 2.5 3.3 6.7 7.3
Metro area 1.7 4.1 6.3 6.8US 2.9 4.4 4.2 5.1 2.9 4.6 5.9 6.9
Source: IHS Global Insight and Moody's Economy.com. Baseline forecasts
Table 40. June forecasts for employment and Personal Income for DC, the
metro area, and the US: FY 2014 to FY 2017
Indicator
Global Insight Economy.com
DC Economic and Revenue Trends: June 2015 18 DC Office of Revenue Analysis
DC revenue estimate
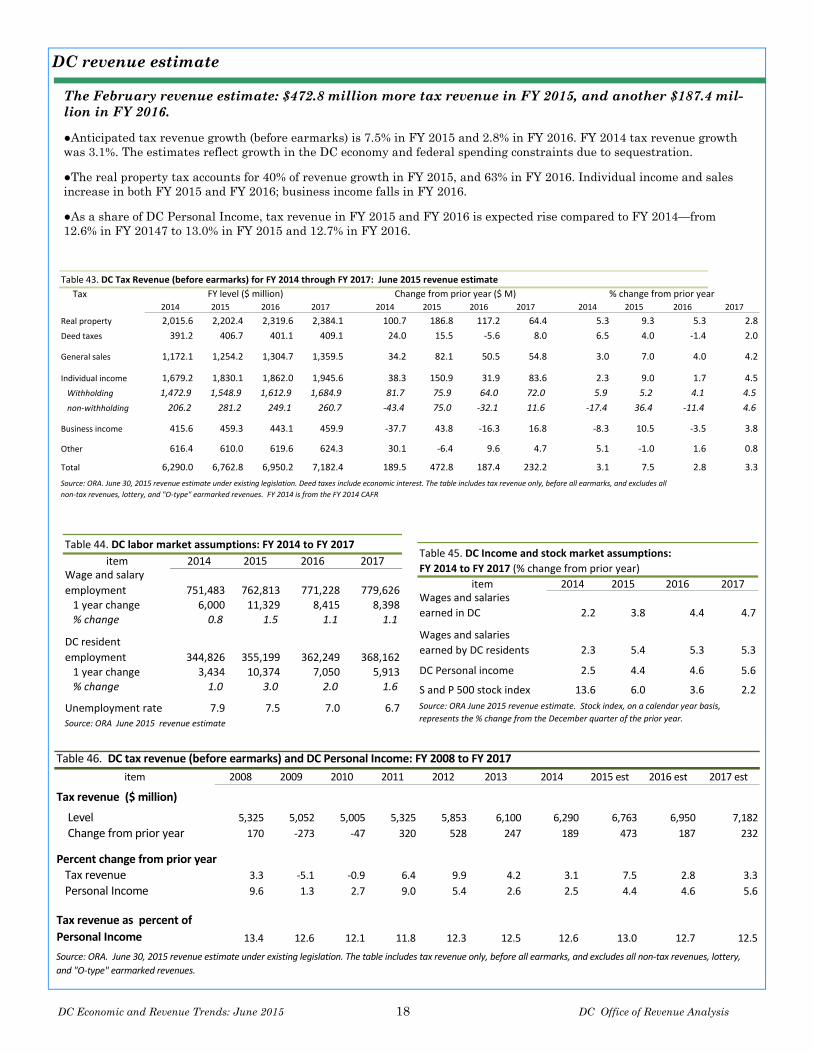
The February revenue estimate: $472.8 million more tax revenue in FY 2015, and another $187.4 mil-lion in FY 2016.
●Anticipated tax revenue growth (before earmarks) is 7.5% in FY 2015 and 2.8% in FY 2016. FY 2014 tax revenue growth was 3.1%. The estimates reflect growth in the DC economy and federal spending constraints due to sequestration.
●The real property tax accounts for 40% of revenue growth in FY 2015, and 63% in FY 2016. Individual income and sales increase in both FY 2015 and FY 2016; business income falls in FY 2016.
●As a share of DC Personal Income, tax revenue in FY 2015 and FY 2016 is expected rise compared to FY 2014—from 12.6% in FY 20147 to 13.0% in FY 2015 and 12.7% in FY 2016.
Table 44. DC labor market assumptions: FY 2014 to FY 2017
item 2014 2015 2016 2017Wage and salary
employment 751,483 762,813 771,228 779,626 1 year change 6,000 11,329 8,415 8,398 % change 0.8 1.5 1.1 1.1
DC resident
employment 344,826 355,199 362,249 368,162 1 year change 3,434 10,374 7,050 5,913 % change 1.0 3.0 2.0 1.6
Unemployment rate 7.9 7.5 7.0 6.7Source: ORA June 2015 revenue estimate
item 2014 2015 2016 2017Wages and salaries
earned in DC 2.2 3.8 4.4 4.7
Wages and salaries
earned by DC residents 2.3 5.4 5.3 5.3
DC Personal income 2.5 4.4 4.6 5.6
S and P 500 stock index 13.6 6.0 3.6 2.2
Table 45. DC Income and stock market assumptions:
FY 2014 to FY 2017 (% change from prior year)
Source: ORA June 2015 revenue estimate. Stock index, on a calendar year basis,
represents the % change from the December quarter of the prior year.
Table 43. DC Tax Revenue (before earmarks) for FY 2014 through FY 2017: June 2015 revenue estimate
Tax2014 2015 2016 2017 2014 2015 2016 2017 2014 2015 2016 2017
Real property 2,015.6 2,202.4 2,319.6 2,384.1 100.7 186.8 117.2 64.4 5.3 9.3 5.3 2.8
Deed taxes 391.2 406.7 401.1 409.1 24.0 15.5 ‐5.6 8.0 6.5 4.0 ‐1.4 2.0
General sales 1,172.1 1,254.2 1,304.7 1,359.5 34.2 82.1 50.5 54.8 3.0 7.0 4.0 4.2
Individual income 1,679.2 1,830.1 1,862.0 1,945.6 38.3 150.9 31.9 83.6 2.3 9.0 1.7 4.5
Withholding 1,472.9 1,548.9 1,612.9 1,684.9 81.7 75.9 64.0 72.0 5.9 5.2 4.1 4.5
non‐withholding 206.2 281.2 249.1 260.7 ‐43.4 75.0 ‐32.1 11.6 ‐17.4 36.4 ‐11.4 4.6
Business income 415.6 459.3 443.1 459.9 ‐37.7 43.8 ‐16.3 16.8 ‐8.3 10.5 ‐3.5 3.8
Other 616.4 610.0 619.6 624.3 30.1 ‐6.4 9.6 4.7 5.1 ‐1.0 1.6 0.8
Total 6,290.0 6,762.8 6,950.2 7,182.4 189.5 472.8 187.4 232.2 3.1 7.5 2.8 3.3
non‐tax revenues, lottery, and "O‐type" earmarked revenues. FY 2014 is from the FY 2014 CAFR
FY level ($ million) Change from prior year ($ M) % change from prior year
Source: ORA. June 30, 2015 revenue estimate under existing legislation. Deed taxes include economic interest. The table includes tax revenue only, before all earmarks, and excludes all
Table 46. DC tax revenue (before earmarks) and DC Personal Income: FY 2008 to FY 2017
item 2008 2009 2010 2011 2012 2013 2014 2015 est 2016 est 2017 est
Tax revenue ($ million)
Level 5,325 5,052 5,005 5,325 5,853 6,100 6,290 6,763 6,950 7,182
Change from prior year 170 ‐273 ‐47 320 528 247 189 473 187 232
Percent change from prior year Tax revenue 3.3 ‐5.1 ‐0.9 6.4 9.9 4.2 3.1 7.5 2.8 3.3
Personal Income 9.6 1.3 2.7 9.0 5.4 2.6 2.5 4.4 4.6 5.6
Tax revenue as percent of
Personal Income 13.4 12.6 12.1 11.8 12.3 12.5 12.6 13.0 12.7 12.5
Source: ORA. June 30, 2015 revenue estimate under existing legislation. The table includes tax revenue only, before all earmarks, and excludes all non‐tax revenues, lottery,
and "O‐type" earmarked revenues.
DC Economic and Revenue Trends: June 2015 19 DC Office of Revenue Analysis
DC hotels Continued from page 1
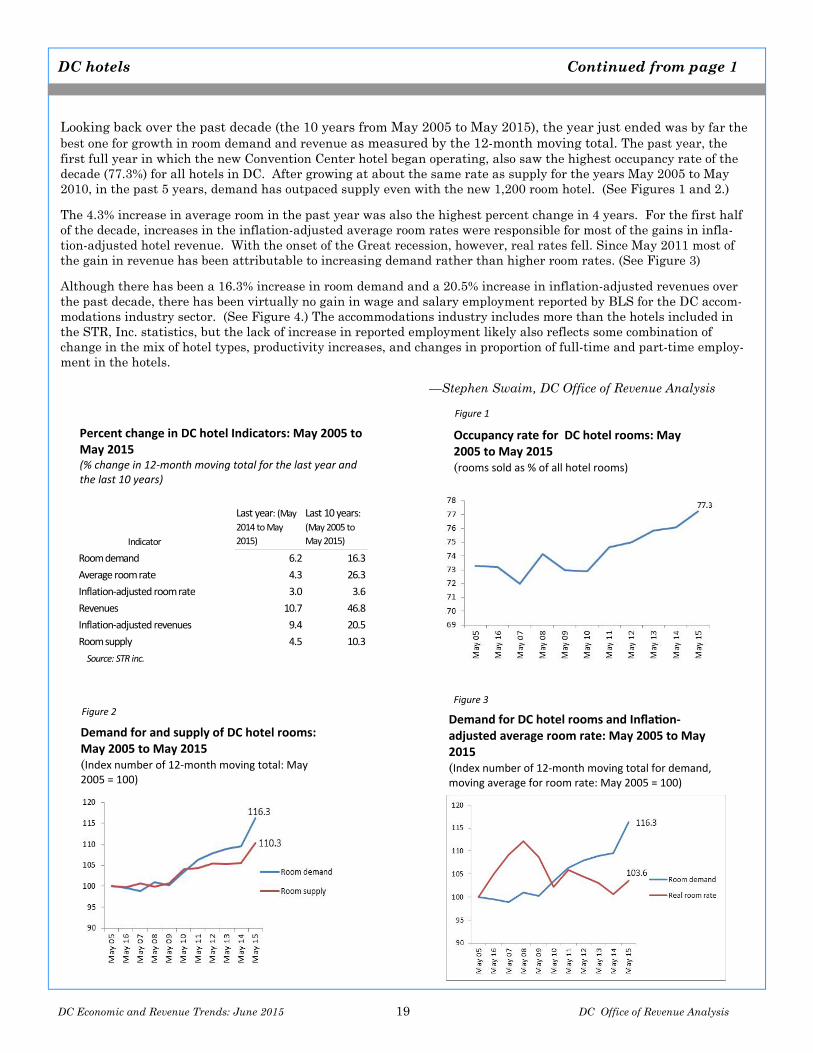
Looking back over the past decade (the 10 years from May 2005 to May 2015), the year just ended was by far the best one for growth in room demand and revenue as measured by the 12-month moving total. The past year, the first full year in which the new Convention Center hotel began operating, also saw the highest occupancy rate of the decade (77.3%) for all hotels in DC. After growing at about the same rate as supply for the years May 2005 to May 2010, in the past 5 years, demand has outpaced supply even with the new 1,200 room hotel. (See Figures 1 and 2.)
The 4.3% increase in average room in the past year was also the highest percent change in 4 years. For the first half of the decade, increases in the inflation-adjusted average room rates were responsible for most of the gains in infla-tion-adjusted hotel revenue. With the onset of the Great recession, however, real rates fell. Since May 2011 most of the gain in revenue has been attributable to increasing demand rather than higher room rates. (See Figure 3)
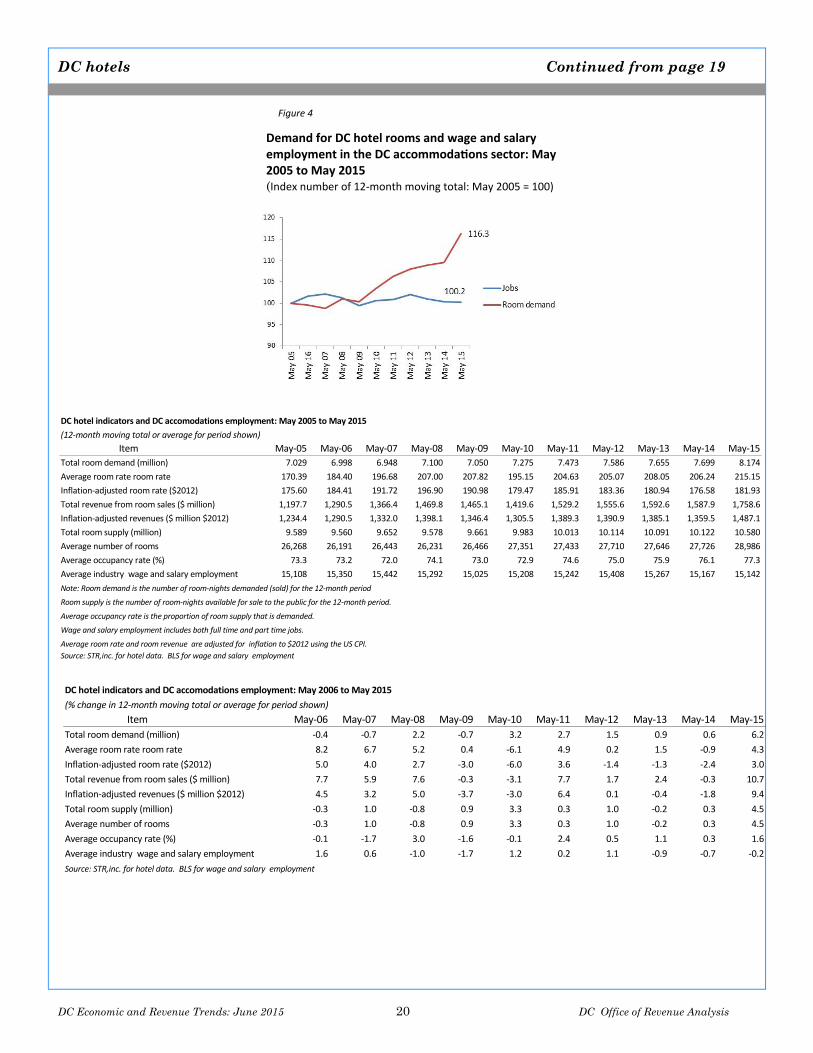
Although there has been a 16.3% increase in room demand and a 20.5% increase in inflation-adjusted revenues over the past decade, there has been virtually no gain in wage and salary employment reported by BLS for the DC accom-modations industry sector. (See Figure 4.) The accommodations industry includes more than the hotels included in the STR, Inc. statistics, but the lack of increase in reported employment likely also reflects some combination of change in the mix of hotel types, productivity increases, and changes in proportion of full-time and part-time employ-ment in the hotels.
—Stephen Swaim, DC Office of Revenue Analysis
Indicator
Last year: (May 2014 to May
2015)
Last 10 years: (May 2005 to
May 2015)
Room demand 6.2 16.3
Average room rate 4.3 26.3
Inflation‐adjusted room rate 3.0 3.6
Revenues 10.7 46.8
Inflation‐adjusted revenues 9.4 20.5
Room supply 4.5 10.3
Source: STR inc.
Percent change in DC hotel Indicators: May 2005 to May 2015 (% change in 12‐month moving total for the last year and the last 10 years)
Occupancy rate for DC hotel rooms: May 2005 to May 2015 (rooms sold as % of all hotel rooms)
Figure 1
Figure 2 Figure 3
Demand for DC hotel rooms and Infla on‐adjusted average room rate: May 2005 to May 2015 (Index number of 12‐month moving total for demand, moving average for room rate: May 2005 = 100)
Demand for and supply of DC hotel rooms: May 2005 to May 2015 (Index number of 12‐month moving total: May 2005 = 100)
DC Economic and Revenue Trends: June 2015 20 DC Office of Revenue Analysis
DC hotels Continued from page 19
Item May‐05 May‐06 May‐07 May‐08 May‐09 May‐10 May‐11 May‐12 May‐13 May‐14 May‐15
Total room demand (million) 7.029 6.998 6.948 7.100 7.050 7.275 7.473 7.586 7.655 7.699 8.174
Average room rate room rate 170.39 184.40 196.68 207.00 207.82 195.15 204.63 205.07 208.05 206.24 215.15
Inflation‐adjusted room rate ($2012) 175.60 184.41 191.72 196.90 190.98 179.47 185.91 183.36 180.94 176.58 181.93
Total revenue from room sales ($ million) 1,197.7 1,290.5 1,366.4 1,469.8 1,465.1 1,419.6 1,529.2 1,555.6 1,592.6 1,587.9 1,758.6
Inflation‐adjusted revenues ($ million $2012) 1,234.4 1,290.5 1,332.0 1,398.1 1,346.4 1,305.5 1,389.3 1,390.9 1,385.1 1,359.5 1,487.1
Total room supply (million) 9.589 9.560 9.652 9.578 9.661 9.983 10.013 10.114 10.091 10.122 10.580
Average number of rooms 26,268 26,191 26,443 26,231 26,466 27,351 27,433 27,710 27,646 27,726 28,986
Average occupancy rate (%) 73.3 73.2 72.0 74.1 73.0 72.9 74.6 75.0 75.9 76.1 77.3
Average industry wage and salary employment 15,108 15,350 15,442 15,292 15,025 15,208 15,242 15,408 15,267 15,167 15,142
Room supply is the number of room‐nights available for sale to the public for the 12‐month period.
Average occupancy rate is the proportion of room supply that is demanded.
Wage and salary employment includes both full time and part time jobs.
Average room rate and room revenue are adjusted for inflation to $2012 using the US CPI.
Source: STR,inc. for hotel data. BLS for wage and salary employment
DC hotel indicators and DC accomodations employment: May 2005 to May 2015
Note: Room demand is the number of room‐nights demanded (sold) for the 12‐month period
(12‐month moving total or average for period shown)
Item May‐06 May‐07 May‐08 May‐09 May‐10 May‐11 May‐12 May‐13 May‐14 May‐15
Total room demand (million) ‐0.4 ‐0.7 2.2 ‐0.7 3.2 2.7 1.5 0.9 0.6 6.2
Average room rate room rate 8.2 6.7 5.2 0.4 ‐6.1 4.9 0.2 1.5 ‐0.9 4.3
Inflation‐adjusted room rate ($2012) 5.0 4.0 2.7 ‐3.0 ‐6.0 3.6 ‐1.4 ‐1.3 ‐2.4 3.0
Total revenue from room sales ($ million) 7.7 5.9 7.6 ‐0.3 ‐3.1 7.7 1.7 2.4 ‐0.3 10.7
Inflation‐adjusted revenues ($ million $2012) 4.5 3.2 5.0 ‐3.7 ‐3.0 6.4 0.1 ‐0.4 ‐1.8 9.4
Total room supply (million) ‐0.3 1.0 ‐0.8 0.9 3.3 0.3 1.0 ‐0.2 0.3 4.5
Average number of rooms ‐0.3 1.0 ‐0.8 0.9 3.3 0.3 1.0 ‐0.2 0.3 4.5
Average occupancy rate (%) ‐0.1 ‐1.7 3.0 ‐1.6 ‐0.1 2.4 0.5 1.1 0.3 1.6
Average industry wage and salary employment 1.6 0.6 ‐1.0 ‐1.7 1.2 0.2 1.1 ‐0.9 ‐0.7 ‐0.2
Source: STR,inc. for hotel data. BLS for wage and salary employment
(% change in 12‐month moving total or average for period shown)
DC hotel indicators and DC accomodations employment: May 2006 to May 2015
Demand for DC hotel rooms and wage and salary employment in the DC accommoda ons sector: May 2005 to May 2015 (Index number of 12‐month moving total: May 2005 = 100)
Figure 4
DC Economic and Revenue Trends: June 2015 21 DC Office of Revenue Analysis
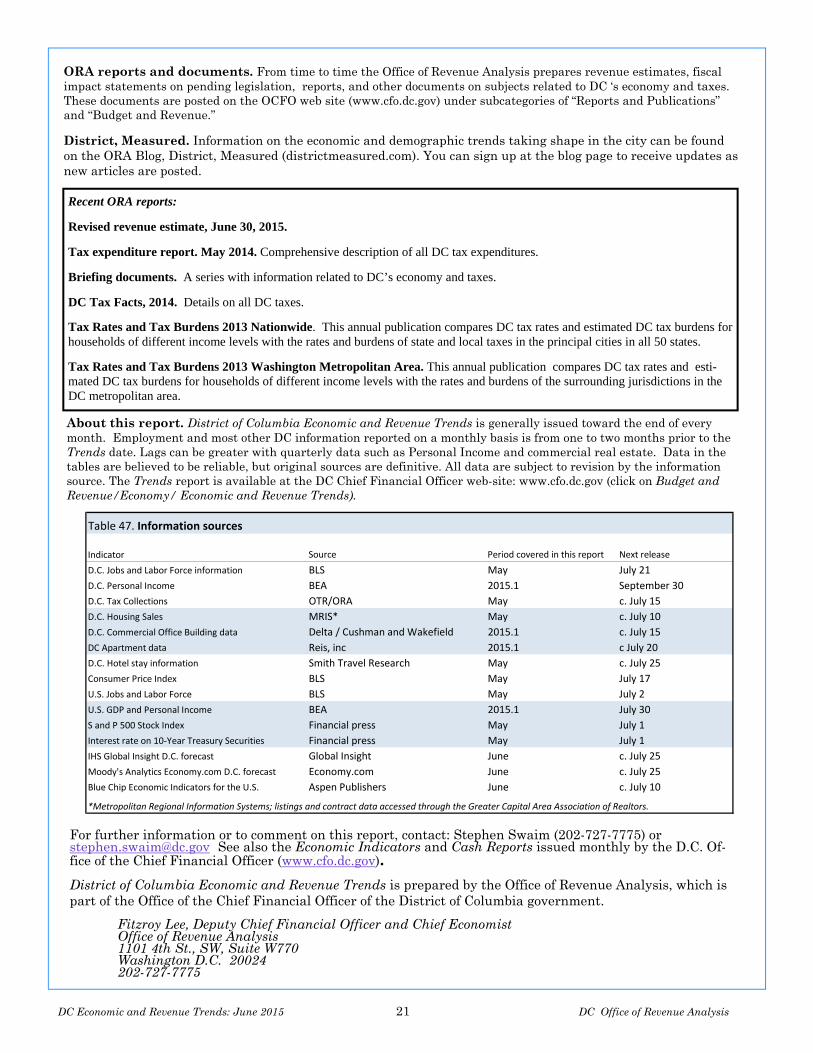
ORA reports and documents. From time to time the Office of Revenue Analysis prepares revenue estimates, fiscal impact statements on pending legislation, reports, and other documents on subjects related to DC ‘s economy and taxes. These documents are posted on the OCFO web site (www.cfo.dc.gov) under subcategories of “Reports and Publications” and “Budget and Revenue.”
District, Measured. Information on the economic and demographic trends taking shape in the city can be found on the ORA Blog, District, Measured (districtmeasured.com). You can sign up at the blog page to receive updates as new articles are posted.
About this report. District of Columbia Economic and Revenue Trends is generally issued toward the end of every month. Employment and most other DC information reported on a monthly basis is from one to two months prior to the Trends date. Lags can be greater with quarterly data such as Personal Income and commercial real estate. Data in the tables are believed to be reliable, but original sources are definitive. All data are subject to revision by the information source. The Trends report is available at the DC Chief Financial Officer web-site: www.cfo.dc.gov (click on Budget and Revenue/Economy/ Economic and Revenue Trends).
For further information or to comment on this report, contact: Stephen Swaim (202-727-7775) or [email protected] See also the Economic Indicators and Cash Reports issued monthly by the D.C. Of-fice of the Chief Financial Officer (www.cfo.dc.gov).
District of Columbia Economic and Revenue Trends is prepared by the Office of Revenue Analysis, which is part of the Office of the Chief Financial Officer of the District of Columbia government.
Fitzroy Lee, Deputy Chief Financial Officer and Chief Economist Office of Revenue Analysis 1101 4th St., SW, Suite W770 Washington D.C. 20024 202-727-7775
Recent ORA reports:
Revised revenue estimate, June 30, 2015.
Tax expenditure report. May 2014. Comprehensive description of all DC tax expenditures.
Briefing documents. A series with information related to DC’s economy and taxes.
DC Tax Facts, 2014. Details on all DC taxes.
Tax Rates and Tax Burdens 2013 Nationwide. This annual publication compares DC tax rates and estimated DC tax burdens for households of different income levels with the rates and burdens of state and local taxes in the principal cities in all 50 states.
Tax Rates and Tax Burdens 2013 Washington Metropolitan Area. This annual publication compares DC tax rates and esti-mated DC tax burdens for households of different income levels with the rates and burdens of the surrounding jurisdictions in the DC metropolitan area.
Table 47. Information sources
Source Period covered in this report Next release
D.C. Jobs and Labor Force information BLS May July 21
D.C. Personal Income BEA 2015.1 September 30
D.C. Tax Collections OTR/ORA May c. July 15
D.C. Housing Sales MRIS* May c. July 10
D.C. Commercial Office Building data Delta / Cushman and Wakefield 2015.1 c. July 15
DC Apartment data Reis, inc 2015.1 c July 20
D.C. Hotel stay information Smith Travel Research May c. July 25
Consumer Price Index BLS May July 17
U.S. Jobs and Labor Force BLS May July 2
U.S. GDP and Personal Income BEA 2015.1 July 30
S and P 500 Stock Index Financial press May July 1
Interest rate on 10‐Year Treasury Securities Financial press May July 1
IHS Global Insight D.C. forecast Global Insight June c. July 25
Moody's Analytics Economy.com D.C. forecast Economy.com June c. July 25
Blue Chip Economic Indicators for the U.S. Aspen Publishers June c. July 10
Indicator
*Metropolitan Regional Information Systems; listings and contract data accessed through the Greater Capital Area Association of Realtors.