Embed Size (px)
Citation preview
DE MONTFORT EXECUTIVE SUMMARY
YEAR-END 2016 COMMERCIAL
PROPERTY LENDING REPORT
R
2
2
Contact
Dr Nicole Lux Senior Research Fellow
De Montfort University Leicester, LE1 9BH
T +44 (0)116 250 6438 E [email protected]
3
3
Contact
Dr Nicole Lux Senior Research Fellow
De Montfort University Leicester, LE1 9BH
T +44 (0)116 250 6438 E [email protected]
Executive summary
Important Issues and Conclusion
The UK property lending market is one of the most diversified markets compared to other countries, but
also one of the most sophisticated and specialised ones. 2016 has been a year of further polarisation of
the UK property lending market. While until 2008 95% of lending was undertaken by banks, in 2016 23%
of secured property lending was undertaken by non bank lenders. At the same time the total debt has
been reduced from the peak in 2008 due to tightened lending practices, which have been enforced
through various regulations.
At year-end 2016 this total outstanding debt declined by 1.5% from year-end 2015 to £208.7bn
consisting of £164.8bn retained on balance sheet and reported to the survey, £17.1bn of outstanding
CMBS and £26.7bn identified from financial statements. New origination volume declined 17% from its
post GFC peak in 2015 when it had reached £53.7bn.
General overview
Despite lending activity during the first half of 2016 being dominated by the uncertainty of the
upcoming UK referendum, the lending market recovered during the second half and the size of the
overall aggregated UK commercial property loan book identified by this research grew a moderate
0.5% by year-end 2016 (including undrawn amounts).
Altogether £44.5bn of new loan originations were completed by year-end 2016, with £21.4bn in the
first half of the year and £23.1bn in the second. This is reduction of 17% from year-end 2015.
Although the second half of 2016 did not make up for the reduction on an annual basis, the second
half of 2016 was slightly more active than the first. The EU referendum led to a slow extended
summer break and deals were delayed till Q4 2016.
In absolute terms however, only UK Banks & Building Societies and Other Non-bank Lenders
recorded a higher loan book value at year-end 2016 compared to year-end 2015. All other groups
experienced a contraction in total loan books. This is mostly the result of more maturing loans than
new origination activity to replace maturing loans. In addition some lenders have been actively
syndicating to sell down exposure.
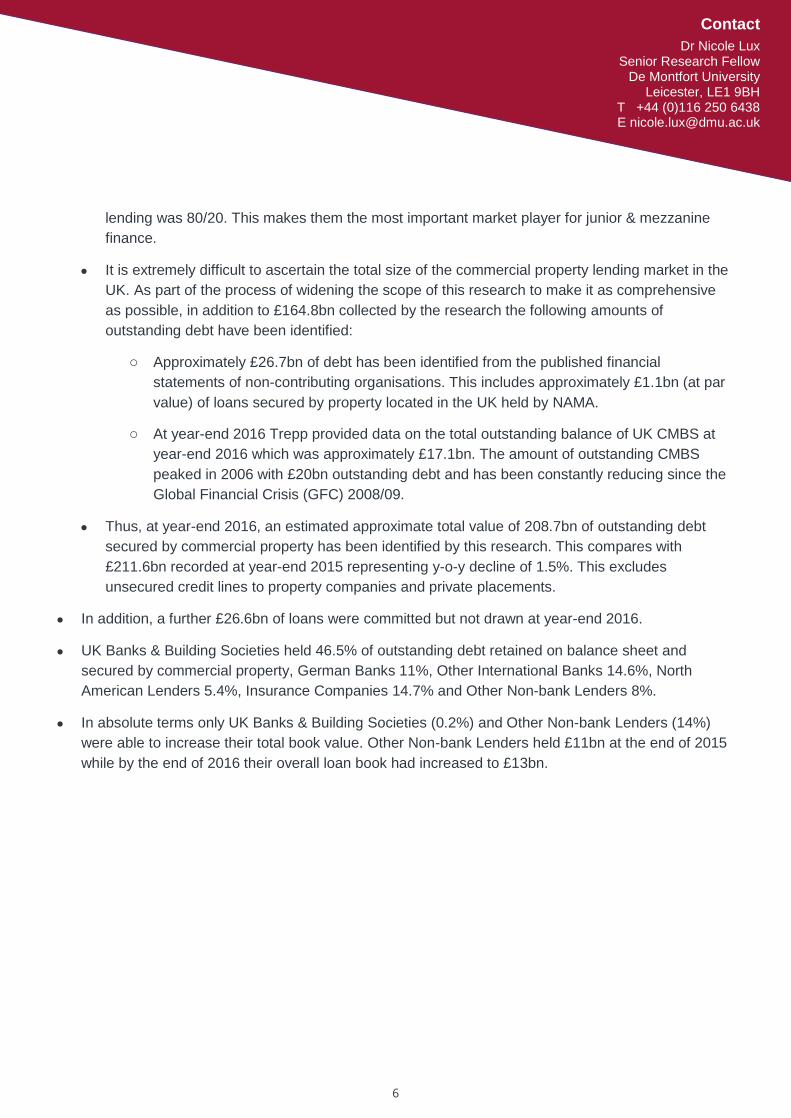
There were no significant changes in market share amongst the different lenders over the 12 months
in 2016. Other Non-bank Lenders grew their market share of outstanding loan books from 7% to 8%
while UK Banks & Building Societies equally increased their exposure by 1%. North American Banks
and Other International Banks lost 1% in market share, while the share for German Banks and
Insurance Companies remained stable.
The proportion of legacy debt originated before the GFC that is contained within the aggregated
value fell further to an insignificant level. For example of the 6 Building Societies that remain in the
4
4
Contact
Dr Nicole Lux Senior Research Fellow
De Montfort University Leicester, LE1 9BH
T +44 (0)116 250 6438 E [email protected]
survey, 5 are no longer active lenders, but still manage small positions of legacy debt.
It was frequently commented by respondents to this research that the lending market together with
the underlying property investment market is experiencing an extended cycle due to low interest
rates and economic support and that the market will remain buoyant until these external factors
change. Immediate uncertainty introduced by the result of the referendum was only viewed as a
temporary effect mainly connected to pricing and value uncertainty. Six weeks after the referendum
some lenders regained confidence and continued their lending activities.
Market liquidity is still strong with competitive pricing and lending terms for prime property, however,
on average margins did increase slightly, but are still well below the previous peak 2008/09 and
LTVs declined for the average deal during H2 2016 and is now below 60% LTV across all property
types.
2016 was a year when most lending activity was the result of refinancing, which accounted for 61%
of deal flow. This is mostly benefitting banks with a large existing client base. Finding new finance for
new, less institutional and less known borrowers is more difficult, especially with a large clearing
bank.
The trend of new loan LTV ratios adjusting downwards continued in H2 2016. There is general
caution regarding property values especially for prime property in London, and most lenders feel that
lending at a maximum LTV of 60% is prudent and should minimise potential future losses.
Overall UK Banks & Building Societies are the key suppliers of development funding in the UK. They
were responsible for 69% of all residential development funding and 44% of commercial
development funding; in total they completed £5.4bn of development lending transactions during
2016. The total development funding supplied by All Lenders during year-end 2016 was £7.7bn.
One side effect of the Basel capital requirements and generally conservative lending practices
amongst Banks has been that lenders give preference to funding of certain, mostly core, assets,
which means there is pressure on margins for such assets. Thus, bank lender portfolios are
becoming less diversified and more homogenous.
Especially UK Banks & Building Societies continue to move LTV ratios downwards to below 60%
LTV to attract low capital charges In addition banks have been taking advantage of the BoE asset
purchase programmes, which drives part of their asset selection.
Responses to Research
At year-end 2016, data was received from a total of 77 lending organisations. The lending
organisations comprised 43 Banks & Building Societies, 12 Insurance Companies and 22 Other
Non-bank Lenders. 5 new organisations were added to the survey, 2 banks and 3 Other Non-
bank Lenders.
5
5
Contact
Dr Nicole Lux Senior Research Fellow
De Montfort University Leicester, LE1 9BH
T +44 (0)116 250 6438 E [email protected]
Of the 77 lending organisations, only 73 were considered actively lending. 3 Banks are no longer
actively lending, with one bank – Nationwide - representing the most recent exit from the market.
Another 4 organisations were managing current loan books but did not originate new loans
during 2016.
Loan Book and Market Size
Between mid-year 2016 and year-end 2016 total loan books remained stable at £191.5bn
(including both drawn and undrawn amounts). However, y-o-y total loan market size increased
by 0.5% from £190bn at year-end 2015. This slight increase is due to undrawn amounts of
£26.6bn included within this figure.
The aggregated value of outstanding drawn debt recorded in loan books and secured only by UK
commercial property, declined from £168.4bn at year-end 2015 to £164.8bn at year-end 2016.
This represents a contraction of loan books by 2.1%. While this is partially due to banks
offloading loan exposure via syndication during Q4 2016 the sample of the survey is also
changing from year to year and some banks, who are still managing legacy portfolio but are no
longer actively lending, are no longer included in the sample. However, these banks are now
accounted for in the total debt stack.
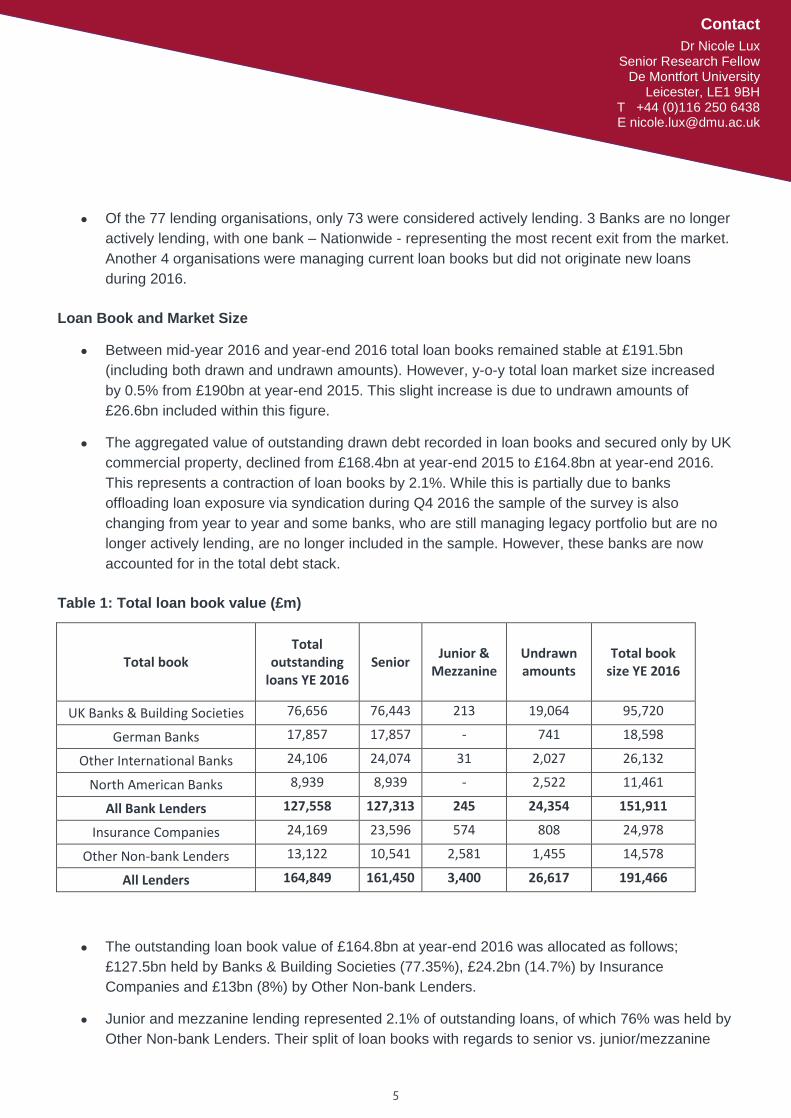
Table 1: Total loan book value (£m)
Total book Total
outstanding loans YE 2016
Senior Junior &
Mezzanine Undrawn amounts
Total book size YE 2016
UK Banks & Building Societies 76,656 76,443 213 19,064 95,720
German Banks 17,857 17,857 - 741 18,598
Other International Banks 24,106 24,074 31 2,027 26,132
North American Banks 8,939 8,939 - 2,522 11,461
All Bank Lenders 127,558 127,313 245 24,354 151,911
Insurance Companies 24,169 23,596 574 808 24,978
Other Non-bank Lenders 13,122 10,541 2,581 1,455 14,578
All Lenders 164,849 161,450 3,400 26,617 191,466
The outstanding loan book value of £164.8bn at year-end 2016 was allocated as follows;
£127.5bn held by Banks & Building Societies (77.35%), £24.2bn (14.7%) by Insurance
Companies and £13bn (8%) by Other Non-bank Lenders.
Junior and mezzanine lending represented 2.1% of outstanding loans, of which 76% was held by
Other Non-bank Lenders. Their split of loan books with regards to senior vs. junior/mezzanine
6
6
Contact
Dr Nicole Lux Senior Research Fellow
De Montfort University Leicester, LE1 9BH
T +44 (0)116 250 6438 E [email protected]
lending was 80/20. This makes them the most important market player for junior & mezzanine
finance.
It is extremely difficult to ascertain the total size of the commercial property lending market in the
UK. As part of the process of widening the scope of this research to make it as comprehensive
as possible, in addition to £164.8bn collected by the research the following amounts of
outstanding debt have been identified:
o Approximately £26.7bn of debt has been identified from the published financial
statements of non-contributing organisations. This includes approximately £1.1bn (at par
value) of loans secured by property located in the UK held by NAMA.
o At year-end 2016 Trepp provided data on the total outstanding balance of UK CMBS at
year-end 2016 which was approximately £17.1bn. The amount of outstanding CMBS
peaked in 2006 with £20bn outstanding debt and has been constantly reducing since the
Global Financial Crisis (GFC) 2008/09.
Thus, at year-end 2016, an estimated approximate total value of 208.7bn of outstanding debt
secured by commercial property has been identified by this research. This compares with
£211.6bn recorded at year-end 2015 representing y-o-y decline of 1.5%. This excludes
unsecured credit lines to property companies and private placements.
In addition, a further £26.6bn of loans were committed but not drawn at year-end 2016.
UK Banks & Building Societies held 46.5% of outstanding debt retained on balance sheet and
secured by commercial property, German Banks 11%, Other International Banks 14.6%, North
American Lenders 5.4%, Insurance Companies 14.7% and Other Non-bank Lenders 8%.
In absolute terms only UK Banks & Building Societies (0.2%) and Other Non-bank Lenders (14%)
were able to increase their total book value. Other Non-bank Lenders held £11bn at the end of 2015
while by the end of 2016 their overall loan book had increased to £13bn.
7
7
Contact
Dr Nicole Lux Senior Research Fellow
De Montfort University Leicester, LE1 9BH
T +44 (0)116 250 6438 E [email protected]
Figure 1: Debt allocation by lender category (% of outstanding loans)
Source: DMU 2016
Loan Originations
During 2016 £44.5bn of new loan origination including refinancing on commercial terms was
recorded as having been undertaken. This compares with £53.7bn undertaken throughout the
whole of 2015. This represents a y-o-y decline of 17%.
At year-end 2016, of the new loan originations of £44.5bn, £35.4bn was originated by Banks &
Building Societies, £4.6bn Insurance Companies and £4.4bn by Other Non-bank Lenders.
The 12 most active lenders undertook 62% of new loan originations; this is out of a total of 73
active lenders during year-end 2016, which makes the UK lending market highly diversified
market.
The total of 62% of new loan origination volume was undertaken by 6 UK Banks & Building
Societies, 2 German Banks, 1 North American Bank, 1 Insurance Company and 2 Other
International Banks. However, no Other Non-bank Lender is represented in the ‘top twelve’ most
active loan originators at year-end 2016, indicating the dominance of UK Banks & Building
Societies in their home market.
47% 45%
11% 11%
15% 16%
5% 6%
15% 15%
8% 7%
0%
10%
20%
30%
40%
50%
60%
70%
80%
90%
100%
YE 2016 YE 2015
Other Non-bank Lenders
Insurance Companies
North American Banks
Other International Banks
German Banks
UK Banks & BuildingSocieties
8
8
Contact
Dr Nicole Lux Senior Research Fellow
De Montfort University Leicester, LE1 9BH
T +44 (0)116 250 6438 E [email protected]
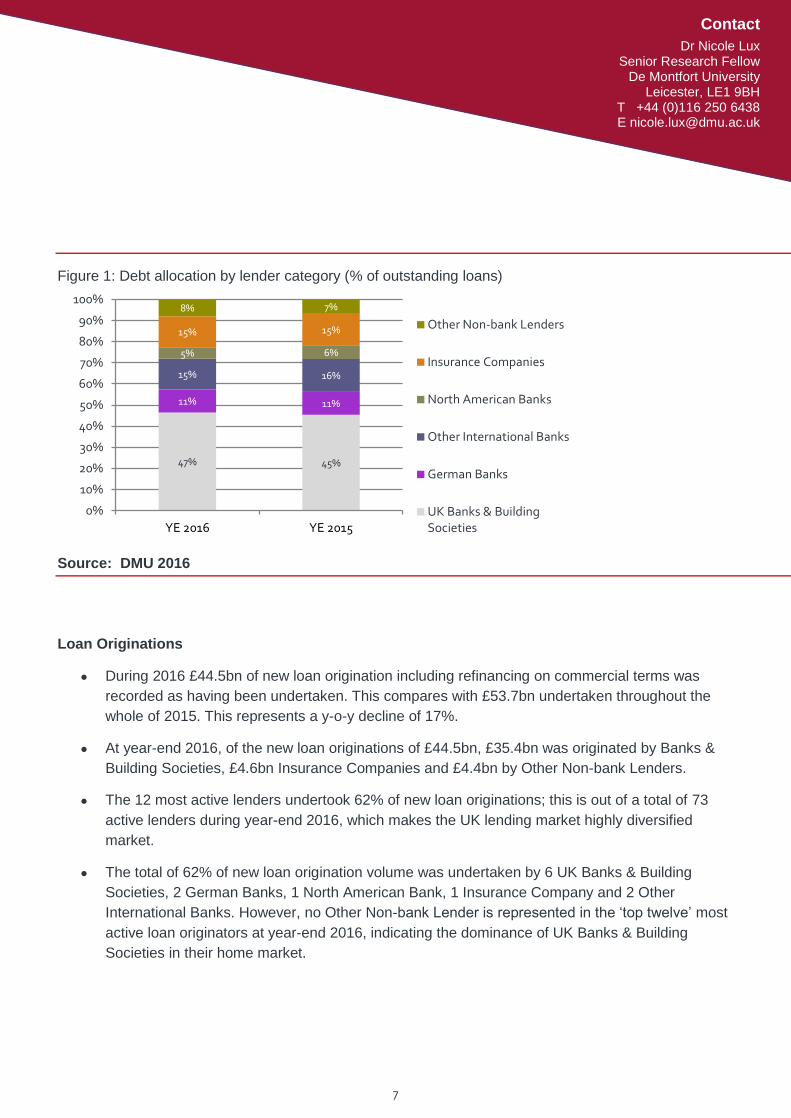
Table 2: Total origination volume (£m)
YE 2015 (£m) MY 2016 (£m) YE 2016 (£m) % change
UK Banks & Building Societies 18,258 9,452 20,713 13%
German Banks 6,981 3,580 5,710 -18%
Other International Banks 7,518 3,060 5,652 -25%
North American Banks 7,518 1,536 3,342 -56%
Insurance Companies 8,592 2,043 4,646 -46%
Other Non-bank Lenders 4,833 1,805 4,421 -9%
All Lenders 53,700 21,476 44,484 -17%
Overall it is worth noting that 61% of the total origination volume was refinancing of loans and
39% was for new acquisitions, which is a shift from year-end 2015 when the majority of 55.6% of
new financing was provided for acquisitions. In 2014 this was 51.7% and in 2013, 61%.
Especially North American Banks (66%) and Insurance Companies (70%) derived a large
amount of their year-end 2016 activity through refinancing of their own loans or loans from other
lenders. In contrast Other Non-bank Lenders sourced 54% of their new origination volume from
new acquisitions.
In 2016 new loan originations saw a sharp increase in the market share of UK Banks & Building
Societies (45% at year-end 2016 compared with 34% at year-end 2015). Other Non-bank
Lenders were also able to increase their market share (9% to 10%). All other lenders recorded a
decline in market share, with the strongest being recorded by North American Banks (14% to
8%) followed by Insurance Companies (16% to 10%). However the survey identified a significant
amount of insurance money indirectly invested in real estate loans via Other Non-bank Lenders.
Adjusting the market shares accordingly only 7% of total originations were accounted for by
Other Non-bank Lenders (backed by equity from family offices, sovereign wealth funds), while
14% were attributed to Insurance Companies.
In 2016 only 2%% of the total debt originated was junior or mezzanine, compared to 2.5% in
2015.
Of the £32.8 of loan originations undertaken by Banks & Building Societies, 76% was allocated
to investment projects (80% in 2015), 6% to commercial development, 14% to residential
development and 4% to other projects and investments. The fall in the relative allocation of new
lending to investment projects was driven by increased levels of development finance in the
second half of 2016.
Insurance Companies dedicated 5% of their new lending to non-investment property. Overall
their loan books are becoming more diversified, especially in the area of alternative asset
classes such as student housing, healthcare, where there is reduced market competition and
9
9
Contact
Dr Nicole Lux Senior Research Fellow
De Montfort University Leicester, LE1 9BH
T +44 (0)116 250 6438 E [email protected]
therefore premium pricing can be achieved on buy-to-hold assets suitable for long-term
financing.
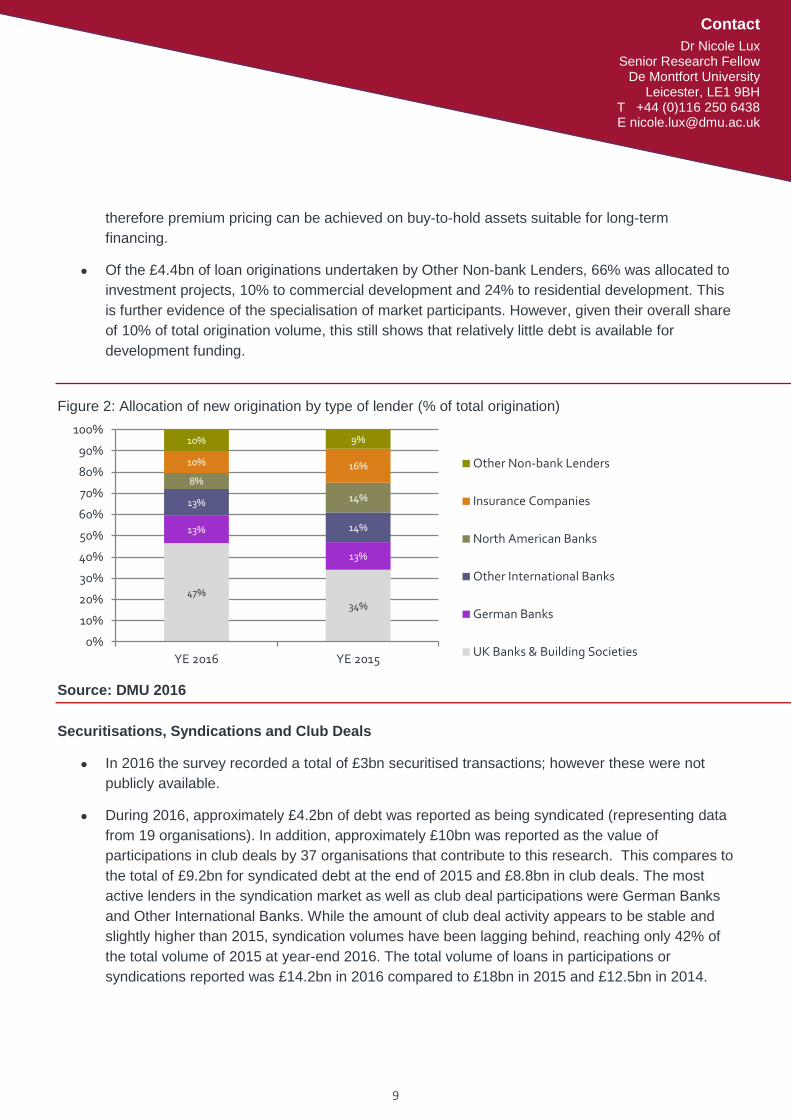
Of the £4.4bn of loan originations undertaken by Other Non-bank Lenders, 66% was allocated to
investment projects, 10% to commercial development and 24% to residential development. This
is further evidence of the specialisation of market participants. However, given their overall share
of 10% of total origination volume, this still shows that relatively little debt is available for
development funding.
Figure 2: Allocation of new origination by type of lender (% of total origination)
Source: DMU 2016
Securitisations, Syndications and Club Deals
In 2016 the survey recorded a total of £3bn securitised transactions; however these were not
publicly available.
During 2016, approximately £4.2bn of debt was reported as being syndicated (representing data
from 19 organisations). In addition, approximately £10bn was reported as the value of
participations in club deals by 37 organisations that contribute to this research. This compares to
the total of £9.2bn for syndicated debt at the end of 2015 and £8.8bn in club deals. The most
active lenders in the syndication market as well as club deal participations were German Banks
and Other International Banks. While the amount of club deal activity appears to be stable and
slightly higher than 2015, syndication volumes have been lagging behind, reaching only 42% of
the total volume of 2015 at year-end 2016. The total volume of loans in participations or
syndications reported was £14.2bn in 2016 compared to £18bn in 2015 and £12.5bn in 2014.
47% 34%
13%
13%
13%
14%
8%
14%
10% 16%
10% 9%
0%
10%
20%
30%
40%
50%
60%
70%
80%
90%
100%
YE 2016 YE 2015
Other Non-bank Lenders
Insurance Companies
North American Banks
Other International Banks
German Banks
UK Banks & Building Societies
10
10
Contact
Dr Nicole Lux Senior Research Fellow
De Montfort University Leicester, LE1 9BH
T +44 (0)116 250 6438 E [email protected]
Structure of Loan Books and Legacy Debt
At year-end 2016, the large majority (91%) of loan exposure was held in loans up to 70% LTV.
The proportion at year-end 2015 was 87.5% having steadily increased since 2012. At the same
time, 66% of the loan exposure held on balance sheet achieves an interest cover ratio (ICR) of
above 2.00x and 78% of loan exposure achieves an ICR of 1.8x and above. At mid-year 2016
these numbers were still slightly higher with 67% of the loan exposure held on balance sheet
held with an interest cover ratio (ICR) of above 2.00x and 87% of loan exposure held with an ICR
of 1.8x and above indicating a slight shift in loan books income profile. One explanation could be
the addition of new transactions which are being added to the total loans are now achieving
lower ICR/DSCR coverage despite low interest rates, due to falling property yields.
The value of loans in breach of financial covenants and those in default at year-end 2016
reported to the research was approximately £2.6bn and represented 3% of the total aggregated
loan book of those who responded. This compares with £10.4bn and 7% reported to the
research at year-end 2015.
Lending organisations commented that virtually all their problems related to loans written before
2009 had been resolved and no significant breaches and defaults have been recorded on new
loans.
The loan maturity profile shows a peak in 2020 for loans maturing in 4 years. This is expected
given the large amount of new originations during 2015. During the next 5 years between 2017
and 2021 inclusive, 74% of all outstanding debt is due for repayment. This compares to 72% at
year-end 2015. This proportion has grown significantly higher from 2009 onwards. At year-ends
2006 & 2007 the proportion of debt due to mature within the following five years was 61% and
60% respectively.
Senior Debt: Loan terms for Investment Property offered by All Lenders
Interest rate margins have been falling since 2012 and reached a post GFC low at mid-year
2016. Since mid-year they increased slightly by year-end 2016 but remained below or at the
year-end 2015 level. At year-end 2016, the average senior margin for loans secured by a prime
office was recorded at 198bps for All Lenders. This is a decline of 25bps from 223bps recorded
at year-end 2015. For senior loans secured by secondary offices, average interest rate margins
remained stable with 263bps at year-end 2016.
Loans secured by a prime office property have experienced the lowest margins achieved since
2007. However, a bigger distinction was made between prime and secondary property loans,
with fewer lenders willing to quote margins for secondary property. The average senior margin
ranged from 263 – 291bps for loans secured by secondary office, retail and industrial. This is a
premium of 65bps for secondary office vs. prime.
11
11
Contact
Dr Nicole Lux Senior Research Fellow
De Montfort University Leicester, LE1 9BH
T +44 (0)116 250 6438 E [email protected]
Overall pricing between mid-year and year-end 2016 has increased by 10-15bps for loans
secured by prime property while the spread to secondary property has narrowed with loan pricing
for loans secured by secondary property declining by 60-100bps.
For 10-year loans are on average priced 15-25bps higher than 5-year loans.
The most competitive pricing was offered on senior loans secured by prime office property by
German Banks with 162bps, which is an increase of 23bps compared to year-end 2015. This
was followed by Other International Banks with an average margin of 188bps and North
American Banks with 202bps. In contrast to German Banks, Other International Banks have
decreased their senior margins significantly from 245bps recorded at year- end 2015 in order to
increase their competitiveness.
UK Banks & Building Societies have decreased their pricing from a borrower perspective from
217bps at year end 2015 to 211bps for senior loans.
The overall average LTV ratio recorded for deals during year-end 2016 was 59% for senior prime
office loans. During 2016, average maximum LTV ratios continued to decline across loans
secured by all commercial property investment sectors. The average LTV provided by UK Banks
& Building Societies was 59% LTV compared to 65.6% LTV at year-end 2015. North American
Banks reported an average LTV on senior prime office loans with 57%, a decline of 8%
compared to year-end 2015. Overall the LTV ratio for loans secured by prime office property
declined from 64.9% at year-end 2015 to 59% at year-end 2016.
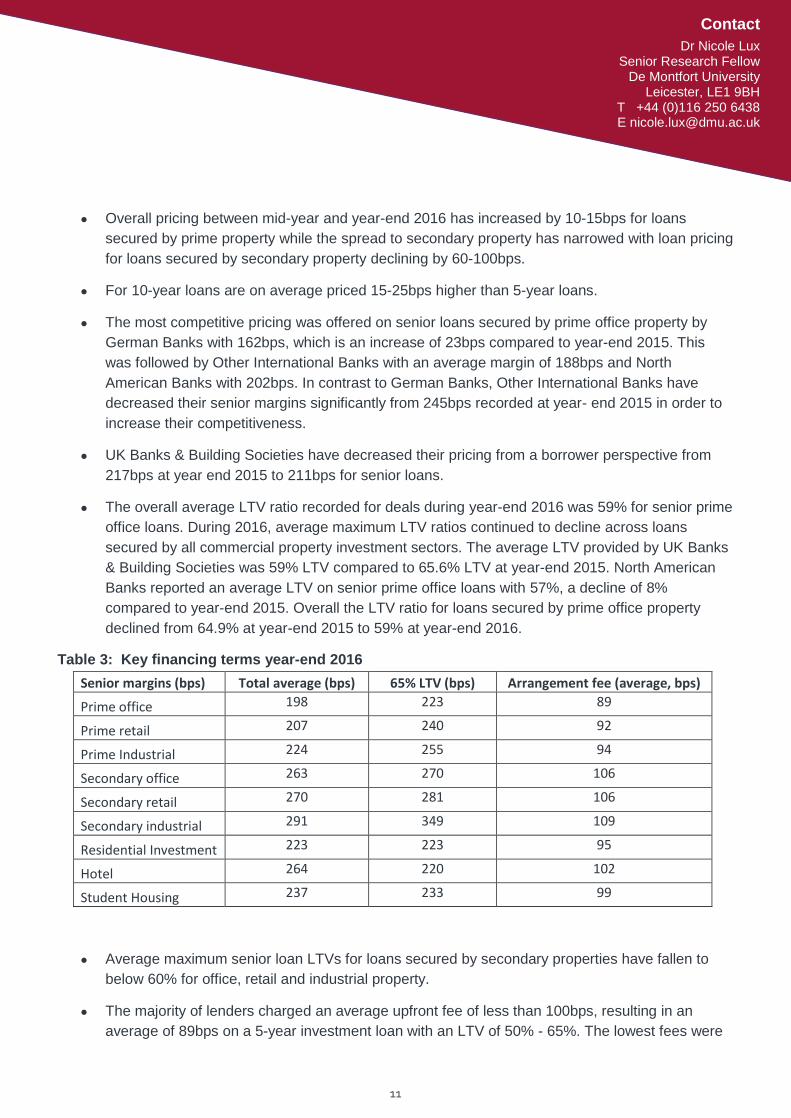
Table 3: Key financing terms year-end 2016
Senior margins (bps) Total average (bps) 65% LTV (bps) Arrangement fee (average, bps)
Prime office 198 223 89
Prime retail 207 240 92
Prime Industrial 224 255 94
Secondary office 263 270 106
Secondary retail 270 281 106
Secondary industrial 291 349 109
Residential Investment 223 223 95
Hotel 264 220 102
Student Housing 237 233 99
Average maximum senior loan LTVs for loans secured by secondary properties have fallen to
below 60% for office, retail and industrial property.
The majority of lenders charged an average upfront fee of less than 100bps, resulting in an
average of 89bps on a 5-year investment loan with an LTV of 50% - 65%. The lowest fees were
12
12
Contact
Dr Nicole Lux Senior Research Fellow
De Montfort University Leicester, LE1 9BH
T +44 (0)116 250 6438 E [email protected]
offered by German Banks with an average of 77bps followed by Insurance Companies with
87bps for prime office property loans. Only 2 lenders charge above 100bps. The minimum fee is
50bps. Compared to 96bps at year-end 2015.
Junior Debt and Mezzanine Finance loan terms
Risk appetite seems to have declined, with bank lenders only occasionally quoting terms for
junior or mezzanine lending. Mostly it is Insurance Companies and Other Non-bank Lenders that
provide terms across all property types. In total 9 lenders provided junior loan terms and 12
provided mezzanine loan terms at year-end 2016.
At year-end 2016 the average maximum LTV ratio for junior loans increased slightly from 70%
quoted by Banks & Building Societies and Insurance Companies at year end 2015 to 73%
quoted by All Lenders with an average margin of 589bps-628bps for a junior loan secured by
prime office, retail and industrial property. The average spread between junior and senior loan
margins was 400bps.
The average junior margin on secondary property was 693bps, representing a spread over prime
of 80-90bps. Between year-end 2015 and 2016 the LTV ratio for junior lending has been stable,
while pricing is narrowing the gap to senior loan pricing. Especially mezzanine lending is now
below 1000bps or 12% IRR.
For mezzanine finance the range of maximum LTV ratios were 75% to 85% with Insurance
Companies offering up to 85% LTV and Other Non-bank Lenders offering terms up to 80% LTV.
The average margin decreased from 956bps to 871bps by mid-year and to 767bps by year-end
2016 for loans on prime property. The average spread between junior and mezzanine loan
margins was 127bps, representing another 150bps narrowing of spreads between junior and
mezzanine finance.
Mezzanine financing for secondary properties declined further from 1000bps at mid-year to an
average margin of 872bps or IRR of 10% - 12%. The average LTV obtainable was 79%.
Other Investment Finance terms by All Lenders
Finance terms for residential investment were offered by 17 lenders. The average loan margin
for a senior loan was 224bps a reduction of 40bps from mid-year with an arrangement fee of
94bps at an average LTV of 58%. For this category UK Banks & Building Societies offered the
highest margins of 331bps, compared to 154bps offered by German Banks, 195bps by Insurance
Companies, 298bps by Other International Banks and 206bps by Other Non-bank Lenders.
Junior terms were offered for residential investment at an average of 628bps margin and
mezzanine financing was available for a margin of 819bps with an average LTV of 70% for junior
debt and 79% for mezzanine debt.
22 lenders also provided terms for hotel investment loans. For senior loans the average margin
13
13
Contact
Dr Nicole Lux Senior Research Fellow
De Montfort University Leicester, LE1 9BH
T +44 (0)116 250 6438 E [email protected]
was 264bps at an average LTV of 57%. Margins ranged from the lowest offered by German
Banks of 197bps followed by Insurance Companies with 223bps. Other Non-bank Lenders priced
these loans at 255bps, a reduction of 40bps over 6 months in H2 2016.
Another 23 lenders also provided terms for student housing. The average margin was 237bps
with an average LTV of 57%. The lowest margins were quoted by Insurance Companies with
199bps, followed by Other Non-bank Lenders providing margins at 261bps for 61% LTV loans.
Commercial Development Finance: Loan terms offered by All Lenders
At year-end 2016, 20 organisations provided data for finance of fully pre-let development. This
compares with 21 organisations recorded at year-end 2015. The average interest rate margin
was 401bps, which was an increase from 339bps reported at year-end 2015. The average LTC
(loan-to-cost based on GDV) ratio was 69% and the average arrangement fee 125bps.
Typical terms for up to 60% LTC are 100bps arrangement fee + 100bps exit fee. For higher LTC
this the arrangement and exit fee go up to 150bps.
13 organisations provided data for loans for 50% pre-let: 50% speculative development schemes
at year-end 2016. The average interest rate margin was 480bps with an LTC ratio of only up to
66% and an average arrangement fee of 135bps. In comparison the average margin year-end
2015 was 351bps.
Only 8 organisations provided terms for speculative developments with an average margin of
556bps, 150bps arrangement fee and an average LTC ratio of 65%. In comparison, the average
margin year-end 2015 was 384bps.
Those organisations prepared to offer junior debt for a fully pre-let commercial development were
offering a range of 60% to 80% LTC ratio at an interest rate margin of 925bps and an
arrangement fee of 150bps.
Although development finance margins have increase between 2015 and 2016, overall
development finance has become cheaper from a borrower’s perspective. In 2014 lending
margins were still up to 1000bps or IRR 9% - 15% for 70% LTC.
Loan Terms for Residential Development offered by All Lenders
At year-end 2016 a total of 19 lenders provided terms for residential development. For senior
loans the average LTV ratio for All Lenders was 66% LTV and 76% LTC ratio. Average interest
rate margins increased from 434bps recorded at year-end 2015 to 528bps at year-end 2016
together with an exit fee of 154pbs and an arrangement fee of 146bps.
Margins from North American Banks were lowest at 300bps, Banks & Building Societies offered
398bps and Other Non-bank Lenders were offering the highest margins with 694bps, however at
an increased LTC of 76% for a senior facility.
14
14
Contact
Dr Nicole Lux Senior Research Fellow
De Montfort University Leicester, LE1 9BH
T +44 (0)116 250 6438 E [email protected]
Mezzanine finance for residential developments was offered by 6 lenders with a LTC ratio up to
90% at an average margin of 11%, plus an exit of 166bps and arrangement fee of 158bps.
Relative pricing of property lending
With property yields already very low and declining also for secondary property, it is difficult to
add more than 45-50% leverage to achieve a sustainable interest payment coverage ratio.
On a relative value basis LTV ratios are already considered above the market pricing level more
lenders commented; they achieve total debt sizing as a multiple of the required ICR/debt yield
level. Especially for low yielding properties interest payment coverage ratios are under pressure
and restrict the overall debt level.
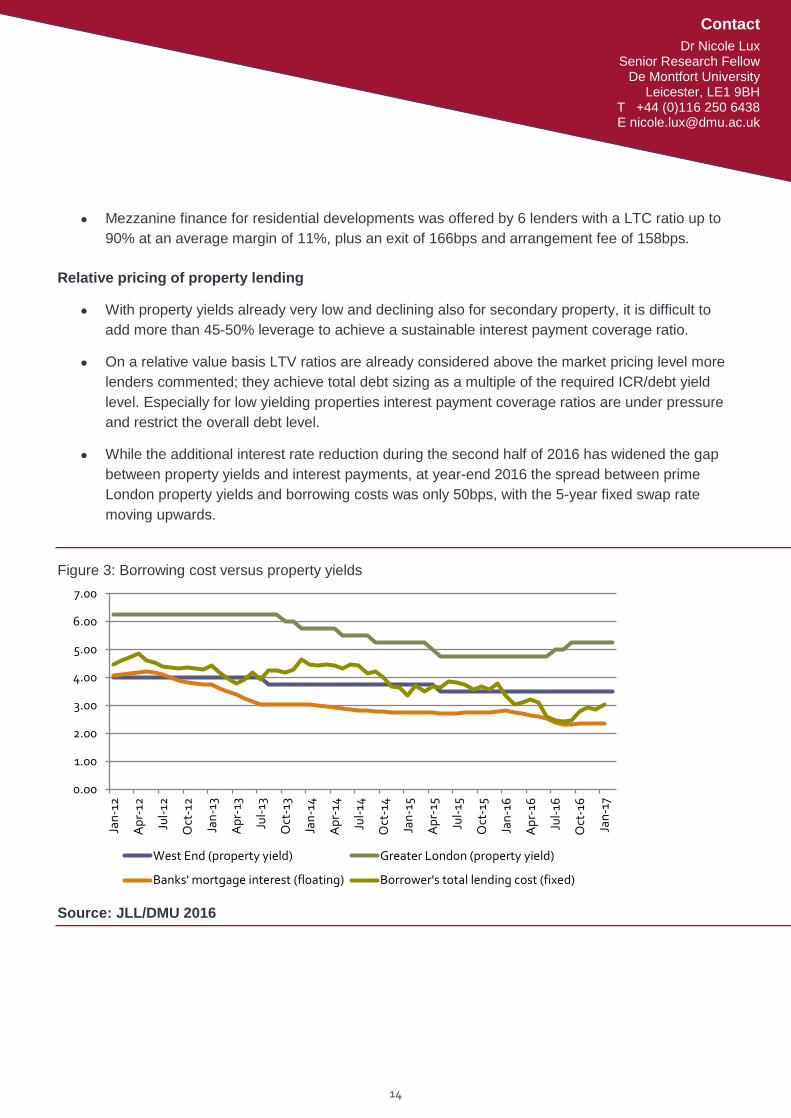
While the additional interest rate reduction during the second half of 2016 has widened the gap
between property yields and interest payments, at year-end 2016 the spread between prime
London property yields and borrowing costs was only 50bps, with the 5-year fixed swap rate
moving upwards.
Figure 3: Borrowing cost versus property yields
Source: JLL/DMU 2016
0.00
1.00
2.00
3.00
4.00
5.00
6.00
7.00
Jan
-12
Ap
r-12
Jul-
12
Oct
-12
Jan
-13
Ap
r-13
Jul-
13
Oct
-13
Jan
-14
Ap
r-14
Jul-
14
Oct
-14
Jan
-15
Ap
r-15
Jul-
15
Oct
-15
Jan
-16
Ap
r-16
Jul-
16
Oct
-16
Jan
-17
West End (property yield) Greater London (property yield)
Banks' mortgage interest (floating) Borrower's total lending cost (fixed)
15
15
Contact
Dr Nicole Lux Senior Research Fellow
De Montfort University Leicester, LE1 9BH
T +44 (0)116 250 6438 E [email protected]
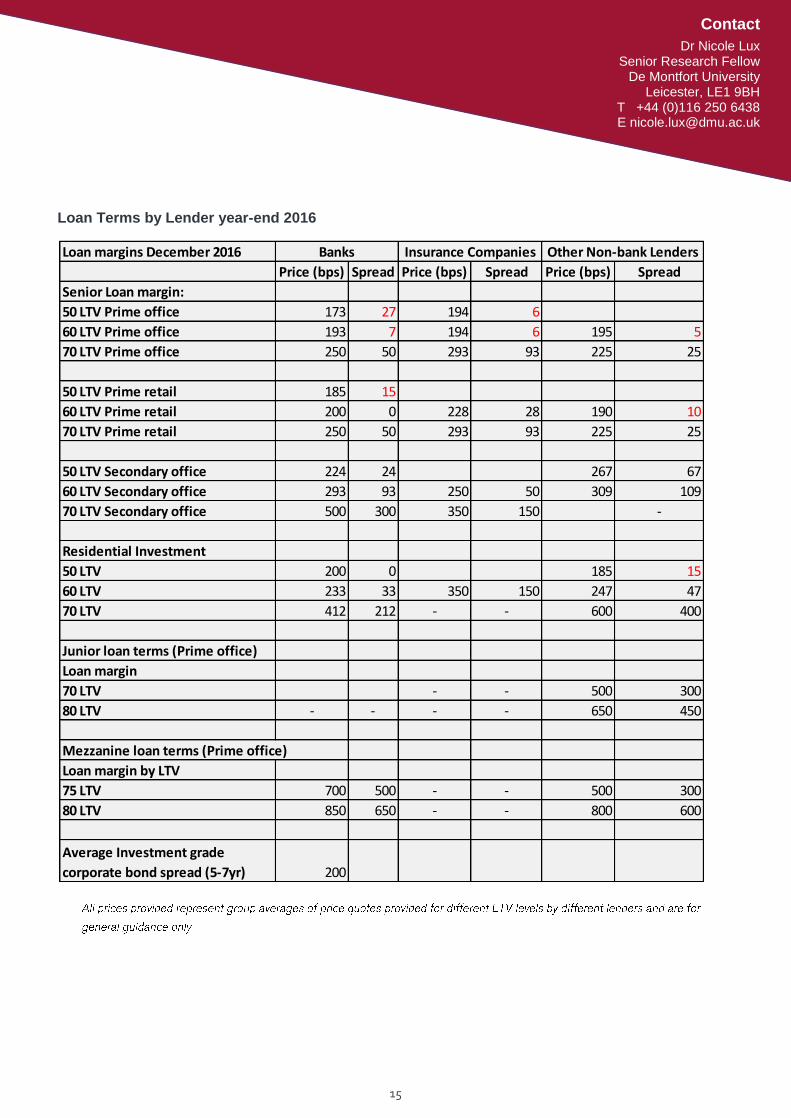
Loan Terms by Lender year-end 2016
Loan margins December 2016
Price (bps) Spread Price (bps) Spread Price (bps) Spread
Senior Loan margin:
50 LTV Prime office 173 27 194 6
60 LTV Prime office 193 7 194 6 195 5
70 LTV Prime office 250 50 293 93 225 25
50 LTV Prime retail 185 15
60 LTV Prime retail 200 0 228 28 190 10
70 LTV Prime retail 250 50 293 93 225 25
50 LTV Secondary office 224 24 267 67
60 LTV Secondary office 293 93 250 50 309 109
70 LTV Secondary office 500 300 350 150 -
Residential Investment
50 LTV 200 0 185 15
60 LTV 233 33 350 150 247 47
70 LTV 412 212 - - 600 400
Junior loan terms (Prime office)
Loan margin
70 LTV - - 500 300
80 LTV - - - - 650 450
Mezzanine loan terms (Prime office)
Loan margin by LTV
75 LTV 700 500 - - 500 300
80 LTV 850 650 - - 800 600
Average Investment grade
corporate bond spread (5-7yr) 200
Banks Insurance Companies Other Non-bank Lenders

This research was undertaken by Dr. Nicole Lux
Tel: (0116) 257 7428
Email: [email protected]
Copyright © De Montfort University 2017.
All rights reserved. No part of this report (including associated graphs, data, appendices or attachments) may be reproduced in any material form, distributed or communicated to any third party, without the express written permission of the copyright owner.
Permission requests to use content, quotations or extracts from the report, should be addressed to [email protected]
Disclaimer
The opinions and commentary in the report are those of the author(s) and not necessarily those of De Montfort University; the opinions expressed in this report should not be attributed in any way to the third parties whom contribute data to the report or whom financially support or sponsor the reports publication.
Commentary in the report is based on likely industry developments at the time, future trends or events based on information known to the authors at the date of publication, and such commentary should not be relied upon as a basis of financial investment. The report’s authors and publisher accept no responsibility, whatsoever, on decisions based on the report which should not be relied upon as a basis for entering into transactions without seeking specific, qualified, professional advice.
We exercise professional skill and care, using reasonable effort, to ensure that the De Montfort® Commercial Property Report is free from error or omissions. Whilst facts have been rigorously checked, De Montfort University can take no responsibility for any expense, damage, loss or liability suffered as a result of any inadvertent inaccuracy within this report. In the event of any errors or omissions we may correct the report without any obligation or liability to you, and we do not accept any liability if this report is used for an alternative purpose for which it is not intended.