Embed Size (px)
Citation preview
BioMed CentralTrials
ss
Open AcceResearchDealing with heterogeneity of treatment effects: is the literature up to the challenge?Nicole B Gabler*1, Naihua Duan2, Diana Liao3, Joann G Elmore4,5, Theodore G Ganiats6 and Richard L Kravitz1,7Address: 1Center for Healthcare Policy and Research, University of California, Davis, California, USA, 2Columbia University, New York State Psychiatric Institute, New York, USA, 3University of California, Los Angeles Neuropsychiatric Institute, California, USA, 4University of Washington School of Medicine, Seattle, Washington, USA, 5Department of Medicine, Harborview Medical Center, Seattle, Washington, USA, 6Department of Family and Preventive Medicine, University of California, San Diego, California, USA and 7Department of Internal Medicine, University of California, Davis, California, USA
Email: Nicole B Gabler* - [email protected]; Naihua Duan - [email protected]; Diana Liao - [email protected]; Joann G Elmore - [email protected]; Theodore G Ganiats - [email protected]; Richard L Kravitz - [email protected]
* Corresponding author
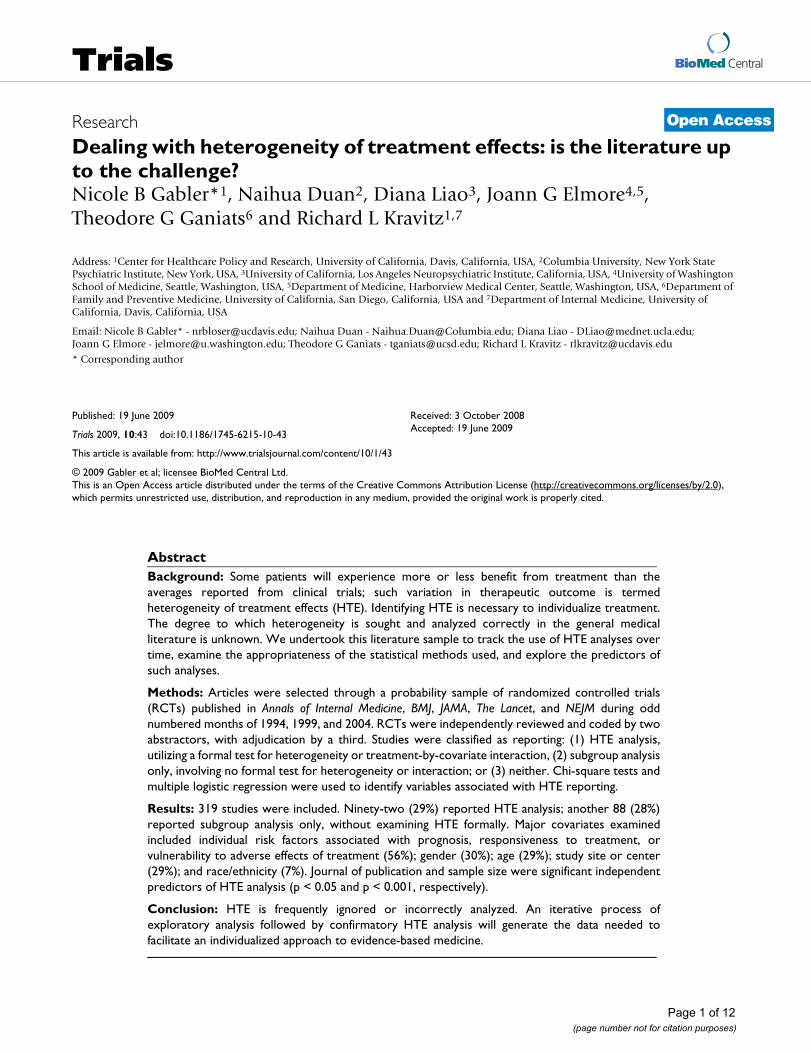
AbstractBackground: Some patients will experience more or less benefit from treatment than theaverages reported from clinical trials; such variation in therapeutic outcome is termedheterogeneity of treatment effects (HTE). Identifying HTE is necessary to individualize treatment.The degree to which heterogeneity is sought and analyzed correctly in the general medicalliterature is unknown. We undertook this literature sample to track the use of HTE analyses overtime, examine the appropriateness of the statistical methods used, and explore the predictors ofsuch analyses.
Methods: Articles were selected through a probability sample of randomized controlled trials(RCTs) published in Annals of Internal Medicine, BMJ, JAMA, The Lancet, and NEJM during oddnumbered months of 1994, 1999, and 2004. RCTs were independently reviewed and coded by twoabstractors, with adjudication by a third. Studies were classified as reporting: (1) HTE analysis,utilizing a formal test for heterogeneity or treatment-by-covariate interaction, (2) subgroup analysisonly, involving no formal test for heterogeneity or interaction; or (3) neither. Chi-square tests andmultiple logistic regression were used to identify variables associated with HTE reporting.
Results: 319 studies were included. Ninety-two (29%) reported HTE analysis; another 88 (28%)reported subgroup analysis only, without examining HTE formally. Major covariates examinedincluded individual risk factors associated with prognosis, responsiveness to treatment, orvulnerability to adverse effects of treatment (56%); gender (30%); age (29%); study site or center(29%); and race/ethnicity (7%). Journal of publication and sample size were significant independentpredictors of HTE analysis (p < 0.05 and p < 0.001, respectively).
Conclusion: HTE is frequently ignored or incorrectly analyzed. An iterative process ofexploratory analysis followed by confirmatory HTE analysis will generate the data needed tofacilitate an individualized approach to evidence-based medicine.
Published: 19 June 2009
Trials 2009, 10:43 doi:10.1186/1745-6215-10-43
Received: 3 October 2008Accepted: 19 June 2009
This article is available from: http://www.trialsjournal.com/content/10/1/43
© 2009 Gabler et al; licensee BioMed Central Ltd. This is an Open Access article distributed under the terms of the Creative Commons Attribution License (http://creativecommons.org/licenses/by/2.0), which permits unrestricted use, distribution, and reproduction in any medium, provided the original work is properly cited.
Page 1 of 12(page number not for citation purposes)
Trials 2009, 10:43 http://www.trialsjournal.com/content/10/1/43
BackgroundRandomized controlled trials (RCTs) are the cornerstoneof evidence-based medicine. Such trials rely on randomassignment to alternative treatment groups to control forbaseline patient factors that could affect outcomes. Theresulting estimate of the average treatment effect is anaverage of the individual treatment effects (ITEs) for partic-ipants in the study. While estimates of the average treat-ment effect are generally useful, some treated individuals,both within and outside of clinical trials, will experiencemore or less benefit than the reported average. Such vari-ation in treatment effect is termed heterogeneity of treat-ment effects (HTE) [1,2].
HTE may be quantitative (subgroup effects in the same direc-tion as the average effect but varying in magnitude) or qual-itative (treatment effects in different directions in differentsubgroups, where treatment is beneficial in some subgroupsand harmful in others). The prevalence of HTE is unknownand perhaps unknowable, but highly variable treatmentresponse rates for many common conditions suggest it issubstantial. [3,4] For example, Allen Roses, the vice presidentof genetics at GlaxoSmithKline, has stated, "Our drugs don'twork on most patients" [5]. Several empirical demonstra-tions of HTE have recently been published, including studiesof ischemic stroke [6], risk reduction by carotid endarterec-tomy [7,8], and diabetes [9]. While qualitative HTE may beuncommon, quantitative HTE should not be dismissed,because even modest variations in the magnitude of nettreatment benefits may have important implications forpatient care and cost-effectiveness.
HTE can be assessed in several ways. The most directapproach is the n-of-1 clinical trial, which assigns individ-ual patients to receive alternative treatment in a randomlypredetermined sequence [10,11]. Results from a series ofsuch trials can be aggregated to assess heterogeneity in thepopulation. However, n-of-1 trials are applicable to a rel-atively small subset of conditions and treatments [10,11]and are subject to random within-patient variability (thusrequiring a careful design and repeated crossovers)[12,13]. A second approach is to stratify patients accord-ing to risk of disease-related adverse events [14,15]. Athird approach, typically performed for purposes ofhypothesis generation rather than testing, entails a carefulexamination of subgroups within RCTs.
Subgroup analysis can be perilous. Real effects can bemissed because of inadequate statistical power [16,17],and reported effects may be spurious because of the per-formance of multiple statistical tests (13–16) and/or dueto random intra-individual variability [12,13]. Randomintra-individual variability is especially problematicbecause it is not possible to estimate this variability in par-allel group trials, the most common type of clinical trial
design. In parallel group trials, participants are only rand-omized to one treatment and do not crossover to alterna-tive treatments. As such, it is not possible to estimate anyvariation that occurs within a participant. In recognition ofthe drawbacks of subgroup analysis, the ConsolidatedStandards of Reporting Trials (CONSORT) statementwarns that subgroup analyses, especially post hoc sub-group comparisons, "do not have great credibility" [18].
On the other hand, it has been claimed that nearly every-thing we have learned from epidemiology resulted fromsubgroup analysis [19]. While this conclusion applies mostobviously to observational studies, careful scrutiny of sub-group-specific effects in randomized trials has generatedimportant new hypotheses and sometimes directly influ-enced practice. Nevertheless, subgroup analyses are notalways performed correctly. Some studies (e.g. [20-23])report results by subgroups, without any statistical testing orinterval estimation for the difference across subgroups;these studies do not provide quantitative information onHTE per se. Other studies report p-values corresponding toeach subgroup, subsequently claiming that the treatmenteffect differs across subgroups because it is statistically sig-nificant in one subgroup and not in another [24]. However,both treatment effect and sample size influence the p-value,such that similar effect sizes within each subgroup mightgenerate markedly different p-values. Instead of comparingthe p-values across subgroups, the appropriate way to iden-tify significant HTE is to make statistical comparisons fortreatment effects across subgroups, using a test for heteroge-neity or interaction [7,17,18,25-27].
The tension between needing to understand HTE andlacking the statistical power to properly examine itpresents difficulties for researchers, clinicians, andpatients. While some experts have offered general encour-agement to perform more HTE analyses [28,29], the liter-ature is relatively silent on how to manage the risks ofover- and under-testing. Kraemer et al. [25,30,31] havesuggested a sequential approach that could shed light onpossible HTE. Defining treatment modifiers as factors thatinfluence the treatment effect size across subgroups, theypropose that all RCTs use exploratory interaction analyses asa method to generate hypotheses regarding moderators oftreatment effects. The presence of strong moderator effectswould encourage future researchers to perform ade-quately powered confirmatory studies stratified prospec-tively on these moderators. While the proposal ofKraemer et al. makes sense, several small reviews, mostpublished well before the revised CONSORT statement,suggest that testing for HTE is reported in only 25% to50% of RCTs [18,27,32-35].
We undertook the current review of the prevalence of HTEanalyses in a comparatively larger sample of articles pub-
Page 2 of 12(page number not for citation purposes)
Trials 2009, 10:43 http://www.trialsjournal.com/content/10/1/43
Page 3 of 12(page number not for citation purposes)
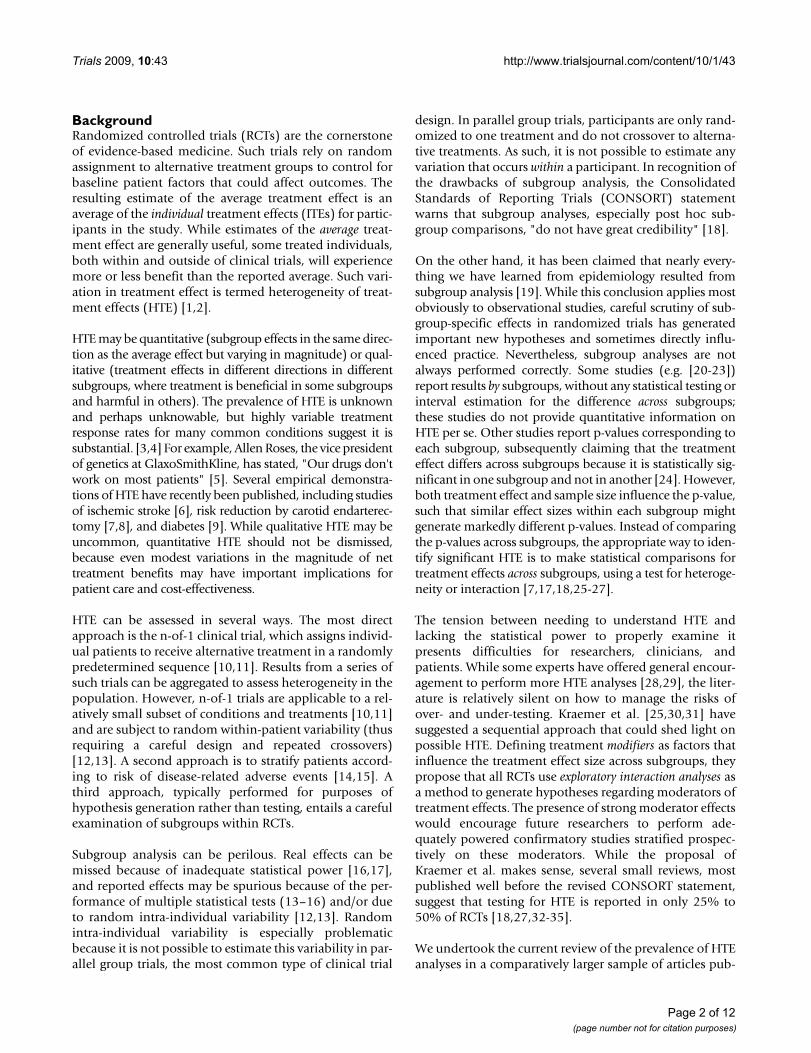
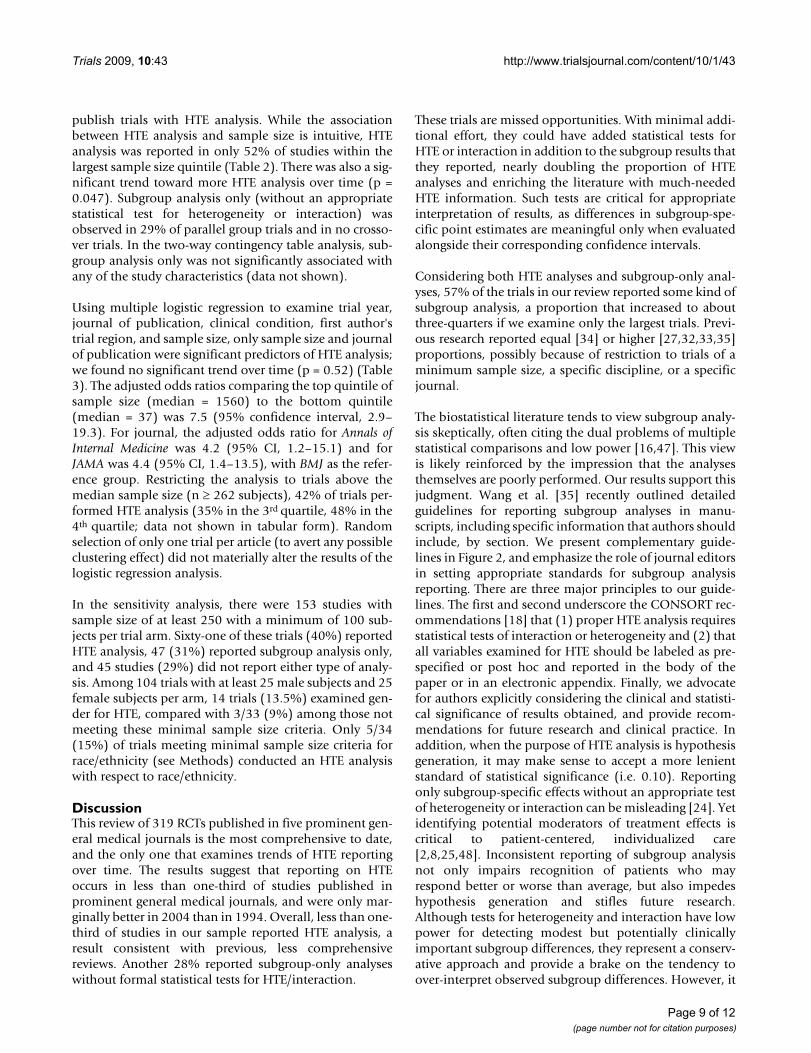
Article selection for systemic review of heterogeneity of treatment effect in RCTs published in five general medical journalsFigure 1Article selection for systemic review of heterogeneity of treatment effect in RCTs published in five general medical journals.
Trials 2009, 10:43 http://www.trialsjournal.com/content/10/1/43
Page 4 of 12(page number not for citation purposes)
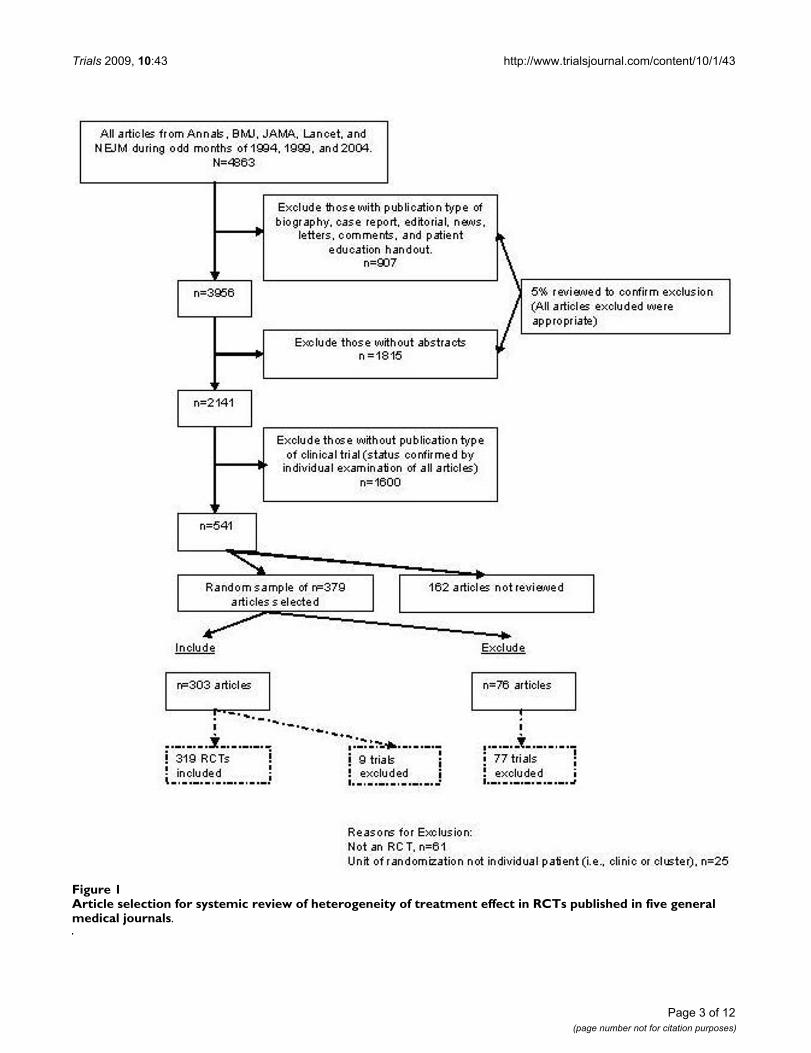
Table 1: Characteristics of included articles (n = 303) and RCTs described in these articles (n = 319)*
Characteristic Articles Represented # RCTs Included
Journal of publicationAnnals 30 (10) 30 (9)
BMJ 43 (14) 47 (15)
JAMA 45 (15) 50 (16)
Lancet 97 (32) 101 (32)
NEJM 88 (29) 91 (29)
Year of publication1994 86 (28) 91 (29)
1999 102 (34) 106 (33)
2004 115 (38) 122 (38)
Medical condition under studyCardiovascular 69 (23) 74 (23)
Infectious Disease 62 (20) 70 (22)
Cancer 41 (14) 42 (13)
Psychiatry/Neurology 25 (8) 25 (8)
Other 106 (35) 108 (34)
First author's study regionNorth America 115 (38) 121 (38)
Other 188 (62) 198 (62)
Study designParallel - 304 (95)
Crossover - 15 (5)
Analysis reportedHTE analysis - 92 (29)
Subgroup without statistical comparison - 88 (28)
None - 139 (44)
Sample size 262 (101 – 708)
- [6–41,000]
Abbreviations: RCTs, randomized controlled trials; BMJ, British Medical Journal; JAMA, Journal of the American Medical Association; NEJM, New England Journal of Medicine; HTE, heterogeneity of treatment effects.*Discrete data are expressed as No. (%); continuous values are presented as median (inter-quartile range) [range].
Trials 2009, 10:43 http://www.trialsjournal.com/content/10/1/43
Page 5 of 12(page number not for citation purposes)
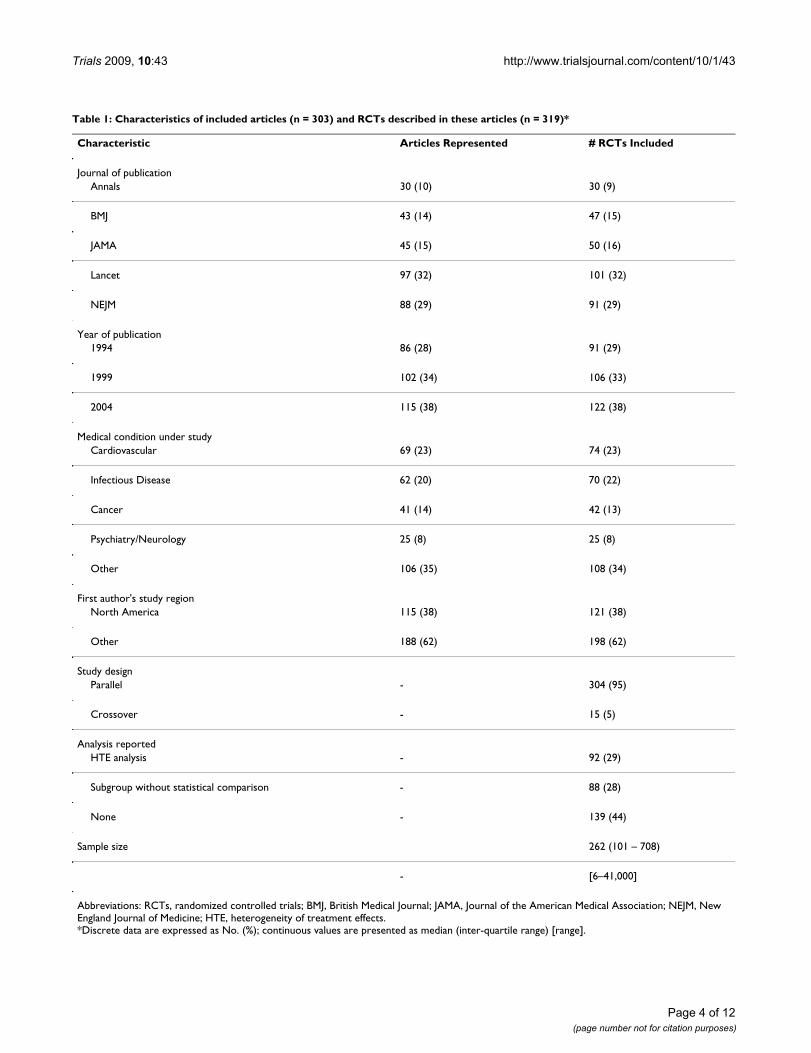
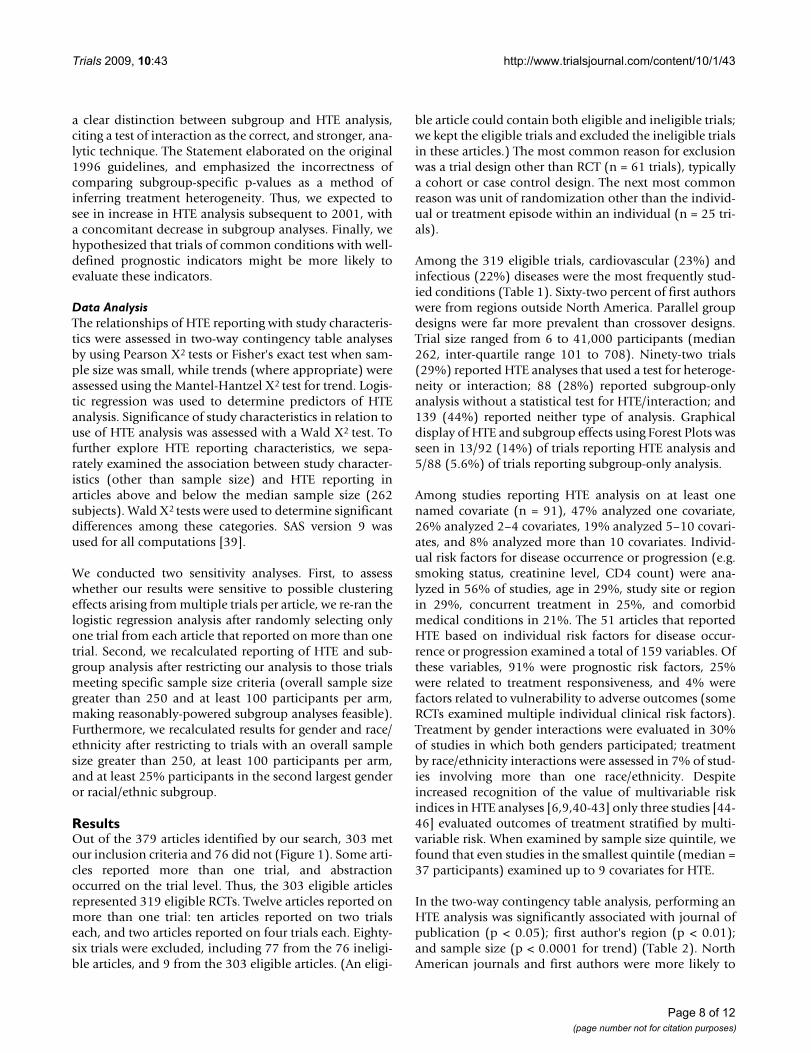
Table 2: HTE reporting by study characteristics (n = 319 RCTs in 303 articles)
Characteristic N No. (%) Reporting HTE No. (%) Reporting Either subgroup or HTE
Journal of publication † †Annals 30 11 (37) 16 (53)
BMJ 47 9 (19) 18 (38)
JAMA 50 21 (42) 33 (66)
Lancet 101 21 (21) 53 (53)
NEJM 91 30 (33) 60 (66)
Year of publication1994 91 20 (22) 47 (52)
1999 106 30 (28) 62 (58)
2004 122 42 (34) 71 (58)
Medical condition under study ‡Cardiovascular 74 21 (28) 43 (58)
Infectious disease 70 25 (36) 48 (69)
Cancer 42 15 (36) 30 (71)
Psychiatry/Neurology 25 7 (28) 12 (48)
Other 108 24 (22) 47 (44)
First author's study region ‡ ‡North America 121 47 (39) 80 (66)
Other 198 45 (23) 100 (51)
Study design ||Parallel 304 89 (29) 177 (58)
Crossover 15 3 (20) 3 (20)
Sample size ** **Quintile 1 (median = 37) 64 9 (14) 18 (28)
Quintile 2 (median = 124) 64 7 (11) 29 (45)
Quintile 3 (median = 263) 64 22 (34) 45 (70)
Quintile 4 (median = 549) 64 21 (33) 40 (63)
Quintile 5 (median = 1560) 63 33 (52) 48 (76)
Abbreviations: HTE, heterogeneity of treatment effects; RCTs, randomized controlled trials; BMJ, British Medical Journal; JAMA, Journal of the American Medical Association; NEJM, New England Journal of Medicine.†p < 0.05 by Pearson Chi-square test‡p < 0.01 by Pearson Chi-square test§p < 0.05 by Fisher's exact test||p < 0.01 by Fisher's exact test¶p < 0.05 by Mantel-Hantzel test for trend**p < 0.0001 by Mantel-Hantzel test for trend
Trials 2009, 10:43 http://www.trialsjournal.com/content/10/1/43
lished in the general medical literature in order to assesstrends over time, examine the appropriateness of the sta-
tistical methods used, and explore the predictors of suchanalyses. A persistently low rate of appropriate HTE orinteraction analysis would suggest missed opportunitiesfor identifying HTE.
MethodsOverviewWe conducted a literature sample of RCTs published infive prominent general medical journals during 1994,1999, and 2004. The search strategy and abstraction formsincorporated input from a Project Advisory Committee.Human Subjects committee approval was not required.The study was funded by Pfizer, Inc., under a contract tothe academic institutions involved. However, the investi-gators were solely responsible for all aspects of studydesign, data collection and analysis, and result reporting.
Data Sources and SearchesUsing PubMed, we searched for RCTs published in theAnnals of Internal Medicine, British Medical Journal, Journalof the American Medical Association, Lancet, and New Eng-land Journal of Medicine during odd numbered months in1994, 1999, and 2004 (Figure 1). These prominent medi-cal journals were selected because they have a broad read-ership, are the publication venue for many landmarkstudies, and have disproportionate influence on medicalresearch and practice [36,37]. During the period of inter-est, 4,863 articles appeared in these journals. Of these,907 were excluded for having publication types of "biog-raphy", "case report", "editorial", "news", "letters", "com-ments", and "patient education handout". The remaining3,956 articles were then restricted to include only journalarticles and reviews, thereby eliminating all articles with-out a research abstract (n = 1,815 articles excluded). Toassess the validity of these exclusions, one of the investi-gators reviewed a 5% random sample of the 2,722excluded articles, resulting in no questionable exclusions.Finally, the remaining 2,141 articles were subdivided intotwo groups: those with "clinical trial" as a publicationtype (n = 541) and those without (n = 1,600). The 1,600articles without clinical trial as publication type wereexcluded after they were examined by one investigator,and a 10% random sample was additionally examined bya second investigator, without finding any clinical trials.The 541 articles reporting on clinical trials were randomlysorted into 10 batches of 54 articles each (the tenth batchcontained 55 articles). Seven batches, or 379 articles, wererandomly selected and individually reviewed by twoinvestigators to determine final inclusion status. Discrep-ancies were resolved in consultation with a third investi-gator.
Study SelectionTo be included in our sample, a trial had to meet the fol-lowing criteria: (1) human study population; (2) parallelgroup RCT (including matched pair trials) or a crossover
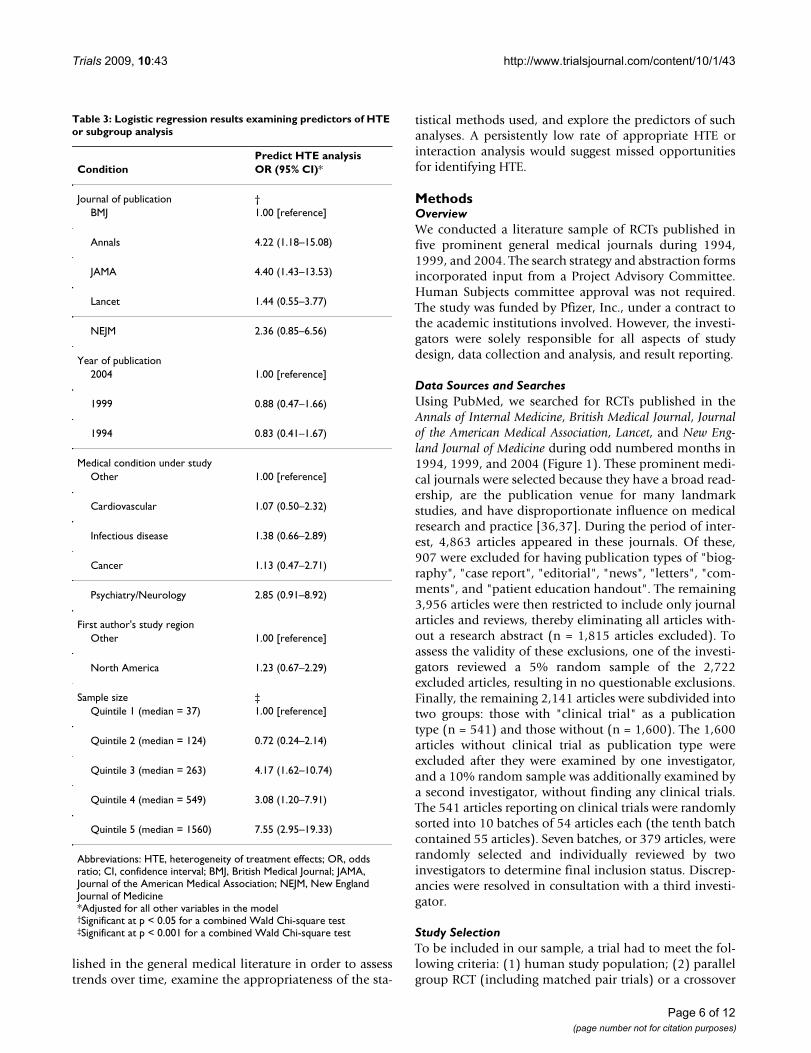
Table 3: Logistic regression results examining predictors of HTE or subgroup analysis
Predict HTE analysisCondition OR (95% CI)*
Journal of publication †BMJ 1.00 [reference]
Annals 4.22 (1.18–15.08)
JAMA 4.40 (1.43–13.53)
Lancet 1.44 (0.55–3.77)
NEJM 2.36 (0.85–6.56)
Year of publication2004 1.00 [reference]
1999 0.88 (0.47–1.66)
1994 0.83 (0.41–1.67)
Medical condition under studyOther 1.00 [reference]
Cardiovascular 1.07 (0.50–2.32)
Infectious disease 1.38 (0.66–2.89)
Cancer 1.13 (0.47–2.71)
Psychiatry/Neurology 2.85 (0.91–8.92)
First author's study regionOther 1.00 [reference]
North America 1.23 (0.67–2.29)
Sample size ‡Quintile 1 (median = 37) 1.00 [reference]
Quintile 2 (median = 124) 0.72 (0.24–2.14)
Quintile 3 (median = 263) 4.17 (1.62–10.74)
Quintile 4 (median = 549) 3.08 (1.20–7.91)
Quintile 5 (median = 1560) 7.55 (2.95–19.33)
Abbreviations: HTE, heterogeneity of treatment effects; OR, odds ratio; CI, confidence interval; BMJ, British Medical Journal; JAMA, Journal of the American Medical Association; NEJM, New England Journal of Medicine*Adjusted for all other variables in the model†Significant at p < 0.05 for a combined Wald Chi-square test‡Significant at p < 0.001 for a combined Wald Chi-square test
Page 6 of 12(page number not for citation purposes)
Trials 2009, 10:43 http://www.trialsjournal.com/content/10/1/43
RCT (including n-of-1 trials); and (3) individual patientor time (treatment episode) within patient (for crossovertrials) was the unit of randomization. We excluded trialsthat used cluster randomization because these trials gen-erally focus on group- or organizational-level treatmenteffects.
Data Extraction, Measures, and HypothesesAll data were abstracted independently by two trainedabstractors. Any disagreements were adjudicated by a sen-ior investigator. We used a standard protocol, form, anddatabase that collected the following information: firstauthor's name, article identification number, trial number(if more than one trial was reported in a particular article),condition under study (e.g. cardiovascular disease, can-cer), country of first author's institution, continents fromwhich the participants were derived, total number of par-ticipants randomized, number and percent of male partic-ipants, age of participants (mean, median, standarddeviation, range, reported categories), race of participants(number and percent), and number of treatment arms.For each arm, the following information was collected:number of participants; description of treatment provided(i.e. drug, medical device, surgical procedure); and gen-der, age, and race of participants.
The use (or non-use) of HTE analysis was the primary out-come. In addition, we also examined the presence of sub-group-only analysis, and either subgroup or HTE analysis,as secondary outcomes. Subgroup-only analyses representmissed opportunities on the path to understanding HTE;with minor effort, studies that reported subgroup-onlyanalyses could have conducted formal HTE analyses andprovided direct information on HTE. The additional step
(of conducting a formal HTE analysis as opposed to a sub-group-only analysis) is important because it will provideimportant hypothesis-generating information for futurestudies. We therefore identified all trials as reportingeither (1) HTE analysis, utilizing a formal test for hetero-geneity or interaction; (2) subgroup-only analysis, withno formal statistical tests for heterogeneity or interaction,or (3) neither. For trials that reported HTE analysis, thecovariates examined were also recorded. These covariateswere later categorized by one investigator with consulta-tion from a second as needed, into the following catego-ries: age, gender, race/ethnicity, center/trial site/country,individual clinical risk factor, multivariable risk index, co-occurring treatment, comorbidity, and socioeconomic sta-tus (income, marital status, and education). Individualclinical risk factors were further categorized as beingrelated to prognosis, treatment responsiveness, or treat-ment vulnerability [2]. We also coded whether the authorspresented information using a Forest Plot (a graph depict-ing subgroup results as point estimates [boxes] and confi-dence intervals [lines]) [38].
Potential predictors of HTE and subgroup-only analysisincluded journal name, year, condition studied, geo-graphic region of the first author's home institution, trialdesign (either parallel or crossover RCT), and sample size(in quintiles). We expected that different journals mighthave different reporting policies, possibly influenced byprevailing norms of the country of publication, which inturn might be confounded with the first author's geo-graphic region. We also hypothesized that HTE analysismight increase over time as CONSORT standards weredisseminated, and that HTE analysis would increase withsample size. The revised CONSORT standards [18] made
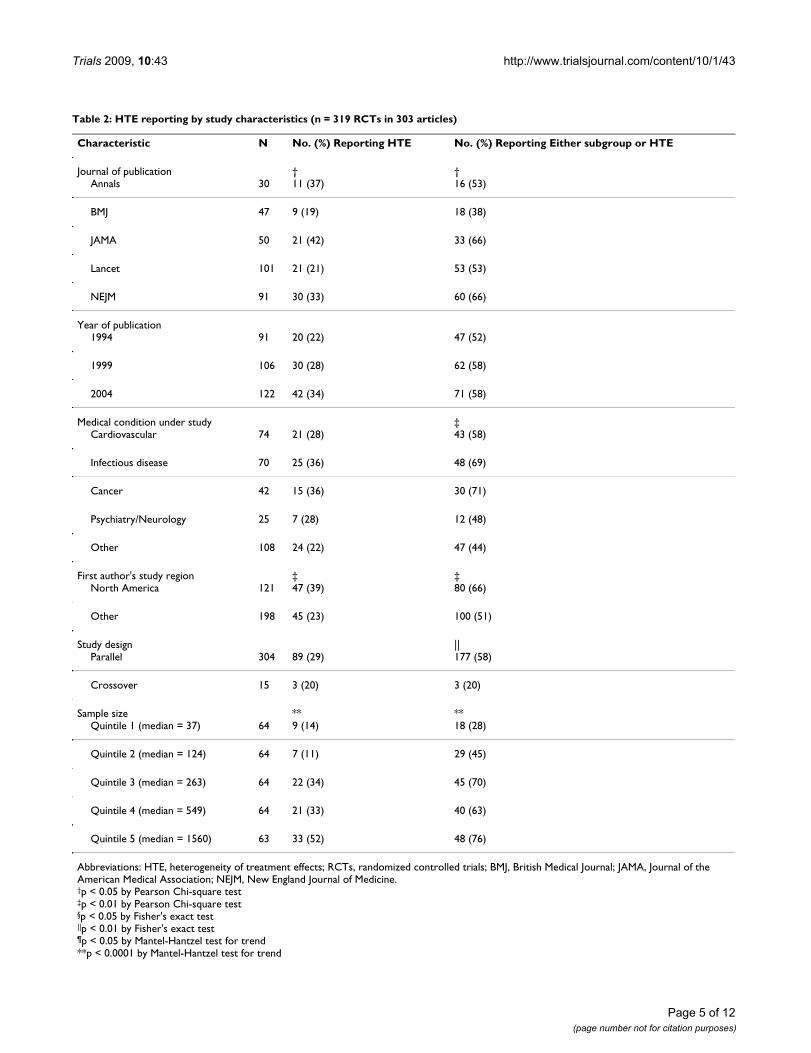
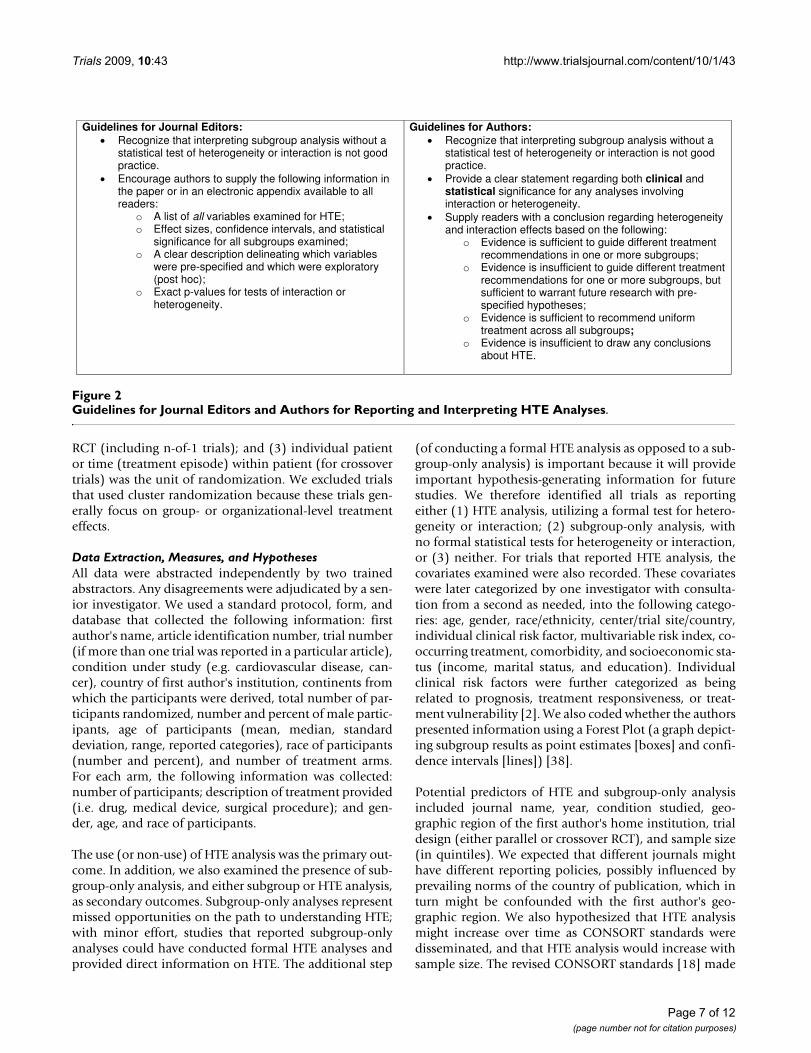
Guidelines for Journal Editors and Authors for Reporting and Interpreting HTE AnalysesFigure 2Guidelines for Journal Editors and Authors for Reporting and Interpreting HTE Analyses.
Guidelines for Journal Editors: Recognize that interpreting subgroup analysis without a statistical test of heterogeneity or interaction is not good practice.Encourage authors to supply the following information in the paper or in an electronic appendix available to all readers:
o A list of all variables examined for HTE; o Effect sizes, confidence intervals, and statistical
significance for all subgroups examined; o A clear description delineating which variables
were pre-specified and which were exploratory (post hoc);
o Exact p-values for tests of interaction or heterogeneity.
Guidelines for Authors: Recognize that interpreting subgroup analysis without a statistical test of heterogeneity or interaction is not good practice.Provide a clear statement regarding both clinical and statistical significance for any analyses involving interaction or heterogeneity. Supply readers with a conclusion regarding heterogeneity and interaction effects based on the following:
o Evidence is sufficient to guide different treatment recommendations in one or more subgroups;
o Evidence is insufficient to guide different treatment recommendations for one or more subgroups, but sufficient to warrant future research with pre-specified hypotheses;
o Evidence is sufficient to recommend uniform treatment across all subgroups;
o Evidence is insufficient to draw any conclusions about HTE.
Page 7 of 12(page number not for citation purposes)
Trials 2009, 10:43 http://www.trialsjournal.com/content/10/1/43
a clear distinction between subgroup and HTE analysis,citing a test of interaction as the correct, and stronger, ana-lytic technique. The Statement elaborated on the original1996 guidelines, and emphasized the incorrectness ofcomparing subgroup-specific p-values as a method ofinferring treatment heterogeneity. Thus, we expected tosee in increase in HTE analysis subsequent to 2001, witha concomitant decrease in subgroup analyses. Finally, wehypothesized that trials of common conditions with well-defined prognostic indicators might be more likely toevaluate these indicators.
Data AnalysisThe relationships of HTE reporting with study characteris-tics were assessed in two-way contingency table analysesby using Pearson Χ2 tests or Fisher's exact test when sam-ple size was small, while trends (where appropriate) wereassessed using the Mantel-Hantzel Χ2 test for trend. Logis-tic regression was used to determine predictors of HTEanalysis. Significance of study characteristics in relation touse of HTE analysis was assessed with a Wald Χ2 test. Tofurther explore HTE reporting characteristics, we sepa-rately examined the association between study character-istics (other than sample size) and HTE reporting inarticles above and below the median sample size (262subjects). Wald Χ2 tests were used to determine significantdifferences among these categories. SAS version 9 wasused for all computations [39].
We conducted two sensitivity analyses. First, to assesswhether our results were sensitive to possible clusteringeffects arising from multiple trials per article, we re-ran thelogistic regression analysis after randomly selecting onlyone trial from each article that reported on more than onetrial. Second, we recalculated reporting of HTE and sub-group analysis after restricting our analysis to those trialsmeeting specific sample size criteria (overall sample sizegreater than 250 and at least 100 participants per arm,making reasonably-powered subgroup analyses feasible).Furthermore, we recalculated results for gender and race/ethnicity after restricting to trials with an overall samplesize greater than 250, at least 100 participants per arm,and at least 25% participants in the second largest genderor racial/ethnic subgroup.
ResultsOut of the 379 articles identified by our search, 303 metour inclusion criteria and 76 did not (Figure 1). Some arti-cles reported more than one trial, and abstractionoccurred on the trial level. Thus, the 303 eligible articlesrepresented 319 eligible RCTs. Twelve articles reported onmore than one trial: ten articles reported on two trialseach, and two articles reported on four trials each. Eighty-six trials were excluded, including 77 from the 76 ineligi-ble articles, and 9 from the 303 eligible articles. (An eligi-
ble article could contain both eligible and ineligible trials;we kept the eligible trials and excluded the ineligible trialsin these articles.) The most common reason for exclusionwas a trial design other than RCT (n = 61 trials), typicallya cohort or case control design. The next most commonreason was unit of randomization other than the individ-ual or treatment episode within an individual (n = 25 tri-als).
Among the 319 eligible trials, cardiovascular (23%) andinfectious (22%) diseases were the most frequently stud-ied conditions (Table 1). Sixty-two percent of first authorswere from regions outside North America. Parallel groupdesigns were far more prevalent than crossover designs.Trial size ranged from 6 to 41,000 participants (median262, inter-quartile range 101 to 708). Ninety-two trials(29%) reported HTE analyses that used a test for heteroge-neity or interaction; 88 (28%) reported subgroup-onlyanalysis without a statistical test for HTE/interaction; and139 (44%) reported neither type of analysis. Graphicaldisplay of HTE and subgroup effects using Forest Plots wasseen in 13/92 (14%) of trials reporting HTE analysis and5/88 (5.6%) of trials reporting subgroup-only analysis.
Among studies reporting HTE analysis on at least onenamed covariate (n = 91), 47% analyzed one covariate,26% analyzed 2–4 covariates, 19% analyzed 5–10 covari-ates, and 8% analyzed more than 10 covariates. Individ-ual risk factors for disease occurrence or progression (e.g.smoking status, creatinine level, CD4 count) were ana-lyzed in 56% of studies, age in 29%, study site or regionin 29%, concurrent treatment in 25%, and comorbidmedical conditions in 21%. The 51 articles that reportedHTE based on individual risk factors for disease occur-rence or progression examined a total of 159 variables. Ofthese variables, 91% were prognostic risk factors, 25%were related to treatment responsiveness, and 4% werefactors related to vulnerability to adverse outcomes (someRCTs examined multiple individual clinical risk factors).Treatment by gender interactions were evaluated in 30%of studies in which both genders participated; treatmentby race/ethnicity interactions were assessed in 7% of stud-ies involving more than one race/ethnicity. Despiteincreased recognition of the value of multivariable riskindices in HTE analyses [6,9,40-43] only three studies [44-46] evaluated outcomes of treatment stratified by multi-variable risk. When examined by sample size quintile, wefound that even studies in the smallest quintile (median =37 participants) examined up to 9 covariates for HTE.
In the two-way contingency table analysis, performing anHTE analysis was significantly associated with journal ofpublication (p < 0.05); first author's region (p < 0.01);and sample size (p < 0.0001 for trend) (Table 2). NorthAmerican journals and first authors were more likely to
Page 8 of 12(page number not for citation purposes)
Trials 2009, 10:43 http://www.trialsjournal.com/content/10/1/43
publish trials with HTE analysis. While the associationbetween HTE analysis and sample size is intuitive, HTEanalysis was reported in only 52% of studies within thelargest sample size quintile (Table 2). There was also a sig-nificant trend toward more HTE analysis over time (p =0.047). Subgroup analysis only (without an appropriatestatistical test for heterogeneity or interaction) wasobserved in 29% of parallel group trials and in no crosso-ver trials. In the two-way contingency table analysis, sub-group analysis only was not significantly associated withany of the study characteristics (data not shown).
Using multiple logistic regression to examine trial year,journal of publication, clinical condition, first author'strial region, and sample size, only sample size and journalof publication were significant predictors of HTE analysis;we found no significant trend over time (p = 0.52) (Table3). The adjusted odds ratios comparing the top quintile ofsample size (median = 1560) to the bottom quintile(median = 37) was 7.5 (95% confidence interval, 2.9–19.3). For journal, the adjusted odds ratio for Annals ofInternal Medicine was 4.2 (95% CI, 1.2–15.1) and forJAMA was 4.4 (95% CI, 1.4–13.5), with BMJ as the refer-ence group. Restricting the analysis to trials above themedian sample size (n ≥ 262 subjects), 42% of trials per-formed HTE analysis (35% in the 3rd quartile, 48% in the4th quartile; data not shown in tabular form). Randomselection of only one trial per article (to avert any possibleclustering effect) did not materially alter the results of thelogistic regression analysis.
In the sensitivity analysis, there were 153 studies withsample size of at least 250 with a minimum of 100 sub-jects per trial arm. Sixty-one of these trials (40%) reportedHTE analysis, 47 (31%) reported subgroup analysis only,and 45 studies (29%) did not report either type of analy-sis. Among 104 trials with at least 25 male subjects and 25female subjects per arm, 14 trials (13.5%) examined gen-der for HTE, compared with 3/33 (9%) among those notmeeting these minimal sample size criteria. Only 5/34(15%) of trials meeting minimal sample size criteria forrace/ethnicity (see Methods) conducted an HTE analysiswith respect to race/ethnicity.
DiscussionThis review of 319 RCTs published in five prominent gen-eral medical journals is the most comprehensive to date,and the only one that examines trends of HTE reportingover time. The results suggest that reporting on HTEoccurs in less than one-third of studies published inprominent general medical journals, and were only mar-ginally better in 2004 than in 1994. Overall, less than one-third of studies in our sample reported HTE analysis, aresult consistent with previous, less comprehensivereviews. Another 28% reported subgroup-only analyseswithout formal statistical tests for HTE/interaction.
These trials are missed opportunities. With minimal addi-tional effort, they could have added statistical tests forHTE or interaction in addition to the subgroup results thatthey reported, nearly doubling the proportion of HTEanalyses and enriching the literature with much-neededHTE information. Such tests are critical for appropriateinterpretation of results, as differences in subgroup-spe-cific point estimates are meaningful only when evaluatedalongside their corresponding confidence intervals.
Considering both HTE analyses and subgroup-only anal-yses, 57% of the trials in our review reported some kind ofsubgroup analysis, a proportion that increased to aboutthree-quarters if we examine only the largest trials. Previ-ous research reported equal [34] or higher [27,32,33,35]proportions, possibly because of restriction to trials of aminimum sample size, a specific discipline, or a specificjournal.
The biostatistical literature tends to view subgroup analy-sis skeptically, often citing the dual problems of multiplestatistical comparisons and low power [16,47]. This viewis likely reinforced by the impression that the analysesthemselves are poorly performed. Our results support thisjudgment. Wang et al. [35] recently outlined detailedguidelines for reporting subgroup analyses in manu-scripts, including specific information that authors shouldinclude, by section. We present complementary guide-lines in Figure 2, and emphasize the role of journal editorsin setting appropriate standards for subgroup analysisreporting. There are three major principles to our guide-lines. The first and second underscore the CONSORT rec-ommendations [18] that (1) proper HTE analysis requiresstatistical tests of interaction or heterogeneity and (2) thatall variables examined for HTE should be labeled as pre-specified or post hoc and reported in the body of thepaper or in an electronic appendix. Finally, we advocatefor authors explicitly considering the clinical and statisti-cal significance of results obtained, and provide recom-mendations for future research and clinical practice. Inaddition, when the purpose of HTE analysis is hypothesisgeneration, it may make sense to accept a more lenientstandard of statistical significance (i.e. 0.10). Reportingonly subgroup-specific effects without an appropriate testof heterogeneity or interaction can be misleading [24]. Yetidentifying potential moderators of treatment effects iscritical to patient-centered, individualized care[2,8,25,48]. Inconsistent reporting of subgroup analysisnot only impairs recognition of patients who mayrespond better or worse than average, but also impedeshypothesis generation and stifles future research.Although tests for heterogeneity and interaction have lowpower for detecting modest but potentially clinicallyimportant subgroup differences, they represent a conserv-ative approach and provide a brake on the tendency toover-interpret observed subgroup differences. However, it
Page 9 of 12(page number not for citation purposes)
Trials 2009, 10:43 http://www.trialsjournal.com/content/10/1/43
is important to conduct HTE analysis with caution andnot over interpret the results. It is necessary to recognizethat post hoc HTE analyses are for hypothesis generationand to aid in the design of future confirmatory studies,that significant effects may be a result of intra-individualvariability, and that the results of such analyses shouldnot be used to promote different treatment recommenda-tions.
Among trials that explored heterogeneity of treatmenteffects, clinical prognostic factors were evaluated fre-quently; age, gender, and site factors less often; and race/ethnicity rarely. Even among those trials with a samplesize adequate for exploring HTE by race/ethnicity, only7% of trials did so. The limited attention to race/ethnicityis puzzling for two reasons. First, the literature providesexamples in which race/ethnicity influences baseline riskof a disease [49], responsiveness to treatment [50], andvulnerability to adverse outcomes [51]. Second, growinginterest in genomics might be expected to stimulate inter-est in the treatment-modifying effects of genetic proxies,including imperfect ones like race/ethnicity. Consistentwith Parker et al. [27], we found little use of multivariaterisk stratification, an approach that may greatly increasestatistical power for detecting HTE [48].
More frequent HTE analysis in North American journalsmay reflect differences in biostatistical perspectives or bio-medical culture. The dominant norm tends to be moreconservative in Europe and especially in Britain, perhapsas a result of public payment for care, which demands ahigher standard of evidence before treatments are widelyaccepted and delivered [52-54]. The trend for increasedHTE analysis between 1994 and 2004 may be attributableto the revised CONSORT recommendations and a grow-ing awareness of the potential of such analyses. The rela-tively infrequent use of Forest Plots, even among studiesreporting HTE analysis, is regrettable because these plotsare a simple, compact, and readily understood method ofpresenting potential moderators.
Our results should be interpreted in light of several limi-tations. First, we reviewed a limited number of trials. It ispossible that subgroup-specific trials were published inother journals, or during months or years that we did notsample. However, our sample included five large-circula-tion, high-impact journals with strict peer-review stand-ards, so our sample should be representative of well-designed clinical trials that generalist clinicians are mostlikely to read and that major news media are most likelyto publicize. Second, it is possible that some trials con-ducted HTE analysis but did not report it because theresults were not statistically significant. However, evennon-significant data are useful for the purposes of hypoth-esis generation and, arguably, authors should report any
HTE analysis, significant or not, and especially when theanalysis is pre-specified. Third, our standards for HTEreporting may not reflect journals' own standards for HTEreporting. A more conservative statistical review processmay result in reduced HTE reporting, regardless of theanalysis actually conducted in the study. Finally, our rec-ommendations for authors and editors are based on aninformal procedure, and should be interpreted in light ofthis limitation. Further refinement of the recommenda-tions may be necessary before adoption by editors andauthors.
ConclusionOur findings indicate that HTE reporting in the generalmedical literature is neither rigorous nor routine. Giventhe increasing recognition of HTE [2,3,25], it may be timeto develop standards for reporting of exploratory and con-firmatory HTE analysis. In 1994, the National Institutes ofHealth mandated the inclusion of women and racial/eth-nic minorities in research populations and, in 2000, sup-plemented that recommendation with guidelinesregarding the reporting of subgroup-specific results ofPhase III Clinical Trials [55]. Although these guidelinesincluded a recommendation that investigators report bothsignificant and non-significant results, our data show onlymodest progress toward that goal. Highlighting variablesthat deserve further exploration is a first step in identifyinggroups that may or may not respond better to a given ther-apy [56]. Because trials in more responsive subgroupshave lower sample size requirements, identifying thesegroups through exploratory subgroup analysis could facil-itate relatively cost-effective confirmatory trials. An itera-tive process of exploratory followed by confirmatory HTEanalysis may not only quicken the cycle of discovery butalso inform clinical judgment.
AbbreviationsHTE: heterogeneity of treatment effects; RCT: randomizedcontrolled trials; ITE: individual treatment effect; CON-SORT: Consolidated Standards of Reporting Trials; BMJ:British Medical Journal; JAMA: Journal of the AmericanMedical Association; NEJM: New England Journal of Med-icine.
Competing interestsThe authors declare that they have no competing interests.
This work was supported by a grant from Pfizer, Inc.
Dr. Elmore is supported by a Public Health Research grantfrom the National Institutes of Health (#5 K05CA104699-04). Dr. Kravitz holds a K24 MidcareerResearch and Development Award (#5 K24 MH072756-03) from the National Institute of Mental Health.
Page 10 of 12(page number not for citation purposes)
Trials 2009, 10:43 http://www.trialsjournal.com/content/10/1/43
Authors' contributionsThe authors co-developed the ideas in the manuscript. NGdrafted the manuscript and RK, ND, JE, and TG reviewedand revised the manuscript. DL provided statistical analy-sis support. NG had full access to all of the data in thestudy and takes responsibility for the integrity of the dataand the accuracy of the data analysis. All authors read andapproved the final manuscript.
AcknowledgementsWe are grateful to Paul Shekelle, MD (RAND/UCLA, Los Angeles, CA) and Helena Kraemer, PhD (Stanford School of Medicine, Palo Alto, CA) for their helpful editorial input, to Irva Hertz-Picciotto, PhD (UC Davis, Davis, CA) for her helpful input while serving as a member of the Advisory Panel, and to Danielle Seiden, MPP (UCLA, Los Angeles, CA), Elizabeth Yakes, MS, RD (UC Davis), and Kiavash Nikkhou, BS (UCLA) for their contributions to data collection and abstraction.
The study was funded by Pfizer, Inc., under a contract to the academic insti-tutions involved. However, the investigators were solely responsible for all aspects of study design, data collection and analysis, and result reporting.
Dr. Elmore is supported by a Public Health Research grant from the National Institutes of Health (#5 K05 CA104699-04). Dr. Kravitz holds a K24 Midcareer Research and Development Award (#5 K24 MH072756-03) from the National Institute of Mental Health.
This work was presented at the Society of General Internal Medicine meet-ing, April 25–28, 2007, Toronto, ON, Canada, and at AcademyHealth, June 3–5, 2007, Orlando, FL.
References1. Longford NT: Selection bias and treatment heterogeneity in
clinical trials. Stat Med 1999, 18:1467-1474.2. Kravitz RL, Duan N, Braslow J: Evidence-based medicine, heter-
ogeneity of treatment effects, and the trouble with averages.Milbank Q 2004, 82:661-687.
3. Greenfield S, Kravitz R, Duan N, Kaplan SH: Heterogeneity oftreatment effects: implications for guidelines, payment, andquality assessment. Am J Med 2007, 120:S3-9.
4. Spear BB, Heath-Chiozzi M, Huff J: Clinical application of phar-macogenetics. Trends Mol Med 2001, 7:201-204.
5. Connor S: Glaxo chief: Our drugs do not work on mostpatients. The Independent 2003.
6. Kent DM, Ruthazer R, Selker HP: Are some patients likely tobenefit from recombinant tissue-type plasminogen activatorfor acute ischemic stroke even beyond 3 hours from symp-tom onset? Stroke 2003, 34:464-467.
7. Rothwell PM: Treating individuals 2. Subgroup analysis in ran-domised controlled trials: importance, indications, andinterpretation. Lancet 2005, 365:176-186.
8. Rothwell PM, Mehta Z, Howard SC, Gutnikov SA, Warlow CP:Treating individuals 3: from subgroups to individuals: gen-eral principles and the example of carotid endarterectomy.Lancet 2005, 365:256-265.
9. Kent DM, Hayward RA: Limitations of applying summaryresults of clinical trials to individual patients: the need forrisk stratification. JAMA 2007, 298:1209-1212.
10. Guyatt G, Sackett D, Adachi J, Roberts R, Chong J, Rosenbloom D,Keller J: A clinician's guide for conducting randomized trialsin individual patients. Cmaj 1988, 139:497-503.
11. Guyatt G, Sackett D, Taylor DW, Chong J, Roberts R, Pugsley S:Determining optimal therapy – randomized trials in individ-ual patients. N Engl J Med 1986, 314:889-892.
12. Senn S: Individual response to treatment: is it a valid assump-tion? BMJ 2004, 329:966-968.
13. Senn S: Controversies concerning randomization and additiv-ity in clinical trials. Stat Med 2004, 23:3729-3753.
14. Hayward RA, Kent DM, Vijan S, Hofer TP: Reporting clinical trialresults to inform providers, payers, and consumers. Health Aff(Millwood) 2005, 24:1571-1581.
15. Kent DM, Hayward RA, Griffith JL, Vijan S, Beshansky JR, Califf RM,Selker HP: An independently derived and validated predictivemodel for selecting patients with myocardial infarction whoare likely to benefit from tissue plasminogen activator com-pared with streptokinase. Am J Med 2002, 113:104-111.
16. Cook DI, Gebski VJ, Keech AC: Subgroup analysis in clinical tri-als. Med J Aust 2004, 180:289-291.
17. Pocock SJ, Assmann SE, Enos LE, Kasten LE: Subgroup analysis,covariate adjustment and baseline comparisons in clinicaltrial reporting: current practice and problems. Stat Med 2002,21:2917-2930.
18. Altman DG, Schulz KF, Moher D, Egger M, Davidoff F, Elbourne D,Gotzsche PC, Lang T: The revised CONSORT statement forreporting randomized trials: explanation and elaboration.Ann Intern Med 2001, 134:663-694.
19. Stallones RA: The use and abuse of subgroup analysis in epide-miological research. Prev Med 1987, 16:183-194.
20. Nissen SE, Tuzcu EM, Schoenhagen P, Brown BG, Ganz P, Vogel RA,Crowe T, Howard G, Cooper CJ, Brodie B, et al.: Effect of intensivecompared with moderate lipid-lowering therapy on progres-sion of coronary atherosclerosis: a randomized controlledtrial. JAMA 2004, 291:1071-1080.
21. Norman PE, Jamrozik K, Lawrence-Brown MM, Le MT, Spencer CA,Tuohy RJ, Parsons RW, Dickinson JA: Population based ran-domised controlled trial on impact of screening on mortalityfrom abdominal aortic aneurysm. BMJ 2004, 329:1259.
22. Ruggenenti P, Perna A, Gherardi G, Garini G, Zoccali C, Salvadori M,Scolari F, Schena FP, Remuzzi G: Renoprotective properties ofACE-inhibition in non-diabetic nephropathies with non-nephrotic proteinuria. Lancet 1999, 354:359-364.
23. Torriani FJ, Rodriguez-Torres M, Rockstroh JK, Lissen E, Gonzalez-Garcia J, Lazzarin A, Carosi G, Sasadeusz J, Katlama C, Montaner J, etal.: Peginterferon Alfa-2a plus ribavirin for chronic hepatitisC virus infection in HIV-infected patients. N Engl J Med 2004,351:438-450.
24. Matthews JN, Altman DG: Statistics notes. Interaction 2: Com-pare effect sizes not P values. BMJ 1996, 313:808.
25. Kraemer HC, Frank E, Kupfer DJ: Moderators of treatment out-comes: clinical, research, and policy importance. JAMA 2006,296:1286-1289.
26. Lu M, Lyden PD, Brott TG, Hamilton S, Broderick JP, Grotta JC:Beyond subgroup analysis: improving the clinical interpreta-tion of treatment effects in stroke research. J Neurosci Methods2005, 143:209-216.
27. Parker AB, Naylor CD: Subgroups, treatment effects, and base-line risks: some lessons from major cardiovascular trials. AmHeart J 2000, 139:952-961.
28. Horwitz RI, Singer BH, Makuch RW, Viscoli CM: Clinical versusstatistical considerations in the design and analysis of clinicalresearch. J Clin Epidemiol 1998, 51:305-307.
29. Feinstein AR: The problem of cogent subgroups: a clinicosta-tistical tragedy. J Clin Epidemiol 1998, 51:297-299.
30. Kraemer HC, Stice E, Kazdin A, Offord D, Kupfer D: How do riskfactors work together? Mediators, moderators, and inde-pendent, overlapping, and proxy risk factors. Am J Psychiatry2001, 158:848-856.
31. Kraemer HC, Wilson GT, Fairburn CG, Agras WS: Mediators andmoderators of treatment effects in randomized clinical tri-als. Arch Gen Psychiatry 2002, 59:877-883.
32. Hernandez AV, Boersma E, Murray GD, Habbema JD, SteyerbergEW: Subgroup analyses in therapeutic cardiovascular clinicaltrials: are most of them misleading? Am Heart J 2006,151:257-264.
33. Assmann SF, Pocock SJ, Enos LE, Kasten LE: Subgroup analysis andother (mis)uses of baseline data in clinical trials. Lancet 2000,355:1064-1069.
34. Moreira ED Jr, Stein Z, Susser E: Reporting on methods of sub-group analysis in clinical trials: a survey of four scientific jour-nals. Braz J Med Biol Res 2001, 34:1441-1446.
35. Wang R, Lagakos SW, Ware JH, Hunter DJ, Drazen JM: Statistics inmedicine – reporting of subgroup analyses in clinical trials. NEngl J Med 2007, 357:2189-2194.
Page 11 of 12(page number not for citation purposes)
Trials 2009, 10:43 http://www.trialsjournal.com/content/10/1/43
Publish with BioMed Central and every scientist can read your work free of charge
"BioMed Central will be the most significant development for disseminating the results of biomedical research in our lifetime."
Sir Paul Nurse, Cancer Research UK
Your research papers will be:
available free of charge to the entire biomedical community
peer reviewed and published immediately upon acceptance
cited in PubMed and archived on PubMed Central
yours — you keep the copyright
Submit your manuscript here:http://www.biomedcentral.com/info/publishing_adv.asp
BioMedcentral
36. Chew M, Villanueva EV, Weyden MB Van Der: Life and times ofthe impact factor: retrospective analysis of trends for sevenmedical journals (1994–2005) and their Editors' views. J R SocMed 2007, 100:142-150.
37. Garfield E: Which medical journals have the greatest impact?Ann Intern Med 1986, 105:313-320.
38. Lewis S, Clarke M: Forest plots: trying to see the wood and thetrees. Bmj 2001, 322:1479-1480.
39. SAS: 9th edition. Cary, North Carolina, USA: SAS Institute . 40. Antman EM, Cohen M, Bernink PJ, McCabe CH, Horacek T, Papuchis
G, Mautner B, Corbalan R, Radley D, Braunwald E: The TIMI riskscore for unstable angina/non-ST elevation MI: A method forprognostication and therapeutic decision making. Jama 2000,284:835-842.
41. Ioannidis JP, Lau J: Heterogeneity of the baseline risk withinpatient populations of clinical trials: a proposed evaluationalgorithm. Am J Epidemiol 1998, 148:1117-1126.
42. Morrow DA, Antman EM, Snapinn SM, McCabe CH, Theroux P,Braunwald E: An integrated clinical approach to predicting thebenefit of tirofiban in non-ST elevation acute coronary syn-dromes. Application of the TIMI Risk Score for UA/NSTEMIin PRISM-PLUS. Eur Heart J 2002, 23:223-229.
43. Rothwell PM, Warlow CP: Prediction of benefit from carotidendarterectomy in individual patients: a risk-modellingstudy. European Carotid Surgery Trialists' CollaborativeGroup. Lancet 1999, 353:2105-2110.
44. The ESPRIM trial: short-term treatment of acute myocardialinfarction with molsidomine. European Study of Preventionof Infarct with Molsidomine (ESPRIM) Group. Lancet 1994,344:91-97.
45. Bjornson CL, Klassen TP, Williamson J, Brant R, Mitton C, Plint A,Bulloch B, Evered L, Johnson DW: A randomized trial of a singledose of oral dexamethasone for mild croup. N Engl J Med 2004,351:1306-1313.
46. Milpied N, Deconinck E, Gaillard F, Delwail V, Foussard C, BerthouC, Gressin R, Lucas V, Colombat P, Harousseau JL: Initial treat-ment of aggressive lymphoma with high-dose chemotherapyand autologous stem-cell support. N Engl J Med 2004,350:1287-1295.
47. Cui L, Hung HM, Wang SJ, Tsong Y: Issues related to subgroupanalysis in clinical trials. J Biopharm Stat 2002, 12:347-358.
48. Hayward RA, Kent DM, Vijan S, Hofer TP: Multivariable risk pre-diction can greatly enhance the statistical power of clinicaltrial subgroup analysis. BMC Med Res Methodol 2006, 6:18.
49. Haiman CA, Stram DO, Wilkens LR, Pike MC, Kolonel LN, Hender-son BE, Le Marchand L: Ethnic and racial differences in thesmoking-related risk of lung cancer. N Engl J Med 2006,354:333-342.
50. Conjeevaram HS, Fried MW, Jeffers LJ, Terrault NA, Wiley-Lucas TE,Afdhal N, Brown RS, Belle SH, Hoofnagle JH, Kleiner DE, Howell CD:Peginterferon and ribavirin treatment in African Americanand Caucasian American patients with hepatitis C genotype1. Gastroenterology 2006, 131:470-477.
51. McDowell SE, Coleman JJ, Ferner RE: Systematic review andmeta-analysis of ethnic differences in risks of adverse reac-tions to drugs used in cardiovascular medicine. BMJ 2006,332:1177-1181.
52. Department of Health: A first class service: quality in the newNHS. London: Department of Health; 1998.
53. Department of Health: "Faster Access to Modern Treatment":how NICE appraisal will work. Leeds: NHS Executive; 1999.
54. Rawlins M: In pursuit of quality: the National Institute for Clin-ical Excellence. Lancet 1999, 353:1079-1082.
55. NIH guidelines on the inclusion of women and minorities assubjects in clinical research [http://grants.nih.gov/grants/guide/notice-files/NOT-OD-00-048.html]
56. Trusheim MR, Berndt ER, Douglas FL: Stratified medicine: strate-gic and economic implications of combining drugs and clini-cal biomarkers. Nat Rev Drug Discov 2007, 6:287-293.
Page 12 of 12(page number not for citation purposes)