Embed Size (px)
Citation preview
7/27/2019 Debug Tools
http://slidepdf.com/reader/full/debug-tools 1/58
Debugging Tools
Towards better use of system tools to
weed the nasty critters out of your programs
7/27/2019 Debug Tools
http://slidepdf.com/reader/full/debug-tools 2/58
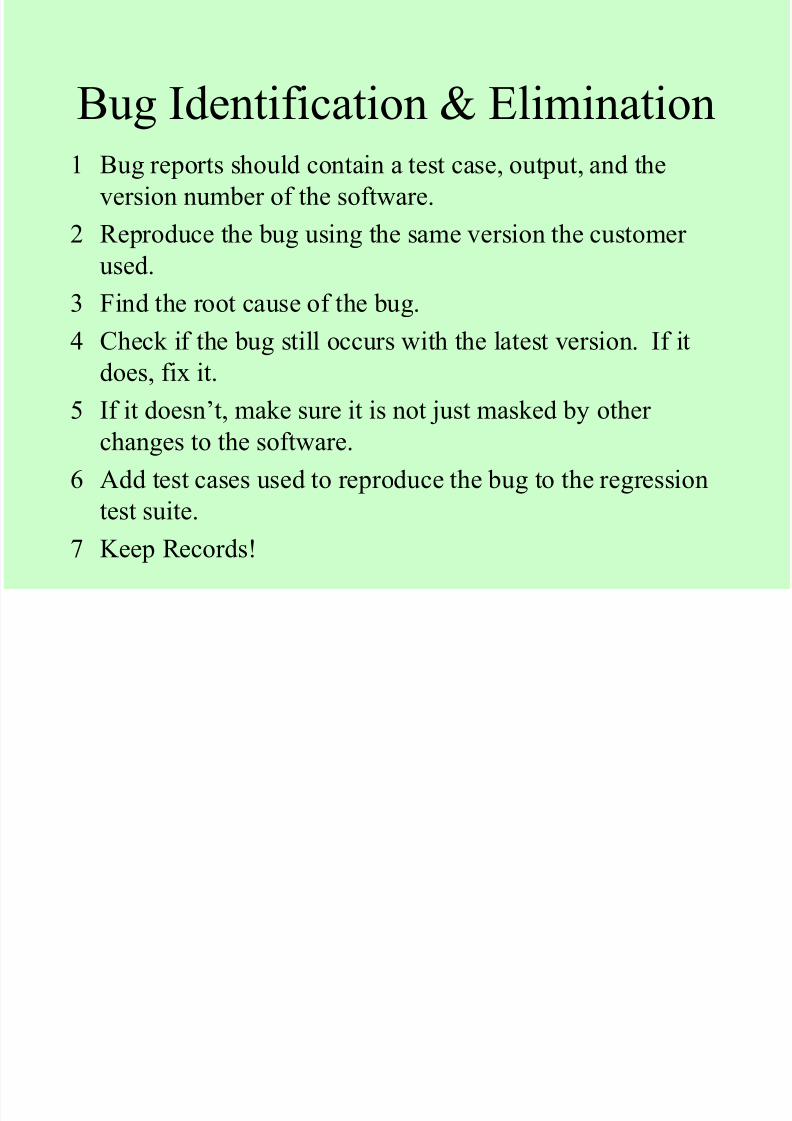
Bug Identification & Elimination1 Bug reports should contain a test case, output, and the
version number of the software.
2 Reproduce the bug using the same version the customer
used.3 Find the root cause of the bug.
4 Check if the bug still occurs with the latest version. If it
does, fix it.
5 If it doesn’t, make sure it is not just masked by other changes to the software.
6 Add test cases used to reproduce the bug to the regression
test suite.
7 Keep Records!
7/27/2019 Debug Tools
http://slidepdf.com/reader/full/debug-tools 3/58
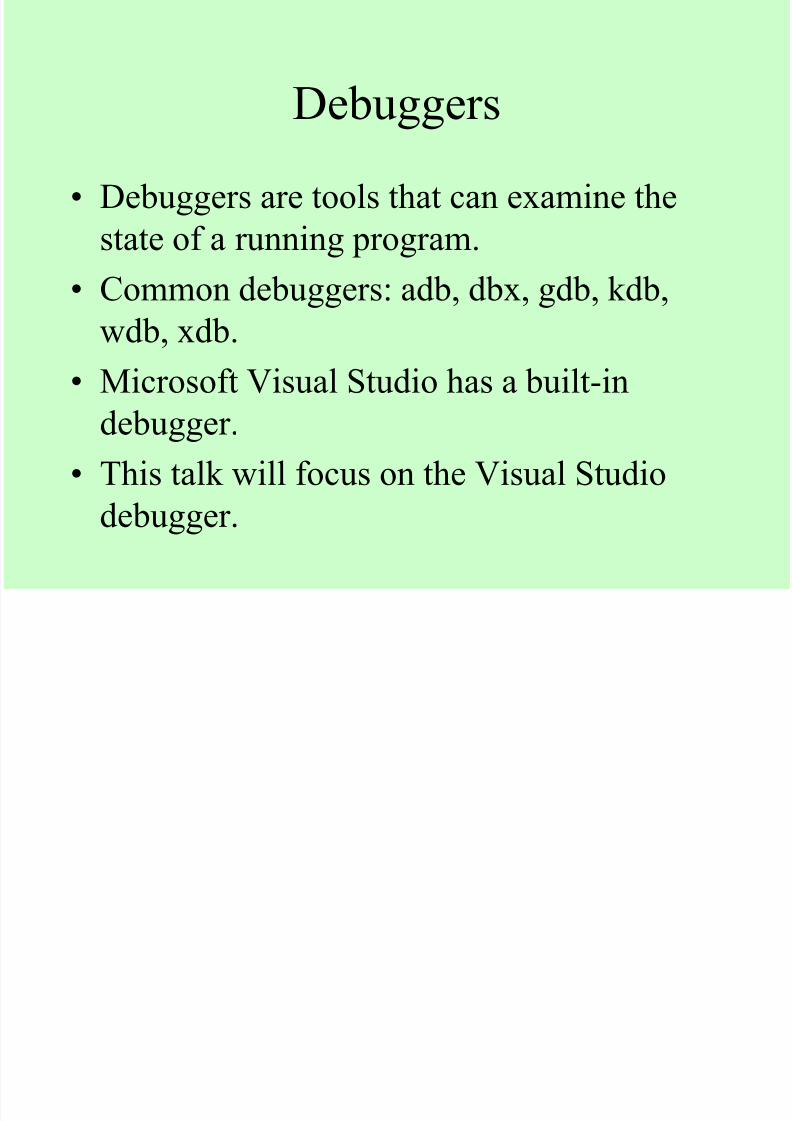
Debuggers
• Debuggers are tools that can examine the
state of a running program.
• Common debuggers: adb, dbx, gdb, kdb,
wdb, xdb.
• Microsoft Visual Studio has a built-in
debugger.
• This talk will focus on the Visual Studio
debugger.

7/27/2019 Debug Tools
http://slidepdf.com/reader/full/debug-tools 4/58
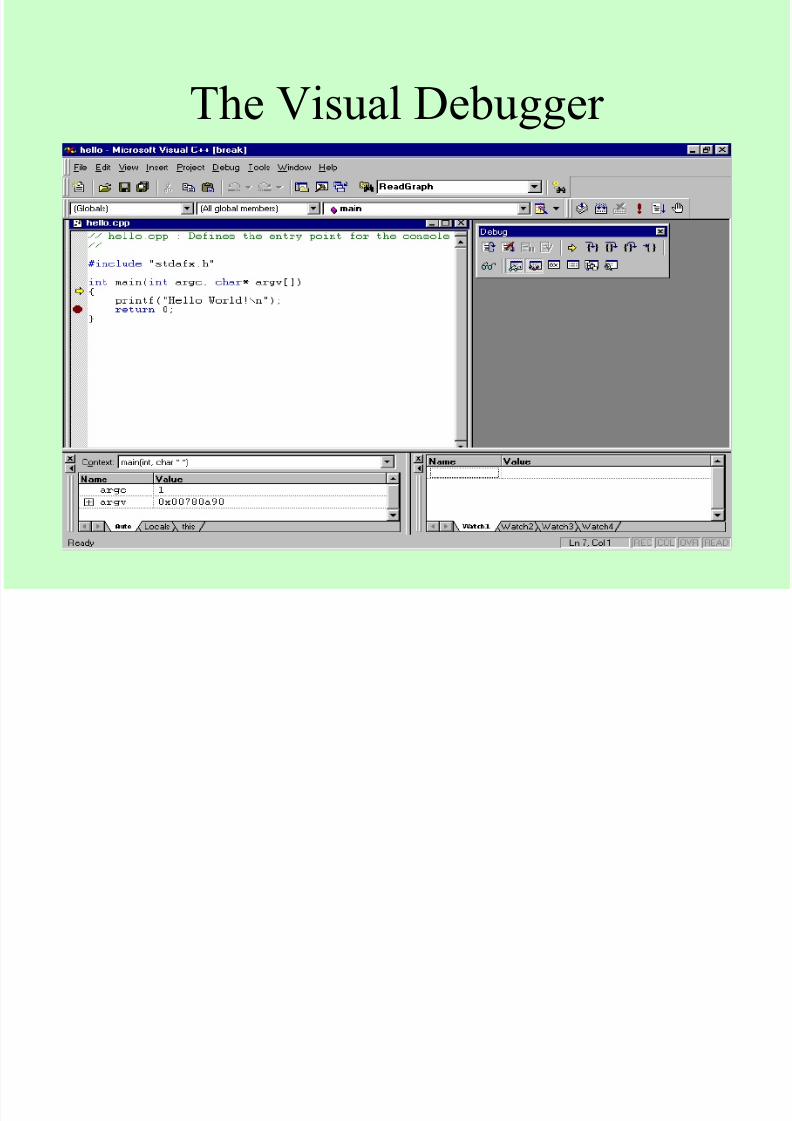
Visual Debugger
• Graphically Oriented
• Run from Visual Studio
• Can debug a failed process by selecting the
Yes button at “Debug Application” dialog
after a memory or other failure occurs
• Can attach to a running process by choosing
the Tools->Start Debug->Attach to Process
menu option
7/27/2019 Debug Tools
http://slidepdf.com/reader/full/debug-tools 5/58
The Visual Debugger
7/27/2019 Debug Tools
http://slidepdf.com/reader/full/debug-tools 6/58
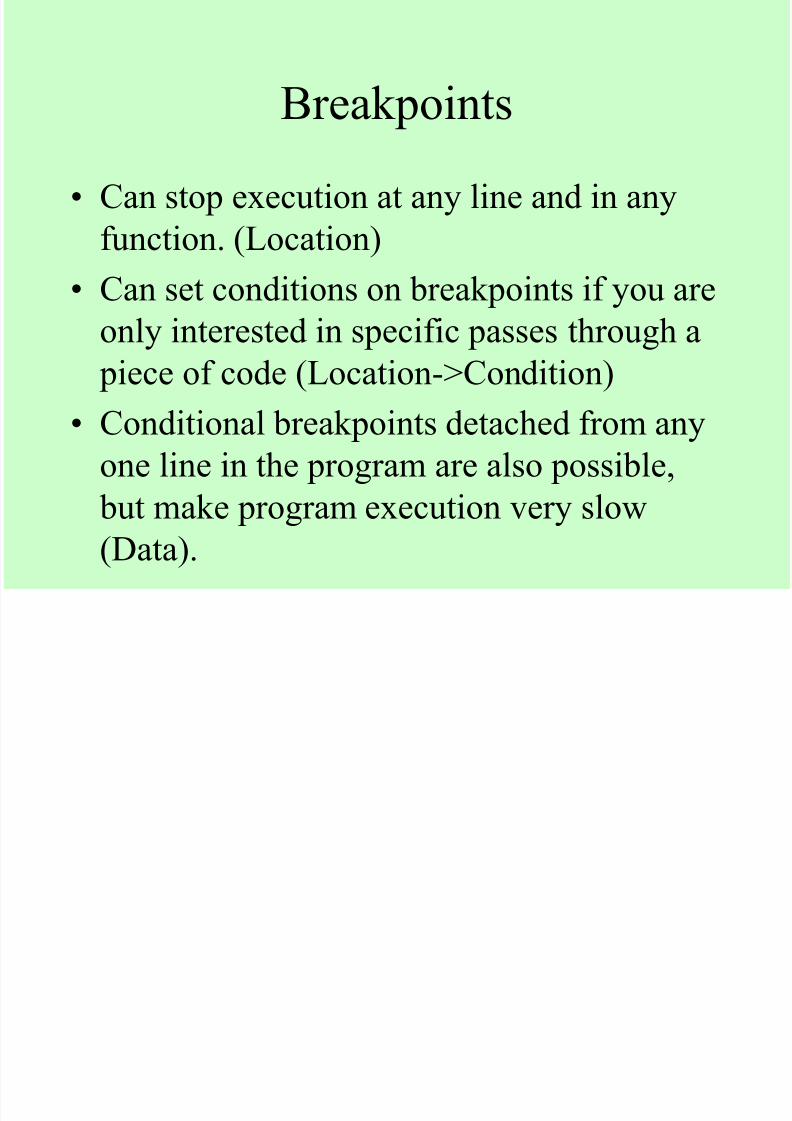
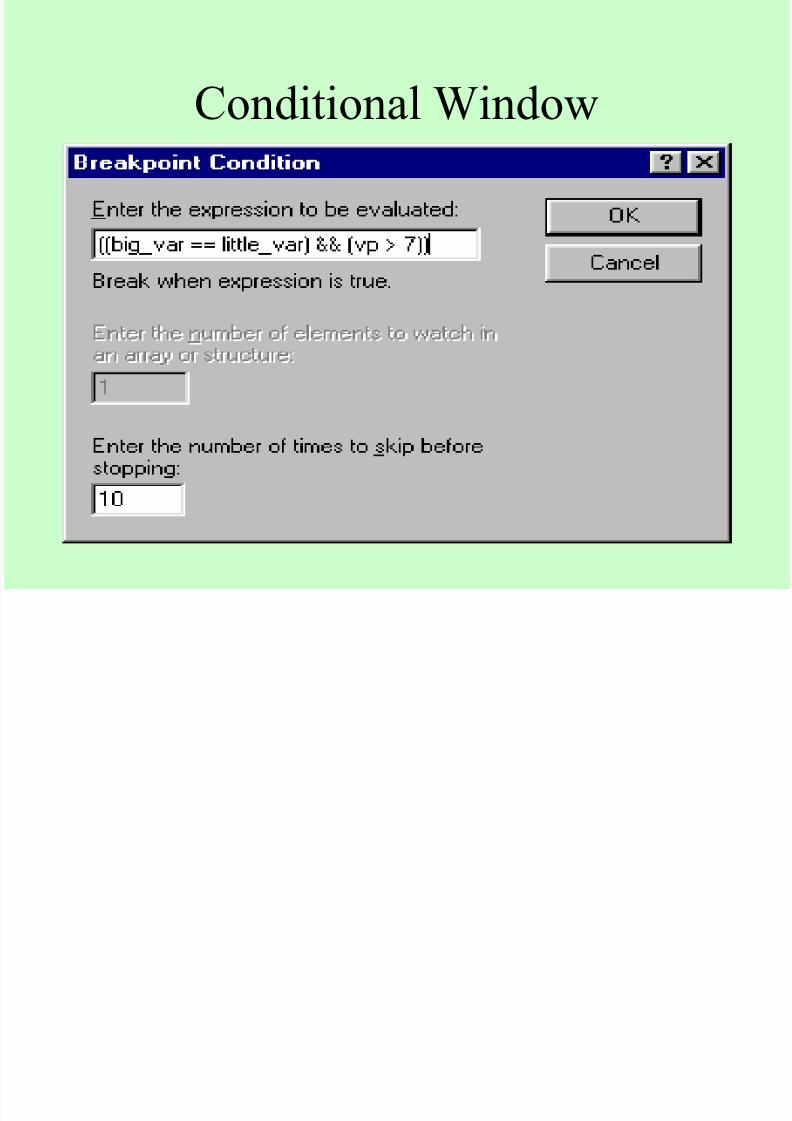
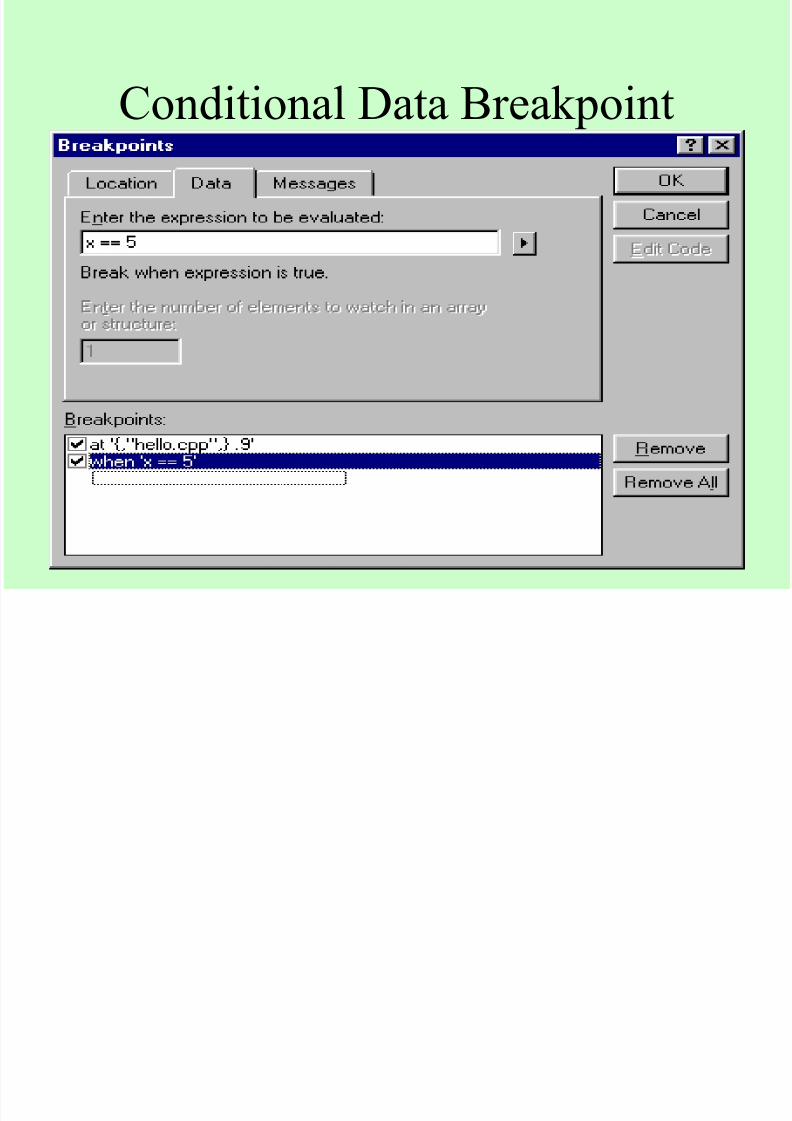
Breakpoints
• Can stop execution at any line and in any
function. (Location)
• Can set conditions on breakpoints if you areonly interested in specific passes through a
piece of code (Location->Condition)
• Conditional breakpoints detached from anyone line in the program are also possible,
but make program execution very slow
(Data).

7/27/2019 Debug Tools
http://slidepdf.com/reader/full/debug-tools 7/58
Breakpoint Window
7/27/2019 Debug Tools
http://slidepdf.com/reader/full/debug-tools 8/58
Conditional Window
7/27/2019 Debug Tools
http://slidepdf.com/reader/full/debug-tools 9/58
Conditional Data Breakpoint
7/27/2019 Debug Tools
http://slidepdf.com/reader/full/debug-tools 10/58
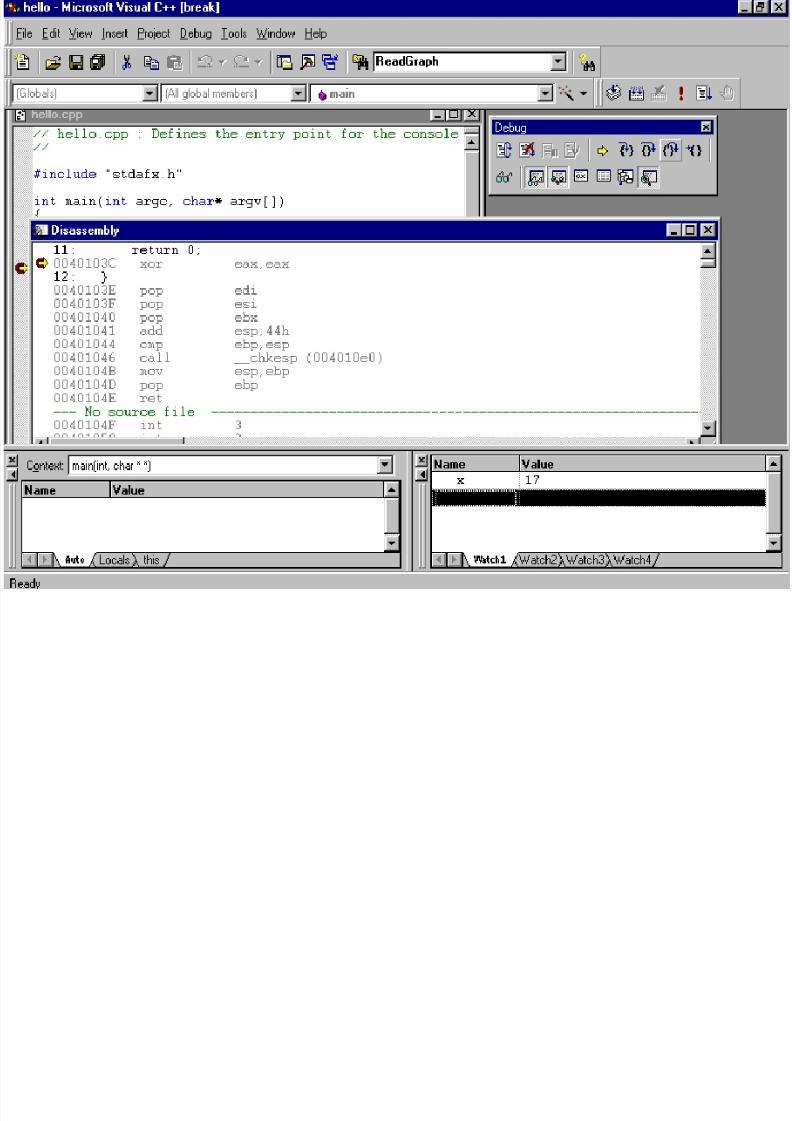
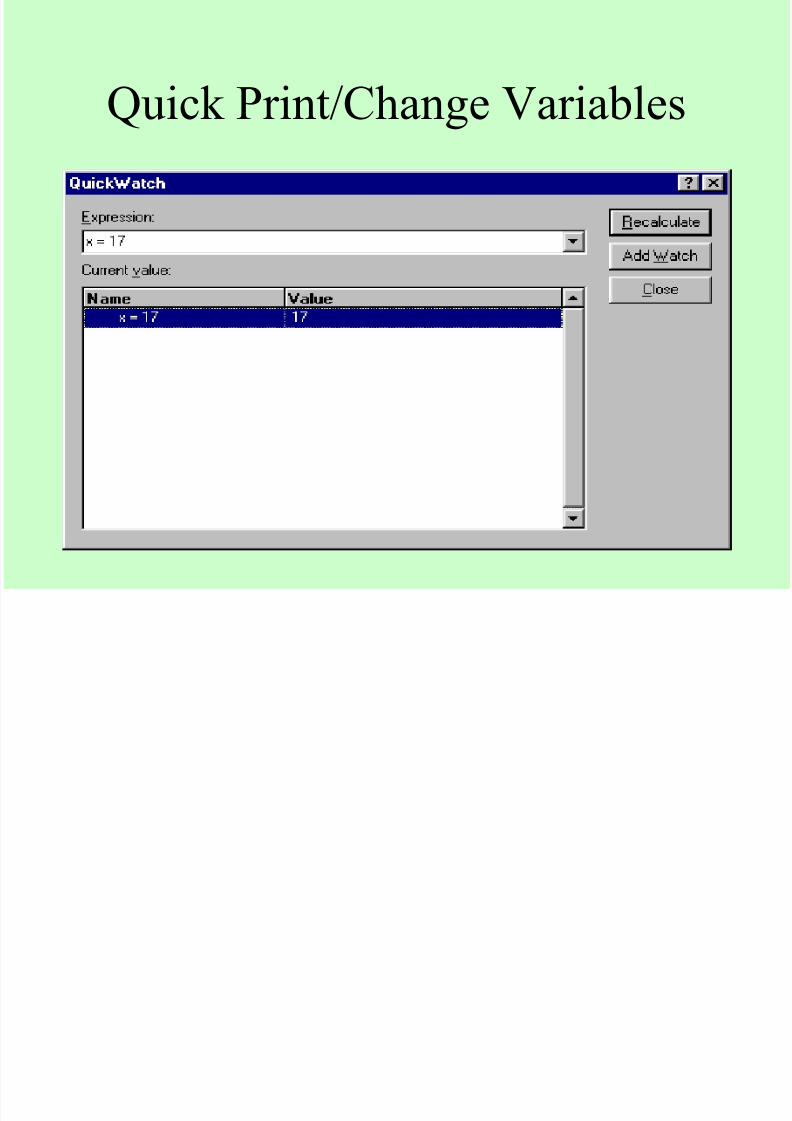
Examining Program State
• Print and/or Change variable state.
• Walk up/down the stack trace.
• View disassembled code.
7/27/2019 Debug Tools
http://slidepdf.com/reader/full/debug-tools 11/58
7/27/2019 Debug Tools
http://slidepdf.com/reader/full/debug-tools 12/58
Quick Print/Change Variables
7/27/2019 Debug Tools
http://slidepdf.com/reader/full/debug-tools 13/58
Execution Flow
• Step Into - Execute code, step into a
function if one is called
• Step Out - Continue execution until N-1’st
region of stack frame reached
• Step Over - Execute code, execute any
functions that are called without stopping.
7/27/2019 Debug Tools
http://slidepdf.com/reader/full/debug-tools 14/58
Debugging Pointer and Dynamic
Data Structure Problems• Pointers and explicitly allocated dynamic
data structures are a central feature in many
popular procedural and object-orientedlanguages
– Great power - especially in extreme cases
(eg C/C++) – Can be very painful to debug
7/27/2019 Debug Tools
http://slidepdf.com/reader/full/debug-tools 15/58
Common Pointer Problems
• Pointer to bogus memory
• Corrupt data structure segments
• Data sharing errors
• Accessing data elements of the wrong type
• Attempting to use memory areas after freeing them
7/27/2019 Debug Tools
http://slidepdf.com/reader/full/debug-tools 16/58
Pointers to Bogus Memory
• Uninitialized pointers
• Failing to check memory allocation errors
• Using stomped pointers corrupted by previousmemory operations
• Reminder: Bogus memory access does not
necessarily trigger a memory protection fault
• Remedy: Add data type info to dynamic data
structures
• Special Case: Indices above/below array space
• Remedy: index checks

7/27/2019 Debug Tools
http://slidepdf.com/reader/full/debug-tools 17/58
Corrupt Data Structure Segments
• Incorrect Adds/Deletes in trees/lists/etc.
• Stomped pointer values from previous memory
operations• Remedy 1: Add type info to dynamic data
structures
• Remedy 2: Create routines to check integrity of
data structures
• Remedy 3: Flag deleted memory areas
7/27/2019 Debug Tools
http://slidepdf.com/reader/full/debug-tools 18/58
Data Sharing Errors
• Often share data between logically separate
program entities
• Problem 1: Bogus pointer handoff • Problem 2: Incorrect data format assumptions
• Problem 3: Multiple ownership issues
• Remedy 1: Type info in dynamic data• Remedy 2: Owner count in memory areas
• Remedy 3: Flag deleted data structures
• Remedy 4: Think through synchronizationroblems in the desi n sta e
7/27/2019 Debug Tools
http://slidepdf.com/reader/full/debug-tools 19/58
Accessing Elements of Wrong
Type• Access data element of type x, but think you are
accessing one of type y
• Can be a source of frequent headaches dependingon application/implementation
• Remedy: Include type info in memory allocations
7/27/2019 Debug Tools
http://slidepdf.com/reader/full/debug-tools 20/58
Accessing Data After Freeing It
• Can be a source of many headaches
• Remedy 1: Include freed flag in memory (not a
guaranteed solution• Remedy 2: Create list of “freed” memory, but do
not deallocate it. Check list when dereferencing
pointers (very expensive in both time and space)
• Big Brother Problem: Accessing data structure
after adding it to a “free” list for quick future reuse
• Remedy: Remedy 1 plus a use counter (also not a
guaranteed solution)
7/27/2019 Debug Tools
http://slidepdf.com/reader/full/debug-tools 21/58
Final Pointer Comments
• Pointers are powerful, but are often a major
source of program errors
• Adding extra state and data structure walk routines can be a big help in debugging
(degrades performance/increases memory
footprint, but can be removed in release)
7/27/2019 Debug Tools
http://slidepdf.com/reader/full/debug-tools 22/58
Debugging Multitasking
Programs• Multiple process/multi-threaded code ubiquitous
in modern programs
• Many debuggers will work with these programs, but it is not always elegant or easy.
• Fallback method: Put new processes to sleep and
then attach a debugger to them before they awake.
• Better solution: Read debugger documentation,
find better one if it is weak in this area.
7/27/2019 Debug Tools
http://slidepdf.com/reader/full/debug-tools 23/58
A Few Tips
• Pointers and multithreading together can be
extremely difficult to debug
• Try to debug parts by themselves beforetackling combined system
• Analogous strategies to those used in
pointer debugging can be a big help
• Thread/process timing an important concern
in the debugging process
7/27/2019 Debug Tools
http://slidepdf.com/reader/full/debug-tools 24/58
Core Dumps
• (Unix) If you run your code outside of the
debugger and there is a fault a core file may
be generated (depending on your systemsettings) where the current program state is
stored.
• Can debug your code post-mortem via:gdb executable-file core-file
7/27/2019 Debug Tools
http://slidepdf.com/reader/full/debug-tools 25/58
Debug Prompts
• Windows does not use core files.
• If you run your code outside of a debugger
and a problem occurs you will be given theoption of either debugging the code or
killing the executing process.

7/27/2019 Debug Tools
http://slidepdf.com/reader/full/debug-tools 26/58
Abort Signal (Unix)
• You can use the abort signal to help
determine the cause of your problem
• SIGBUS: Likely a dereference of a NULL pointer
• SIGSEGV: Likely a dereference of a bogus
pointer, an invalid write to code space, or a bad branch to data space
• SIGFPE: Division by zero
7/27/2019 Debug Tools
http://slidepdf.com/reader/full/debug-tools 27/58
Blame the Compiler
• Sometimes software crashes in debugged code but
not in optimized code
• The tendency is to blame the compiler and de-
optimize the file or function where the bugoccurred
• Most often the problem is in the code and is just
exposed by the optimizer, typically anuninitialized global variable
• Of course, sometimes it really is an optimizer bug.
In that case, please submit a bug report to the
compiler vendor with a nice short test program
7/27/2019 Debug Tools
http://slidepdf.com/reader/full/debug-tools 28/58
Debugging Techniques
• Use assertions liberally
• Add conditionally compilable debugging
code
• Multiple platform execution has a way of
bringing bugs to the surface
7/27/2019 Debug Tools
http://slidepdf.com/reader/full/debug-tools 29/58
Assertions
• Can be used to enforce function pre and
post conditions
• Make your implicit assumptions explicit
• Can be turned off in final release for a
performance boost or left in with messages
to help in bug report creation
7/27/2019 Debug Tools
http://slidepdf.com/reader/full/debug-tools 30/58
Conditional Compilation
• Maintain multiple customized versions in
one code base.
• Typically have one debug version of your code for bug killing and a release version
(sans debug code) for high performance.
• Caveat 1: You do need to test the releaseversion before shipping.
• Caveat 2: Conditional Compilation not
available in all languages.
7/27/2019 Debug Tools
http://slidepdf.com/reader/full/debug-tools 31/58
Multiple Platform Execution
• Additional initial design effort
• Great debugging aid
• Can be a commercial selling point
7/27/2019 Debug Tools
http://slidepdf.com/reader/full/debug-tools 32/58
A few tricky cases before moving
on . . .• The library function calls go nuts, but only
when they are called after function X . . .
• My program is freeing block x prematurely.How do I find out why (and more
importantly because of where)?
• I am using files to synchronize two programs “halves” under nfs. The process
periodically breaks when a file open fails.
7/27/2019 Debug Tools
http://slidepdf.com/reader/full/debug-tools 33/58
Debugging Aids
• Lint for stricter code checks
• Garbage Collectors for C/C++

7/27/2019 Debug Tools
http://slidepdf.com/reader/full/debug-tools 34/58
Lint
• Lint is a semantic checker that identifies potential bugs in C
programs
• Lint is a mistake! • In the early days of C on UNIX complete semantic checking was
removed from the C compiler as a design decision. This allowed
for smaller, simpler, and faster compilers at the expense of
potentially buggy code.
• Lint exists on UNIX systems (but not LINUX)
• Most modern ANSI C compilers include Lint semantic checking
functionality but only some of Lint’s other features
• Use Lint Early and Often!

7/27/2019 Debug Tools
http://slidepdf.com/reader/full/debug-tools 35/58
What does Lint Do?
• Checks for consistency in function use across multiple files
• Finds
– bugs – non-portable code
– wasteful code
• Typical Bugs Detected include
– Argument types transposed between function and call
– Function with wrong number of arguments takes junk from
stack
– Variables being used before set or never used
7/27/2019 Debug Tools
http://slidepdf.com/reader/full/debug-tools 36/58
More about Lint• See Unix man page
• OR “Checking C Programs with lint” By Ian F. Darwin
7/27/2019 Debug Tools
http://slidepdf.com/reader/full/debug-tools 37/58
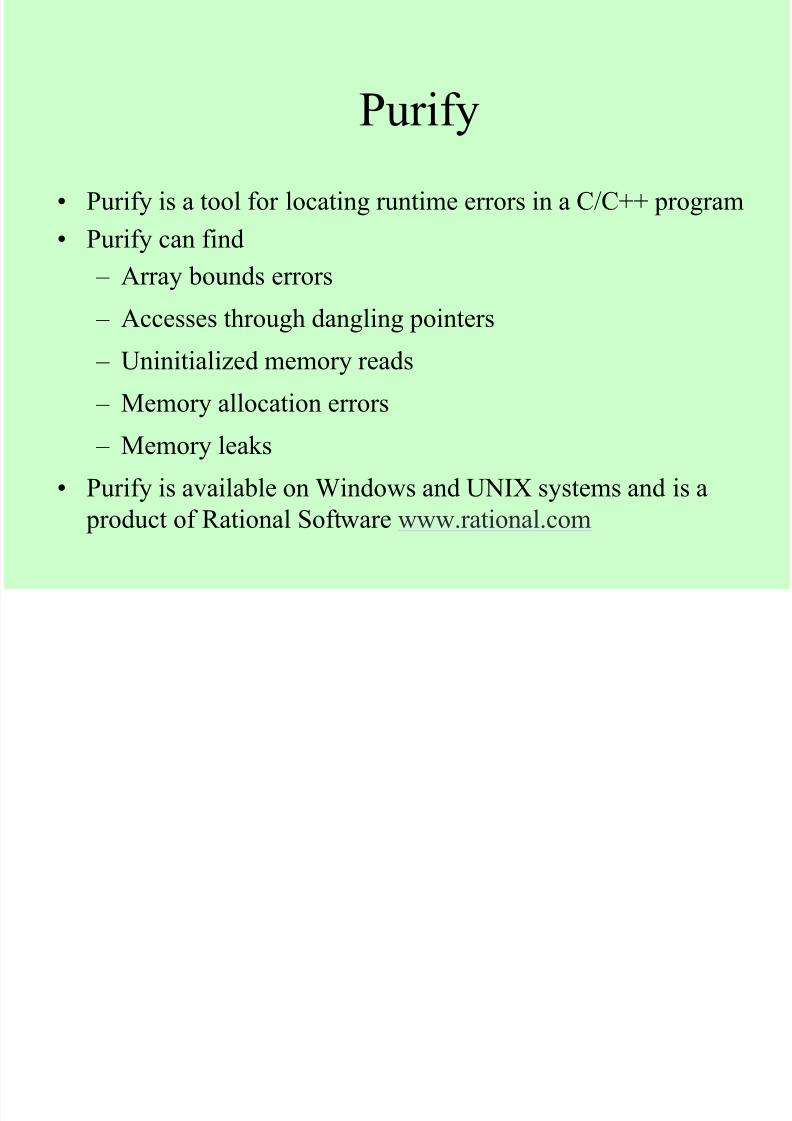
Purify
• Purify is a tool for locating runtime errors in a C/C++ program
• Purify can find
– Array bounds errors – Accesses through dangling pointers
– Uninitialized memory reads
– Memory allocation errors
– Memory leaks
• Purify is available on Windows and UNIX systems and is a
product of Rational Software www.rational.com

7/27/2019 Debug Tools
http://slidepdf.com/reader/full/debug-tools 38/58
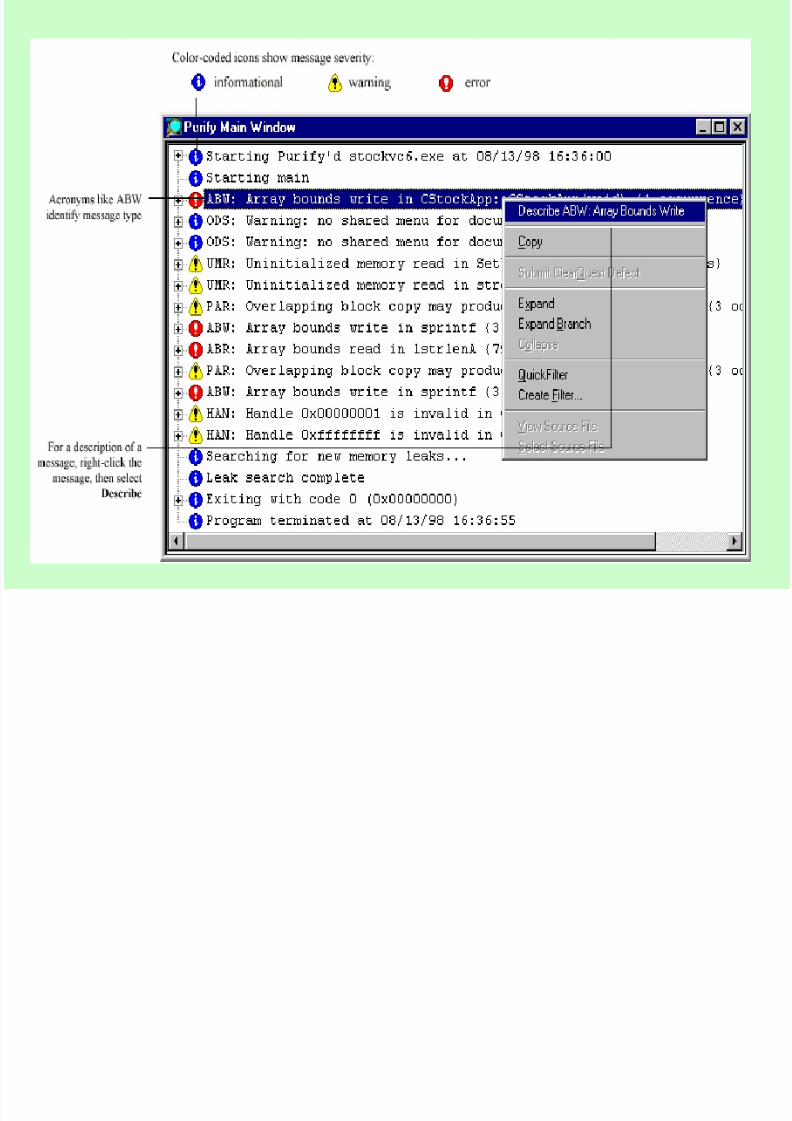
How Purify Works
• Purify instruments a program by adding protection
instructions around every load and store operation
• When program is executed a viewer will be created to
display errors as they happen
• Purify is flexible and can be run standalone with any
executable (written in C) or within a debuggingenvironment like Visual Studio
• Purify is customizable and can be set to ignore certain
types of errors
7/27/2019 Debug Tools
http://slidepdf.com/reader/full/debug-tools 39/58
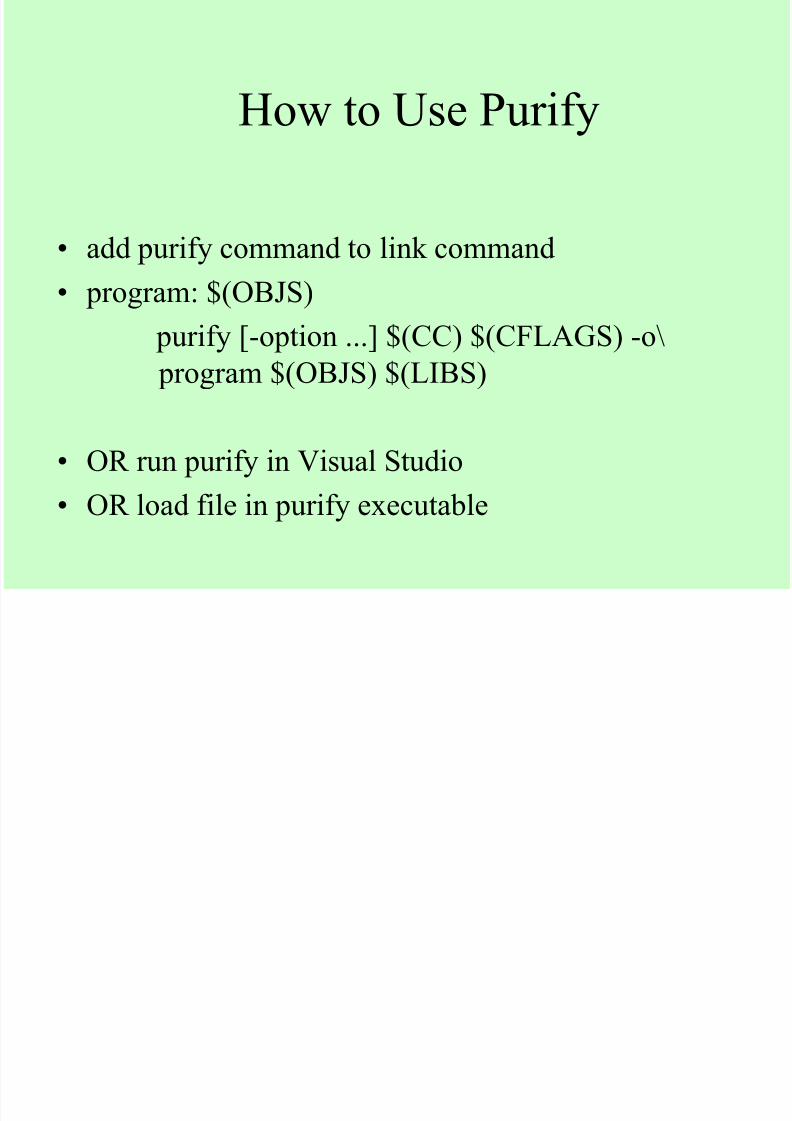
How to Use Purify
• add purify command to link command
• program: $(OBJS)
purify [-option ...] $(CC) $(CFLAGS) -o\
program $(OBJS) $(LIBS)
• OR run purify in Visual Studio
• OR load file in purify executable

7/27/2019 Debug Tools
http://slidepdf.com/reader/full/debug-tools 40/58
7/27/2019 Debug Tools
http://slidepdf.com/reader/full/debug-tools 41/58
7/27/2019 Debug Tools
http://slidepdf.com/reader/full/debug-tools 42/58
Linux Garbage Collection Aids
• If you are using C then checker-gcc is an
excellent tool - compile your code using
modified gcc compiler and memory errorsflagged
• Options exist in C++ (checker-g++,
ccmalloc, dmalloc), but they tend to befragile and/or very slow.

7/27/2019 Debug Tools
http://slidepdf.com/reader/full/debug-tools 43/58
Performance Tuning
• Profiling
• Code Tuning
• Options Tuning
7/27/2019 Debug Tools
http://slidepdf.com/reader/full/debug-tools 44/58
Performance Tuning
• Why tune? Won’t processors be twice as
fast next year?
– Customers want it faster NOW
– Processor speed isn’t always the bottleneck
– Algorithmic improvements can speed up
your code far more than 2x
– Embedded systems
7/27/2019 Debug Tools
http://slidepdf.com/reader/full/debug-tools 45/58
When Should I Tune?
• Knuth: “Premature optimization is the root of all
evil”
• Tune after you test and debug your code – No point being fast if it’s wrong
– Bug fixes can de-tune code
– Tuning often makes code more complicated,making it more difficult to debug
• Maintain/Improve performance after you ship
– Add performance tracking to regression suite to
prevent degradation
7/27/2019 Debug Tools
http://slidepdf.com/reader/full/debug-tools 46/58
The Tuning Process
• Don’t tune unless you really have to
• Iterative process
– Profile, tune, profile, tune . . .
– This continues until you reach the point of
diminishing returns
7/27/2019 Debug Tools
http://slidepdf.com/reader/full/debug-tools 47/58
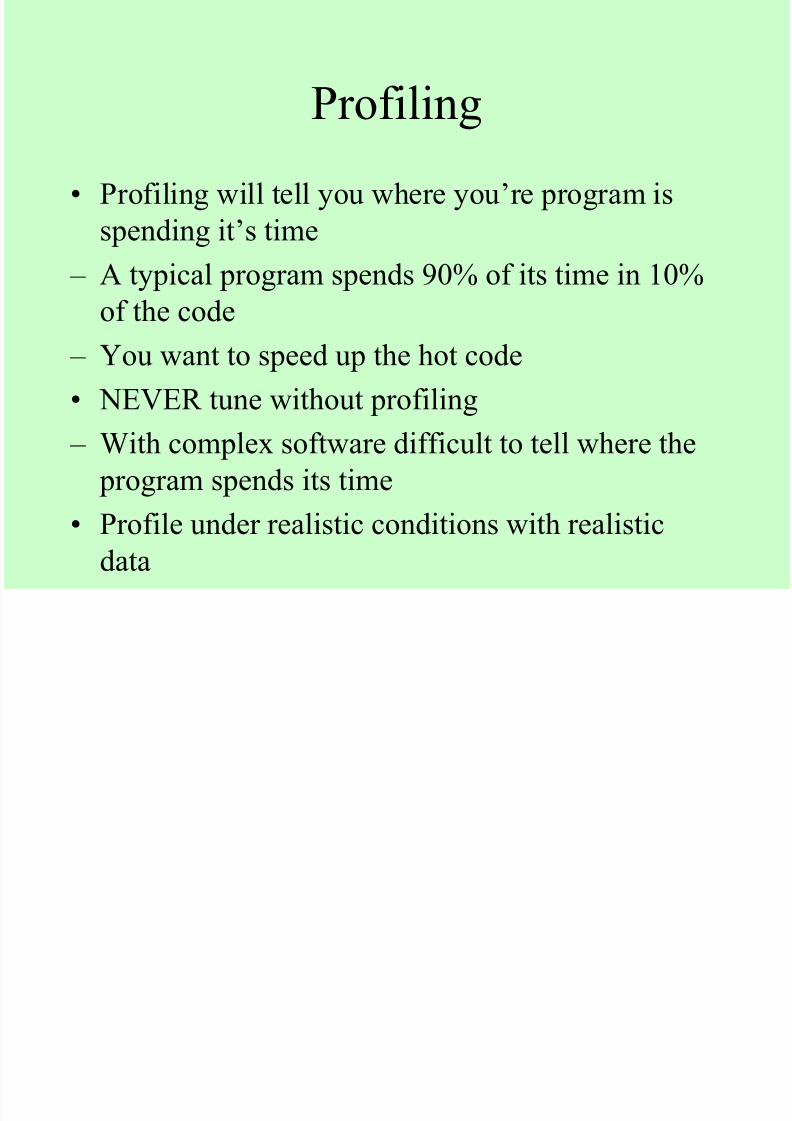
Profiling
• Profiling will tell you where you’re program is
spending it’s time
– A typical program spends 90% of its time in 10%of the code
– You want to speed up the hot code
• NEVER tune without profiling
– With complex software difficult to tell where the
program spends its time
• Profile under realistic conditions with realistic
data
7/27/2019 Debug Tools
http://slidepdf.com/reader/full/debug-tools 48/58
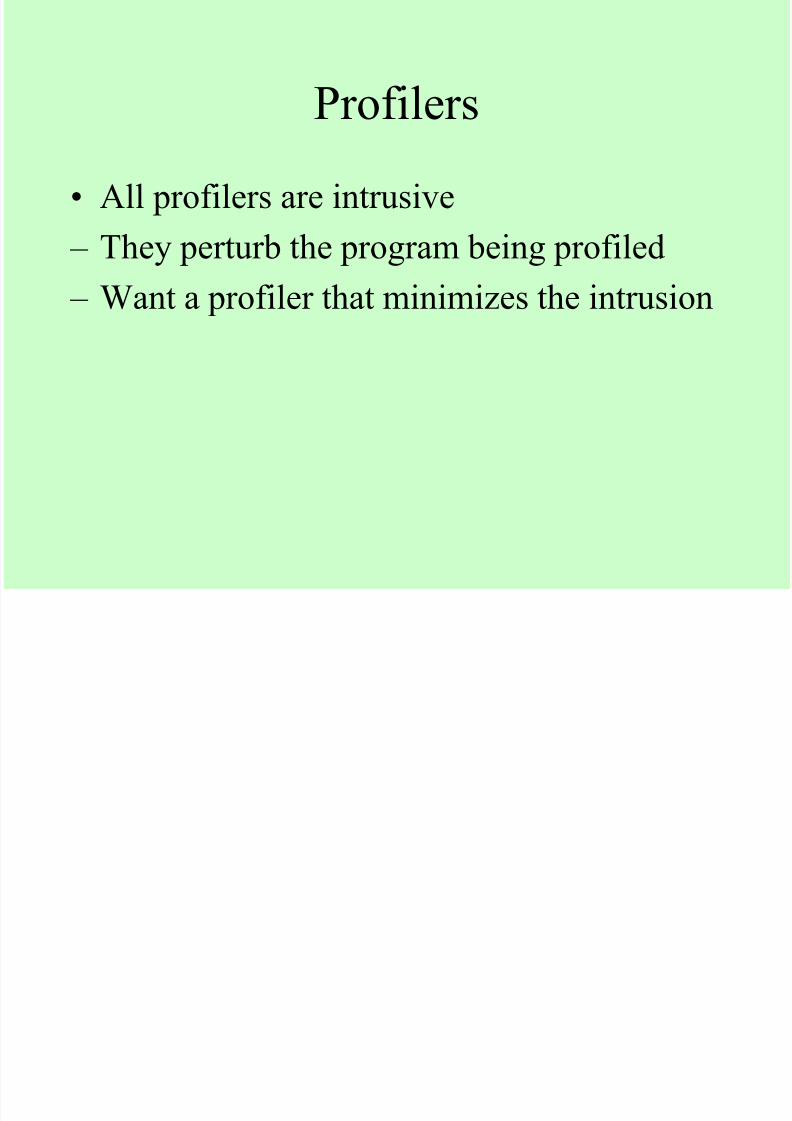
Profilers
• All profilers are intrusive
– They perturb the program being profiled
– Want a profiler that minimizes the intrusion
7/27/2019 Debug Tools
http://slidepdf.com/reader/full/debug-tools 49/58
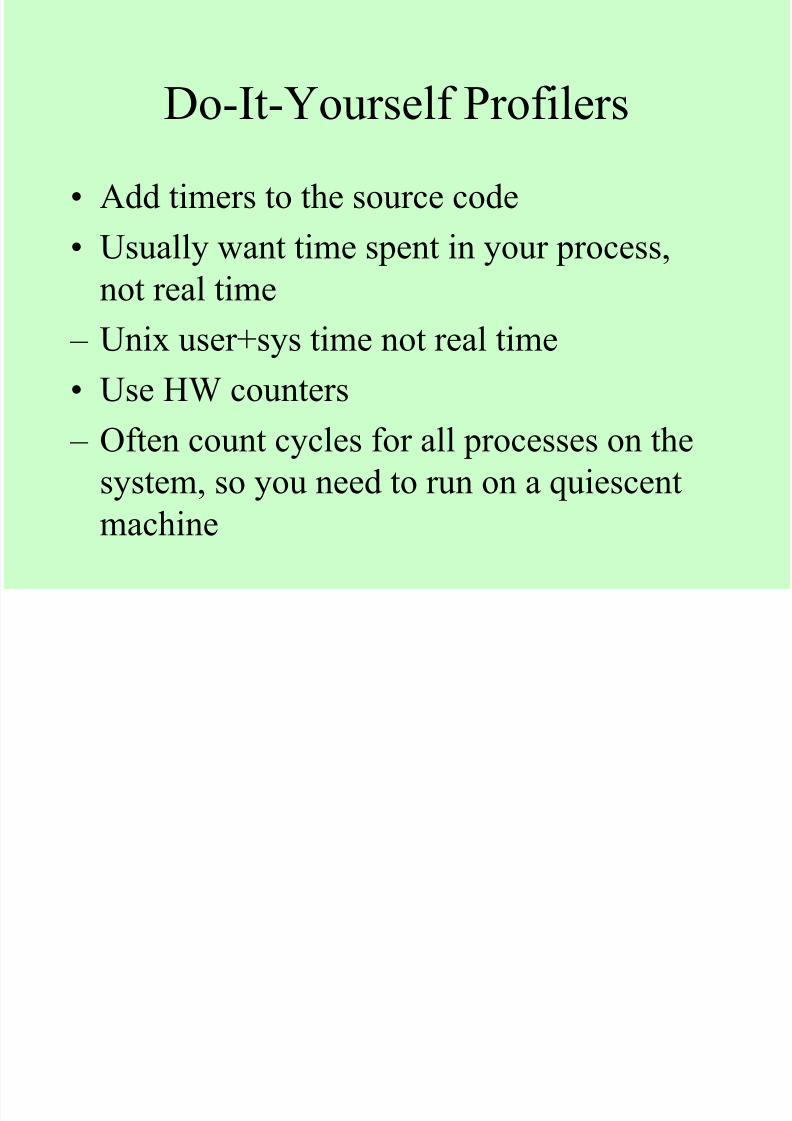
Do-It-Yourself Profilers
• Add timers to the source code
• Usually want time spent in your process,
not real time
– Unix user+sys time not real time
• Use HW counters
– Often count cycles for all processes on the
system, so you need to run on a quiescent
machine
7/27/2019 Debug Tools
http://slidepdf.com/reader/full/debug-tools 50/58
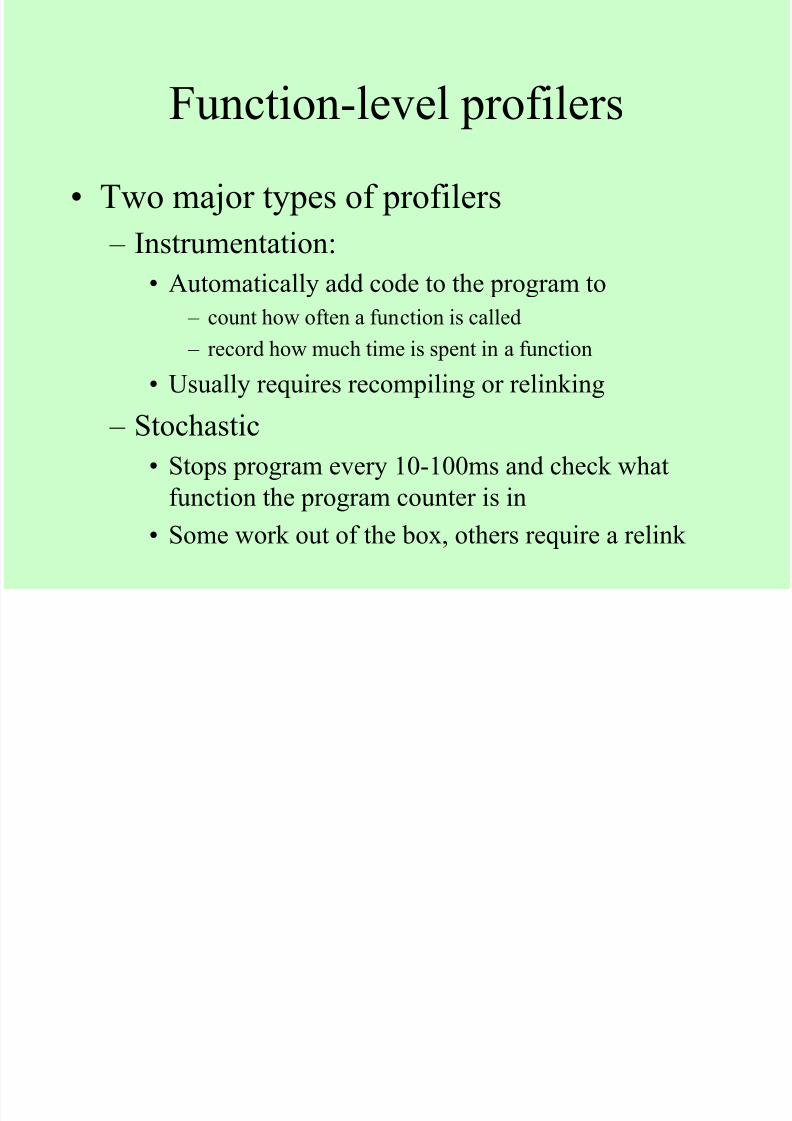
Function-level profilers
• Two major types of profilers
– Instrumentation:
• Automatically add code to the program to – count how often a function is called
– record how much time is spent in a function
• Usually requires recompiling or relinking
– Stochastic• Stops program every 10-100ms and check what
function the program counter is in
• Some work out of the box, others require a relink
7/27/2019 Debug Tools
http://slidepdf.com/reader/full/debug-tools 51/58
Instruction-Level Profilers
• Good for tuning within a function (if you read
assembly code)
• Usually stochastic profiler: requires longer runthan function level since more fine-grained
information
• Shade (Solaris) and Atom (Alpha) interpret the
machine code and count the number of times agiven instruction is executed
• CPU emulators can tell you anything you need to
know (if you have the time)
7/27/2019 Debug Tools
http://slidepdf.com/reader/full/debug-tools 52/58
Code Tuning Techniques
• Change algorithm
– Most gain, but also most difficult
– Example: set data structure• If sets are dense, bit vectors often better
• If sets are sparse, hash tables, binary trees, or
another sparse data structure might be better
7/27/2019 Debug Tools
http://slidepdf.com/reader/full/debug-tools 53/58
Code Tuning Techniques II
• Make hot functions faster
– Throw more compiler optimizations at it
– Rewrite in assembly (often not worth it)
– Indirect calls -> direct calls
• C++: virtual functions -> non-virtual
• Java: non-static functions -> static
– Probably not worth it with latest JVM’s – Move infrequently executed code out of the way
– Eliminate unnecessary I/O, system calls, allocation
7/27/2019 Debug Tools
http://slidepdf.com/reader/full/debug-tools 54/58
Code Tuning Techniques III
• Call hot functions less often
– Cache previously computed values (memoization)
– Inline: eliminates call overhead and allows compiler to
do better job optimizing
• Inline by hand if compiler can’t (ex: indirect calls)
• Java: less synchronization
– Ex “a” + “b” + “c” • NewStringBuffer(“a”).append(“b”).append(“c”).toSt
ring()
• 3 monitor enter instructions: All unnecessary
7/27/2019 Debug Tools
http://slidepdf.com/reader/full/debug-tools 55/58
Intuitive Approach
• Previous suggestions geared towards
explicit speed improvements
• Alternative approach is to code algorithmsin a simple easy-to-understand manner
• If it is easy for others to understand
compiler can probably understand it, too• Result: Compiler optimization can be much
more effective
7/27/2019 Debug Tools
http://slidepdf.com/reader/full/debug-tools 56/58
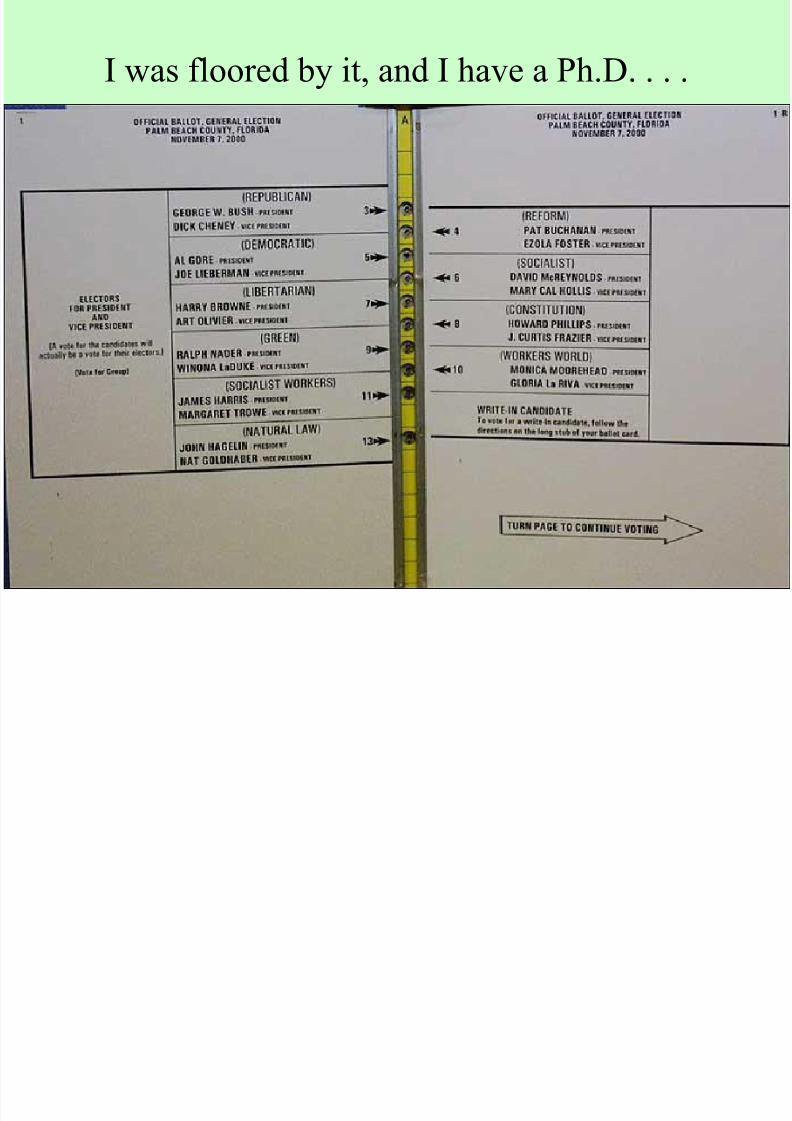
I was floored by it, and I have a Ph.D. . . .
7/27/2019 Debug Tools
http://slidepdf.com/reader/full/debug-tools 57/58
Options Tuning
• Don’t optimize a program whose running time
doesn’t matter
• Start with -O – Typical Speedup: 2x
– Even local optimizations help 30-50%
– YMMV
• Inlining: 10% if done blindly, 30% if done with
profiling information
• Aliasing options: Allow compiler to eliminate
more memory references
7/27/2019 Debug Tools
http://slidepdf.com/reader/full/debug-tools 58/58
Options Tuning for Java
• Increase max heap size for less frequent GC
• Experiment with vendor-specific options
– Often many options for improvingsynchronization performance