Embed Size (px)
Citation preview

1Debugging RT with Ftrace
Debugging realtime application with Ftrace
Pierre Ficheux ([email protected])
02/2018

2Debugging RT with Ftrace
Disclaimer
● Poor English speaker ! ● But “good” French speaker and writer :-)
“Loin du français je meurs”(Louis-Ferdinand Céline)

3Debugging RT with Ftrace
$ whoami
● French embedded Linux developer, writer and teacher● CTO @ Smile ECS (Embedded & Connected Systems)● Last book about embedded Linux (in french !)
4Debugging RT with Ftrace
What is Ftrace?
● The official tracer for the Linux kernel● Added in 2009 (2.6.31)● Mostly developed by Steven Rostedt (Red Hat, now
VMware, PREEMPT_RT major designer)● Lots of features for tracing :
– functions
– events
– latency !
● Not a debugger (GDB) but a “profiler”● Available in standard distributions ● Based on debugfs● Activated by Kernel hacking > Tracers
5Debugging RT with Ftrace
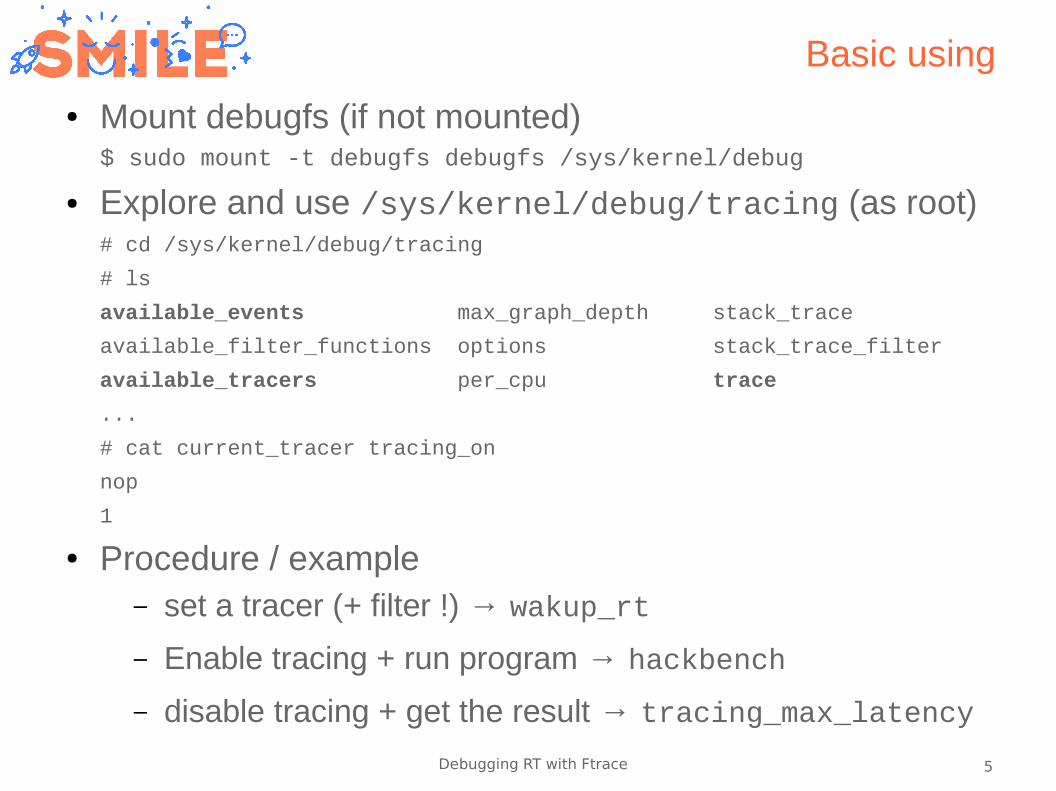
Basic using
● Mount debugfs (if not mounted)$ sudo mount -t debugfs debugfs /sys/kernel/debug
● Explore and use /sys/kernel/debug/tracing (as root)# cd /sys/kernel/debug/tracing
# ls
available_events max_graph_depth stack_trace
available_filter_functions options stack_trace_filter
available_tracers per_cpu trace
...
# cat current_tracer tracing_on
nop
1
● Procedure / example– set a tracer (+ filter !) → wakup_rt
– Enable tracing + run program → hackbench
– disable tracing + get the result → tracing_max_latency
6Debugging RT with Ftrace
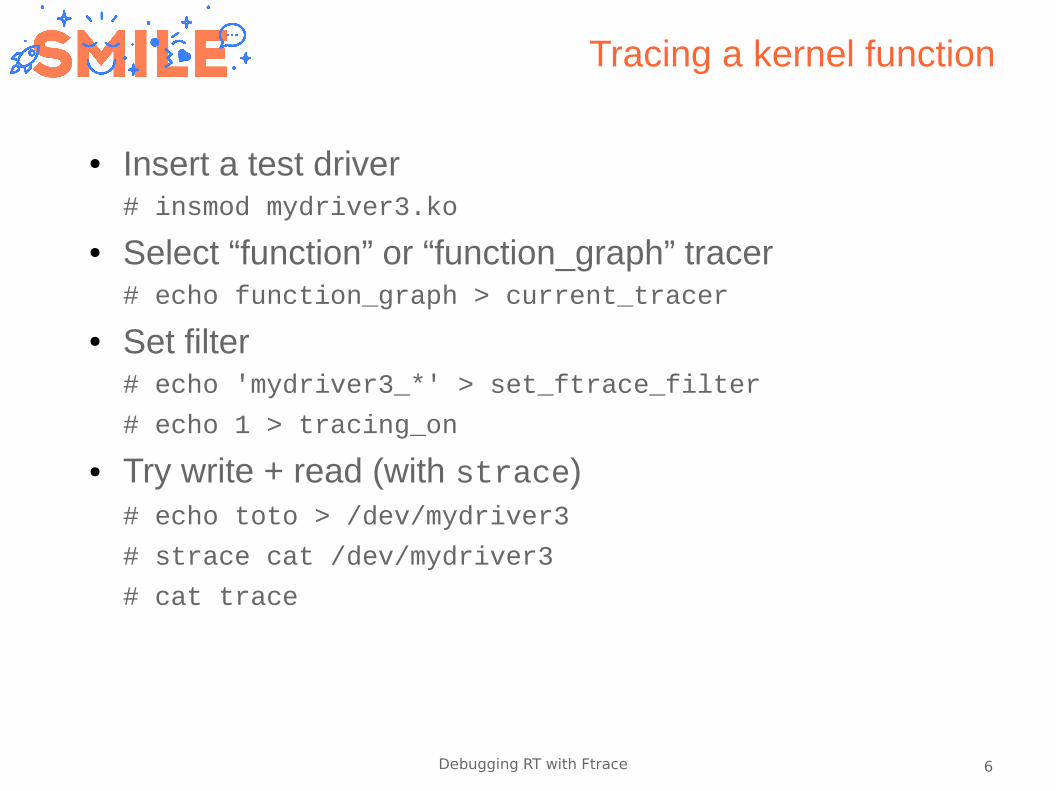
Tracing a kernel function
● Insert a test driver# insmod mydriver3.ko
● Select “function” or “function_graph” tracer# echo function_graph > current_tracer
● Set filter# echo 'mydriver3_*' > set_ftrace_filter
# echo 1 > tracing_on
● Try write + read (with strace)# echo toto > /dev/mydriver3
# strace cat /dev/mydriver3
# cat trace
7Debugging RT with Ftrace
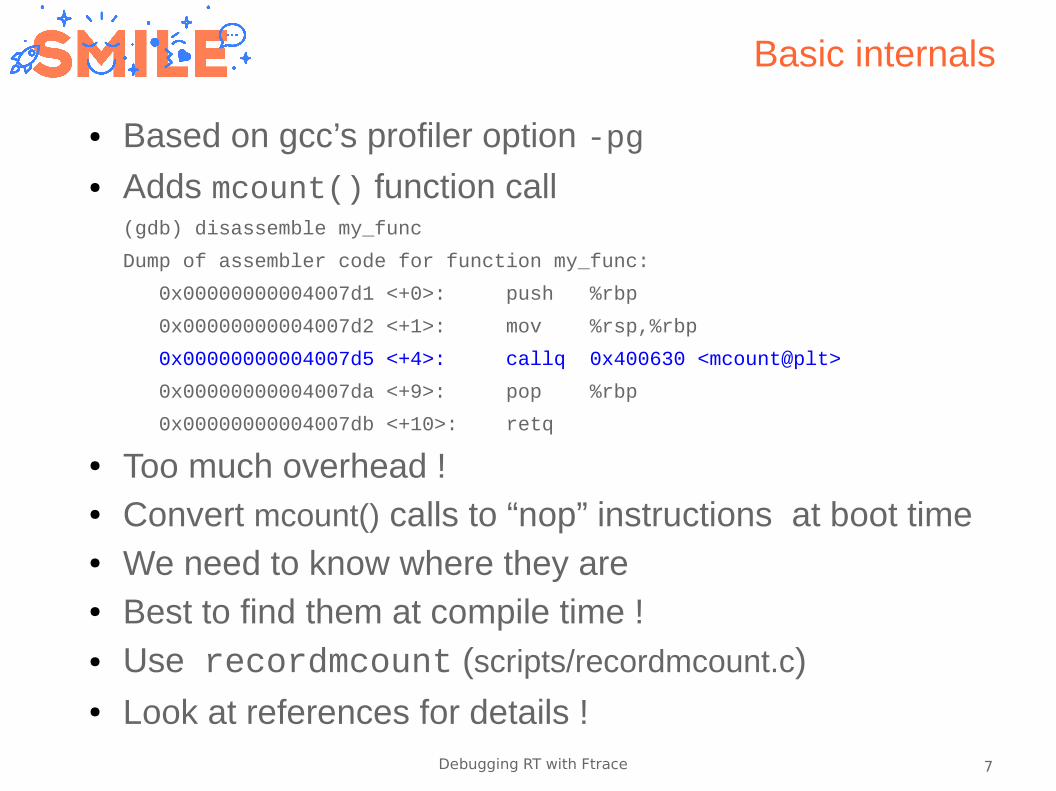
Basic internals
● Based on gcc’s profiler option -pg● Adds mcount() function call
(gdb) disassemble my_func
Dump of assembler code for function my_func:
0x00000000004007d1 <+0>: push %rbp
0x00000000004007d2 <+1>: mov %rsp,%rbp
0x00000000004007d5 <+4>: callq 0x400630 <mcount@plt>
0x00000000004007da <+9>: pop %rbp
0x00000000004007db <+10>: retq
● Too much overhead !● Convert mcount() calls to “nop” instructions at boot time● We need to know where they are● Best to find them at compile time !● Use recordmcount (scripts/recordmcount.c)● Look at references for details !
8Debugging RT with Ftrace
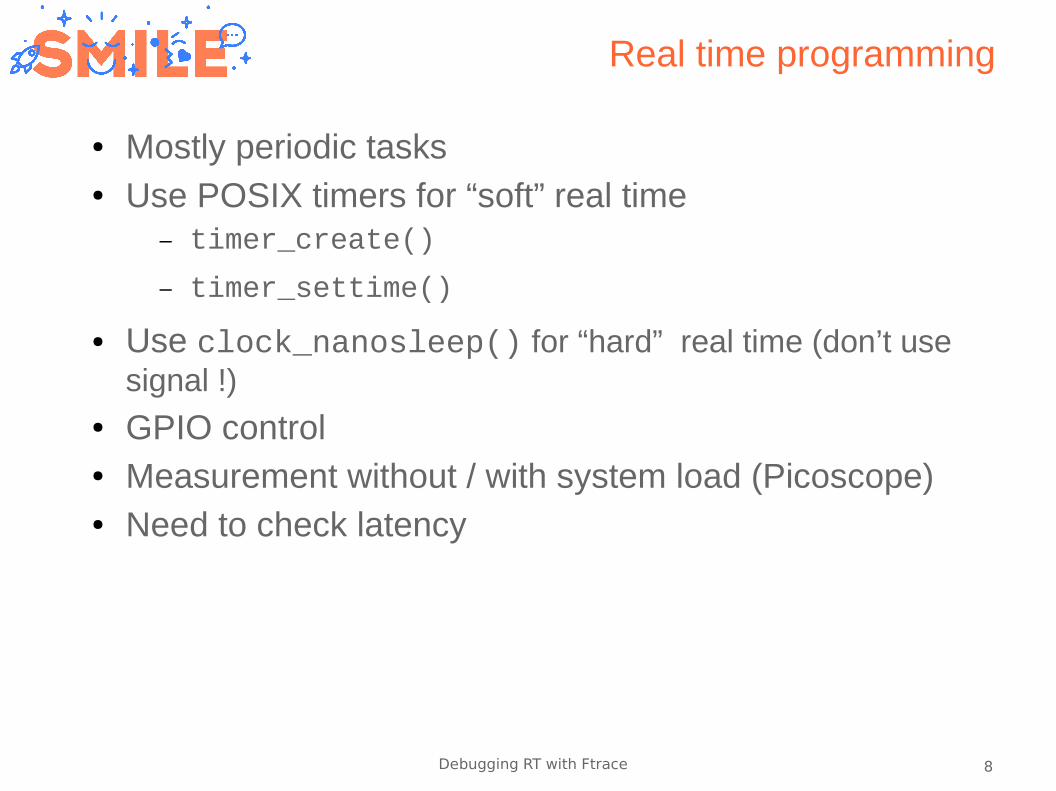
Real time programming
● Mostly periodic tasks● Use POSIX timers for “soft” real time
– timer_create()
– timer_settime()
● Use clock_nanosleep() for “hard” real time (don’t use signal !)
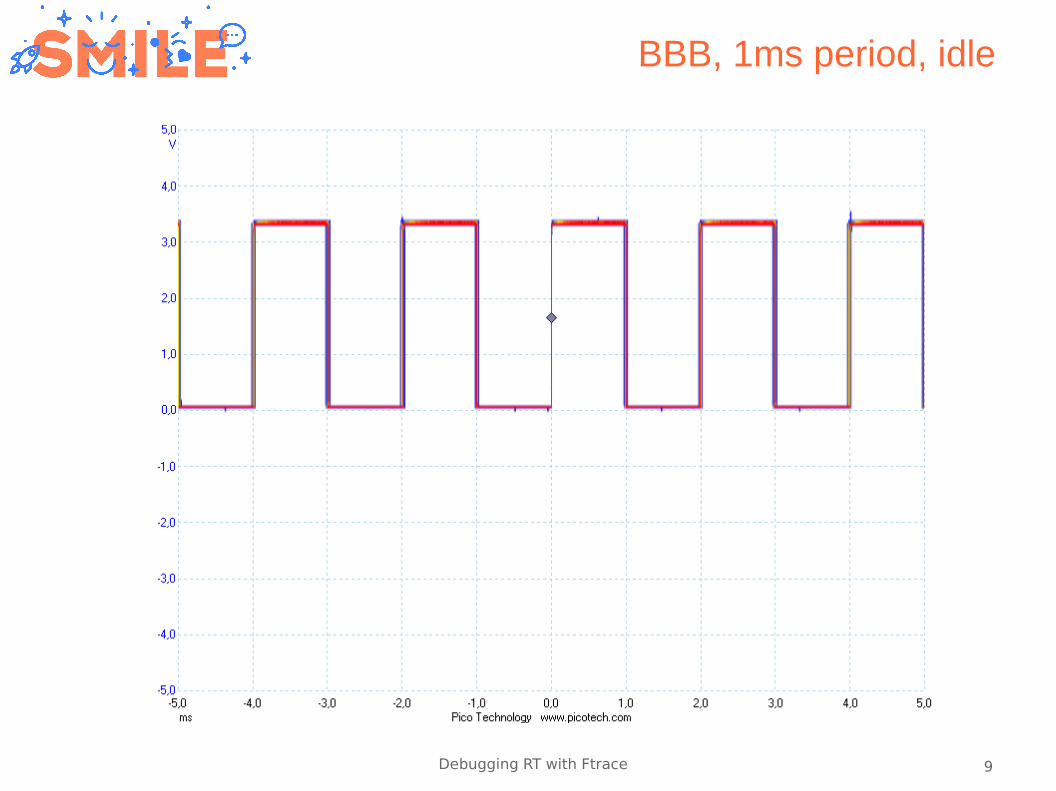
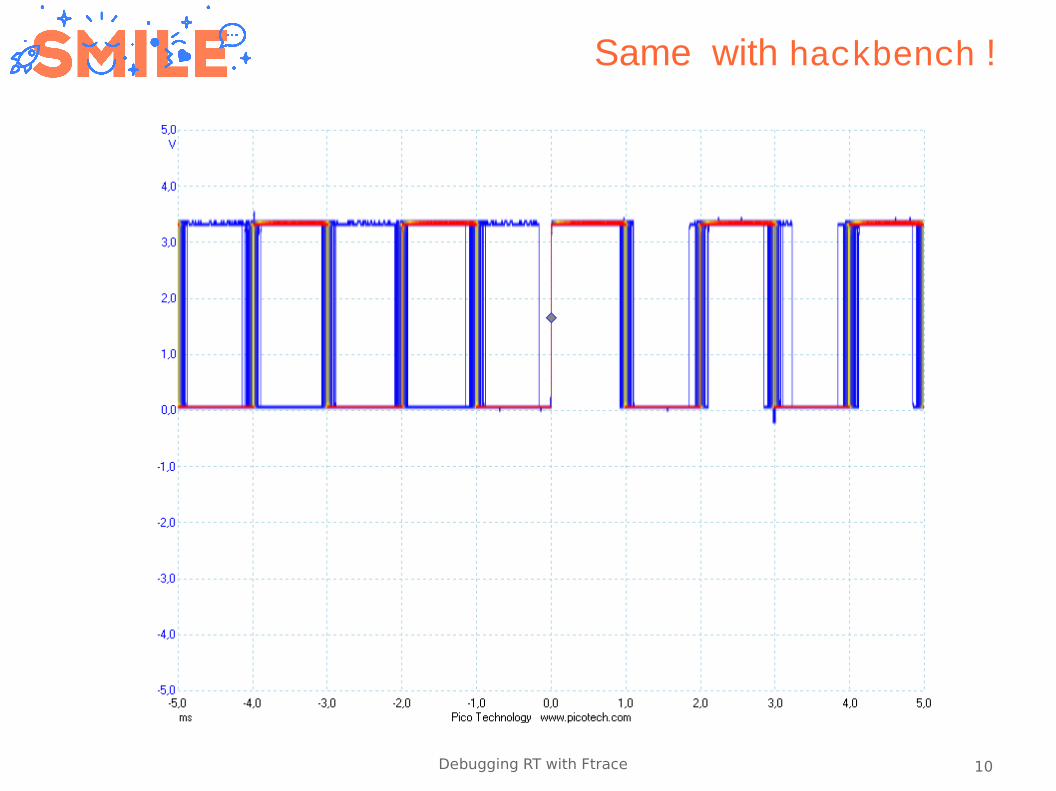
● GPIO control● Measurement without / with system load (Picoscope)● Need to check latency
9Debugging RT with Ftrace
BBB, 1ms period, idle
10Debugging RT with Ftrace
Same with hackbench !
11Debugging RT with Ftrace
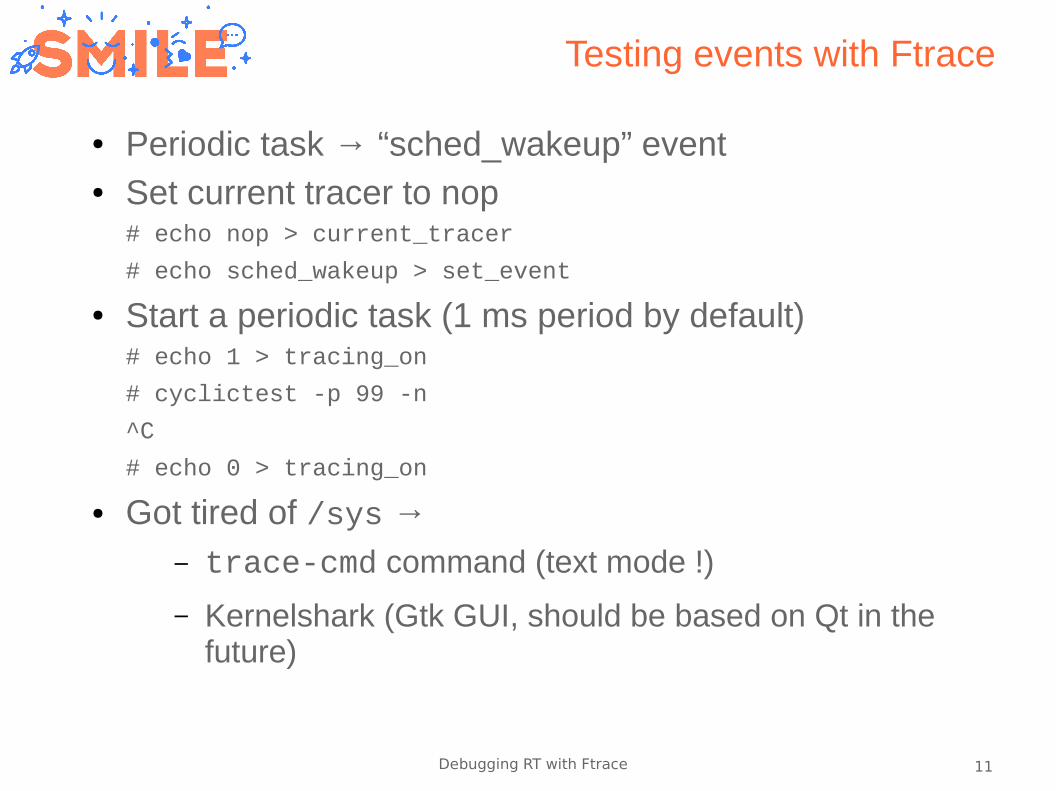
Testing events with Ftrace
● Periodic task → “sched_wakeup” event● Set current tracer to nop
# echo nop > current_tracer
# echo sched_wakeup > set_event
● Start a periodic task (1 ms period by default)# echo 1 > tracing_on
# cyclictest -p 99 -n
^C
# echo 0 > tracing_on
● Got tired of /sys → – trace-cmd command (text mode !)
– Kernelshark (Gtk GUI, should be based on Qt in the future)
12Debugging RT with Ftrace
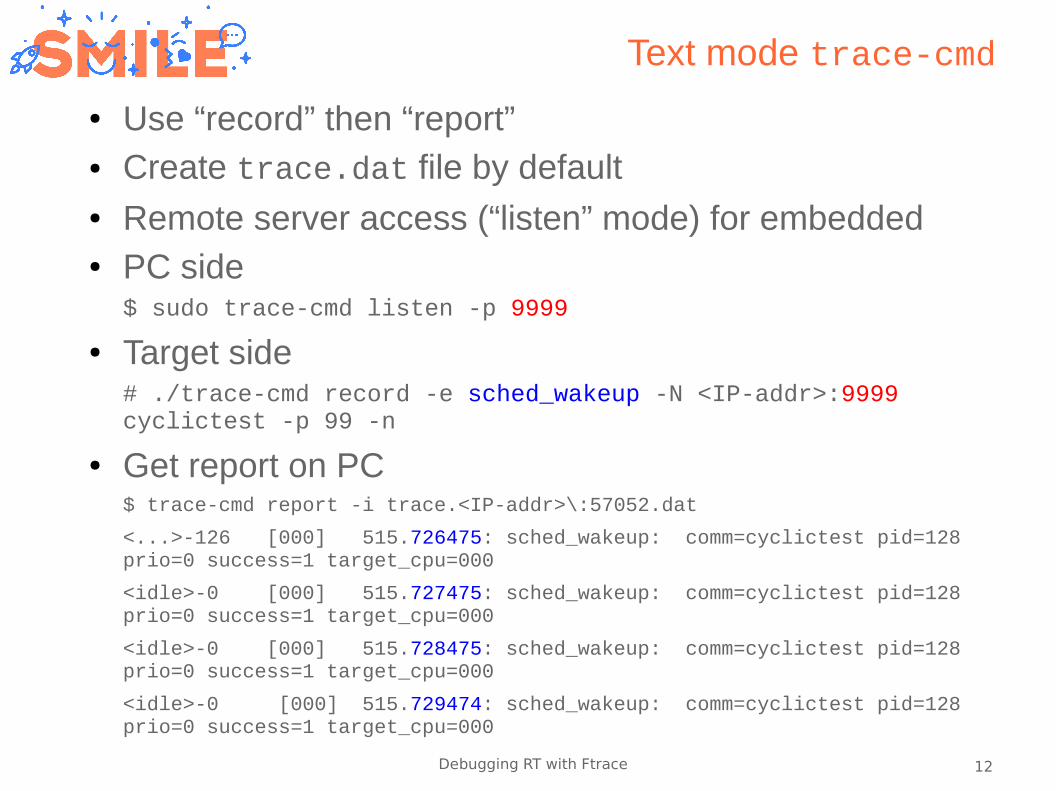
Text mode trace-cmd
● Use “record” then “report”● Create trace.dat file by default● Remote server access (“listen” mode) for embedded● PC side
$ sudo trace-cmd listen -p 9999
● Target side# ./trace-cmd record -e sched_wakeup -N <IP-addr>:9999 cyclictest -p 99 -n
● Get report on PC$ trace-cmd report -i trace.<IP-addr>\:57052.dat
<...>-126 [000] 515.726475: sched_wakeup: comm=cyclictest pid=128 prio=0 success=1 target_cpu=000
<idle>-0 [000] 515.727475: sched_wakeup: comm=cyclictest pid=128 prio=0 success=1 target_cpu=000
<idle>-0 [000] 515.728475: sched_wakeup: comm=cyclictest pid=128 prio=0 success=1 target_cpu=000
<idle>-0 [000] 515.729474: sched_wakeup: comm=cyclictest pid=128 prio=0 success=1 target_cpu=000
13Debugging RT with Ftrace
Text or GUI● Text mode
– extract data (script or whatever)
– use Gnuplot
– “static” results...
● Kernelshark is “dynamic” and interactive but– Is GUI :-)
– Not that stable, should be improved by S. Rostedt at VMware (using Qt)
14Debugging RT with Ftrace
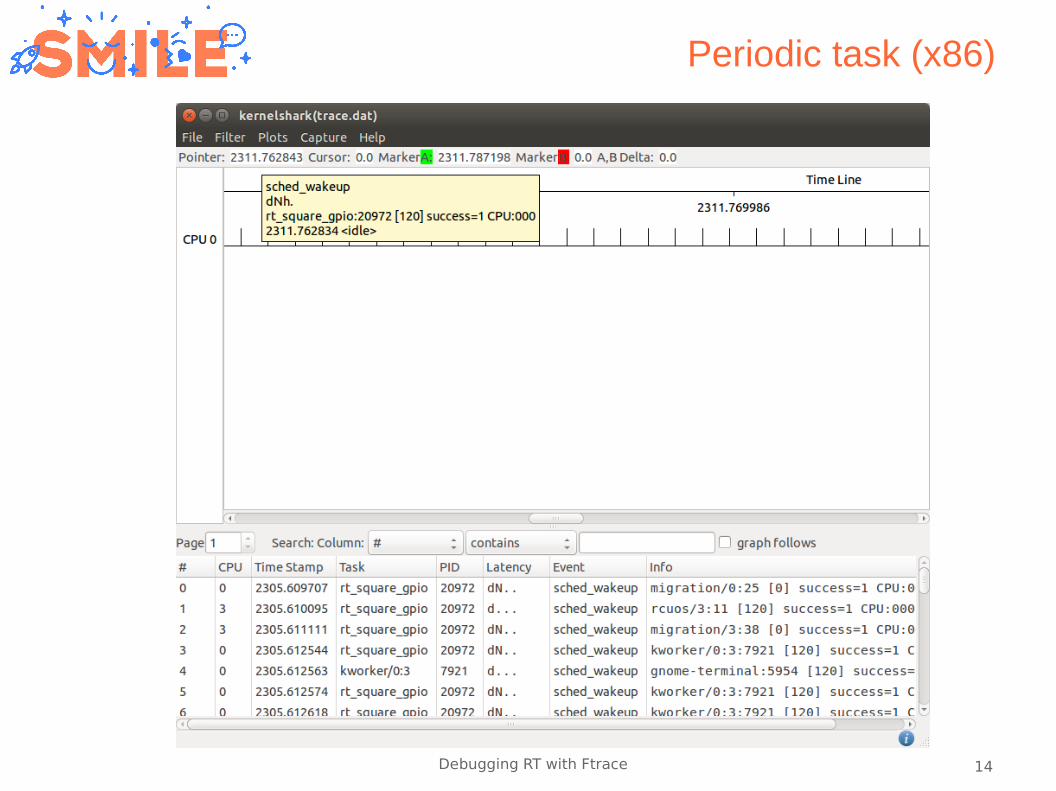
Periodic task (x86)
15Debugging RT with Ftrace
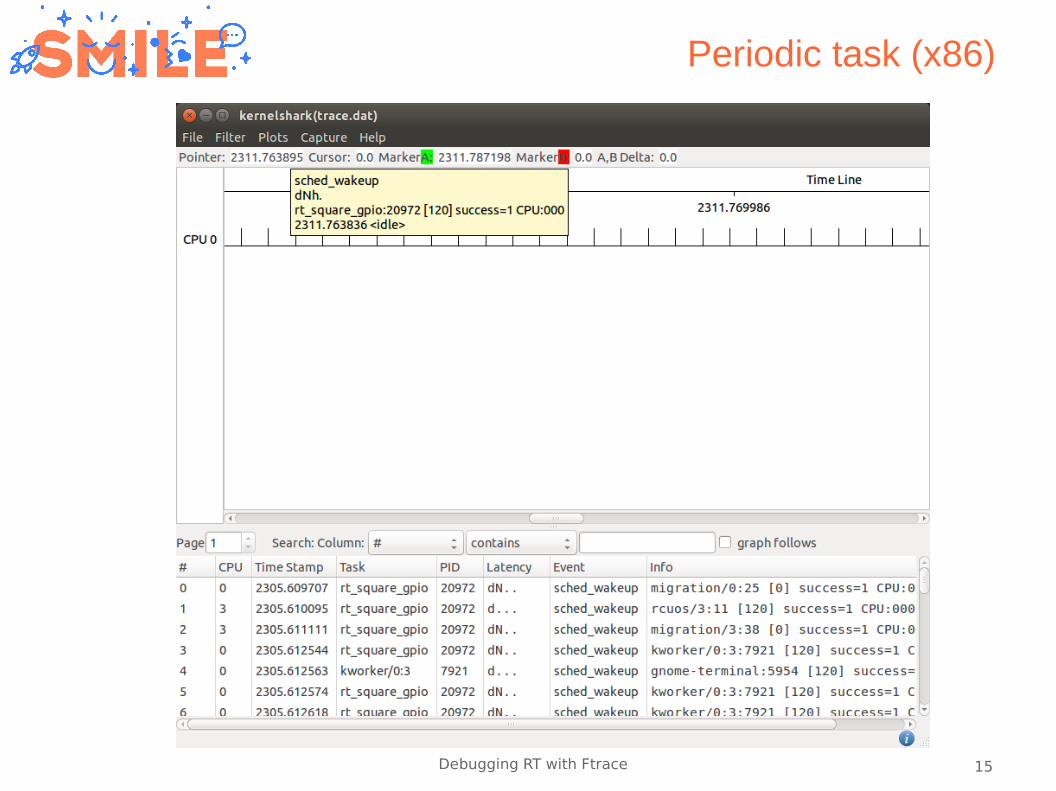
Periodic task (x86)
16Debugging RT with Ftrace
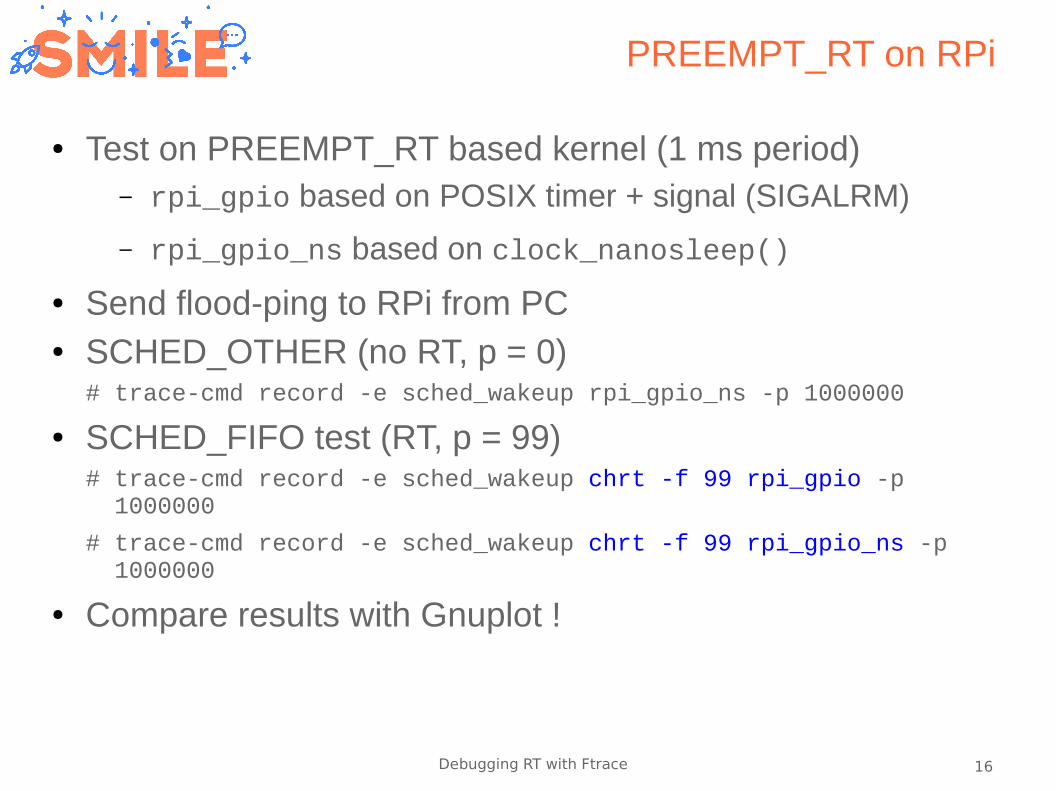
PREEMPT_RT on RPi
● Test on PREEMPT_RT based kernel (1 ms period)– rpi_gpio based on POSIX timer + signal (SIGALRM)
– rpi_gpio_ns based on clock_nanosleep()
● Send flood-ping to RPi from PC● SCHED_OTHER (no RT, p = 0)
# trace-cmd record -e sched_wakeup rpi_gpio_ns -p 1000000
● SCHED_FIFO test (RT, p = 99)# trace-cmd record -e sched_wakeup chrt -f 99 rpi_gpio -p 1000000
# trace-cmd record -e sched_wakeup chrt -f 99 rpi_gpio_ns -p 1000000
● Compare results with Gnuplot !
17Debugging RT with Ftrace
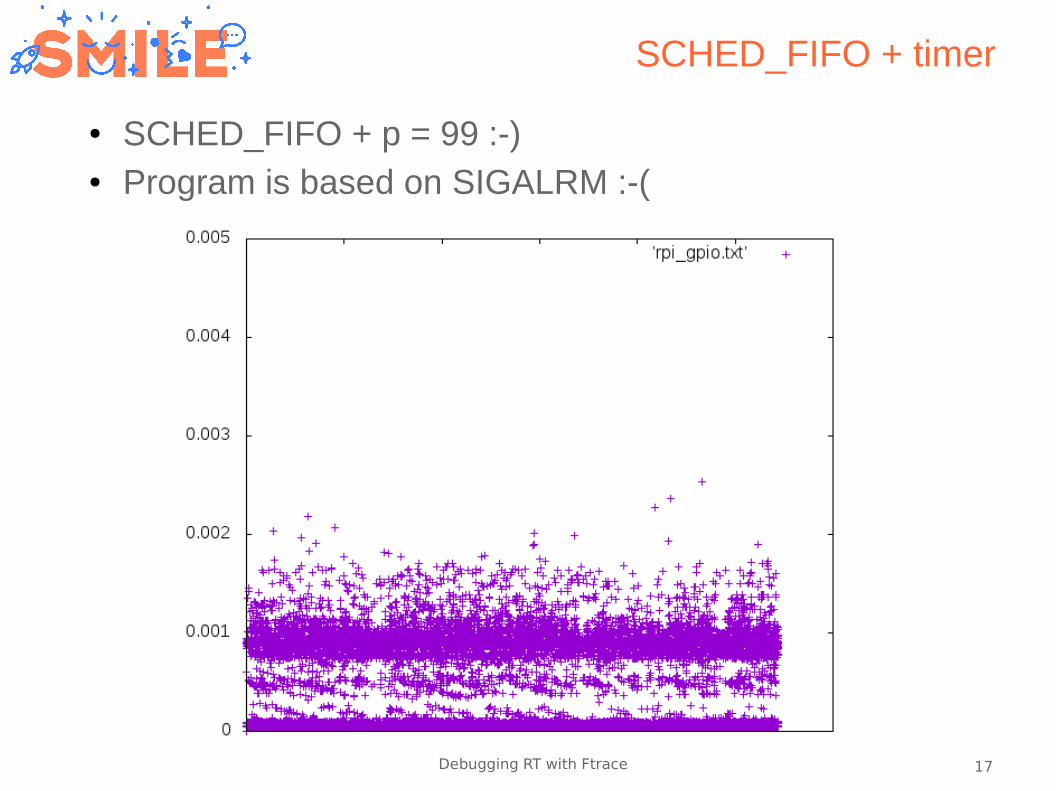
SCHED_FIFO + timer
● SCHED_FIFO + p = 99 :-)● Program is based on SIGALRM :-(
18Debugging RT with Ftrace
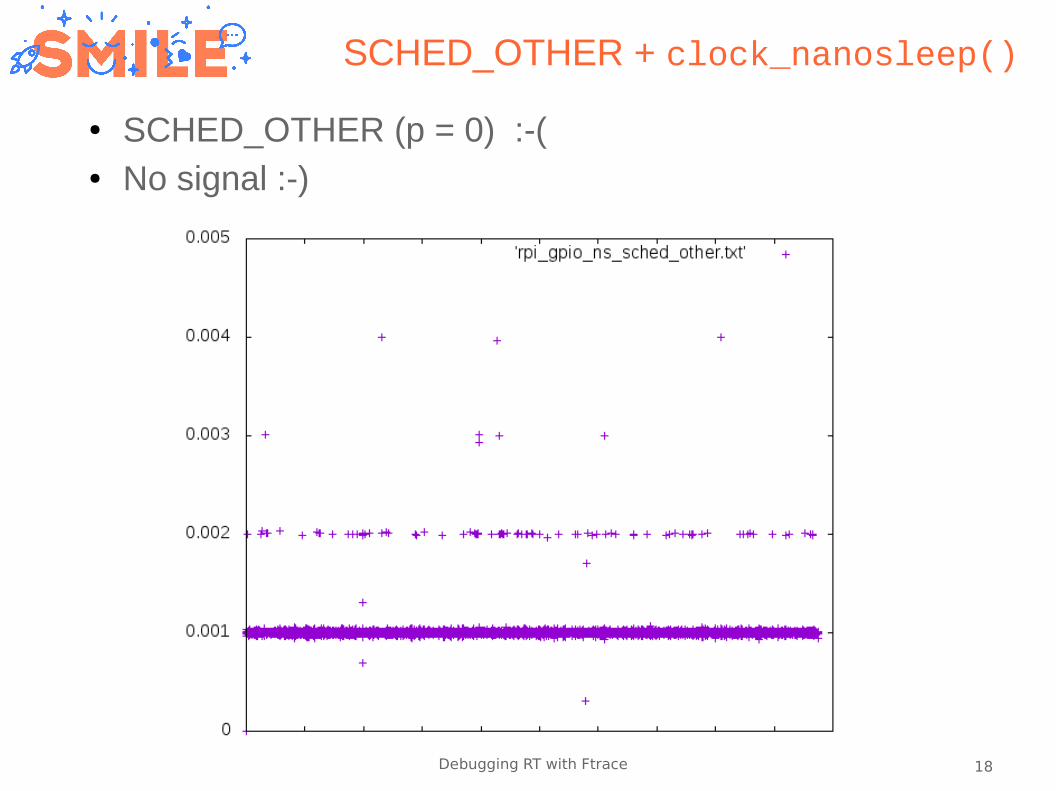
SCHED_OTHER + clock_nanosleep()
● SCHED_OTHER (p = 0) :-(● No signal :-)
19Debugging RT with Ftrace
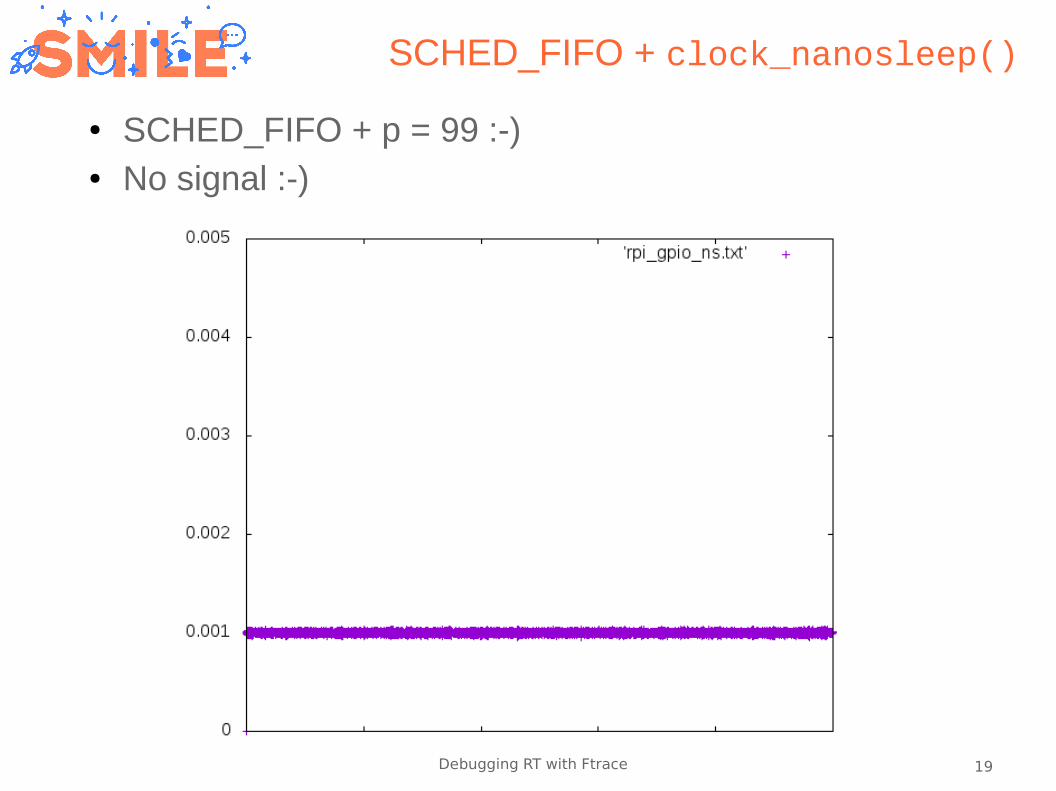
SCHED_FIFO + clock_nanosleep()
● SCHED_FIFO + p = 99 :-)● No signal :-)
20Debugging RT with Ftrace
References
● Ftrace article by Christophe Blaess (Open Silicium #18)
● Ftrace doc (kernel source) https://www.kernel.org/doc/Documentation/trace/ftrace.txt
● Debugging kernel using Ftrace (#1) by S. Rostedt http://lwn.net/Articles/365835/
● Debugging kernel using Ftrace (# 2) by S. Rostedt http://lwn.net/Articles/366796
● Understanding Linux kernel via Ftrace by S. Rostedt https://www.youtube.com/watch?v=2ff-7UTg5rE (***)
● Ftrace kernel hooks by Steven Rostedt https://www.linuxplumbersconf.org/2014/ocw/system/presentations/1773/original/ftrace-kernel-hooks-2014.pdf


![strace: new features · Systemcallspecificationimprovements [3/6] %fstatsyscallclass fstat,fstat64 fstatat64,newfstatat oldfstat strace-y-e%fstatfind/var/empty-mindepth1](https://img.pdfslide.net/doc/110x75/5ad995eb7f8b9a6d7e8b8f13/strace-new-features-cationimprovements-36-fstatsyscallclass-fstatfstat64.jpg)


![SnuMAP: an Open-Source Trace Pro ler for Manycore Systems · 2019. 5. 16. · ited set of tracers such as SystemTap [23], and Ftrace [11] which are usually used for debugging and](https://img.pdfslide.net/doc/110x75/60b2540f29b32909fd3d60c0/snumap-an-open-source-trace-pro-ler-for-manycore-systems-2019-5-16-ited-set.jpg)