Embed Size (px)
Citation preview
2015-16 School Accountability Report Card for Del Dayo Elementary School Page 1 of 12
Del Dayo Elementary School
School Accountability Report Card
Reported Using Data from the 2015-16 School Year
Published During 2016-17
By February 1 of each year, every school in California is required by state law to publish a School Accountability Report Card (SARC). The SARC contains information about the condition and performance of each California public school. Under the Local Control Funding Formula (LCFF) all local educational agencies (LEAs) are required to prepare a Local Control and Accountability Plan (LCAP), which describes how they intend to meet annual school-specific goals for all pupils, with specific activities to address state and local priorities. Additionally, data reported in an LCAP is to be consistent with data reported in the SARC. • For more information about SARC requirements, see the California Department of Education (CDE) SARC Web page at
http://www.cde.ca.gov/ta/ac/sa/. • For more information about the LCFF or LCAP, see the CDE LCFF Web page at http://www.cde.ca.gov/fg/aa/lc/. • For additional information about the school, parents/guardians and community members should contact the school principal or
the district office. DataQuest DataQuest is an online data tool located on the CDE DataQuest Web page at http://dq.cde.ca.gov/dataquest/ that contains additional information about this school and comparisons of the school to the district and the county. Specifically, DataQuest is a dynamic system that provides reports for accountability (e.g., test data, enrollment, high school graduates, dropouts, course enrollments, staffing, and data regarding English learners). Internet Access Internet access is available at public libraries and other locations that are publicly accessible (e.g., the California State Library). Access to the Internet at libraries and public locations is generally provided on a first-come, first-served basis. Other use restrictions may include the hours of operation, the length of time that a workstation may be used (depending on availability), the types of software programs available on a workstation, and the ability to print documents.
About This School Contact Information (School Year 2016-17)
School Contact Information
School Name------- Del Dayo Elementary School
Street------- 1301 McClaren Drive
City, State, Zip------- Carmichael CA, 95608
Phone Number------- (916) 575-2323
Principal------- Gianfranco Tornatore
E-mail Address------- [email protected]
Web Site------- http://www.sanjuan.edu/deldayo
CDS Code 34-67447-6034482
2015-16 School Accountability Report Card for Del Dayo Elementary School Page 2 of 12
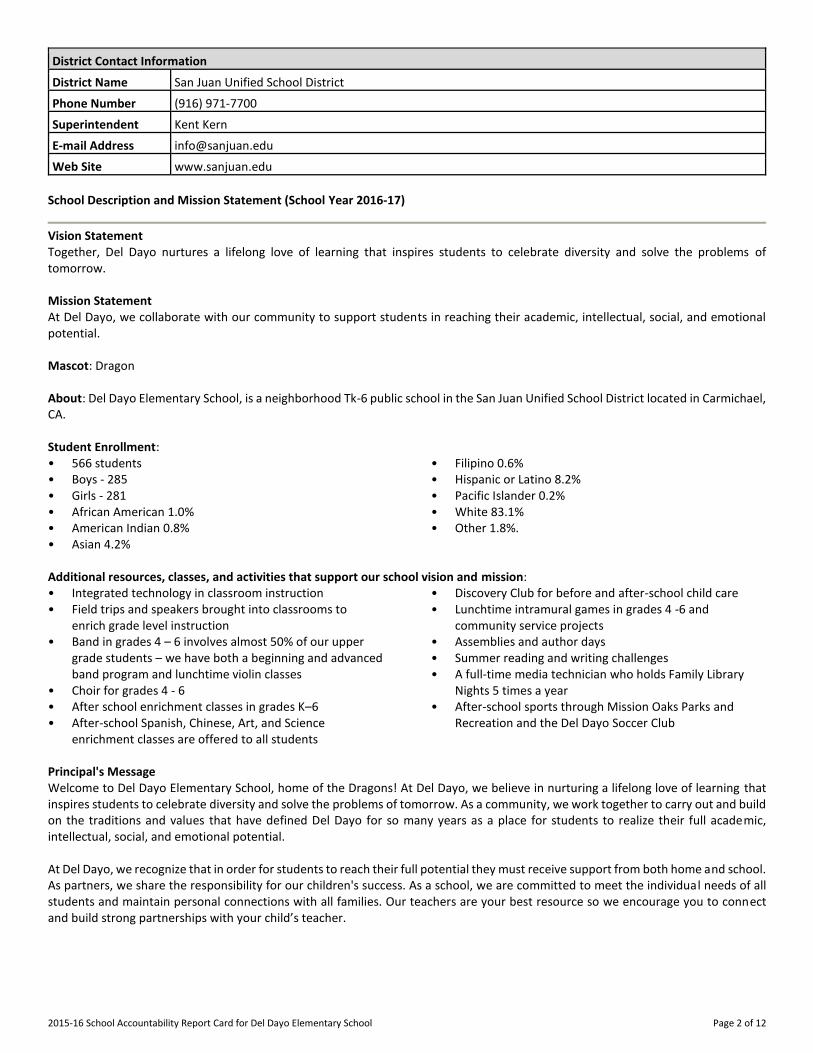
District Contact Information
District Name------- San Juan Unified School District
Phone Number------- (916) 971-7700
Superintendent-------
Kent Kern
E-mail Address------- [email protected]
Web Site------- www.sanjuan.edu
School Description and Mission Statement (School Year 2016-17)
Vision Statement Together, Del Dayo nurtures a lifelong love of learning that inspires students to celebrate diversity and solve the problems of tomorrow. Mission Statement At Del Dayo, we collaborate with our community to support students in reaching their academic, intellectual, social, and emotional potential. Mascot: Dragon About: Del Dayo Elementary School, is a neighborhood Tk-6 public school in the San Juan Unified School District located in Carmichael, CA. Student Enrollment: • 566 students • Boys - 285 • Girls - 281 • African American 1.0% • American Indian 0.8% • Asian 4.2%
• Filipino 0.6% • Hispanic or Latino 8.2% • Pacific Islander 0.2% • White 83.1% • Other 1.8%.
Additional resources, classes, and activities that support our school vision and mission: • Integrated technology in classroom instruction • Field trips and speakers brought into classrooms to
enrich grade level instruction • Band in grades 4 – 6 involves almost 50% of our upper
grade students – we have both a beginning and advanced band program and lunchtime violin classes
• Choir for grades 4 - 6 • After school enrichment classes in grades K–6 • After-school Spanish, Chinese, Art, and Science
enrichment classes are offered to all students
• Discovery Club for before and after-school child care • Lunchtime intramural games in grades 4 -6 and
community service projects • Assemblies and author days • Summer reading and writing challenges • A full-time media technician who holds Family Library
Nights 5 times a year • After-school sports through Mission Oaks Parks and
Recreation and the Del Dayo Soccer Club
Principal's Message Welcome to Del Dayo Elementary School, home of the Dragons! At Del Dayo, we believe in nurturing a lifelong love of learning that inspires students to celebrate diversity and solve the problems of tomorrow. As a community, we work together to carry out and build on the traditions and values that have defined Del Dayo for so many years as a place for students to realize their full academic, intellectual, social, and emotional potential. At Del Dayo, we recognize that in order for students to reach their full potential they must receive support from both home and school. As partners, we share the responsibility for our children's success. As a school, we are committed to meet the individual needs of all students and maintain personal connections with all families. Our teachers are your best resource so we encourage you to connect and build strong partnerships with your child’s teacher.
2015-16 School Accountability Report Card for Del Dayo Elementary School Page 3 of 12
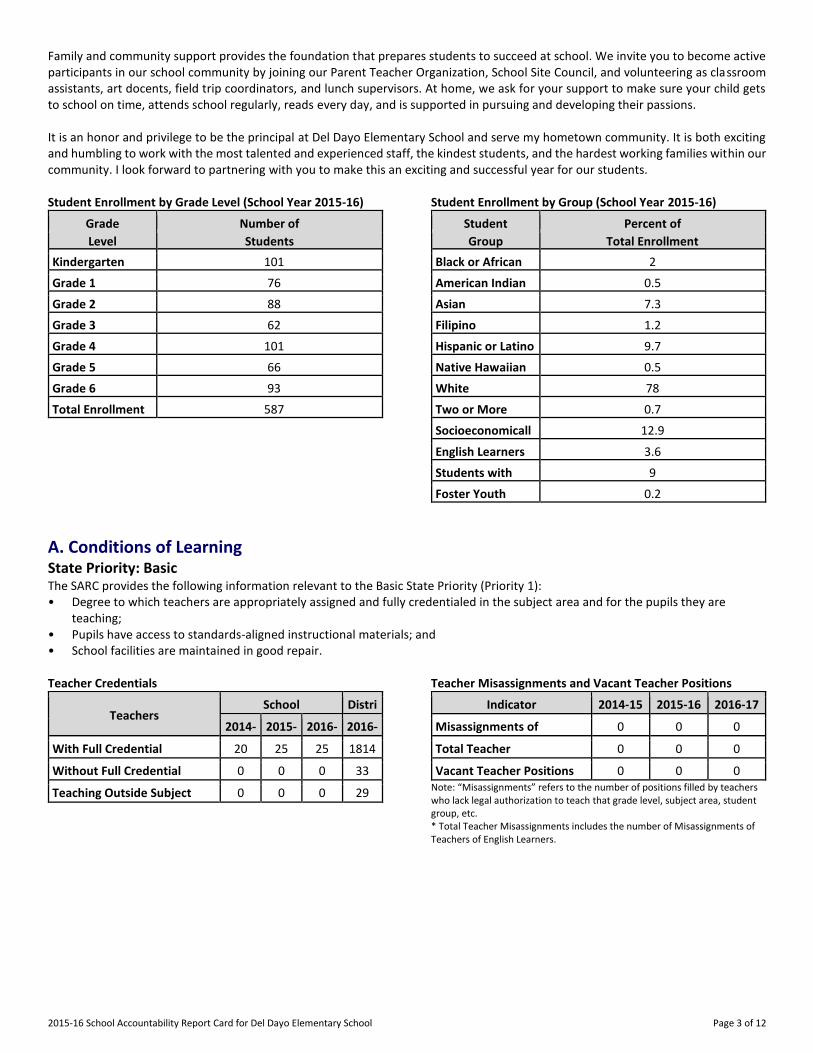
Family and community support provides the foundation that prepares students to succeed at school. We invite you to become active participants in our school community by joining our Parent Teacher Organization, School Site Council, and volunteering as classroom assistants, art docents, field trip coordinators, and lunch supervisors. At home, we ask for your support to make sure your child gets to school on time, attends school regularly, reads every day, and is supported in pursuing and developing their passions. It is an honor and privilege to be the principal at Del Dayo Elementary School and serve my hometown community. It is both exciting and humbling to work with the most talented and experienced staff, the kindest students, and the hardest working families within our community. I look forward to partnering with you to make this an exciting and successful year for our students. Student Enrollment by Grade Level (School Year 2015-16)
Grade Number of
Level Students
Kindergarten 101
Grade 1 76
Grade 2 88
Grade 3 62
Grade 4 101
Grade 5 66
Grade 6 93
Total Enrollment 587
Student Enrollment by Group (School Year 2015-16)
Student Percent of
Group Total Enrollment
Black or African American
2
American Indian or Alaska Native
0.5
Asian 7.3
Filipino 1.2
Hispanic or Latino 9.7
Native Hawaiian or Pacific Islander
0.5
White 78
Two or More Races
0.7
Socioeconomically Disadvantaged
12.9
English Learners 3.6
Students with Disabilities
9
Foster Youth 0.2
A. Conditions of Learning State Priority: Basic The SARC provides the following information relevant to the Basic State Priority (Priority 1): • Degree to which teachers are appropriately assigned and fully credentialed in the subject area and for the pupils they are
teaching; • Pupils have access to standards-aligned instructional materials; and • School facilities are maintained in good repair. Teacher Credentials
Teachers School Distri
ct 2014-15
2015-16
2016-17
2016-17 With Full Credential 20 25 25 1814
Without Full Credential 0 0 0 33
Teaching Outside Subject Area of Competence (with full credential)
0 0 0 29
Teacher Misassignments and Vacant Teacher Positions
Indicator 2014-15 2015-16 2016-17
Misassignments of Teachers of English Learners
0 0 0
Total Teacher Misassignments *
0 0 0
Vacant Teacher Positions 0 0 0 Note: “Misassignments” refers to the number of positions filled by teachers who lack legal authorization to teach that grade level, subject area, student group, etc. * Total Teacher Misassignments includes the number of Misassignments of Teachers of English Learners.
2015-16 School Accountability Report Card for Del Dayo Elementary School Page 4 of 12
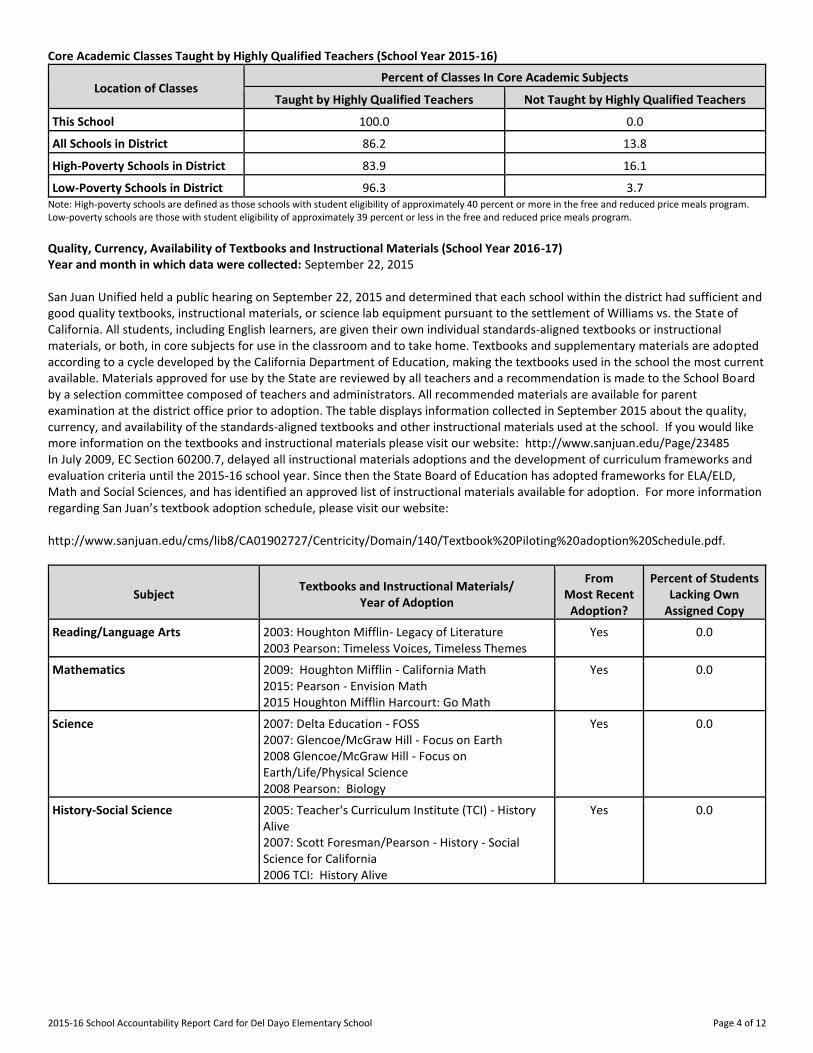
Core Academic Classes Taught by Highly Qualified Teachers (School Year 2015-16)
Location of Classes Percent of Classes In Core Academic Subjects
Taught by Highly Qualified Teachers Not Taught by Highly Qualified Teachers
This School 100.0 0.0
All Schools in District 86.2 13.8
High-Poverty Schools in District 83.9 16.1
Low-Poverty Schools in District 96.3 3.7 Note: High-poverty schools are defined as those schools with student eligibility of approximately 40 percent or more in the free and reduced price meals program. Low-poverty schools are those with student eligibility of approximately 39 percent or less in the free and reduced price meals program. Quality, Currency, Availability of Textbooks and Instructional Materials (School Year 2016-17) Year and month in which data were collected: September 22, 2015 San Juan Unified held a public hearing on September 22, 2015 and determined that each school within the district had sufficient and good quality textbooks, instructional materials, or science lab equipment pursuant to the settlement of Williams vs. the State of California. All students, including English learners, are given their own individual standards-aligned textbooks or instructional materials, or both, in core subjects for use in the classroom and to take home. Textbooks and supplementary materials are adopted according to a cycle developed by the California Department of Education, making the textbooks used in the school the most current available. Materials approved for use by the State are reviewed by all teachers and a recommendation is made to the School Board by a selection committee composed of teachers and administrators. All recommended materials are available for parent examination at the district office prior to adoption. The table displays information collected in September 2015 about the quality, currency, and availability of the standards-aligned textbooks and other instructional materials used at the school. If you would like more information on the textbooks and instructional materials please visit our website: http://www.sanjuan.edu/Page/23485 In July 2009, EC Section 60200.7, delayed all instructional materials adoptions and the development of curriculum frameworks and evaluation criteria until the 2015-16 school year. Since then the State Board of Education has adopted frameworks for ELA/ELD, Math and Social Sciences, and has identified an approved list of instructional materials available for adoption. For more information regarding San Juan’s textbook adoption schedule, please visit our website: http://www.sanjuan.edu/cms/lib8/CA01902727/Centricity/Domain/140/Textbook%20Piloting%20adoption%20Schedule.pdf.
Subject Textbooks and Instructional Materials/
Year of Adoption
From Most Recent
Adoption?
Percent of Students Lacking Own
Assigned Copy
Reading/Language Arts 2003: Houghton Mifflin- Legacy of Literature
2003 Pearson: Timeless Voices, Timeless Themes Yes 0.0
Mathematics 2009: Houghton Mifflin - California Math
2015: Pearson - Envision Math
2015 Houghton Mifflin Harcourt: Go Math
Yes 0.0
Science 2007: Delta Education - FOSS
2007: Glencoe/McGraw Hill - Focus on Earth
2008 Glencoe/McGraw Hill - Focus on Earth/Life/Physical Science
2008 Pearson: Biology
Yes 0.0
History-Social Science 2005: Teacher's Curriculum Institute (TCI) - History Alive
2007: Scott Foresman/Pearson - History - Social Science for California
2006 TCI: History Alive
Yes 0.0
2015-16 School Accountability Report Card for Del Dayo Elementary School Page 5 of 12
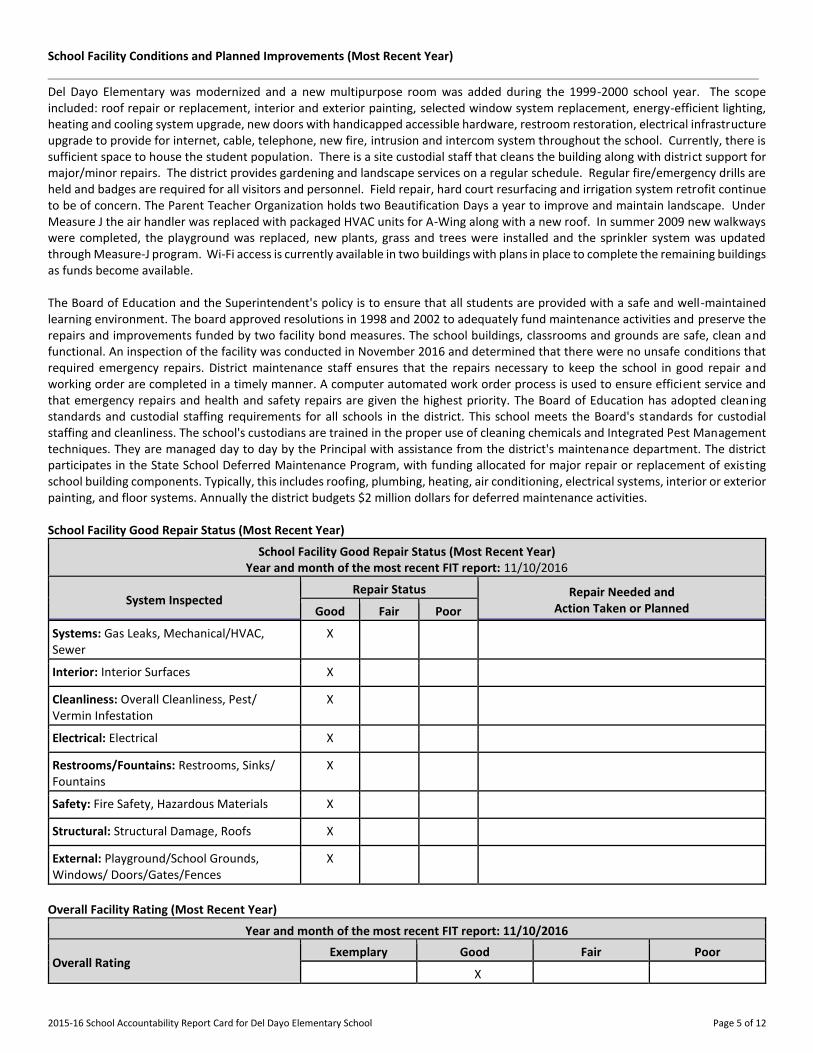
School Facility Conditions and Planned Improvements (Most Recent Year)
Del Dayo Elementary was modernized and a new multipurpose room was added during the 1999-2000 school year. The scope included: roof repair or replacement, interior and exterior painting, selected window system replacement, energy-efficient lighting, heating and cooling system upgrade, new doors with handicapped accessible hardware, restroom restoration, electrical infrastructure upgrade to provide for internet, cable, telephone, new fire, intrusion and intercom system throughout the school. Currently, there is sufficient space to house the student population. There is a site custodial staff that cleans the building along with district support for major/minor repairs. The district provides gardening and landscape services on a regular schedule. Regular fire/emergency drills are held and badges are required for all visitors and personnel. Field repair, hard court resurfacing and irrigation system retrofit continue to be of concern. The Parent Teacher Organization holds two Beautification Days a year to improve and maintain landscape. Under Measure J the air handler was replaced with packaged HVAC units for A-Wing along with a new roof. In summer 2009 new walkways were completed, the playground was replaced, new plants, grass and trees were installed and the sprinkler system was updated through Measure-J program. Wi-Fi access is currently available in two buildings with plans in place to complete the remaining buildings as funds become available. The Board of Education and the Superintendent's policy is to ensure that all students are provided with a safe and well-maintained learning environment. The board approved resolutions in 1998 and 2002 to adequately fund maintenance activities and preserve the repairs and improvements funded by two facility bond measures. The school buildings, classrooms and grounds are safe, clean and functional. An inspection of the facility was conducted in November 2016 and determined that there were no unsafe conditions that required emergency repairs. District maintenance staff ensures that the repairs necessary to keep the school in good repair and working order are completed in a timely manner. A computer automated work order process is used to ensure efficient service and that emergency repairs and health and safety repairs are given the highest priority. The Board of Education has adopted cleaning standards and custodial staffing requirements for all schools in the district. This school meets the Board's standards for custodial staffing and cleanliness. The school's custodians are trained in the proper use of cleaning chemicals and Integrated Pest Management techniques. They are managed day to day by the Principal with assistance from the district's maintenance department. The district participates in the State School Deferred Maintenance Program, with funding allocated for major repair or replacement of existing school building components. Typically, this includes roofing, plumbing, heating, air conditioning, electrical systems, interior or exterior painting, and floor systems. Annually the district budgets $2 million dollars for deferred maintenance activities. School Facility Good Repair Status (Most Recent Year)
School Facility Good Repair Status (Most Recent Year) Year and month of the most recent FIT report: 11/10/2016
System Inspected Repair Status Repair Needed and
Action Taken or Planned Good Fair Poor
Systems: Gas Leaks, Mechanical/HVAC, Sewer
X
Interior: Interior Surfaces X
Cleanliness: Overall Cleanliness, Pest/ Vermin Infestation
X
Electrical: Electrical X
Restrooms/Fountains: Restrooms, Sinks/ Fountains
X
Safety: Fire Safety, Hazardous Materials X
Structural: Structural Damage, Roofs X
External: Playground/School Grounds, Windows/ Doors/Gates/Fences
X
Overall Facility Rating (Most Recent Year)
Year and month of the most recent FIT report: 11/10/2016
Overall Rating Exemplary Good Fair Poor
X
2015-16 School Accountability Report Card for Del Dayo Elementary School Page 6 of 12
B. Pupil Outcomes
State Priority: Pupil Achievement The SARC provides the following information relevant to the State priority: Pupil Achievement (Priority 4): • Statewide assessments (i.e., California Assessment of Student Performance and Progress [CAASPP] System, which includes the
Smarter Balanced Summative Assessments for students in the general education population and the California Alternate Assessments [CAAs] for English language arts/literacy [ELA] and mathematics given in grades three through eight and grade eleven. The CAAs have replaced the California Alternate Performance Assessment [CAPA] for ELA and mathematics, which were eliminated in 2015. Only eligible students may participate in the administration of the CAAs. CAA items are aligned with alternate achievement standards, which are linked with the Common Core State Standards [CCSS] for students with significant cognitive disabilities); and
• The percentage of students who have successfully completed courses that satisfy the requirements for entrance to the University of California and the California State University, or career technical education sequences or programs of study
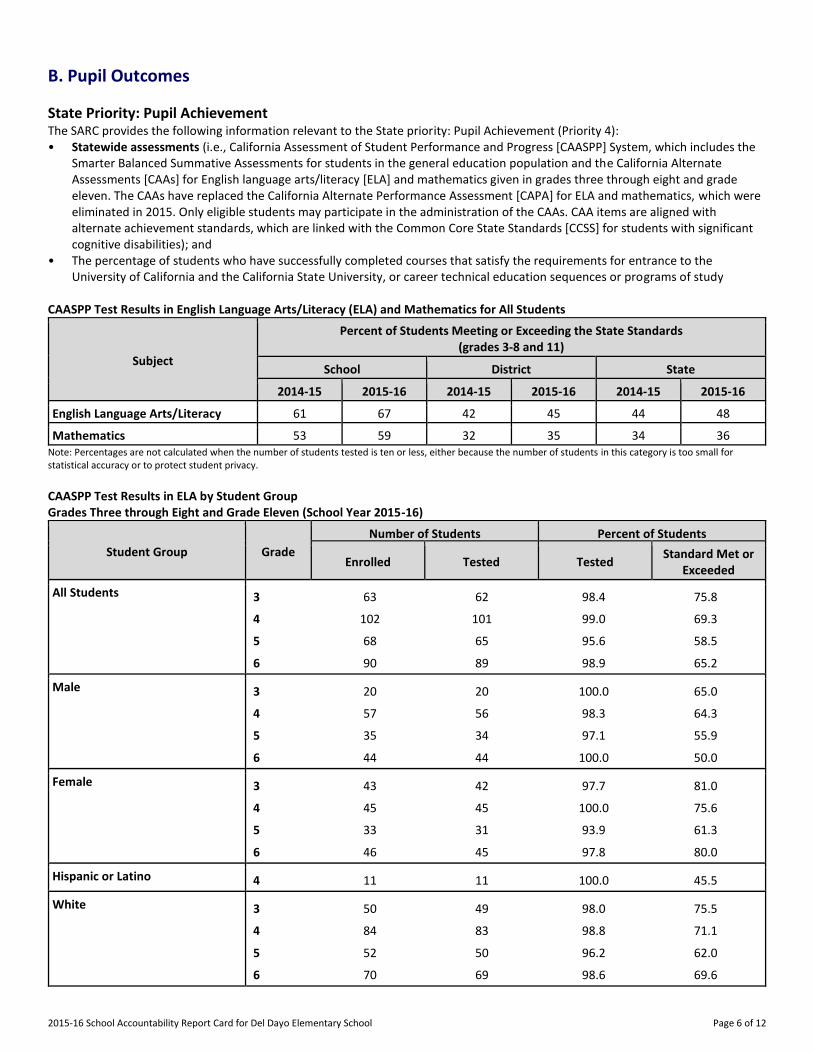
CAASPP Test Results in English Language Arts/Literacy (ELA) and Mathematics for All Students
Subject
Percent of Students Meeting or Exceeding the State Standards (grades 3-8 and 11)
School District State
2014-15 2015-16 2014-15 2015-16 2014-15 2015-16
English Language Arts/Literacy 61 67 42 45 44 48
Mathematics 53 59 32 35 34 36 Note: Percentages are not calculated when the number of students tested is ten or less, either because the number of students in this category is too small for statistical accuracy or to protect student privacy.
CAASPP Test Results in ELA by Student Group Grades Three through Eight and Grade Eleven (School Year 2015-16)
Student Group Grade
Number of Students Percent of Students
Enrolled Tested Tested Standard Met or
Exceeded
All Students 3 63 62 98.4 75.8
4 102 101 99.0 69.3
5 68 65 95.6 58.5
6 90 89 98.9 65.2
Male 3 20 20 100.0 65.0
4 57 56 98.3 64.3
5 35 34 97.1 55.9
6 44 44 100.0 50.0
Female 3 43 42 97.7 81.0
4 45 45 100.0 75.6
5 33 31 93.9 61.3
6 46 45 97.8 80.0
Hispanic or Latino 4 11 11 100.0 45.5
White 3 50 49 98.0 75.5
4 84 83 98.8 71.1
5 52 50 96.2 62.0
6 70 69 98.6 69.6
2015-16 School Accountability Report Card for Del Dayo Elementary School Page 7 of 12
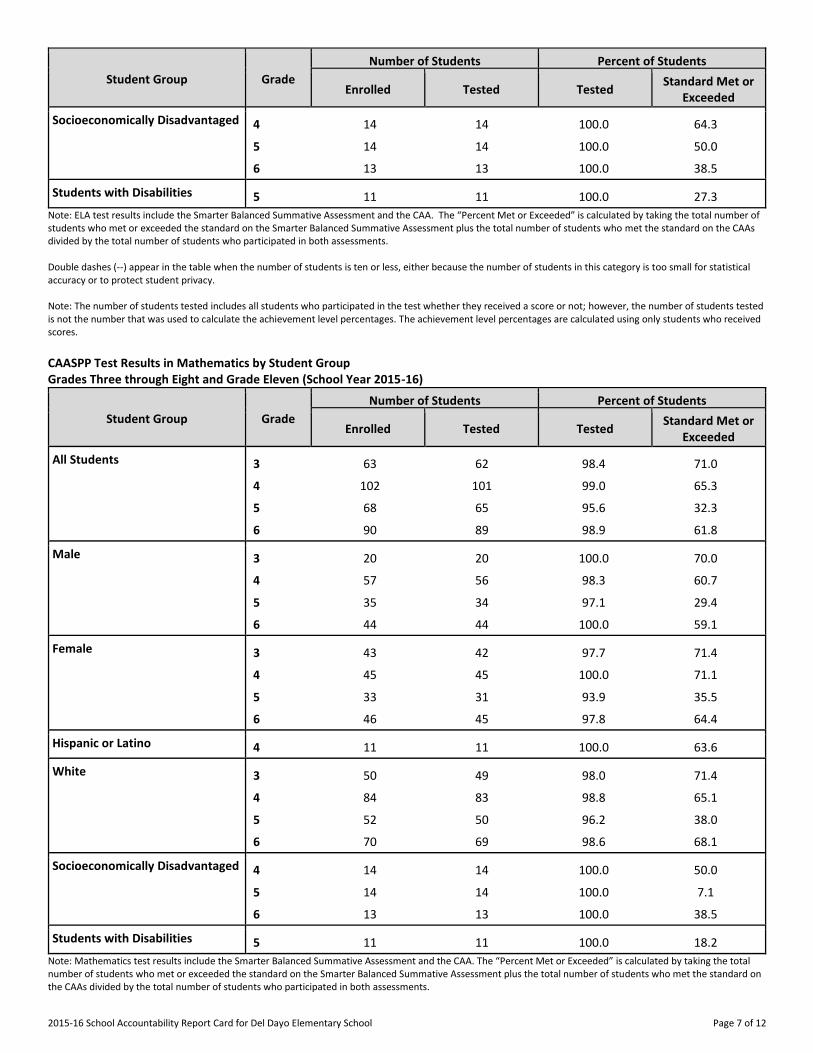
Student Group Grade
Number of Students Percent of Students
Enrolled Tested Tested Standard Met or
Exceeded
Socioeconomically Disadvantaged 4 14 14 100.0 64.3
5 14 14 100.0 50.0
6 13 13 100.0 38.5
Students with Disabilities 5 11 11 100.0 27.3
Note: ELA test results include the Smarter Balanced Summative Assessment and the CAA. The “Percent Met or Exceeded” is calculated by taking the total number of students who met or exceeded the standard on the Smarter Balanced Summative Assessment plus the total number of students who met the standard on the CAAs divided by the total number of students who participated in both assessments. Double dashes (--) appear in the table when the number of students is ten or less, either because the number of students in this category is too small for statistical accuracy or to protect student privacy. Note: The number of students tested includes all students who participated in the test whether they received a score or not; however, the number of students tested is not the number that was used to calculate the achievement level percentages. The achievement level percentages are calculated using only students who received scores.
CAASPP Test Results in Mathematics by Student Group Grades Three through Eight and Grade Eleven (School Year 2015-16)
Student Group Grade
Number of Students Percent of Students
Enrolled Tested Tested Standard Met or
Exceeded
All Students 3 63 62 98.4 71.0
4 102 101 99.0 65.3
5 68 65 95.6 32.3
6 90 89 98.9 61.8
Male 3 20 20 100.0 70.0
4 57 56 98.3 60.7
5 35 34 97.1 29.4
6 44 44 100.0 59.1
Female 3 43 42 97.7 71.4
4 45 45 100.0 71.1
5 33 31 93.9 35.5
6 46 45 97.8 64.4
Hispanic or Latino 4 11 11 100.0 63.6
White 3 50 49 98.0 71.4
4 84 83 98.8 65.1
5 52 50 96.2 38.0
6 70 69 98.6 68.1
Socioeconomically Disadvantaged 4 14 14 100.0 50.0
5 14 14 100.0 7.1
6 13 13 100.0 38.5
Students with Disabilities 5 11 11 100.0 18.2
Note: Mathematics test results include the Smarter Balanced Summative Assessment and the CAA. The “Percent Met or Exceeded” is calculated by taking the total number of students who met or exceeded the standard on the Smarter Balanced Summative Assessment plus the total number of students who met the standard on the CAAs divided by the total number of students who participated in both assessments.
2015-16 School Accountability Report Card for Del Dayo Elementary School Page 8 of 12
Double dashes (--) appear in the table when the number of students is ten or less, either because the number of students in this category is too small for statistical accuracy or to protect student privacy. Note: The number of students tested includes all students who participated in the test whether they received a score or not; however, the number of students tested is not the number that was used to calculate the achievement level percentages. The achievement level percentages are calculated using only students who received scores.
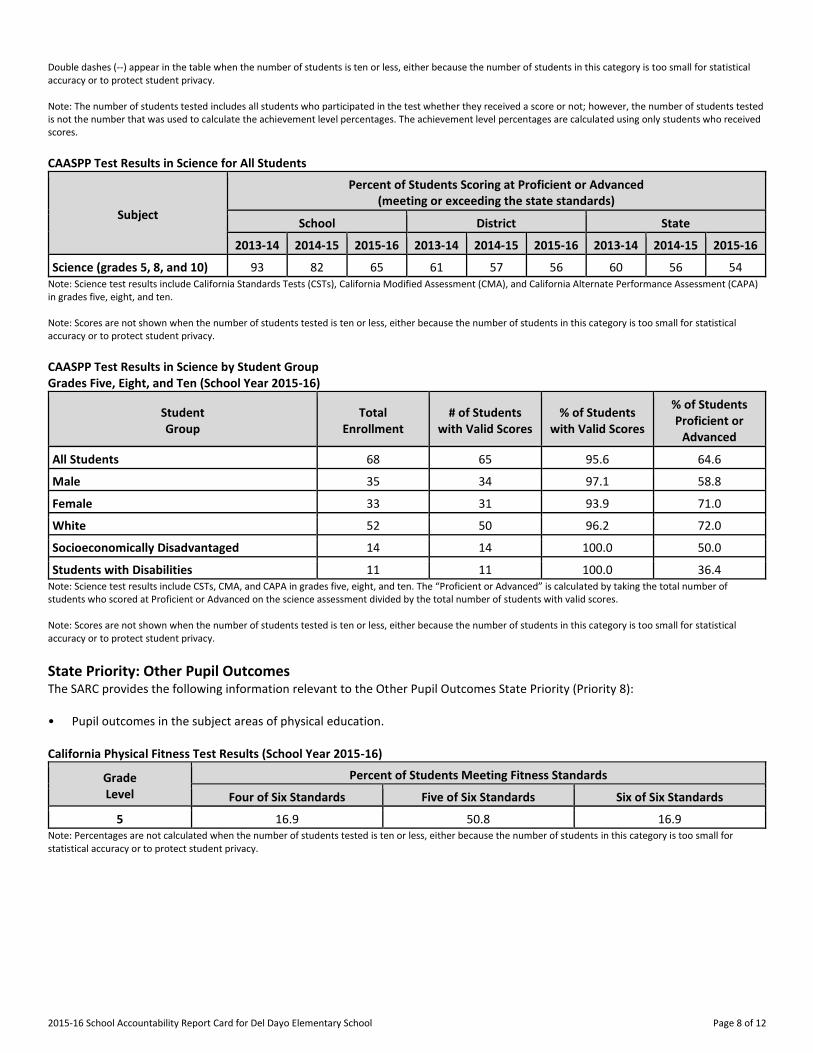
CAASPP Test Results in Science for All Students
Subject
Percent of Students Scoring at Proficient or Advanced (meeting or exceeding the state standards)
School District State
2013-14 2014-15 2015-16 2013-14 2014-15 2015-16 2013-14 2014-15 2015-16
Science (grades 5, 8, and 10) 93 82 65 61 57 56 60 56 54 Note: Science test results include California Standards Tests (CSTs), California Modified Assessment (CMA), and California Alternate Performance Assessment (CAPA) in grades five, eight, and ten. Note: Scores are not shown when the number of students tested is ten or less, either because the number of students in this category is too small for statistical accuracy or to protect student privacy.
CAASPP Test Results in Science by Student Group Grades Five, Eight, and Ten (School Year 2015-16)
Student Group
Total Enrollment
# of Students with Valid Scores
% of Students with Valid Scores
% of Students Proficient or
Advanced
All Students 68 65 95.6 64.6
Male 35 34 97.1 58.8
Female 33 31 93.9 71.0
White 52 50 96.2 72.0
Socioeconomically Disadvantaged 14 14 100.0 50.0
Students with Disabilities 11 11 100.0 36.4 Note: Science test results include CSTs, CMA, and CAPA in grades five, eight, and ten. The “Proficient or Advanced” is calculated by taking the total number of students who scored at Proficient or Advanced on the science assessment divided by the total number of students with valid scores. Note: Scores are not shown when the number of students tested is ten or less, either because the number of students in this category is too small for statistical accuracy or to protect student privacy.
State Priority: Other Pupil Outcomes The SARC provides the following information relevant to the Other Pupil Outcomes State Priority (Priority 8): • Pupil outcomes in the subject areas of physical education. California Physical Fitness Test Results (School Year 2015-16)
Grade Level
Percent of Students Meeting Fitness Standards
Four of Six Standards Five of Six Standards Six of Six Standards
---5--- 16.9 50.8 16.9 Note: Percentages are not calculated when the number of students tested is ten or less, either because the number of students in this category is too small for statistical accuracy or to protect student privacy.
2015-16 School Accountability Report Card for Del Dayo Elementary School Page 9 of 12
C. Engagement
State Priority: Parental Involvement The SARC provides the following information relevant to the Parental Involvement State Priority (Priority 3): • Efforts the school district makes to seek parent input in making decisions for the school district and each schoolsite. Opportunities for Parental Involvement (School Year 2016-17)
At Del Dayo, we recognize that in order for our students to reach their full potential they must receive support from both the home and school. As partners, we share the responsibility for our children's success. This requires collaboration and communication. As a school, our staff is committed to meet the individual needs of all students and maintain personal connections with all families. We invite families and community members to become active participants in our school community. This is evident at Del Dayo through the thousands of family volunteer hours that are logged in and out of our classrooms each year, the active involvement of stakeholders in our Parent Teacher Organization and School Site Council, and the number of parents and family members who act as art docents, field trip coordinators, lunch monitors, and classroom assistants. Del Dayo also has a parent newsletter that is created in collaboration with staff and parents and is sent home electronically every Thursday. Parents or community members who wish to participate in leadership teams, school committees, school activities, or become a volunteer may contact the school office 575-2323.
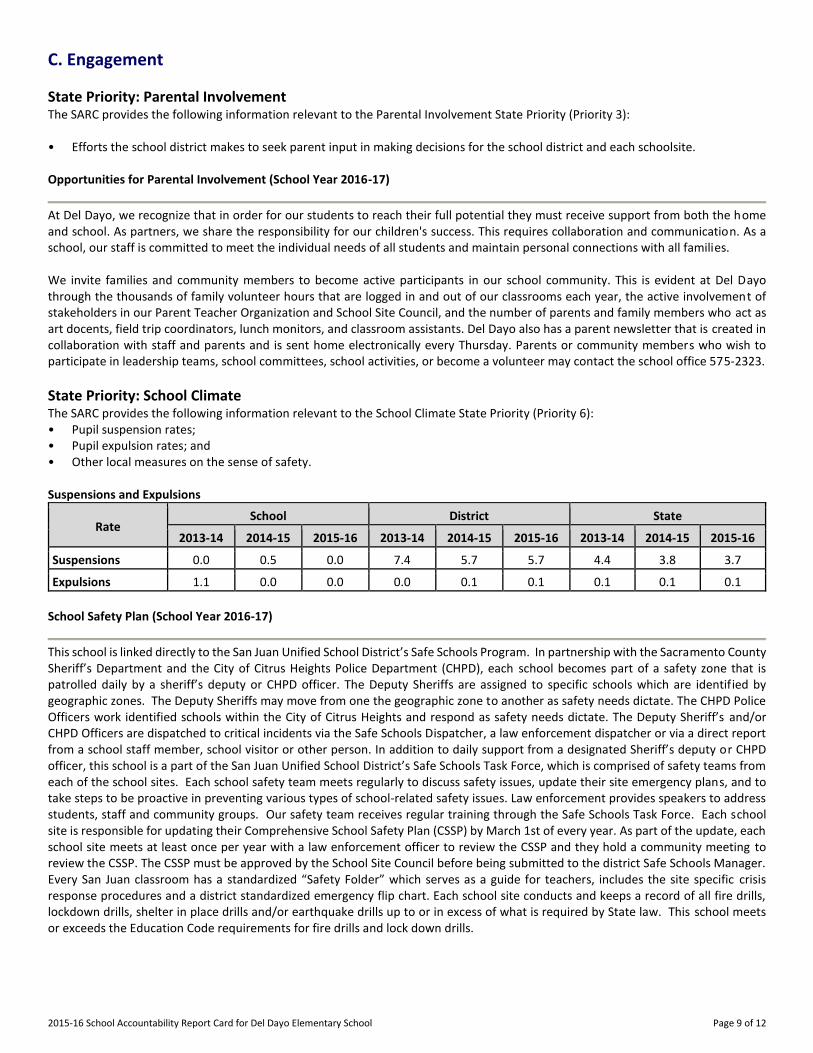
State Priority: School Climate The SARC provides the following information relevant to the School Climate State Priority (Priority 6): • Pupil suspension rates; • Pupil expulsion rates; and • Other local measures on the sense of safety. Suspensions and Expulsions
Rate School District State
2013-14 2014-15 2015-16 2013-14 2014-15 2015-16 2013-14 2014-15 2015-16
Suspensions------- 0.0 0.5 0.0 7.4 5.7 5.7 4.4 3.8 3.7
Expulsions------- 1.1 0.0 0.0 0.0 0.1 0.1 0.1 0.1 0.1
School Safety Plan (School Year 2016-17)
This school is linked directly to the San Juan Unified School District’s Safe Schools Program. In partnership with the Sacramento County Sheriff’s Department and the City of Citrus Heights Police Department (CHPD), each school becomes part of a safety zone that is patrolled daily by a sheriff’s deputy or CHPD officer. The Deputy Sheriffs are assigned to specific schools which are identified by geographic zones. The Deputy Sheriffs may move from one the geographic zone to another as safety needs dictate. The CHPD Police Officers work identified schools within the City of Citrus Heights and respond as safety needs dictate. The Deputy Sheriff’s and/or CHPD Officers are dispatched to critical incidents via the Safe Schools Dispatcher, a law enforcement dispatcher or via a direct report from a school staff member, school visitor or other person. In addition to daily support from a designated Sheriff’s deputy or CHPD officer, this school is a part of the San Juan Unified School District’s Safe Schools Task Force, which is comprised of safety teams from each of the school sites. Each school safety team meets regularly to discuss safety issues, update their site emergency plans, and to take steps to be proactive in preventing various types of school-related safety issues. Law enforcement provides speakers to address students, staff and community groups. Our safety team receives regular training through the Safe Schools Task Force. Each school site is responsible for updating their Comprehensive School Safety Plan (CSSP) by March 1st of every year. As part of the update, each school site meets at least once per year with a law enforcement officer to review the CSSP and they hold a community meeting to review the CSSP. The CSSP must be approved by the School Site Council before being submitted to the district Safe Schools Manager. Every San Juan classroom has a standardized “Safety Folder” which serves as a guide for teachers, includes the site specific crisis response procedures and a district standardized emergency flip chart. Each school site conducts and keeps a record of all fire drills, lockdown drills, shelter in place drills and/or earthquake drills up to or in excess of what is required by State law. This school meets or exceeds the Education Code requirements for fire drills and lock down drills.
2015-16 School Accountability Report Card for Del Dayo Elementary School Page 10 of 12
D. Other SARC Information
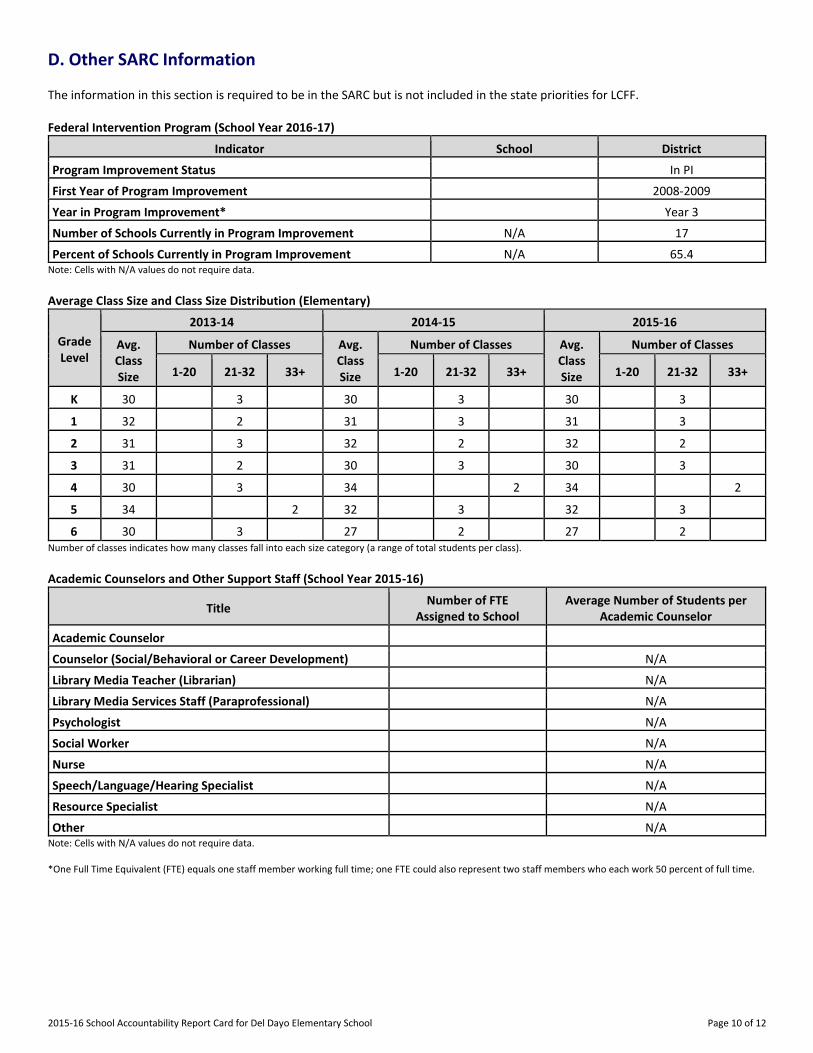
The information in this section is required to be in the SARC but is not included in the state priorities for LCFF. Federal Intervention Program (School Year 2016-17)
Indicator School District
Program Improvement Status In PI
First Year of Program Improvement 2008-2009
Year in Program Improvement* Year 3
Number of Schools Currently in Program Improvement N/A 17
Percent of Schools Currently in Program Improvement N/A 65.4 Note: Cells with N/A values do not require data.
Average Class Size and Class Size Distribution (Elementary)
Grade Level
2013-14 2014-15 2015-16
Avg. Class Size
Number of Classes Avg. Class Size
Number of Classes Avg. Class Size
Number of Classes
1-20 21-32 33+ 1-20 21-32 33+ 1-20 21-32 33+
K
30 3 30 3 30 3
1
32 2 31 3 31 3
2
31 3 32 2 32 2
3
31 2 30 3 30 3
4
30 3 34 2 34 2
5
34 2 32 3 32 3
6
30 3 27 2 27 2 Number of classes indicates how many classes fall into each size category (a range of total students per class).
Academic Counselors and Other Support Staff (School Year 2015-16)
Title Number of FTE
Assigned to School Average Number of Students per
Academic Counselor
Academic Counselor-------
Counselor (Social/Behavioral or Career Development) N/A
Library Media Teacher (Librarian) N/A
Library Media Services Staff (Paraprofessional) N/A
Psychologist------- N/A
Social Worker------- N/A
Nurse------- N/A
Speech/Language/Hearing Specialist N/A
Resource Specialist------- N/A
Other------- N/A Note: Cells with N/A values do not require data. *One Full Time Equivalent (FTE) equals one staff member working full time; one FTE could also represent two staff members who each work 50 percent of full time.
2015-16 School Accountability Report Card for Del Dayo Elementary School Page 11 of 12
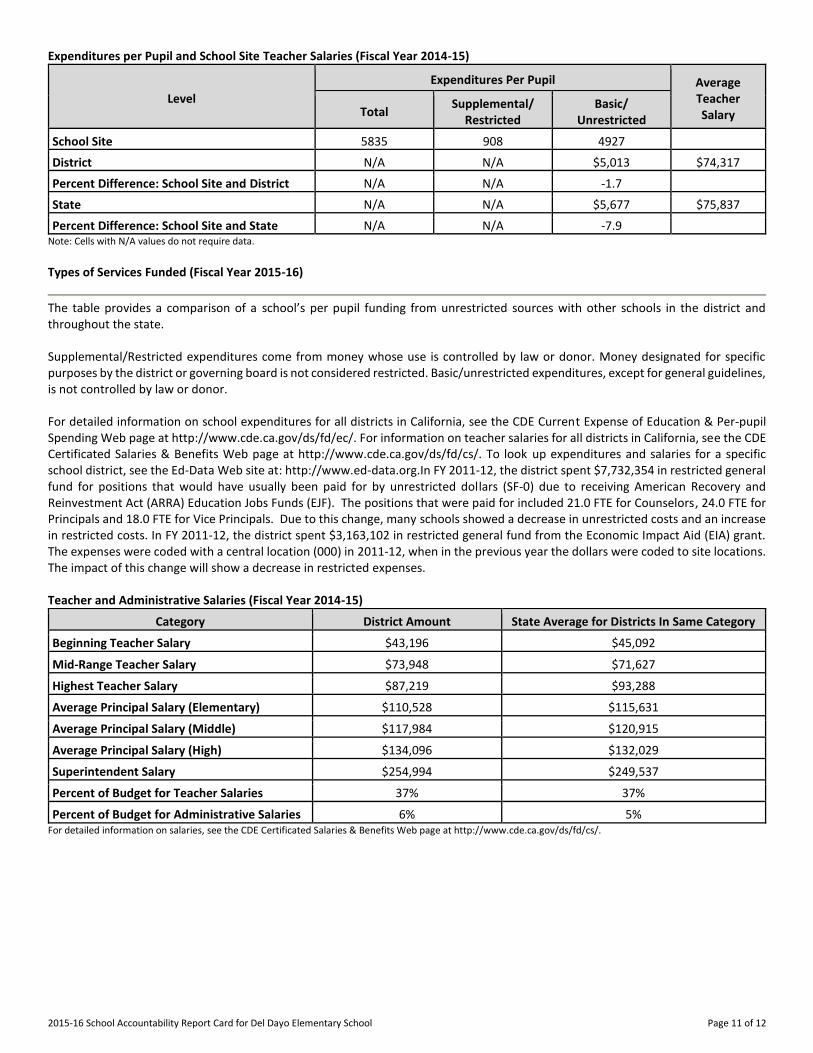
Expenditures per Pupil and School Site Teacher Salaries (Fiscal Year 2014-15)
Level
Expenditures Per Pupil Average Teacher Salary Total
Supplemental/ Restricted
Basic/ Unrestricted
School Site------- 5835 908 4927
District------- N/A N/A $5,013 $74,317
Percent Difference: School Site and District N/A N/A -1.7
State------- N/A N/A $5,677 $75,837
Percent Difference: School Site and State N/A N/A -7.9 Note: Cells with N/A values do not require data.
Types of Services Funded (Fiscal Year 2015-16)
The table provides a comparison of a school’s per pupil funding from unrestricted sources with other schools in the district and throughout the state. Supplemental/Restricted expenditures come from money whose use is controlled by law or donor. Money designated for specific purposes by the district or governing board is not considered restricted. Basic/unrestricted expenditures, except for general guidelines, is not controlled by law or donor. For detailed information on school expenditures for all districts in California, see the CDE Current Expense of Education & Per-pupil Spending Web page at http://www.cde.ca.gov/ds/fd/ec/. For information on teacher salaries for all districts in California, see the CDE Certificated Salaries & Benefits Web page at http://www.cde.ca.gov/ds/fd/cs/. To look up expenditures and salaries for a specific school district, see the Ed-Data Web site at: http://www.ed-data.org.In FY 2011-12, the district spent $7,732,354 in restricted general fund for positions that would have usually been paid for by unrestricted dollars (SF-0) due to receiving American Recovery and Reinvestment Act (ARRA) Education Jobs Funds (EJF). The positions that were paid for included 21.0 FTE for Counselors, 24.0 FTE for Principals and 18.0 FTE for Vice Principals. Due to this change, many schools showed a decrease in unrestricted costs and an increase in restricted costs. In FY 2011-12, the district spent $3,163,102 in restricted general fund from the Economic Impact Aid (EIA) grant. The expenses were coded with a central location (000) in 2011-12, when in the previous year the dollars were coded to site locations. The impact of this change will show a decrease in restricted expenses. Teacher and Administrative Salaries (Fiscal Year 2014-15)
Category District Amount State Average for Districts In Same Category
Beginning Teacher Salary $43,196 $45,092
Mid-Range Teacher Salary $73,948 $71,627
Highest Teacher Salary $87,219 $93,288
Average Principal Salary (Elementary) $110,528 $115,631
Average Principal Salary (Middle) $117,984 $120,915
Average Principal Salary (High) $134,096 $132,029
Superintendent Salary $254,994 $249,537
Percent of Budget for Teacher Salaries 37% 37%
Percent of Budget for Administrative Salaries 6% 5% For detailed information on salaries, see the CDE Certificated Salaries & Benefits Web page at http://www.cde.ca.gov/ds/fd/cs/.
2015-16 School Accountability Report Card for Del Dayo Elementary School Page 12 of 12
Professional Development (Most Recent Three Years)
Professional development is a key part of the continuous improvement process for educators. The goal of our quality professional development is to support the learning of teachers and paraprofessionals to positively impact student achievement. Annually, teachers and site administrators participate in professional development in a variety of opportunities. Seventy-five minutes per week are dedicated to staff collaboration and training planned by site leadership teams. The District also provides a cycle of continuous professional development for Administrators through Principal Networks as well as Leadership Academies. The District provides professional development opportunities for teachers and administrators that support the implementation of Common Core State Standards in English language arts, mathematics, science, social studies, and the ELA/ELD Framework. Specific professional development initiatives include: Culturally Responsive Practices, Critical Literacy, TK-2 Reading, Supporting Independence and Engagement through Reading and Writing, Engineering and Mathematics Inspiring Thinking Solutions, Math to the Core, Expository Reading and Writing Course, and ELD Foundations. District departments, Center for Teacher Support, grant-funded projects, and the San Juan Teacher’s Association sponsor additional training opportunities. Professional development opportunities are voluntary for teachers and are provided throughout the year in a variety of formats: during the school day, after school, on Saturdays, and during summer and vacation breaks. Many teachers and administrators also take advantage of opportunities with Sacramento County Office of Education, California Department of Education, the college/university programs, state/national education organizations, and private educational institutes. What grounds the professional development in the district is the District Strategic Plan and the Local Control Accountability Plan. Professional Development is further determined using one or more of the following: (a) student achievement data, (b) staff survey data, and (c) district-identified goals. Professional development addresses the Common Core State Standards, teaching strategies, curriculum, assessment, technology, classroom management, safety, and leadership. Administrator training accompanies professional development in district focus areas, providing implementation support for teachers on site. Content-area coaches are available at some schools. Additional classroom support is provided to new and struggling teachers by consulting teachers from the Center for Teacher Support. Paraprofessionals are encouraged to participate in professional development at the district and site level. Specifically designed training is also offered to non-instructional support staff such as clerical and custodial staff that includes both operational and instructional topics.