Embed Size (px)
Citation preview
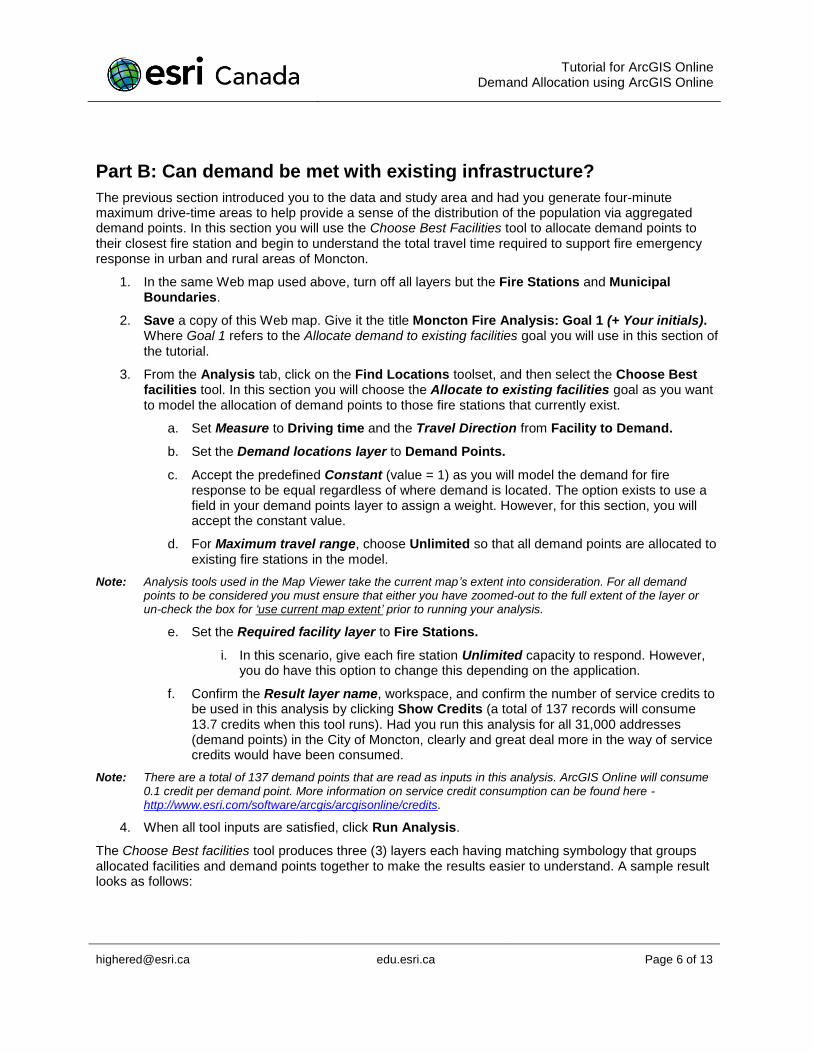
Tutorial for ArcGIS Online Demand Allocation using ArcGIS Online
[email protected] edu.esri.ca Page 1 of 13
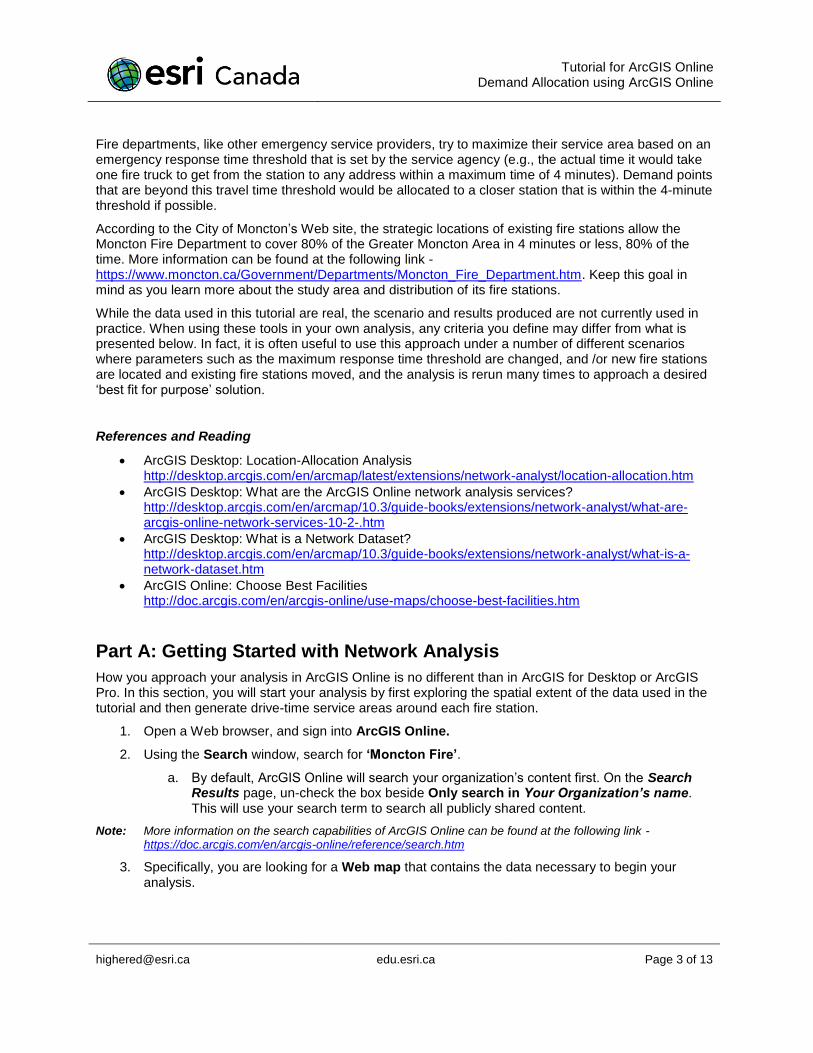
Demand Allocation using ArcGIS Online
Tutorial Overview
Services provided by a region or municipality (e.g., fire, police, ambulance, and public works) are expected to meet or exceed given performance thresholds in terms of their efficiency and coverage in response to public needs. In this tutorial you will use network analysis tools built into ArcGIS Online to review the coverage of fire stations in the City of Moncton, New Brunswick and explore the impact that adding and removing stations has on the average fire emergency response time in the area.
Skills
By completing this tutorial, you will become comfortable with the following GIS skills:
1. Access Web map and data services through a Web browser
2. Create drive-time areas
3. Assess facility capacity in a location-allocation problem
4. Solve different location-allocation analysis problems.
Time Required
The following classroom time is required to complete this tutorial:
30-45 minutes
Materials Required
Technology:
An ArcGIS Online Organizational Account (Subscription) o To complete this tutorial, you must have been assigned either a Publisher or a Custom role that
includes the network analysis privilege assigned by your ArcGIS Online Administrator:
o If you do not have an ArcGIS Online account, contact your school’s ArcGIS Online Administrator. Alternatively, you can sign up for a free ArcGIS Platform trial here: http://www.esri.com/software/arcgis/free-trial.
o Applications, associated services, and any output analysis produced that are hosted on ArcGIS Online consume service credits. More information on what consumes service credits can be found at: http://www.esri.com/software/arcgis/arcgisonline/credits.
A Web browser (e.g., Mozilla Firefox, Google Chrome, Apple Safari, or Internet Explorer).
Data:
No data are included with this tutorial. Rather, data were downloaded ahead of time and published as Hosted Feature Layers (data services), where they can be accessed through a Web map in ArcGIS Online.

Tutorial for ArcGIS Online Demand Allocation using ArcGIS Online
[email protected] edu.esri.ca Page 2 of 13
Data Sources
The following data source was used in the creation of this tutorial:
City of Moncton, NB Open Data Catalogue https://www.moncton.ca/Government/Terms_of_use/Open_Data_Purpose/Data_Catalogue.htm Date Accessed: March, 2016
Production Date
The Education and Research Group at Esri Canada makes every effort to present accurate and reliable information. The Web sites and URLs used in this tutorial are from sources that were current at the time of production but are subject to change without notice to Esri Canada.
Production Date: September, 2016
Background Information
Numerous tools can be used to understand relationships between spatial features across the ArcGIS platform. Two examples are the Choose Best Facilities tool available in ArcGIS Online and the similar Location-Allocation tools available in ArcGIS for Desktop and ArcGIS Pro. Both tools are examples of location-allocation analysis. This is a type of network analysis that has the ability to locate facilities in response to new demand, and allocate this demand to existing (or new) facilities based on defined criteria (e.g., response time, enrollment capacity, etc.). Location-allocation tools solve different problems (or goals as they are referred to in ArcGIS Online), that include:
Allocate population to existing facilities,
Maximize coverage of existing facilities with capacity,
Maximize coverage of existing facilities,
Minimize travel to existing facilities, and
Cover a percentage of demand by existing facilities from their surround populations.
More information on the Choose Best Facilities tool in addition to the different goals the tool can solve are found at the following link – https://doc.arcgis.com/en/arcgis-online/use-maps/choose-best-facilities.htm.
For this tutorial, you will model the allocation of demand to existing fire stations using two of the goals mentioned above: Allocate to existing facilities and Maximize coverage. Demand in this case, represents a population’s need for a service that fire stations provide relative to the spatial distribution of individual demand points (potential fire locations).
It is possible to aggregate demand points to capture the total number of addresses in a census dissemination area. However, for aggregated data, the point location may not accurately reflect the location of most of the individuals in the area, especially if the area is relatively large. Where the aggregated point is located could determine whether the demand gets allocated to the closest facility correctly, especially if a centroid is calculated to a given geographic area to represent multiple demand points.
Since there are over 31,000 addresses in Moncton, it is not practical to use individual addresses in your analysis. An alternative approach, rather, is to aggregate those addresses to local census dissemination areas and calculate the mean centre to represent the average location of all address points within each dissemination area. This approach captures the average location of address points as opposed to using the calculated geometric centroid within the dissemination area boundary.
Tutorial for ArcGIS Online Demand Allocation using ArcGIS Online
[email protected] edu.esri.ca Page 3 of 13
Fire departments, like other emergency service providers, try to maximize their service area based on an emergency response time threshold that is set by the service agency (e.g., the actual time it would take one fire truck to get from the station to any address within a maximum time of 4 minutes). Demand points that are beyond this travel time threshold would be allocated to a closer station that is within the 4-minute threshold if possible.
According to the City of Moncton’s Web site, the strategic locations of existing fire stations allow the Moncton Fire Department to cover 80% of the Greater Moncton Area in 4 minutes or less, 80% of the time. More information can be found at the following link - https://www.moncton.ca/Government/Departments/Moncton_Fire_Department.htm. Keep this goal in mind as you learn more about the study area and distribution of its fire stations.
While the data used in this tutorial are real, the scenario and results produced are not currently used in practice. When using these tools in your own analysis, any criteria you define may differ from what is presented below. In fact, it is often useful to use this approach under a number of different scenarios where parameters such as the maximum response time threshold are changed, and /or new fire stations are located and existing fire stations moved, and the analysis is rerun many times to approach a desired ‘best fit for purpose’ solution.
References and Reading
ArcGIS Desktop: Location-Allocation Analysis http://desktop.arcgis.com/en/arcmap/latest/extensions/network-analyst/location-allocation.htm
ArcGIS Desktop: What are the ArcGIS Online network analysis services? http://desktop.arcgis.com/en/arcmap/10.3/guide-books/extensions/network-analyst/what-are-arcgis-online-network-services-10-2-.htm
ArcGIS Desktop: What is a Network Dataset? http://desktop.arcgis.com/en/arcmap/10.3/guide-books/extensions/network-analyst/what-is-a-network-dataset.htm
ArcGIS Online: Choose Best Facilities http://doc.arcgis.com/en/arcgis-online/use-maps/choose-best-facilities.htm
Part A: Getting Started with Network Analysis
How you approach your analysis in ArcGIS Online is no different than in ArcGIS for Desktop or ArcGIS Pro. In this section, you will start your analysis by first exploring the spatial extent of the data used in the tutorial and then generate drive-time service areas around each fire station.
1. Open a Web browser, and sign into ArcGIS Online.
2. Using the Search window, search for ‘Moncton Fire’.
a. By default, ArcGIS Online will search your organization’s content first. On the Search Results page, un-check the box beside Only search in Your Organization’s name. This will use your search term to search all publicly shared content.
Note: More information on the search capabilities of ArcGIS Online can be found at the following link - https://doc.arcgis.com/en/arcgis-online/reference/search.htm
3. Specifically, you are looking for a Web map that contains the data necessary to begin your analysis.
Tutorial for ArcGIS Online Demand Allocation using ArcGIS Online
[email protected] edu.esri.ca Page 4 of 13
a. Under the Show section, click on Maps to filter your results
b. Click on the thumbnail icon beside the Moncton Fire Analysis Web map to open it. If by chance you get to the Item Details page of the Web map, you can still click on the thumbnail icon to open it.
This Web map contains data from the City of Moncton’s Open Data Catalogue. Data were downloaded and published as Hosted Feature Layers in ArcGIS Online for use in this tutorial. More information on the data types used in this tutorial can be found at the following link - https://doc.arcgis.com/en/arcgis-online/share-maps/hosted-web-layers.htm.
4. Save a copy of this Web map. Name it Moncton Fire Analysis: Drive Time (+ Your initials).
Your first task is to assess how many demand points are within a 4-minute drive of each fire station. To achieve this, you will create drive-time areas around each of the 5 fire stations in Moncton. This will provide a general idea of the level of accessibility across the city and serve as a starting point for your analysis.
5. From the Analysis tab, click on Use Proximity to open the toolset. More information on the Use Proximity toolset can be found at the following link - http://doc.arcgis.com/en/arcgis-online/use-maps/perform-analysis.htm.
a. Select Create Drive-Time Areas.
b. For Choose point layer to calculate drive-time areas around select Fire Stations.
c. Set Measure to Driving Time, and then set it to 4 (minutes).
d. When measuring drive times, you can define how shared areas (i.e., overlap) from different fire stations are handled when they reach one another. For this analysis, set the Areas from different points to Dissolve. Choosing this option will merge all areas into one, and no more than one area can cover a particular location. This method is useful when you need to know if an area can be reached within a given time period or distance specified.
e. When all inputs to the tool are satisfied, click Run Analysis.
A review of drive-time results reveal that not all demand points fall within the target 4-minute drive time area. This is obvious when examining those demand points in rural areas that are part of the Moncton LSD (Local Service District) that the fire department supports. It also reveals locations fire trucks cannot reach in emergencies within 4 minutes within existing urban areas.
To get a better sense of the total number of demand points that are within the 4-minute drive time area of each fire station you will perform the following query:
6. From the Analysis tab, choose the Find Locations toolset, then select the Find Existing Locations tool. This tool allows you to make both spatial and attribute queries on existing feature layers in your Web map by adding one or more expressions to the tool. You will use this tool to select only those demand points that intersect with the 4-minute drive time service areas created above. More information on the Find Existing Locations tool can be found at the following link - http://doc.arcgis.com/en/arcgis-online/use-maps/find-existing-locations.htm.
a. Create an expression that selects all Demand Points that intersects with 4-minute drive time layer created above by adding the following expression:
Tutorial for ArcGIS Online Demand Allocation using ArcGIS Online
[email protected] edu.esri.ca Page 5 of 13
b. . Give the new layer a name, and then click Run Analysis.
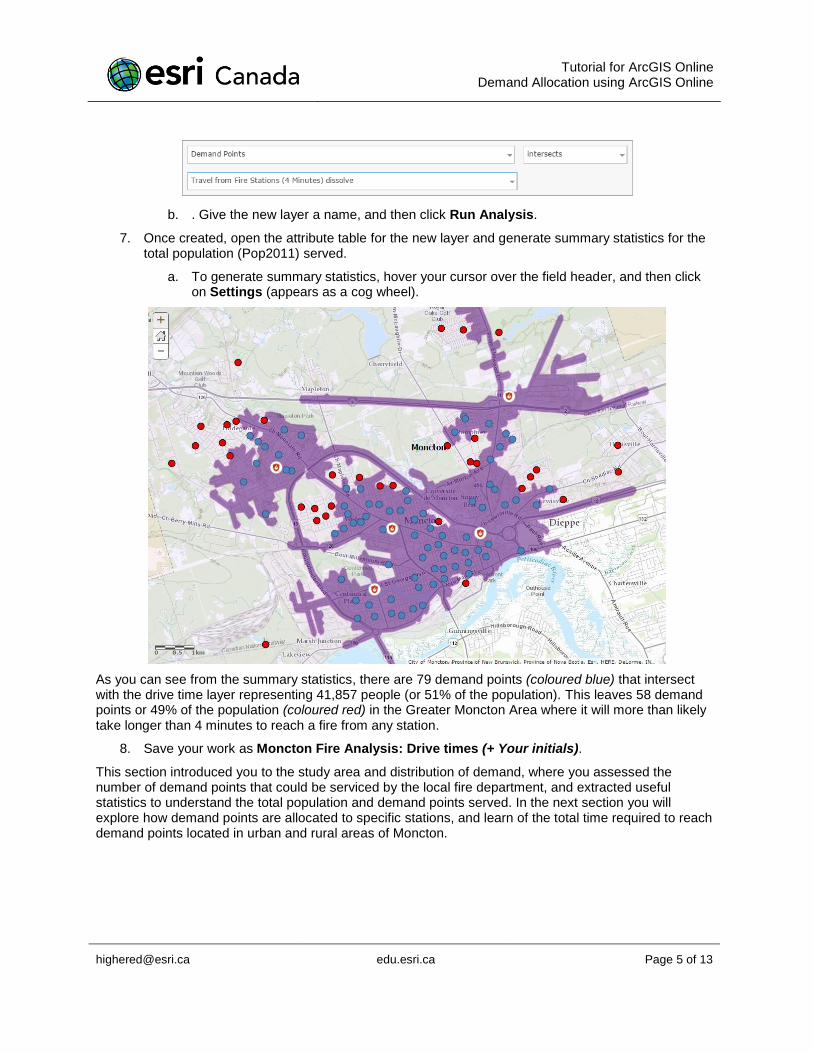
7. Once created, open the attribute table for the new layer and generate summary statistics for the total population (Pop2011) served.
a. To generate summary statistics, hover your cursor over the field header, and then click on Settings (appears as a cog wheel).
As you can see from the summary statistics, there are 79 demand points (coloured blue) that intersect with the drive time layer representing 41,857 people (or 51% of the population). This leaves 58 demand points or 49% of the population (coloured red) in the Greater Moncton Area where it will more than likely take longer than 4 minutes to reach a fire from any station.
8. Save your work as Moncton Fire Analysis: Drive times (+ Your initials).
This section introduced you to the study area and distribution of demand, where you assessed the number of demand points that could be serviced by the local fire department, and extracted useful statistics to understand the total population and demand points served. In the next section you will explore how demand points are allocated to specific stations, and learn of the total time required to reach demand points located in urban and rural areas of Moncton.
Tutorial for ArcGIS Online Demand Allocation using ArcGIS Online
[email protected] edu.esri.ca Page 6 of 13
Part B: Can demand be met with existing infrastructure?
The previous section introduced you to the data and study area and had you generate four-minute maximum drive-time areas to help provide a sense of the distribution of the population via aggregated demand points. In this section you will use the Choose Best Facilities tool to allocate demand points to their closest fire station and begin to understand the total travel time required to support fire emergency response in urban and rural areas of Moncton.
1. In the same Web map used above, turn off all layers but the Fire Stations and Municipal Boundaries.
2. Save a copy of this Web map. Give it the title Moncton Fire Analysis: Goal 1 (+ Your initials). Where Goal 1 refers to the Allocate demand to existing facilities goal you will use in this section of the tutorial.
3. From the Analysis tab, click on the Find Locations toolset, and then select the Choose Best facilities tool. In this section you will choose the Allocate to existing facilities goal as you want to model the allocation of demand points to those fire stations that currently exist.
a. Set Measure to Driving time and the Travel Direction from Facility to Demand.
b. Set the Demand locations layer to Demand Points.
c. Accept the predefined Constant (value = 1) as you will model the demand for fire response to be equal regardless of where demand is located. The option exists to use a field in your demand points layer to assign a weight. However, for this section, you will accept the constant value.
d. For Maximum travel range, choose Unlimited so that all demand points are allocated to existing fire stations in the model.
Note: Analysis tools used in the Map Viewer take the current map’s extent into consideration. For all demand points to be considered you must ensure that either you have zoomed-out to the full extent of the layer or un-check the box for ‘use current map extent’ prior to running your analysis.
e. Set the Required facility layer to Fire Stations.
i. In this scenario, give each fire station Unlimited capacity to respond. However, you do have this option to change this depending on the application.
f. Confirm the Result layer name, workspace, and confirm the number of service credits to be used in this analysis by clicking Show Credits (a total of 137 records will consume 13.7 credits when this tool runs). Had you run this analysis for all 31,000 addresses (demand points) in the City of Moncton, clearly and great deal more in the way of service credits would have been consumed.
Note: There are a total of 137 demand points that are read as inputs in this analysis. ArcGIS Online will consume 0.1 credit per demand point. More information on service credit consumption can be found here - http://www.esri.com/software/arcgis/arcgisonline/credits.
4. When all tool inputs are satisfied, click Run Analysis.
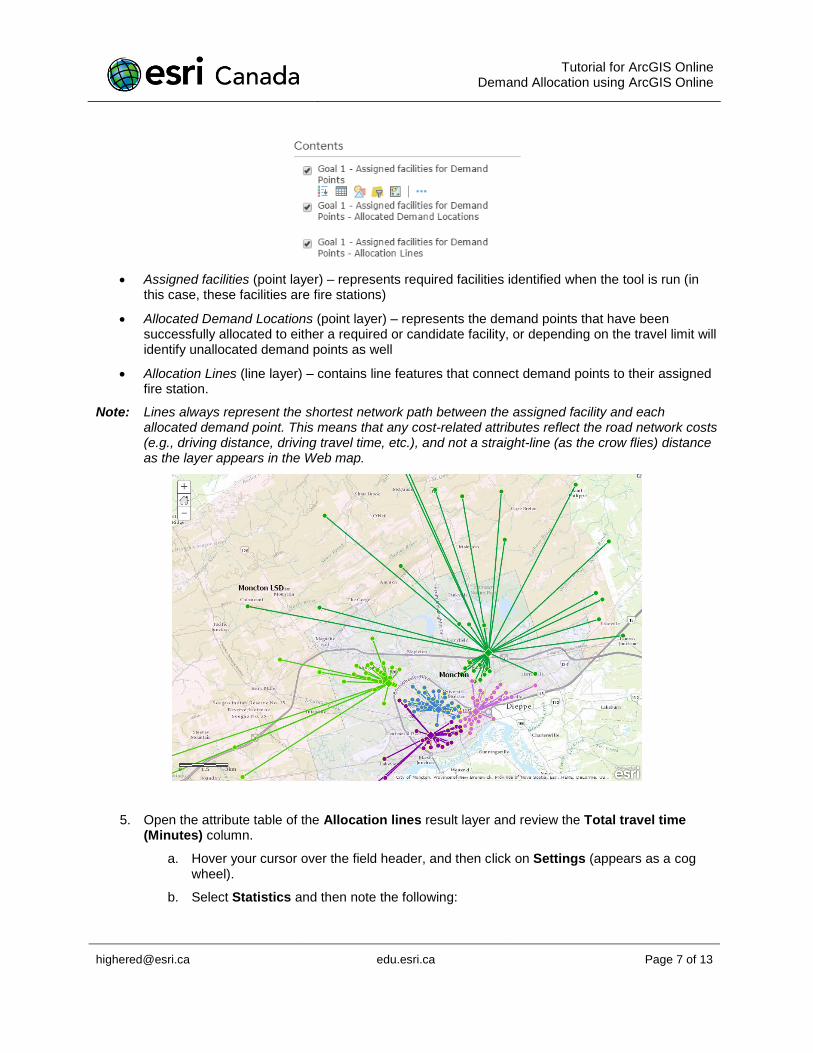
The Choose Best facilities tool produces three (3) layers each having matching symbology that groups allocated facilities and demand points together to make the results easier to understand. A sample result looks as follows:
Tutorial for ArcGIS Online Demand Allocation using ArcGIS Online
[email protected] edu.esri.ca Page 7 of 13
Assigned facilities (point layer) – represents required facilities identified when the tool is run (in this case, these facilities are fire stations)
Allocated Demand Locations (point layer) – represents the demand points that have been successfully allocated to either a required or candidate facility, or depending on the travel limit will identify unallocated demand points as well
Allocation Lines (line layer) – contains line features that connect demand points to their assigned fire station.
Note: Lines always represent the shortest network path between the assigned facility and each allocated demand point. This means that any cost-related attributes reflect the road network costs (e.g., driving distance, driving travel time, etc.), and not a straight-line (as the crow flies) distance as the layer appears in the Web map.
5. Open the attribute table of the Allocation lines result layer and review the Total travel time (Minutes) column.
a. Hover your cursor over the field header, and then click on Settings (appears as a cog wheel).
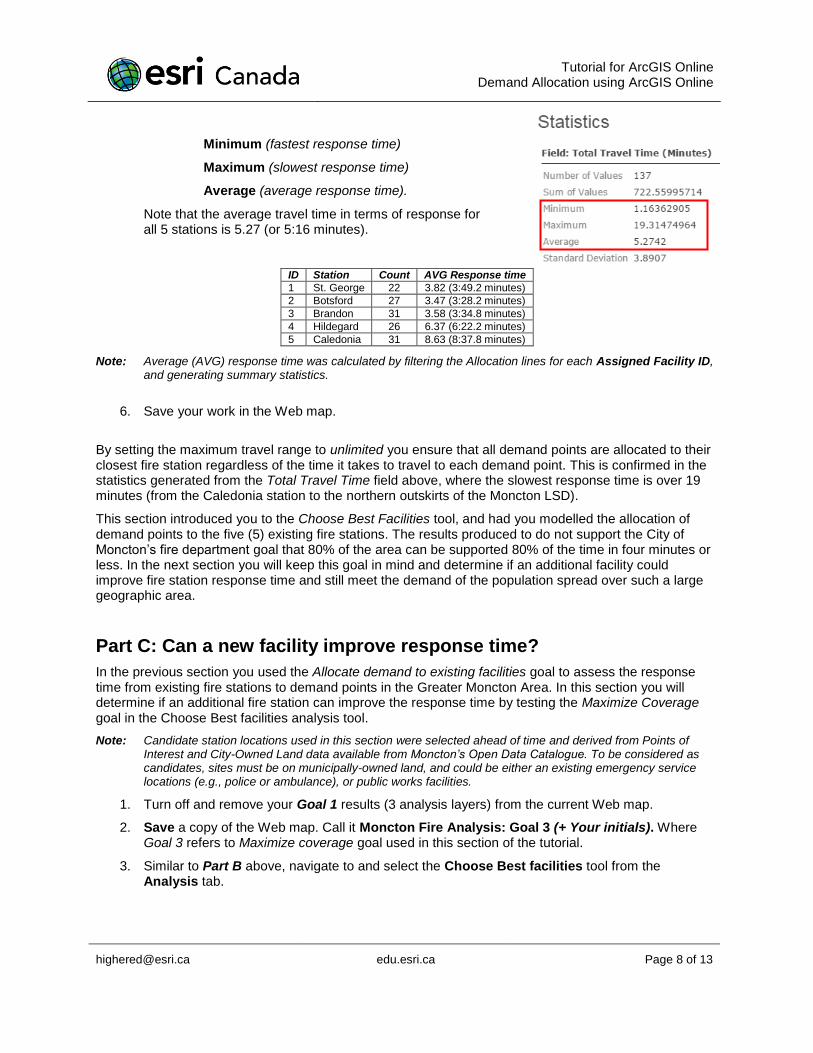
b. Select Statistics and then note the following:
Tutorial for ArcGIS Online Demand Allocation using ArcGIS Online
[email protected] edu.esri.ca Page 8 of 13
Minimum (fastest response time)
Maximum (slowest response time)
Average (average response time).
Note that the average travel time in terms of response for all 5 stations is 5.27 (or 5:16 minutes).
ID Station Count AVG Response time
1 St. George 22 3.82 (3:49.2 minutes)
2 Botsford 27 3.47 (3:28.2 minutes)
3 Brandon 31 3.58 (3:34.8 minutes)
4 Hildegard 26 6.37 (6:22.2 minutes)
5 Caledonia 31 8.63 (8:37.8 minutes)
Note: Average (AVG) response time was calculated by filtering the Allocation lines for each Assigned Facility ID, and generating summary statistics.
6. Save your work in the Web map.
By setting the maximum travel range to unlimited you ensure that all demand points are allocated to their closest fire station regardless of the time it takes to travel to each demand point. This is confirmed in the statistics generated from the Total Travel Time field above, where the slowest response time is over 19 minutes (from the Caledonia station to the northern outskirts of the Moncton LSD).
This section introduced you to the Choose Best Facilities tool, and had you modelled the allocation of demand points to the five (5) existing fire stations. The results produced to do not support the City of Moncton’s fire department goal that 80% of the area can be supported 80% of the time in four minutes or less. In the next section you will keep this goal in mind and determine if an additional facility could improve fire station response time and still meet the demand of the population spread over such a large geographic area.
Part C: Can a new facility improve response time?
In the previous section you used the Allocate demand to existing facilities goal to assess the response time from existing fire stations to demand points in the Greater Moncton Area. In this section you will determine if an additional fire station can improve the response time by testing the Maximize Coverage goal in the Choose Best facilities analysis tool.
Note: Candidate station locations used in this section were selected ahead of time and derived from Points of Interest and City-Owned Land data available from Moncton’s Open Data Catalogue. To be considered as candidates, sites must be on municipally-owned land, and could be either an existing emergency service locations (e.g., police or ambulance), or public works facilities.
1. Turn off and remove your Goal 1 results (3 analysis layers) from the current Web map.
2. Save a copy of the Web map. Call it Moncton Fire Analysis: Goal 3 (+ Your initials). Where Goal 3 refers to Maximize coverage goal used in this section of the tutorial.
3. Similar to Part B above, navigate to and select the Choose Best facilities tool from the Analysis tab.
Tutorial for ArcGIS Online Demand Allocation using ArcGIS Online
[email protected] edu.esri.ca Page 9 of 13
4. Select the Maximize Coverage goal as you want to find a candidate that improves response while continuing to meet the demand of current points supported by existing fire stations.
a. Set Measure to Driving time and confirm that the Travel Direction is set from Facility to Demand
b. Set the Demand locations layer to Demand Points
i. Click on the Field icon and select the Pop2011 variable to model how the demand for fire response changes depending on where you live in Moncton.
ii. For Maximum travel range, DO NOT select Constant or Field so that all demand points are allocated to their closest fire station.
c. Set the Required Facilities Layer to Fire Stations.
d. Set the Candidate Facilities Layer to Candidate Stations. Depending on your analysis goal, you need to specify the number of candidate facilities to choose from the input dataset. For Number of candidates to choose, set the value to one (1) to represent the most suitable candidate.
Note: Remember that for all demand points to be considered you must ensure that either you have zoomed-out to the full extent of the layer or un-check the box for ‘use current map extent’ prior to running your analysis. The same is also true for both the fire and candidate stations.
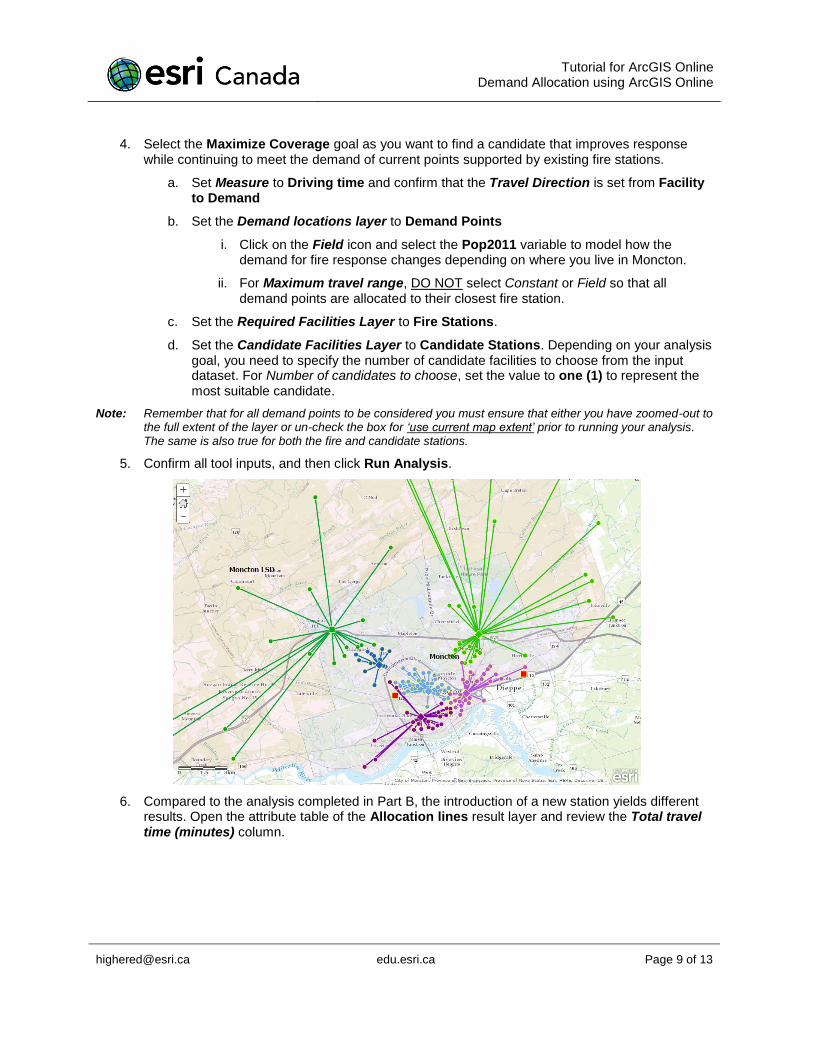
5. Confirm all tool inputs, and then click Run Analysis.
6. Compared to the analysis completed in Part B, the introduction of a new station yields different results. Open the attribute table of the Allocation lines result layer and review the Total travel time (minutes) column.
Tutorial for ArcGIS Online Demand Allocation using ArcGIS Online
[email protected] edu.esri.ca Page 10 of 13
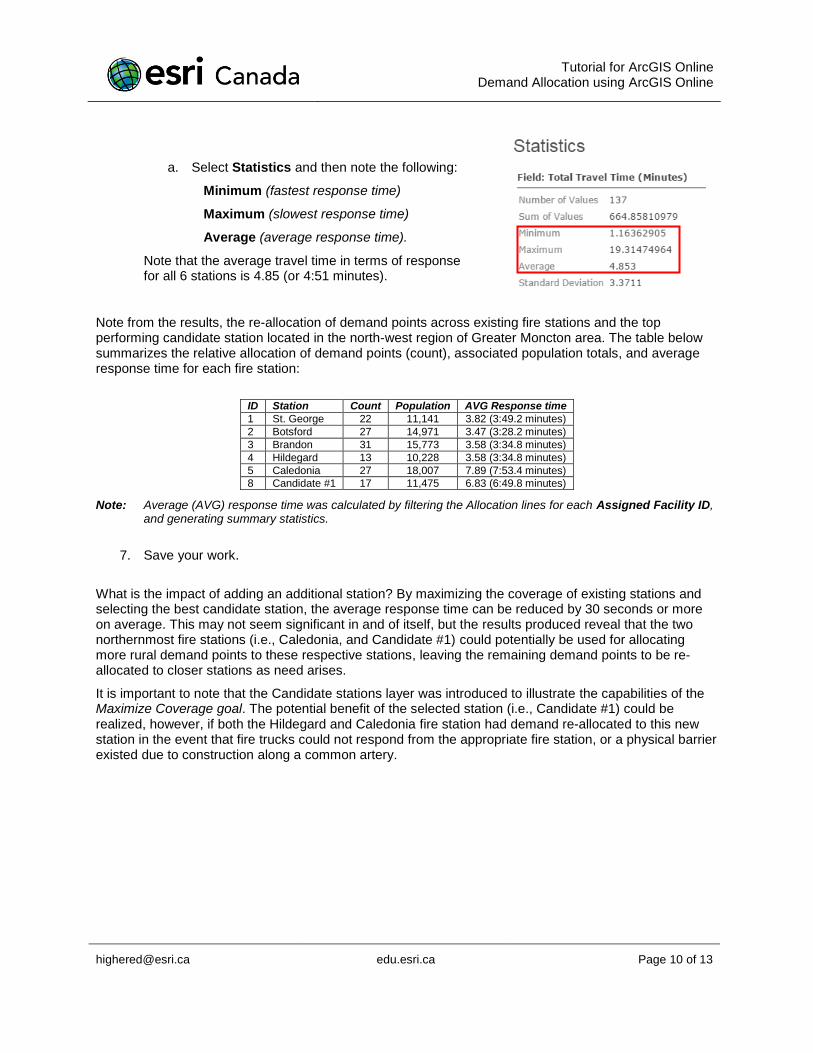
a. Select Statistics and then note the following:
Minimum (fastest response time)
Maximum (slowest response time)
Average (average response time).
Note that the average travel time in terms of response for all 6 stations is 4.85 (or 4:51 minutes).
Note from the results, the re-allocation of demand points across existing fire stations and the top performing candidate station located in the north-west region of Greater Moncton area. The table below summarizes the relative allocation of demand points (count), associated population totals, and average response time for each fire station:
ID Station Count Population AVG Response time
1 St. George 22 11,141 3.82 (3:49.2 minutes)
2 Botsford 27 14,971 3.47 (3:28.2 minutes)
3 Brandon 31 15,773 3.58 (3:34.8 minutes)
4 Hildegard 13 10,228 3.58 (3:34.8 minutes)
5 Caledonia 27 18,007 7.89 (7:53.4 minutes)
8 Candidate #1 17 11,475 6.83 (6:49.8 minutes)
Note: Average (AVG) response time was calculated by filtering the Allocation lines for each Assigned Facility ID, and generating summary statistics.
7. Save your work.
What is the impact of adding an additional station? By maximizing the coverage of existing stations and selecting the best candidate station, the average response time can be reduced by 30 seconds or more on average. This may not seem significant in and of itself, but the results produced reveal that the two northernmost fire stations (i.e., Caledonia, and Candidate #1) could potentially be used for allocating more rural demand points to these respective stations, leaving the remaining demand points to be re-allocated to closer stations as need arises.
It is important to note that the Candidate stations layer was introduced to illustrate the capabilities of the Maximize Coverage goal. The potential benefit of the selected station (i.e., Candidate #1) could be realized, however, if both the Hildegard and Caledonia fire station had demand re-allocated to this new station in the event that fire trucks could not respond from the appropriate fire station, or a physical barrier existed due to construction along a common artery.
Tutorial for ArcGIS Online Demand Allocation using ArcGIS Online
[email protected] edu.esri.ca Page 11 of 13
For example, if a 911 call was made and it was deemed that the Brandon fire station was closest, but no trucks were available from that station, then the next closest facility based on travel time would be allocated to respond. The steps that follow will model this scenario:
8. Prior to modelling this alternate scenario, you will create and apply two filters on the data provided.
Note: More information on using filters can be found at the following link - http://doc.arcgis.com/en/arcgis-online/use-maps/apply-filters.htm.
a. Specifically, filter the Fire Stations and Candidate Stations layers to show the following:
i. For the Fire Stations layer use a filter to show all stations but the Brandon station to simulate this station being unavailable.
ii. For the Candidate Stations layer filter to show only Candidate #1 from the analysis above.
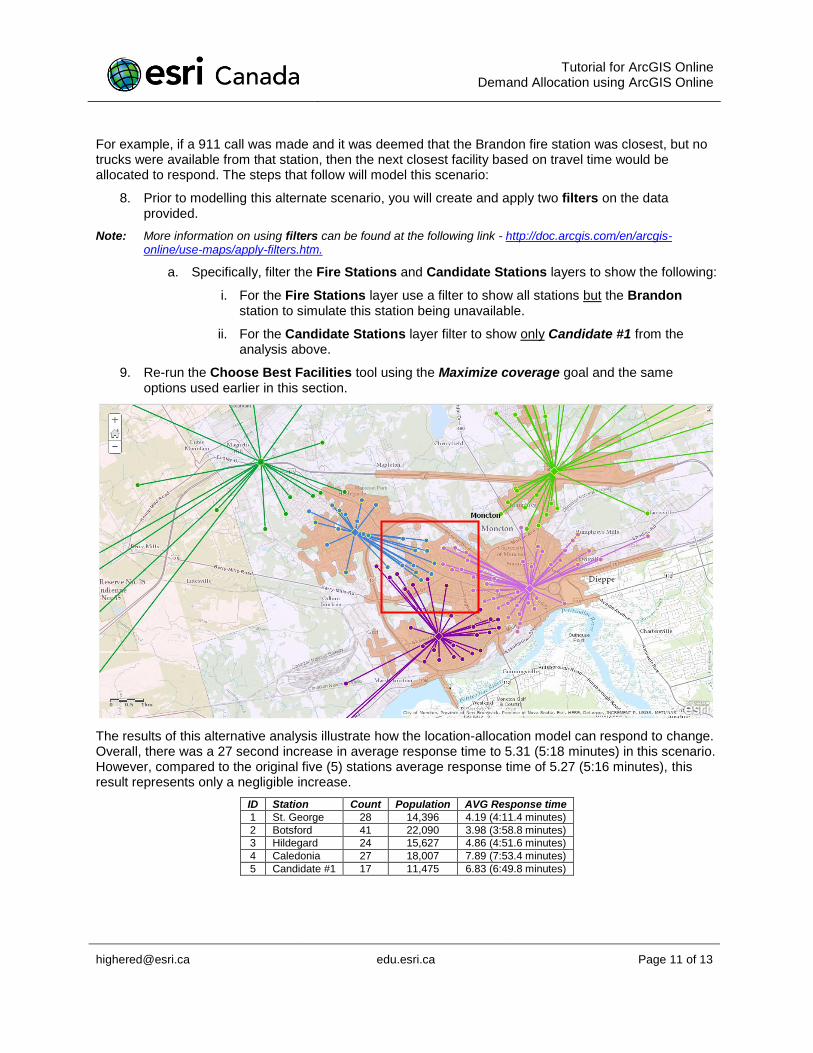
9. Re-run the Choose Best Facilities tool using the Maximize coverage goal and the same options used earlier in this section.
The results of this alternative analysis illustrate how the location-allocation model can respond to change. Overall, there was a 27 second increase in average response time to 5.31 (5:18 minutes) in this scenario. However, compared to the original five (5) stations average response time of 5.27 (5:16 minutes), this result represents only a negligible increase.
ID Station Count Population AVG Response time
1 St. George 28 14,396 4.19 (4:11.4 minutes)
2 Botsford 41 22,090 3.98 (3:58.8 minutes)
3 Hildegard 24 15,627 4.86 (4:51.6 minutes)
4 Caledonia 27 18,007 7.89 (7:53.4 minutes)
5 Candidate #1 17 11,475 6.83 (6:49.8 minutes)
Tutorial for ArcGIS Online Demand Allocation using ArcGIS Online
[email protected] edu.esri.ca Page 12 of 13
Note: Similar to the results produced above, average (AVG) response time was calculated by filtering the Allocation lines for each Assigned Facility ID, and generating summary statistics.
Moncton residents, just like the residents in any other city, need access to emergency services as quickly as possible. However, in reality it is not practical to distribute fire stations evenly across the region, especially if the population distribution and density is unevenly spatially distributed. Rather, the current distribution of fire stations today represents a suitable distribution of services to cover the dynamic distribution of demand for fire services.
The analysis completed in this section allowed to you determine if an additional fire station could improve the response time by testing the Maximize Coverage goal. The section that follows will show you how to share the results of your analysis in a configurable application template.
Part D: Share results
With the analysis portion of this tutorial complete, you can now share your results through one of ArcGIS Online’s configurable application templates. These templates can be customized to meet your needs and shared with your colleagues. To share your results produced in this tutorial you will create and configure a Story Map Web application using the Map Series configurable template. A tutorial on how to create and configure this type of Story Map is available through the following link - http://storymaps.arcgis.com/en/app-list/map-series/tutorial/.
What follows are the relevant inputs for adding your three (3) different Web maps (results) to your Map Series application.
1. Application type: Story Map Series
2. Title: Moncton Fire Analysis
3. Layout option: Tabbed
4. Web maps to include in application:
a. Moncton Fire Analysis: Drive Time (4-minute drive-time)
b. Moncton Fire Analysis: Goal 1 (Allocate to existing facilities)
c. Moncton Fire Analysis: Goal 3 (Maximize coverage)
Note: Configuring this application may prove to be an iterative process, but you can return to each tab within the Builder template to make any necessary changes.
The Web maps created in this tutorial provide content on each tab of the series. Hence, you have the opportunity to explain the type of analysis completed under each tab (i.e., the scenario you are have solved for, potential inputs, and a brief discussion of the results) by adding text to the Description section of each tab and optionally configuring the feature pop-ups from within the Web map itself.
The results produced in this tutorial are not confidential or sensitive in nature, but like any map, the content can be misinterpreted if careful attention is not paid to explaining properly the results and methods used in your analysis.
This tutorial introduced you to the location-allocation tools available in ArcGIS Online and had you use them in an applied workflow to determine if 80% of the Greater Moncton Area can be covered by 5 fire stations within 4 minutes or less 80% of the time. As discussed above, when testing to see if a sixth station could alleviate some of the stress felt by fire stations on the outskirts of Moncton, the results suggest that a sixth station could help relieve existing stations while not severely impacting the average
Tutorial for ArcGIS Online Demand Allocation using ArcGIS Online
[email protected] edu.esri.ca Page 13 of 13
response time for all stations relative to the 4-minute drive-time goal stated on the city of Moncton’s Web site.
Future Considerations
Now that you have gained some experience integrating the analysis tools covered in this tutorial into an applied workflow, here some additional links that may help you gain further insights into your data:
Esri Canada – Performing Analysis with ArcGIS Online: http://esri.ca/en/content/performing-analysis-arcgis-online
Esri Canada – Introduction to Web AppBuilder for ArcGIS: https://www.youtube.com/watch?v=hL-JzBRgdpU
© 2016 Esri Canada. All rights reserved. Trademarks provided under license from Environmental Systems Research Institute Inc. Other product and company names mentioned herein may be trademarks or registered trademarks of their respective owners. Errors and omissions excepted. This work is licensed under a Creative Commons Attribution-NonCommercial-ShareAlike 4.0 International License.