Embed Size (px)
Citation preview
Demand and Supply Issues in
Indigenous Tourism:
A Gap Analysis
FINAL REPORT
Mapping Australia’s International and Domestic Visitor Markets against Indigenous
Tourism Operators
Prepared by:
Dr Lisa Ruhanen, The University of Queensland
Dr Michelle Whitford & Dr Char-lee McLennan, Griffith University
Prepared for:
Indigenous Business Australia &
Department of Resources, Energy and Tourism, Indigenous Tourism Working Group
January 2013
2
Executive Summary
Indigenous tourism is an integral part of Australia’s tourism product offering; Indigenous tourism is one
of the key experiences which underpin Tourism Australia’s global marketing activities. Yet participation
in Indigenous tourism experiences by both international and domestic markets has been declining since
2006 (Tourism Research Australia 2011). Despite conflicting reports pertaining to the success (or
otherwise) of Indigenous tourism in Australia, certainly the demand and interest for Indigenous tourism
reported in earlier demand studies has not transpired into visitor flows for many Indigenous tourism
businesses. Therefore, the aim of this research was to undertake a gap analysis of the demand for, and
supply of, Indigenous tourism in Australia through the following specific research objectives:
Stage One: Map the International and Domestic Visitor Markets against Indigenous Tourism Operators
1. Investigate the expectations, experiences and motivations, of both international and domestic
tourists regarding Indigenous tourism products and services in Australia.
2. Investigate the expectations, experiences and motivations of Indigenous tourism operators
regarding the provision of activities and experiences to the visitor market.
3. Undertake a gap analysis of the expectations, experiences and motivations of international and
domestic tourists and Indigenous tourism operators to analyse and map identified gaps and
associated emergent issues.
Multiple data collection methods were used to address the research objectives of Stage One of the
research and included:
1. A survey with 1357 international and domestic tourists conducted at four locations in Australia.
2. In-depth, semi-structured interviews with 34 Indigenous tourism operators from 10 locations in
Australia.
A second stream of research was also undertaken and focused specifically on the Chinese inbound
visitor market and their demand for Indigenous tourism in Australia. This is the first empirical research
that has been undertaken to explore Chinese awareness, preferences and demand for Indigenous
tourism. The research objectives of this stage of the research were to:
Stage Two: Chinese Inbound Market Study
1. Investigate the expectations, experiences and motivations of independent Chinese tourists
regarding Indigenous tourism products and services in Australia.
3
2. Explore the relative demand for Indigenous tourism products and experiences of Chinese tour
group participants in Australia.
3. Investigate the perceptions, expectations and decision making processes of Chinese inbound
tour operators and Chinese market expert informants regarding Australian Indigenous tourism
products and services.
4. Undertake a gap analysis of the expectations, experiences and motivations of Chinese tourists,
tour operators, expert informants and Indigenous tourism operators to explore and then map
and critically analyse identified gaps and associated emergent issues.
Again, a mixed method approach was used consisting of surveys with:
1. 115 independent Chinese tourists (conducted as part of Stage One).
2. 275 Chinese tourists travelling with tour groups.
3. 51 Chinese tour operators (Approved Destination Status [ADS] inbound and other tour
operators servicing the Chinese market in Australia).
4. 18 expert informants for the Chinese inbound market.
Key Findings Stage One:
Indigenous tourism operators overestimate international visitor demand for Indigenous
experiences. Operators believe international tourists see Indigenous experiences as second
only to Sydney attractions, yet less than 5% of international tourists cite Indigenous
experiences as an activity they want to experience while in Australia. Operators also
overestimate the draw of remote locations such as Uluru and Kakadu when the vast majority of
international visitors do not leave the eastern seaboard.
Mapping awareness, preference and intention on the Attrition Curve shows that despite claims
about international visitor interest, the respondents to the visitor survey in this study have low
spontaneous/top-of-mind awareness of Indigenous tourism experiences (less than 25% for
domestic respondents and less than 20% for international respondents). Preferences for
Indigenous tourism experiences decline to 12% and intention/visit to 2%. In this study,
awareness and preferences of international visitors are on par with that of domestic tourists.
It has previously been identified that domestic visitors have little interest in Indigenous tourism;
this was confirmed when mapping domestic awareness, preferences and intention on the
Attrition Curve. There is low awareness amongst the domestic market that Indigenous tourism
experiences are available in Australia. The issue of lack of awareness/product promotion
issues arose throughout the study from both visitors and Indigenous tourism operators.
4
Barriers to participating in Indigenous tourism were measured on five point scales and most
visitor respondents, both international and domestic, rate these around the mid-point. However,
given the low awareness, preference and intention scores, this suggests that respondents
many not be comfortable disclosing their responses to this question, thus skewing the barriers.
Many Indigenous tourism operator respondents believe ‘racism/negative preconceptions’ and
‘negative media attention’ about Indigenous peoples are barriers to domestic visitor
participation in Indigenous tourism. For the international market, operators see the main barrier
as ‘activity is too expensive/limited budget’.
The Indigenous activity and experience scenarios, which were designed to delve more deeply
into interest and motivations, generally rate on the mid-point of the appeal scale with little
differentiation between the options. This suggests that consumers see the product offerings as
reasonably homogenous.
Further, where appeal rates around the neutral point, for those respondents that indicate a level
of interest in the scenario, approximately half do not plan to participate/or do not know if they
will participate. A lack of time, involvement in other activities, and expensive/budget are
repeatedly cited across the scenarios as reasons for not participating in Indigenous tourism.
Willingness to pay (another indicator of demand), in each of the scenarios is relatively low.
Respondents are generally unwilling to pay much for these experiences generally citing ‘free’ or
a willingness to pay up to $100 for the experiences, even for some of the more involved options
such as full day tours and accommodation.
Key Findings Stage Two:
A number of Indigenous tourism operators recognise the importance of the Chinese market and
the opportunities it can provide, yet many operators voice a lack of interest in pursuing this
market both now and in the near future. Indigenous tourism operators perceived Chinese
visitors to Australia to be generally seeking a shallow or ‘stereotypical’ experience. However,
Indigenous tourism operators overestimate Chinese visitor demand for Indigenous tourism
products and experiences. Indigenous tourism operators place ‘visiting the red centre/ outback’
and ‘Indigenous tourism’ as the two top attractions Chinese visitors want to experience in
Australia.
When mapping Chinese inbound visitor awareness, preferences and intention on the Attrition
Curve there is low awareness amongst the Chinese inbound market that Indigenous tourism
experiences are available in Australia. Only 6% of Chinese visitors cite Indigenous tourism as a
5
top of mind activity to undertake Australia compared to over 75% of Chinese visitors who are
aware they can undertake ‘outdoor /nature’ experiences.
The main barriers Chinese visitors cite to participating in Indigenous tourism are a lack of
information/advertising/promotion, safety and comfort concerns, and language barriers.
Inbound tour operators identify barriers and challenges associated with providing Indigenous
products and experiences on Chinese tours in Australia including language, cultural barriers,
product availability/awareness and standard, timing, pricing, interest, logistics, location and
access.
While acknowledging the market have little prior knowledge of the Indigenous tourism
experiences available in Australia, the majority of inbound Chinese tour operators and Chinese
expert informants (50% of tour operators and 50% of expert informants) believe experiencing
Indigenous art and craft to be very important to Chinese visitors while 59.5% of tour operators
and 79% of expert informants believe visiting an Aboriginal site or community is important to
Chinese visitors. Yet the most important activities cited by Chinese visitors in Australia include
‘sightseeing/looking around’, ‘visiting the Great Barrier Reef’ and ‘going to the beach’.
Indigenous experiences are significantly lower down the importance scale.
Chinese visitors display an increase in intention to participate when prompted about specific
Indigenous tourist scenarios. The most cited motivation for undertaking at least one of the
Indigenous scenario experiences is an interest in Aboriginal history, culture and traditions
(54%). Importantly however, the most cited barrier to undertaking the scenarios is a lack of
interest in the scenarios presented (65%).
Experiences/products that tour operators and expert informants suggested an Indigenous
tourism business could and/or should provide if they wanted to be included in a Chinese tour
company’s itinerary included: Aboriginal cultural show; bush tucker/story telling; guided
nature/environment tours with Indigenous guide (maximum one hour); cultural centres (where
visitors could get a lot of information/experience in a short space of time); and, art/craft, rock
paintings, carvings (opportunity to try painting). Further suggestions included: located in close
proximity to major cities/urban areas; brochure and interpretation provided in Chinese;
souvenir and shopping opportunities.
Recommendations include:
Explore the knowledge needs of Indigenous tourism operators, as well as the uptake and
usage of tourism market data. Develop appropriate communication channels to meet
6
knowledge needs and assist operators in identifying, interpreting and collecting relevant data
sources.
Embed export ready Indigenous tourism products in international and national distribution
channels. Integrate micro, small and start-up businesses into local tourism distribution channels
to increase product awareness.
Develop awareness/marketing programs targeted at the domestic market that highlight the
range of Indigenous offerings available in Australia. However, it will also be necessary to
develop strategies to overcome the low levels of interest and participation in Indigenous
tourism.
Develop a targeted marketing and educational campaign to demonstrate to the broader
community, the scope and breadth of Indigenous tourism operations in Australia
Support Indigenous tourism operators in developing products and experiences that are
reflective of contemporary Indigenous culture while balancing visitor demand and expectations.
Undertake realistic assessments of product gaps vis-à-vis tourist flows and demand patterns
thus moving away from supply led, ‘build it and they will come’, approaches to demand driven
product development
Focus on development in urban centres and surrounds to capitalise on existing visitor traffic.
Develop marketing campaigns to increase awareness of Australia’s Indigenous tourism
products; this should be targeted at both visitors and tour operators given the prevalence of
group tours in this market.
Examine an apparent lack of interest from some Indigenous tourism operators to pursue and
engage with the Chinese inbound market.
7
Table of Contents
EXECUTIVE SUMMARY ........................................................................................................................................ 2
TABLE OF CONTENTS ......................................................................................................................................... 7
LIST OF TABLES ................................................................................................................................................. 11
LIST OF FIGURES ............................................................................................................................................... 13
LIST OF APPENDICES ........................................................................................................................................ 15
ACKNOWLEDGEMENTS ..................................................................................................................................... 16
CHAPTER ONE: INTRODUCTION ...................................................................................................................... 17
1.1 BACKGROUND .................................................................................................................................................. 17
1.2 REVIEW OF PREVIOUS RESEARCH ..................................................................................................................... 18
1.2.1 INDIGENOUS TOURISM: DOMESTIC AND INTERNATIONAL VISITOR STATISTICS ................................................... 18
1.2.2 INDIGENOUS TOURISM: RESEARCH FOCUS ON SUPPLY AND DEMAND ............................................................... 20
1.2.3 INDIGENOUS TOURISM: DEMAND ..................................................................................................................... 20
1.2.4 INDIGENOUS TOURISM: SUPPLY ...................................................................................................................... 21
1.2.5 THE CHINESE INBOUND MARKET ..................................................................................................................... 22
CHAPTER TWO: RESEARCH METHODS .......................................................................................................... 25
2.1 PURPOSE OF THE STUDY ................................................................................................................................... 25
2.2 RESEARCH METHODS ....................................................................................................................................... 26
2.3 STAGE ONE: MAP THE INTERNATIONAL AND DOMESTIC VISITOR MARKET AGAINST INDIGENOUS TOURISM
OPERATORS ........................................................................................................................................................... 27
2.3.1 INTERNATIONAL AND DOMESTIC VISITOR SURVEY ............................................................................................ 27
2.3.2 INDIGENOUS TOURISM OPERATOR INTERVIEWS ............................................................................................... 29
2.3.3 A SNAPSHOT OF THE INDIGENOUS TOURISM OPERATOR SAMPLE ..................................................................... 30
2.3.4 INTERVIEW METHODS ..................................................................................................................................... 33
2.4 STAGE TWO: CHINESE INBOUND MARKET STUDY .............................................................................................. 34
2.4.1 INDEPENDENT CHINESE TOURIST SURVEY ...................................................................................................... 34
8
2.4.2. CHINESE TOUR GROUP SURVEY .................................................................................................................... 34
2.4.3 CHINESE TOUR OPERATOR AND EXPERT INFORMANT SURVEY ......................................................................... 35
2.5 ETHICAL CONSIDERATIONS ............................................................................................................................... 36
2.6 RESEARCH LIMITATIONS ................................................................................................................................... 37
CHAPTER THREE: RESULTS – VISITOR SURVEY ........................................................................................... 39
3.1 DEMOGRAPHICS AND TRIP PROFILE .................................................................................................................. 39
3.2 PRODUCT AWARENESS AND PREFERENCES ....................................................................................................... 41
3.2.1 AWARENESS OF AUSTRALIAN ACTIVITIES AND EXPERIENCES ............................................................................ 41
3.2.2 PREFERENCES, INTENTION AND VISIT .............................................................................................................. 42
3.2.3 RESPONDENTS NOT PARTICIPATING IN AN INDIGENOUS EXPERIENCE ................................................................ 48
3.3 INDIGENOUS TOURISM ACTIVITY AND EXPERIENCE SCENARIOS .......................................................................... 53
3.3.1 SCENARIO 1: WALKING TOUR WITH AN ABORIGINAL GUIDE .............................................................................. 55
3.3.2 SCENARIO 2: STAY OVERNIGHT IN A REMOTE ABORIGINAL COMMUNITY/ON ABORIGINAL LAND .......................... 56
3.3.3 SCENARIO 3: ABORIGINAL CULTURAL SHOW OR PERFORMANCE ...................................................................... 57
3.3.4 SCENARIO 4: LUXURY OVERNIGHT STAY ON ABORIGINAL LAND ........................................................................ 58
3.3.5 SCENARIO 5: ABORIGINAL MUSEUM DISPLAY .................................................................................................. 59
3.3.6 SCENARIO 6: DAY TOUR WITH ABORIGINAL GUIDE ........................................................................................... 60
3.3.7 SCENARIO 7: ADVENTURE ACTIVITY WITH AN ABORIGINAL GUIDE ..................................................................... 61
3.3.8 SCENARIO 8: VISIT ABORIGINAL ROCK PAINTINGS OR CARVINGS ..................................................................... 62
3.4 OPEN ENDED SURVEY RESPONSES ................................................................................................................... 64
3.5 PUTTING THE RESULTS INTO CONTEXT: EXTRAPOLATING THE SAMPLE TO THE POPULATION............................... 65
3.5.1 AWARENESS, PREFERENCE AND INTENTION .................................................................................................... 66
3.5.2 INDIGENOUS TOURISM SCENARIOS ................................................................................................................. 66
CHAPTER FOUR: RESULTS – INDIGENOUS TOURISM OPERATOR INTERVIEWS ...................................... 69
4.1 CONTEXT .......................................................................................................................................................... 69
4.2 INDIGENOUS TOURISM OPERATOR PERCEPTIONS OF VISITOR DEMAND ............................................................... 70
4.3 INDIGENOUS TOURISM OPERATOR PERCEPTIONS OF VISITOR MOTIVATIONS ....................................................... 72
4.4 INDIGENOUS TOURISM OPERATOR PERCEPTIONS OF VISITOR EXPECTATIONS AND SATISFACTION ....................... 73
4.5 PERCEIVED BARRIERS TO TOURIST DEMAND FOR, AND PARTICIPATION IN, INDIGENOUS TOURISM ....................... 75
4.6 AUTHENTICITY IN INDIGENOUS TOURISM EXPERIENCES ...................................................................................... 76
9
CHAPTER FIVE: DISCUSSION – STAGE ONE .................................................................................................. 80
5.1 AUSTRALIAN TOURISM EXPERIENCES: MAPPING DEMAND.................................................................................. 81
5.2 ATTRITION CURVE: MAPPING AWARENESS, PREFERENCE AND VISITATION ......................................................... 84
5.3 PARTICIPATION IN INDIGENOUS TOURISM: MAPPING THE BARRIERS ................................................................... 88
5.4 INDIGENOUS TOURISM SCENARIOS: MOTIVATIONS, APPEAL AND WILLINGNESS TO PAY ...................................... 91
5.5 AUTHENTICITY AND INDIGENOUS TOURISM ......................................................................................................... 94
CHAPTER SIX: RESULTS – CHINESE VISITOR SURVEYS .............................................................................. 98
6.1 DEMOGRAPHICS AND TRIP PROFILE: ................................................................................................................. 98
6.2 PRODUCT AWARENESS AND PREFERENCES ....................................................................................................... 98
6.2.1 AWARENESS OF AUSTRALIAN ACTIVITIES AND EXPERIENCES ............................................................................ 98
6.2.2 PREFERENCES, INTENTION AND VISIT .............................................................................................................. 99
6.2.3 RESPONDENTS NOT PARTICIPATING IN AN INDIGENOUS EXPERIENCE .............................................................. 102
6.3 INDIGENOUS TOURISM ACTIVITY AND EXPERIENCE SCENARIOS ........................................................................ 104
6.3.1 SCENARIO 1: WALKING TOUR WITH AN ABORIGINAL GUIDE ............................................................................ 105
6.3.2 SCENARIO 2: BUDGET STAY IN A REMOTE ABORIGINAL COMMUNITY .............................................................. 105
6.3.3 SCENARIO 3: ABORIGINAL CULTURAL SHOW OR PERFORMANCE .................................................................... 106
6.3.4 SCENARIO 4: LUXURY OVERNIGHT STAY ON ABORIGINAL LAND ...................................................................... 106
6.3.5 SCENARIO 5: ABORIGINAL MUSEUM DISPLAY ................................................................................................ 107
6.3.6 SCENARIO 6: DAY TOUR WITH ABORIGINAL GUIDE ......................................................................................... 107
6.3.7 SCENARIO 7: ADVENTURE ACTIVITY WITH AN ABORIGINAL GUIDE ................................................................... 108
6.3.8 SCENARIO 8: VISIT ABORIGINAL ROCK PAINTINGS OR CARVINGS ................................................................... 108
6.4 OPEN ENDED RESPONSES – CHINESE VISITOR SURVEY RESPONDENTS ........................................................... 109
CHAPTER SEVEN: RESULTS – CHINESE INBOUND TOUR OPERATORS, CHINESE EXPERT
INFORMANTS AND INDIGENOUS TOURISM OPERATOR INTERVIEWS ...................................................... 110
7.1 CHINESE INBOUND TOUR OPERATORS AND CHINESE EXPERT INFORMANT RESULTS ......................................... 110
7.1.1 AWARENESS OF AUSTRALIAN ACTIVITIES AND EXPERIENCES .......................................................................... 110
7.1.2 PREFERENCES AND INTENTIONS ................................................................................................................... 111
7.1.3 INDIGENOUS TOURISM ACTIVITY AND EXPERIENCE SCENARIOS ...................................................................... 113
7.1.4 PRODUCT DEVELOPMENT OPPORTUNITIES AND BARRIERS ............................................................................ 114
7.2 INDIGENOUS TOURISM OPERATORS AND THE CHINESE MARKET ....................................................................... 115
7.2.1 IMPORTANCE OF THE CHINESE MARKET ......................................................................................................... 115
7.2.3 STRATEGIES FOR THE CHINESE MARKET ....................................................................................................... 117
10
CHAPTER EIGHT: DISCUSSION – STAGE TWO ............................................................................................. 118
8.1 AUSTRALIAN TOURISM EXPERIENCES: MAPPING CHINESE DEMAND ................................................................. 118
8.2 ATTRITION CURVE: MAPPING AWARENESS, PREFERENCE AND VISITATION ....................................................... 122
8.3 PARTICIPATION IN INDIGENOUS TOURISM: MAPPING THE BARRIERS ................................................................. 124
8 .4 INDIGENOUS TOURISM SCENARIOS: MOTIVATIONS, APPEAL AND BARRIERS .................................................... 124
CHAPTER NINE: CONCLUSIONS AND RECOMMENDATIONS – STAGE ONE AND TWO .......................... 127
9.1 UNDERSTANDING THE MARKET ....................................................................................................................... 127
9.2 AWARENESS OF INDIGENOUS TOURISM............................................................................................................ 128
9.3 BARRIERS ...................................................................................................................................................... 129
9.4 AUTHENTICITY ................................................................................................................................................ 130
9.5 INDIGENOUS TOURISM SCENARIOS .................................................................................................................. 130
9.6 CHINESE INBOUND MARKET ............................................................................................................................ 131
9.7 CLOSING REMARKS ........................................................................................................................................ 132
REFERENCES ................................................................................................................................................... 133
11
List of Tables
Table 2.1. Visitor Survey: Sample and Response Rates ...................................................................................... 28
Table 2.2. Indigenous Tourism Operator Interviews ............................................................................................. 30
Table 2.3. Indigenous Tourism Operator Business Profile .................................................................................... 31
Table 2.4. Indigenous Tourism Operator Respondent Characteristics ................................................................. 32
Table 3.1. Age Groups – All Respondents ............................................................................................................ 39
Table 3.2. State of Residence - Domestic Overnight and Daytrip Visitors ............................................................ 40
Table 3.3. Purpose of Visit - Domestic Overnight and Daytrip Visitors ................................................................. 40
Table 3.4. Purpose of Visit - International Visitors ................................................................................................ 40
Table 3.5. Country of Residence – International Visitors ...................................................................................... 41
Table 3.6. Awareness of Australian Activities and Experiences (unprompted) ..................................................... 42
Table 3.7. Top Experiences - Domestic and International Visitors (unprompted) ................................................. 43
Table 3.8. Perceived Importance (preference) and Intentions to Participate in Activities and Experiences
(prompted) ............................................................................................................................................................ 45
Table 3.9. Factor Analysis Results of Prompted Activities and Experiences that can be Undertaken in Australia 47
Table 3.10. Regression of the demographic variables by the five experience factors (prompted) ........................ 47
Table 3.11. Intention to Participate in an Indigenous Experience ......................................................................... 49
Table 3.12. Previously Participated in an Indigenous Experience ........................................................................ 49
Table 3.13. Timeframe to undertake an Indigenous experience ........................................................................... 49
Table 3.14. Barriers to Participating in Indigenous Tourism .................................................................................. 50
Table 3.15. Barriers to Participating in Indigenous Tourism – Domestic and International ................................... 51
Table 3.16. Factor Analysis Results of Barriers to Participating in an Indigenous Experience ............................. 52
Table 3.17. Regression of the Demographic Variables by the Three Barrier Factors ........................................... 52
Table 3.18. Appeal of Indigenous Tourism Experience and Activity Scenarios .................................................... 54
Table 3.19. Appeal of Indigenous Experience Scenarios by International and Domestic Tourists - Group Statistics
.............................................................................................................................................................................. 55
Table 3.20. Open Ended Survey Responses – Domestic Visitors ........................................................................ 64
Table 3.21. Open Ended Survey Responses – International Visitors ................................................................... 65
Table 3.22. Awareness, Preference and Intention/Visit Extrapolation – Weighted Estimates ............................... 66
Table 3.23. Key International Visitor and Expenditure Statistics by Scenario Experience – Weighted Estimates68
Table 5.1. Overall Appeal of Indigenous Tourism Experience and Activity Scenarios .......................................... 92
Table 6.1. Awareness of Australian Activities and Experiences ............................................................................ 99
Table 6.2. Top Experiences – Chinese Visitor Survey and All International Visitor Survey Respondents .......... 100
Table 6.3. Perceived Importance (preference) and Intentions to Participate in Activities and Experiences ........ 102
Table 6.4. Intention to Participate in an Indigenous Experience ......................................................................... 102
Table 6.5. Previously Participated in an Indigenous Experience ........................................................................ 103
12
Table 6.6 Barriers to Participating in Indigenous Tourism for Chinese Visitors ................................................... 104
Table 6.7. Appeal of Indigenous Tourism Experience and Activity Scenarios – Chinese Tour Group Respondents
............................................................................................................................................................................ 105
Table 6.8. Open Ended Survey Responses – Chinese Visitors .......................................................................... 109
Table 7.1. Chinese Tour Group Itineraries –Included Activities .......................................................................... 111
Table 7.2. Perceived Top Experiences for Inbound Chinese Visitors to Australia .............................................. 112
Table 7.3. Challenges Associated with Indigenous Activities/Experiences ......................................................... 115
Table 8.1 Appeal of Indigenous Tourism Activity Experience Scenarios: Chinese Visitors ................................ 125
13
List of Figures
Figure 3.1. Walking Tour with an Aboriginal Guide – Appeal – Domestic and International ................................. 56
Figure 3.2 Stay Overnight in a Remote Community – Appeal – Domestic and International ................................ 57
Figure 3.3 Aboriginal Cultural Show or Performance – Appeal – Domestic and International .............................. 58
Figure 3.4 Luxury Overnight Accommodation – Appeal – Domestic and International ......................................... 59
Figure 3.5. Aboriginal Museum Display – Appeal – Domestic and International ................................................... 60
Figure 3.6 Day Tour with Aboriginal guide – Appeal – Domestic and International .............................................. 61
Figure 3.7 Adventure Activity with Aboriginal Guide – Appeal – Domestic and International ................................ 62
Figure 3.8 Visit Aboriginal Rock Paintings – Appeal – Domestic and International ............................................... 63
Figure 4.1. Inherent Challenges with the Tourism Industry ................................................................................... 70
Figure 4.2. Perceived Demand for Australian Activities and Experiences ............................................................ 71
Figure 4.3. Perceived Domestic Demand for Australian Activities and Experiences ............................................. 71
Figure 4.4. Perceived Motivations of International Tourists .................................................................................. 72
Figure 4.5.Perceived Motivations of Domestic Tourists ........................................................................................ 73
Figure 4.6. Perceived Expectations of International Tourists ................................................................................ 73
Figure 4.7. Perceived Expectations of Domestic Tourists ..................................................................................... 74
Figure 4.8. Perceived Barriers for International Tourist Participation in Indigenous Tourism ................................ 75
Figure 4.9. Perceived Barriers for Domestic Tourist Participation in Indigenous Tourism .................................... 76
Figure 4.10. Perceptions of Authenticity in an Indigenous Tourism Experience ................................................... 77
Figure 4.11. Perceived differences Between Operators and Tourists Regarding Authenticity .............................. 78
Figure 5.1. Perceived ‘Top’ Attractions in Australia: International Visitors and Operators .................................... 82
Figure 5.2. Perceived ‘Top’ Attractions in Australia: International Visitors and Operators .................................... 82
Figure 5.3. Perceived ‘Top’ Attractions in Australia: Domestic Visitors and Operators ......................................... 83
Figure 5.4. Perceived ‘Top’ Attractions in Australia: Domestic Visitors and Operators ......................................... 83
Figure 5.5. Attrition Curve ..................................................................................................................................... 84
Figure 5.6. Attrition Curve: Respondents’ Propensity to Undertake Key Australian Experiences ......................... 86
Figure 5.7. Attrition Curve: Aboriginal Cultural Experiences ................................................................................. 87
Figure 5.8. Barriers to International Tourists Participation in Indigenous Tourism: Visitors and Operators .......... 89
Figure 5.9. Barriers to Domestic Tourists Participation in Indigenous Tourism: Visitors and Operators ............... 90
Figure 5.10. Appeal, Intention and Visit by Indigenous Experience ...................................................................... 92
Figure 5.11. Motivations to Participate in Indigenous Tourism: Aggregated Scenario Responses ....................... 93
Figure 5.12. Barriers to Tourists Participation in Indigenous Tourism: Aggregated Scenario Responses ............ 93
Figure 7.1. Perceived Importance of Australian Experiences for Inbound Chinese Visitors ............................... 113
Figure 7.2. Chinese Tour Operators: Perceived Appeal of Indigenous Tourism Experiences ........................... 113
Figure 7.3. Chinese Expert Informants: Perceived Appeal of Indigenous Tourism Experiences ....................... 114
Figure 7.4. Perceptions of Chinese Visitor Activity/Experience Demands .......................................................... 116
14
Figure 8.1. Perceived ‘Top’ Attractions in Australia: Chinese Visitors, Operators/Informants and Indigenous
Tourism Operators .............................................................................................................................................. 120
Figure 8 2. Perceived ‘Top’ Attractions in Australia: Chinese Visitors and Indigenous Operators ...................... 121
Figure 8.3 Perceived ‘Top’ Attractions in Australia: Chinese Visitors, Tour Operators/Expert Informants .......... 122
Figure 8.4. Attrition Curve: Chinese Respondents’ Propensity to Undertake Key Australian Experiences ......... 123
Figure 8.5. Attrition Curve: Aboriginal Cultural Experiences – Chinese Visitor Survey Respondents ................. 123
Figure 8.6. Chinese Respondents: Barriers to Participation in Indigenous Tourism ........................................... 124
Figure 8.7. Motivations to Participate in Indigenous Tourism: Aggregated Scenario Responses for Chinese
Visitors ................................................................................................................................................................ 126
Figure 8.8. Barriers to Participation in Indigenous Tourism: Aggregated Scenario Responses for Chinese Visitors
............................................................................................................................................................................ 126
15
List of Appendices
APPENDIX 1. DOMESTIC AND INTERNATIONAL VISITOR SURVEY
APPENDIX 2. INDIGENOUS TOURISM OPERATOR INTERVIEW GUIDE
APPENDIX 3. INDIGENOUS OPERATOR INFORMATION SHEET AND INFORMED CONSENT FORM
APPENDIX 4. CHINESE TOUR GROUP SURVEY
APPENDIX 5. CHINESE INBOUND TOUR OPERATOR SURVEY
APPENDIX 6. CHINESE EXPERT INFORMANT SURVEY
APPENDIX 7. CODED THEMES FROM INDIGENOUS TOURISM OPERATOR INTERVIEWS
APPENDIX 8. INTERNATIONAL VISITOR TOP 5 AUSTRALIAN EXPERIENCES
APPENDIX 9. DOMESTIC VISITOR TOP 5 AUSTRALIAN EXPERIENCES
16
Acknowledgements
The chief investigators acknowledge the valuable contributions of members of the research team to this
study:
Dr Megan Axelsen
Ms Nicole Cocolas
Mr Mark Chua
Ms Jane Malady
They also acknowledge the 30 data collectors who undertook the fieldwork to collect the visitor surveys,
the administration support of staff at the School of Tourism, The University of Queensland and the
statistical support from Sarah Rhodes and Dr Taryn Swan.
The research would not have been possible without the numerous visitors who participated in the
surveys and the 34 tourism operators who very generously gave their time to participate in an interview
in which they shared their thoughts and perceptions on the international and domestic markets.
Finally the feedback, contributions and support of the project funders is gratefully acknowledged;
particularly that of Mr David Brudenall of Indigenous Business Australia and Ms Kristi O’Brien of
Tourism Australia.
17
Chapter One: Introduction
1.1 Background
Tourism is often cited as offering new socio-economic opportunities for Indigenous peoples and
communities around the world (Ryan & Huyton 2002; Fuller et al. 2005; Butler & Hinch 2007) through
new business development, local employment and increased commercial revenues for the broader host
region (Alston 1998; Van de Wagen 2005). In Australia, an emerging interest in Indigenous culture has
led to the supply of a range of activities and experiences which are often owned and/or managed by
Australia’s Aboriginal and Torres Strait Islander peoples. Importantly, Indigenous tourism can be
particularly beneficial for the economic development of regional and remote areas and can be used as
a stimulus for sustaining declining regional economies and creating enterprises in locations where
economic prospects are otherwise limited (Chang 2006; Tourism Australia 2007). Tourism can also
provide the opportunity for young Indigenous people to stay on country, and also enable Indigenous
communities to showcase their cultures while maintaining and strengthening community identity in their
local region (Winters 2009).
Indigenous tourism can be defined as tourism activity in which Indigenous people are directly involved
either through control and/or by having their culture serve as the essence of the attraction (Butler &
Hinch 2007). Tourism Queensland’s definition encompasses activities that; “involve Australian
Indigenous people and are sensitive to Indigenous culture. It is not limited to cultural tourism product as
it includes mainstream tourism activities and service provision to tourists and the tourism industry”
(Tourism Queensland 2004, p. 5). More specifically, Tourism Research Australia (2008) defines an
Indigenous tourism ‘visitor’ as one who participates in at least one Indigenous tourism activity during
their trip (i.e., visit to an Aboriginal site or community; experiencing Aboriginal art/craft or cultural
display; attending an Aboriginal performance). This participation may be a one-off activity or in addition
to other tourism activities.
Indigenous tourism can be considered an integral, albeit niche part of Australia’s tourism industry
(Whitford & Ruhanen 2010; Hollinshead 1996). In a highly competitive international and domestic
tourism market, Australia’s Indigenous culture has the potential to provide a key point of differentiation.
Therefore throughout Australia, the states and territories are attempting to “…grow Indigenous
involvement in the tourism industry to not only capitalise on the potential for the industry to provide
wealth creating opportunities for Aboriginal and Torres Strait Islander people but also to expand the
18
tourism product and appeal for domestic and international tourists” (Tourism Queensland 2004, p. 6).
The diverse array of Indigenous product offerings that are now being offered across Australia include
bushwalks, safaris, staying in Indigenous accommodation for a short period (e.g., 3-10 days), going on
a tour with an Indigenous guide, visiting an Indigenous site or community, attending live performances
(e.g., dance, drama, music) and appreciating visual arts in State museums and galleries or commercial
art and craft enterprises (Tourism Research Australia 2007).
1.2 Review of Previous Research
The following section provides a brief review of previous research that is relevant to the current study.
Domestic and international visitor statistics for the Indigenous tourism market are reviewed, as are
previous studies that have examined demand and/or supply issues in Indigenous tourism in Australia. A
short review of the Chinese inbound visitor market is also provided to set the context for Stage Two of
the research.
1.2.1 Indigenous Tourism: Domestic and International Visitor Statistics
While Indigenous tourism is purportedly a key segment of the Australian tourism industry, engagement
in Indigenous tourism experiences by both international and domestic markets has been declining since
2006 (Tourism Research Australia 2011). The most recent snapshot of Indigenous tourism visitors in
Australia, provided by Tourism Research Australia’s International Visitor Survey and National Visitor
Survey, shows that in the period between 2006 and 2010 there was an 18.7% average annual decline
in domestic overnight Indigenous tourism visitors and a 4.9% average annual decline in international
Indigenous tourism visitors. Despite this decline however, in 2010 the combined expenditure of the
international and domestic Indigenous tourism markets was AUD$3.8 billion and the international
Indigenous tourism segment represented 13% of total international visitors, 20% of total international
visitor nights and 19% of total international tourism expenditure (Tourism Research Australia 2011).
Of the international market, European visitors continue to be the strongest segment for Indigenous
tourism, comprising 46% of the total international Indigenous tourism market in Australia. This segment
however, has declined on average, by 4.9% each year during the 2006-2010 period. Visitors from Asia
made up 28% of total international Indigenous tourism visitation in 2010 and tourist numbers for this
market also declined on average, 3.7% per year since 2006. Since 2006, other markets showing
significant declines in average annual growth include Korea (-18%), Japan (-14%), the United States (-
8.8%), and the United Kingdom (-8.7%). In contrast, key markets that demonstrated strong average
annual growth were the Asian markets of Indonesia (10%), China (9.4%), India (6.1%), Thailand
19
(5.6%), while France (5.4%) showed the strongest growth of the European markets (Tourism Research
Australia 2011).
The profile of international visitors interested in Indigenous tourism experiences and activities in
Australia is different to other visitor segments. For instance, research has shown that this visitor is less
likely than other international visitors to spend nights in the capital cities and the Gold Coast (69%
compared to 81%), and more likely than other visitors to spend nights in regional areas (31% compared
to 19%). During 2010, international visitors participating in Indigenous tourism were over three times
more likely than other visitors to stay in backpacker/hostel accommodation (16% of nights compared to
5%) and less likely than other visitors to stay in the home of a friend or relative (20% of nights
compared to 30% of nights) (Tourism Research Australia 2011).
Although Tourism Research Australia identified Indigenous tourism visitors as comprising 13% of total
international visitors, Nielsen et al. (2008) findings showed that participating in Indigenous tourism is
often not regarded as a primary motivator to visit Australia. While there is widespread interest in
Indigenous culture, it is not considered a ‘must see’ attraction or visitors only participate in one
Indigenous activity while in Australia (Nielsen et al. 2008). Similarly, of the seven ‘experiences’
identified by Tourism Australia as having the most potential to encourage international travellers to visit
Australia, ‘Aboriginal Australia’ was generally ranked below 5 (with 1 being the highest). These seven
experiences included Aboriginal Australia, Nature in Australia, Outback Australian, Aussie Coastal
Lifestyle, Food and Wine, Australian Major Cities and Australian Journeys. Survey results indicated that
New Zealand respondents ranked Aboriginal Australia as 7th, US respondents ranked it 7th, UK 5th,
French as 4th, German as 5th, Chinese as 6th, Singaporean as 7th, Indian as 5th, Japanese as 5th,
Korean as 6th, and Malaysian as 6th (Tourism Australia 2009).
Of the total Indigenous tourism visitor market, domestic visitors represented over 70%. Tourism
Research Australia’s (2010) profile of the general domestic Indigenous tourism visitor showed that this
person is likely to be a female (56%) in the 45-64 years age bracket (45%) and employed either full-
time or part-time (66%). Indigenous tourism visitors are also more commonly parents (37%), older non-
working (19%) or older working (18%). The most common travel party type for Indigenous tourism
visitors is as an adult couple but these visitors also have a propensity to travel in groups, particularly
with friends and relatives. The domestic Indigenous tourism visitor seeks information about their trip
prior to travel, with the most common information source being the internet (54%). This person is also
20
likely to be travelling for holiday purposes (65%) and prefers to stay in hotels, motels, motor inns and
serviced apartments (39%).
1.2.2 Indigenous Tourism: Research Focus on Supply and Demand
Whilst there has been somewhat of an upsurge of interest in Indigenous tourism over the last two
decades, there has been only limited research undertaken to assist owners and operators in building a
sustainable tourism business. Aside from the international and national visitor surveys, little empirical
research has been undertaken on supply and demand issues in Indigenous tourism in Australia. This
lack of research has been problematic as many strategies aimed at developing Indigenous tourism in
Australia have endorsed a general assumption of high interest or growing demand in Indigenous
tourism without explicit or convincing empirical evidence (Tremblay & Wegner 2009). While there has
been growth in the development of new Indigenous tourism businesses and tourism products in recent
times (Whitford & Ruhanen 2010), Buultjens and White (2008) suggested that many Indigenous
businesses find it difficult to achieve sustainability.
1.2.3 Indigenous Tourism: Demand
Research focusing on the demand side of Indigenous tourism product has shown that, from a domestic
perspective, Indigenous tourism has low appeal, relative to other Australian experiences (Ryan &
Huyton 2000; Jones Donald Strategy Partners 2009). This was found to be due to its limited ability to
satisfy key domestic holiday needs of relaxation and indulgence (Jones Donald Strategy Partners
2009). For the domestic market, Indigenous tourism does not spontaneously register as a key domestic
travel experience. Ryan and Huyton (2000) proposed that while there is an interest in Indigenous
tourism products, often these products are seen as simply a component within a wider cultural and
natural context of the Australian tourism experience. Jones Donald Strategy Partners (2009) further
claimed that Indigenous tourism in Australia is felt to be mostly inauthentic, clichéd and designed for the
international market (Jones Donald Strategy Partners 2009). Accessibility is also seen as a barrier to
broader participation (Tourism Research Australia 2010).
While some studies have found Indigenous tourism to have a low appeal relative to other Australian
experiences, research by Tourism Research Australia (2010) indicated that a significant proportion of
domestic travellers are open to Indigenous tourism experiences. This research found that two-thirds of
consumers have previously either considered, or actually taken part in Indigenous tourism activities. Of
those who did take part in an Indigenous experience, 87% believed it met or exceeded their
expectations.
21
From their research investigating visitor interest in Aboriginal tourism in the Northern Territory, Ryan
and Huyton (2000; 2000a; 2002) reported that tourists, both domestic and international, consistently
ranked attractions based on Indigenous culture as being less attractive than other activities. Ryan and
Huyton found that while Indigenous tourism experiences were of interest to approximately a third of the
visitors to the Territory, the Indigenous tourism experiences were not a major attraction. Additionally,
those visitors interested in having an Indigenous experience were not only culture tourists, but also
nature and adventure tourists and were therefore also active in seeking a variety of experiences. Ryan
and Huyton reported that much of the interest in Indigenous tourism is also confined to certain
nationality groups including German, British and North American. Indeed, while visitor monitor surveys
of the Northern Territory show that the ‘Top End’ is strongly perceived as a place where authentic
Indigenous culture can be experienced, established tourism products based on Indigenous culture have
had a mixed history in attracting visitors. Visitor interest in ‘things Aboriginal’ has therefore not always
translated into high visitor numbers (Ryan & Huyton 2000; Tourism Research Australia 2011a).
It has been suggested that one of the main reasons for a lack of participation in Indigenous tourism by
people interested in it, is due to a lack of promotional material required for planning activities. Research
showed that between 60 and 80 percent of international visitors who were either interested in
experiencing, or had experienced, an Indigenous tourism product believed they had viewed very little
advertising (Buultjens & White 2008).
Finally, from a demand perspective with regard to experiences sought and actual visitor interests,
currently there is a lack of clear information on what experiences tourists are looking for and in which
locations. While there has been some research done in this area, this research was carried out more
than ten years ago. This research found high levels of interest in dance performances, guided tours by
Aboriginal people and high levels of interest for more opportunity for interaction with Aboriginal people
(Pearce et al. 1997).
1.2.4 Indigenous Tourism: Supply
Visitor demand is a challenge for developing sustainable Indigenous tourism businesses in Australia.
Compounding this challenge is a range of other supply side factors including access to start up finance
and capital and recruiting and retaining appropriately skilled labour (Buultjens & White 2008; Nielsen et
al. 2008; Whitford & Ruhanen 2009). Altman and Finlayson (1992) noted specific challenges with
respect to Indigenous employment in the tourism industry including requirements for a high level of
22
literacy and communication skills to cope with direct and intensive social interaction with tourists.
Further, a lack of requisite skills means that employment opportunities for Indigenous peoples in
tourism are often limited to unskilled or semi-skilled positions. There are also substantial differences
between regions with regard to Indigenous product offered. For example, there are a number of
Indigenous tourism products in Cairns and the surrounding region but there is no product in the
Whitsundays region (Nielsen et al. 2008).
Indigenous peoples involved in tourism generally have a positive view of the industry and confidence in
their products. A study by Jones Donald Strategy Partners (2009) was undertaken to examine the
supply of Indigenous tourism in Australia. The study was commissioned by Tourism Australia [TA] and
the Department of Resources, Energy and Tourism [RET]. The objective of the study was to inform
strategies for TA and RET to better support the domestic Indigenous tourism market. The study found
that due to the volume of positive feedback and word-of-mouth referrals received, suppliers of
Indigenous tourism product have confidence in the ability of their product to exceed consumer
expectations.
Indigenous tourism operators however, are aware that the domestic market seems to have less interest
in Indigenous product and attribute this in part, to racist views. There is a view that an anti-Indigenous
element seems to exist within the domestic tourism market because of ignorance or prejudice (Nielsen
et al. 2008). Others have suggested that the low demand is due to supply issues, as the product is
generally regarded as relatively underdeveloped, with a mismatch between experiences sought and
product offered (Buultjens & White 2008). In addition, trade organisations often have concerns
regarding product consistency and as such, many are hesitant to include Indigenous tourism activities
in their package offers due to a perceived inconsistency in delivery (Jones Donald Strategy Partners
2009).
1.2.5 The Chinese Inbound Market
China is currently Australia’s third largest inbound market in terms of visitor numbers (after New
Zealand and the UK) (Tourism Research Australia 2012). China is also Australia’s fastest growing
inbound tourism market in terms of visitor volumes and values and in 2010 it became Australia’s
highest yielding market, with a total spend of AUD$3.8 billion in 2011. According to the Tourism
Forecasting Committee (Tourism Australia 2012), China is expected to be particularly important to the
performance of the Australian tourism sector in both the short and long term as China’s share of
inbound arrivals is expected to increase at a compound annual rate of 11% between 2011/12 and
23
2015/16. From a Chinese traveller perspective, of the out-of-region outbound destinations, Australia is
ranked as the 10th most attractive option (Tourism Australia 2012).
The most recent snapshot of the Chinese inbound market to Australia indicated that 62% of total
arrivals travelled to Australia for leisure and 53% of visitors were repeat visitors. Visitors were generally
in the 45-59 years age group (30%), closely followed by the 15-29 years age group (29%). Many of the
market, 40.8%, booked into a package tour and of these, 92.9% were booked into a group tour. The
peak travel period for this market is December to March (Tourism Research Australia 2012). During
their time in Australia, the average Chinese visitor spends $7,100 per trip and spends $140 per night.
The average length of stay for leisure visitors is 23 days (Tourism Australia 2012; Tourism Research
Australia 2012; Tourism Australia 2012a).
Although the Chinese market is not a homogenous market, Tourism Australia (2012b) has provided an
overview of the ‘average’ Chinese long-haul leisure visitor. This visitor is a relatively experienced
traveller (almost 70% have travelled outside of Asia in the last 12 months) who has a strong desire to
visit Australia’s iconic attractions with the Opera House, Great Barrier Reef, kangaroos and koalas
being high on their list of ‘must sees’. Group travel is generally preferred, particularly when visiting a
destination for the first time, however as experience is gained, flexibility in travel options becomes more
important. This visitor is inspired and influenced by traditional travel advertising, travel media and word-
of-mouth. Neverthless, social media is also becoming increasingly influential. Bookings are still being
completed through travel agents; however the internet is important in the research and planning phase.
Research by Tourism Australia (2012b) has also explored Chinese tourists’ expectations of a long haul
holiday. The Chinese tourist generally expects to experience: a ‘difference’ to their home environment;
a mix of natural environment, culture, history and development together with good products and
services for accommodation, eating out, different cuisine options and local shopping; safety; value for
money; the ability to see iconic and famous attractions (a major consideration when selecting a
destination); accommodation options that include well-known hotel chains and mid-level 3 star hotels;
Chinese speaking tour guides; access to Chinese food; direct flights; and local shopping.
While there is limited research into Indigenous tourism visitors from China, data from Tourism Research
Australia’s International Visitor Survey has shown that Chinese visitors arriving on a travel package
24
were the highest number to experience some form of Indigenous tourism1; third behind visitors from the
United Kingdom and the United States (Tourism Research Australia 2011).
1 An Indigenous tourism visitor is defined as a visitor who participates in at least one Indigenous tourism activity during their trip – this may be a one-off activity, or in addition to other tourism activities. The following are examples of Indigenous tourism activities: visit an Aboriginal site or community; experience Aboriginal art/craft or cultural display; attending an Aboriginal performance (Tourism Research Australia, 2011).
25
Chapter Two: Research Methods
2.1 Purpose of the Study
The aim of this research was to undertake a gap analysis of the demand for, and supply of, Indigenous
tourism in Australia. The objective of the study was to address clear and acknowledged research gaps
in identifying, understanding and developing strategies for responding to the discrepancies between
demand for, and supply of, Indigenous tourism products in Australia. While there has been a number of
site specific demand studies of Indigenous tourism in Australia (and overseas) previously, “a common
problem…is that the research is often repetitive with a strong emphasis on evaluating visitor
expectations and reactions to Aboriginal tourism and most critically, few of the findings from these
works are readily available or applied to the practical demands of doing the business of tourism”
(Schmiechen & Boyle, 2007, p.61). Utilising a gap analysis approach, this research aimed to map
demand side characteristics alongside the voices, experiences and insights of Indigenous tourism
operators.
A further addition to the study was the inclusion of a stream of research specifically focused on the
Chinese inbound visitor market and their demand for Indigenous tourism in Australia. As noted
previously, there has been no empirical research in this area with the exception of the national
statistical collections. This stage of the research, while complimentary, has been presented as a
standalone component (Stage Two) in the report for ease of reference for the different project
stakeholders.
The specific objectives of the study were to:
Stage One: Map the International and Domestic Visitor Markets against Indigenous Tourism Operators
1. Investigate the expectations, experiences and motivations, of both international and domestic
tourists regarding Indigenous tourism products and services in Australia.
2. Investigate the expectations, experiences and motivations of Indigenous tourism operators
regarding the provision of activities and experiences to the visitor market.
3. Undertake a gap analysis of the expectations, experiences and motivations of international and
domestic tourists and Indigenous tourism operators to analyse and map identified gaps and
associated emergent issues.
26
Stage Two: Chinese Inbound Market Study
4. Investigate the expectations, experiences and motivations, of independent Chinese tourists
regarding Indigenous tourism products and services in Australia.
5. Explore the relative demand for Indigenous tourism products and experiences of Chinese tour
group participants in Australia.
6. Investigate the perceptions, expectations and decision making processes of Chinese inbound
tour operators and Chinese market expert informants regarding Australian Indigenous tourism
products and services.
7. Undertake a gap analysis of the expectations, experiences and motivations of Chinese tourists,
tour operators, expert informants, and Indigenous tourism operators to explore and then map
and critically analyse identified gaps and associated emergent issues.
2.2 Research Methods
To examine demand for, and supply of, Indigenous tourism products in Australia, a three phase mixed
methodology utilizing a combination of quantitative, qualitative and semi-qualitative techniques was
employed. Underpinned by the ethics of Indigenous knowledge research (Sheehan & Walker, 2001) the
triangulated research strategy included:
a survey with international and domestic tourists, and
in-depth, semi-structured interviews with a sample of Indigenous tourism operators
An additional component was included in the study focusing specifically on the inbound Chinese visitor
market and their demand for, and perceptions of, Indigenous tourism. Again, a mixed method approach
was used consisting of surveys with:
independent Chinese tourists
Chinese tour group tourists
5. Chinese tour operators (Approved Destination Status [ADS] inbound and other tour operators
servicing the Chinese market in Australia), and
6. expert informants of the inbound Chinese market.
27
2.3 Stage One: Map the International and Domestic Visitor Market against Indigenous Tourism
Operators
2.3.1 International and Domestic Visitor Survey
Face-to-face surveys were administered to international and domestic visitors in four tourist precincts
around Australia. Sampling locations included Sydney, Melbourne, Cairns and Darwin. Sydney and
Melbourne were selected as they are the two major international gateways and most visited cities in
Australia. These locations provided access to tourists who have participated in Indigenous tourism and
also to tourists who have not participated in Indigenous tourism. Cairns and Darwin were identified as
two locations which are generally accepted as ‘popular’ destinations for Indigenous tourism and
therefore were expected to provide access to relatively higher populations to sample those visitors that
have participated in an Indigenous tourism activity or experience.
Teams of trained data collectors spent three days in each of the four locations over August and
September 2012 under the supervision of a member of the research team. The teams consisted of up
to eight data collectors working in each of the tourist precinct areas making random approaches to
people in the area and inviting them to participate in the study. To ensure data quality and improve
response rates, the data collection team was uniformed with University of Queensland shirts and name
badges. Show cards were also used to facilitate timely completion of the questionnaires. The necessary
permissions were obtained from the respective councils or management authorities in each of the
locations. In Sydney, surveys were undertaken in the Sydney Harbour/Opera House/Rocks precincts as
well as in Darling Harbour. In Melbourne, surveying took place along Southbank and in Federation
Square. In Cairns, surveys were collected in both the Cairns Esplanade and City Place, while in Darwin
surveys were collected in the Smith Street Mall.
The questionnaire was developed in SurveyMonkey, an online survey tool that aids the rapid and
accurate collection of data. iPads with access to the internet were utilised by the data collectors to
access the online survey thereby facilitating the data collection process. The survey was designed to
include:
financial and time scenario questions designed to elicit the relative importance of Indigenous
tourism without prompting followed by,
more specific questions about awareness, past experience, exposure, interest and motivation
to participate in Indigenous tourism.
Each survey took approximately 15 to 20 minutes to complete. The survey is included in Appendix 1.
28
A sample of 1000 respondents was initially sought: 500 international and 500 domestic respondents
across the four locations. At the conclusion of the survey, a total of 1357 useable surveys were
collected:
391 in Sydney
303 in Melbourne
315 in Cairns
348 in Darwin.
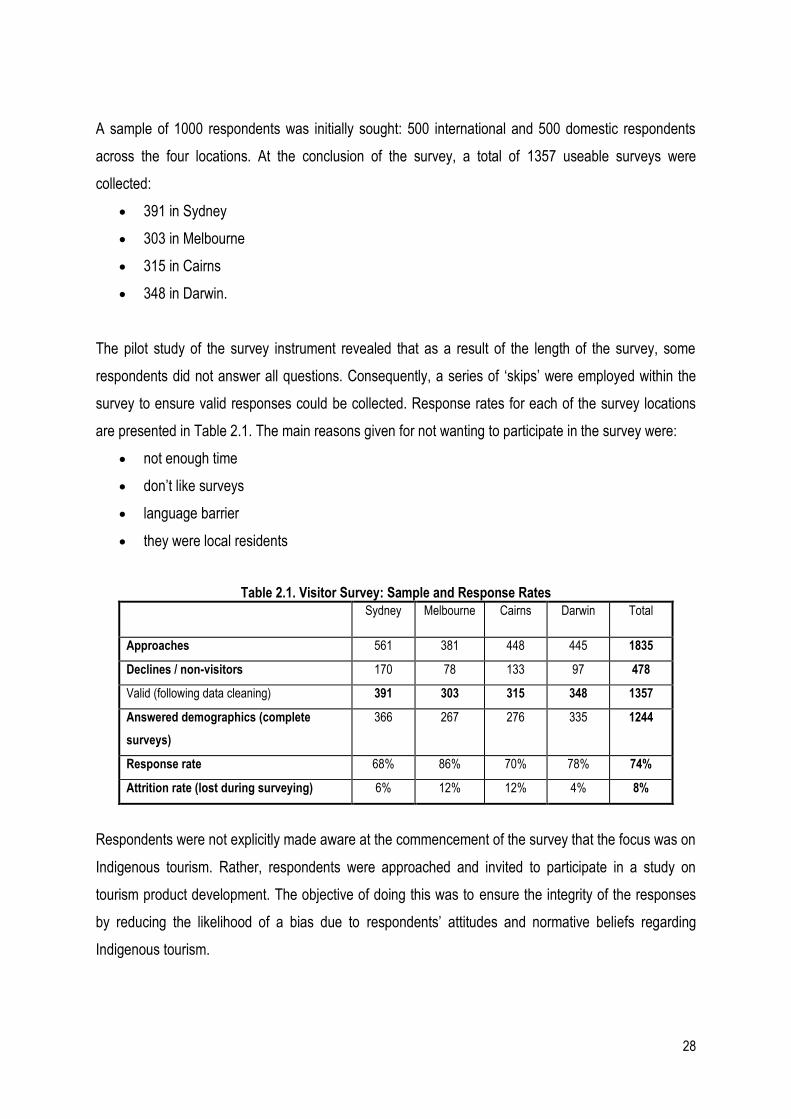
The pilot study of the survey instrument revealed that as a result of the length of the survey, some
respondents did not answer all questions. Consequently, a series of ‘skips’ were employed within the
survey to ensure valid responses could be collected. Response rates for each of the survey locations
are presented in Table 2.1. The main reasons given for not wanting to participate in the survey were:
not enough time
don’t like surveys
language barrier
they were local residents
Table 2.1. Visitor Survey: Sample and Response Rates
Sydney Melbourne Cairns Darwin Total
Approaches 561 381 448 445 1835
Declines / non-visitors 170 78 133 97 478
Valid (following data cleaning) 391 303 315 348 1357
Answered demographics (complete
surveys)
366 267 276 335 1244
Response rate 68% 86% 70% 78% 74%
Attrition rate (lost during surveying) 6% 12% 12% 4% 8%
Respondents were not explicitly made aware at the commencement of the survey that the focus was on
Indigenous tourism. Rather, respondents were approached and invited to participate in a study on
tourism product development. The objective of doing this was to ensure the integrity of the responses
by reducing the likelihood of a bias due to respondents’ attitudes and normative beliefs regarding
Indigenous tourism.
29
To facilitate the inclusion of Chinese respondents for the second stage of the study, surveys were
undertaken in both English and Chinese. In each survey location, at least two members of the data
collection team were fluent in Mandarin. The majority of the responses were collected in English and
approximately 8% were undertaken in Chinese2. Tourist precincts were selected as the survey locations
in each of the cities (Table 2.1).
Analysis of the visitor survey results were undertaken in SPSS and STATA, which are data analysis
software. Analysis included descriptive statistics, chi-square tests, t-tests, ANOVAs, and, for a select
number of questions, factor analysis and regression. In line with the objectives of the study, the focus of
the statistical analysis was on providing comparisons between the domestic and international samples.
However, where sample sizes were less than n=25, the results were marked as ‘Not Publishable’ to
ensure validity of the results. There is opportunity to further explore the data using cluster analysis,
factor analysis and more advanced regression techniques where sample sizes permit.
2.3.2 Indigenous Tourism Operator Interviews
In-depth, semi-structured, face-to-face interviews were undertaken with a sample of Indigenous tourism
operators across Australia. In-depth interviews were deemed most appropriate for this study as they
provide a more nuanced understanding of the issues under investigation by providing the opportunity
for detailed and reflective answers based on the experience of participants. Moreover, they provided
diverse viewpoints and thus deeper insight into issues pertaining to Indigenous tourism in Australia.
In particular, interviews were used to explore:
motivations, issues and challenges for Indigenous communities and individuals operating in the
tourism industry.
responses to the inherent challenges of a service sector such as tourism.
meeting visitors’ demands and expectations for ‘authentic’ Indigenous cultural experiences,
among others.
Specific questions were also asked regarding the Chinese inbound market to facilitate the gap analysis
in Stage Two of the study. The final interview guide is presented in Appendix 2.
2 The international responses in Chapter 3 are inclusive of the Chinese respondent data. In Chapter 6, the Chinese respondent data has been extracted for further analysis alongside the other data sets for the Chinese market.
30
To ensure that the interviews were inclusive of the range of issues facing business operators, and
importantly the different markets around Australia, interviews were undertaken in a range of tourism
locations around Australia: Sydney, Melbourne, Brisbane, Cairns, Townsville, Darwin, Alice Springs,
Perth, Broome and Adelaide. All interviews were undertaken by an expert researcher experienced in
conducting semi-structured, in-depth interviews.
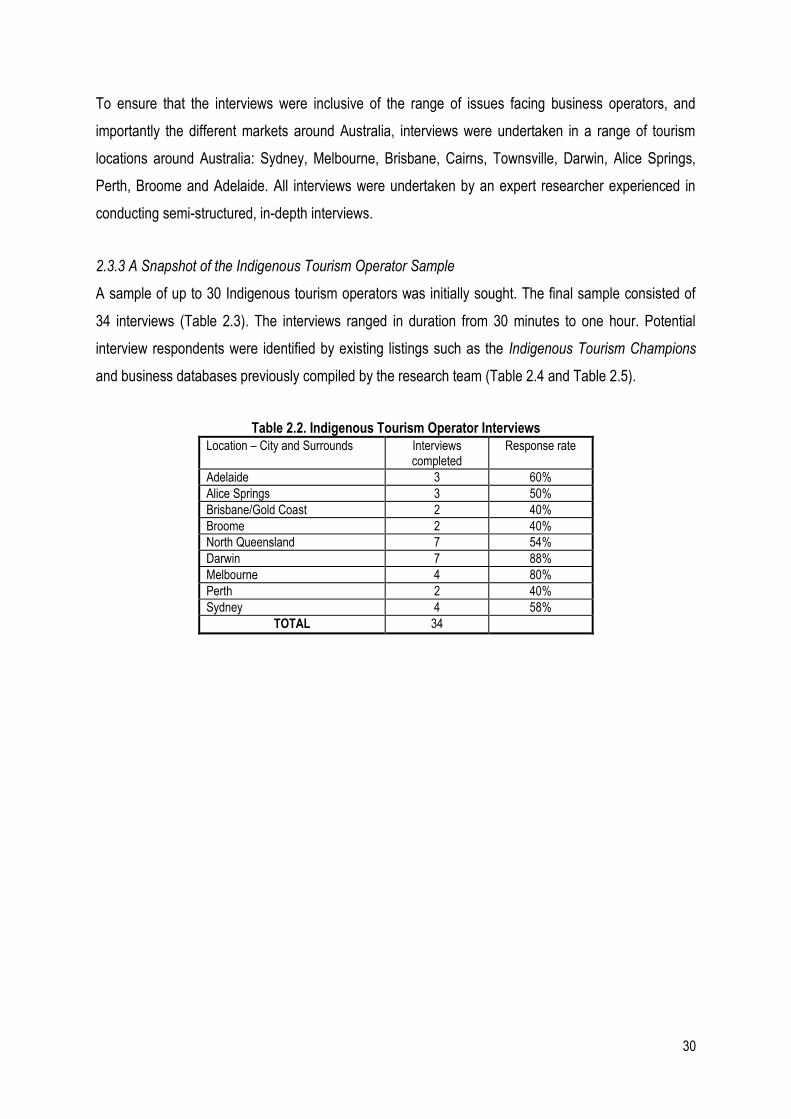
2.3.3 A Snapshot of the Indigenous Tourism Operator Sample
A sample of up to 30 Indigenous tourism operators was initially sought. The final sample consisted of
34 interviews (Table 2.3). The interviews ranged in duration from 30 minutes to one hour. Potential
interview respondents were identified by existing listings such as the Indigenous Tourism Champions
and business databases previously compiled by the research team (Table 2.4 and Table 2.5).
Table 2.2. Indigenous Tourism Operator Interviews
Location – City and Surrounds Interviews completed
Response rate
Adelaide 3 60% Alice Springs 3 50% Brisbane/Gold Coast 2 40% Broome 2 40% North Queensland 7 54% Darwin 7 88% Melbourne 4 80% Perth 2 40% Sydney 4 58%
TOTAL 34
31
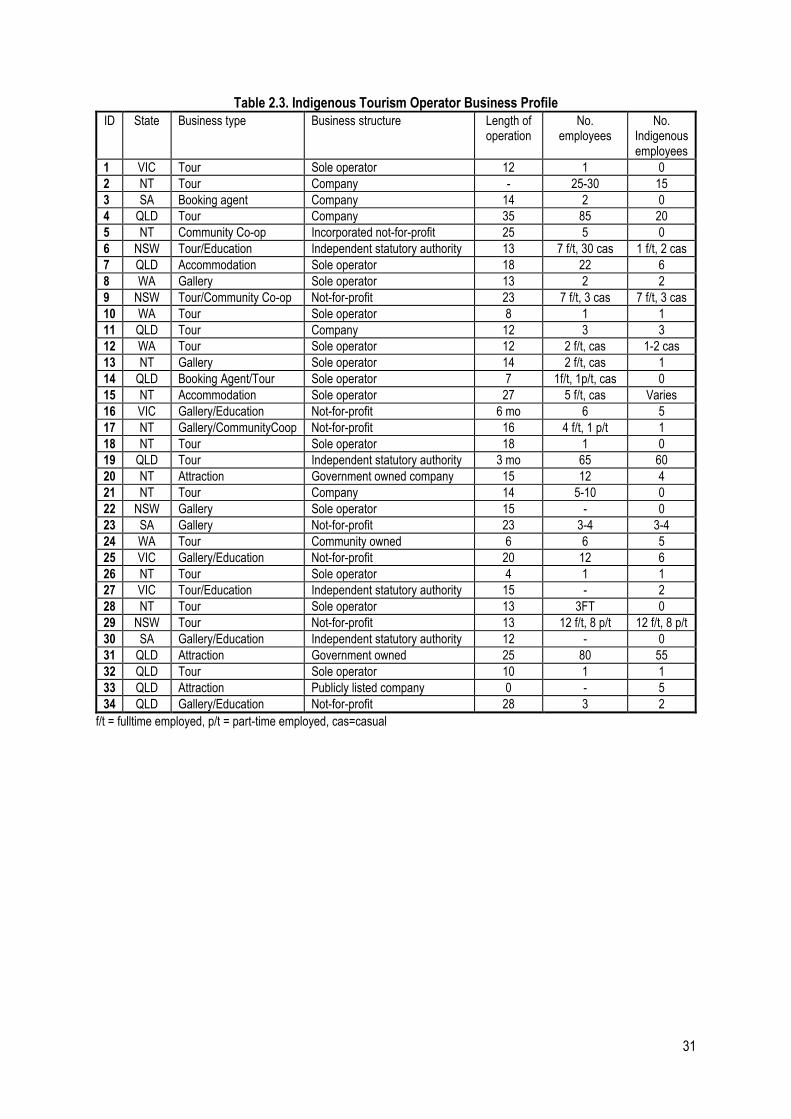
Table 2.3. Indigenous Tourism Operator Business Profile
ID State Business type Business structure Length of operation
No. employees
No. Indigenous employees
1 VIC Tour Sole operator 12 1 0
2 NT Tour Company - 25-30 15
3 SA Booking agent Company 14 2 0
4 QLD Tour Company 35 85 20
5 NT Community Co-op Incorporated not-for-profit 25 5 0
6 NSW Tour/Education Independent statutory authority 13 7 f/t, 30 cas 1 f/t, 2 cas
7 QLD Accommodation Sole operator 18 22 6
8 WA Gallery Sole operator 13 2 2
9 NSW Tour/Community Co-op Not-for-profit 23 7 f/t, 3 cas 7 f/t, 3 cas
10 WA Tour Sole operator 8 1 1
11 QLD Tour Company 12 3 3
12 WA Tour Sole operator 12 2 f/t, cas 1-2 cas
13 NT Gallery Sole operator 14 2 f/t, cas 1
14 QLD Booking Agent/Tour Sole operator 7 1f/t, 1p/t, cas 0
15 NT Accommodation Sole operator 27 5 f/t, cas Varies
16 VIC Gallery/Education Not-for-profit 6 mo 6 5
17 NT Gallery/CommunityCoop Not-for-profit 16 4 f/t, 1 p/t 1
18 NT Tour Sole operator 18 1 0
19 QLD Tour Independent statutory authority 3 mo 65 60
20 NT Attraction Government owned company 15 12 4
21 NT Tour Company 14 5-10 0
22 NSW Gallery Sole operator 15 - 0
23 SA Gallery Not-for-profit 23 3-4 3-4
24 WA Tour Community owned 6 6 5
25 VIC Gallery/Education Not-for-profit 20 12 6
26 NT Tour Sole operator 4 1 1
27 VIC Tour/Education Independent statutory authority 15 - 2
28 NT Tour Sole operator 13 3FT 0
29 NSW Tour Not-for-profit 13 12 f/t, 8 p/t 12 f/t, 8 p/t
30 SA Gallery/Education Independent statutory authority 12 - 0
31 QLD Attraction Government owned 25 80 55
32 QLD Tour Sole operator 10 1 1
33 QLD Attraction Publicly listed company 0 - 5
34 QLD Gallery/Education Not-for-profit 28 3 2
f/t = fulltime employed, p/t = part-time employed, cas=casual
32
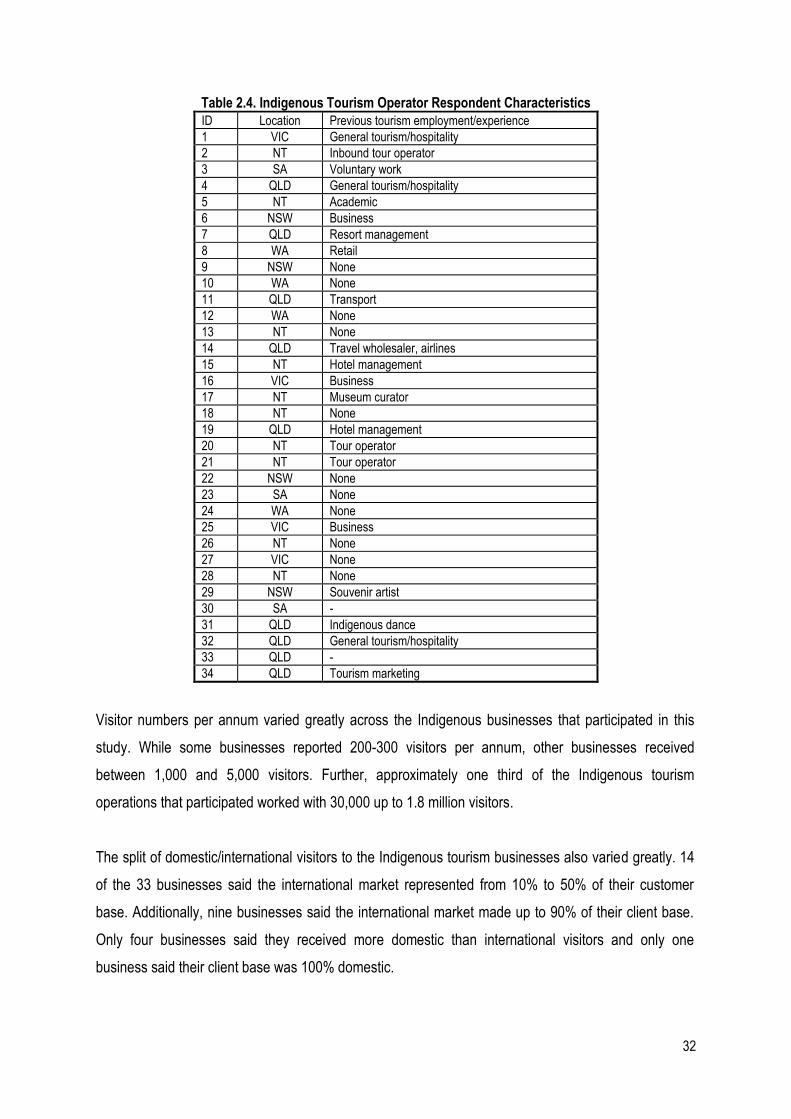
Table 2.4. Indigenous Tourism Operator Respondent Characteristics
ID Location Previous tourism employment/experience
1 VIC General tourism/hospitality
2 NT Inbound tour operator
3 SA Voluntary work
4 QLD General tourism/hospitality
5 NT Academic
6 NSW Business
7 QLD Resort management
8 WA Retail
9 NSW None
10 WA None
11 QLD Transport
12 WA None
13 NT None
14 QLD Travel wholesaler, airlines
15 NT Hotel management
16 VIC Business
17 NT Museum curator
18 NT None
19 QLD Hotel management
20 NT Tour operator
21 NT Tour operator
22 NSW None
23 SA None
24 WA None
25 VIC Business
26 NT None
27 VIC None
28 NT None
29 NSW Souvenir artist
30 SA -
31 QLD Indigenous dance
32 QLD General tourism/hospitality
33 QLD -
34 QLD Tourism marketing
Visitor numbers per annum varied greatly across the Indigenous businesses that participated in this
study. While some businesses reported 200-300 visitors per annum, other businesses received
between 1,000 and 5,000 visitors. Further, approximately one third of the Indigenous tourism
operations that participated worked with 30,000 up to 1.8 million visitors.
The split of domestic/international visitors to the Indigenous tourism businesses also varied greatly. 14
of the 33 businesses said the international market represented from 10% to 50% of their customer
base. Additionally, nine businesses said the international market made up to 90% of their client base.
Only four businesses said they received more domestic than international visitors and only one
business said their client base was 100% domestic.
33
In relation to funding for the tourism businesses, 12 operators said they did not receive any funding
while seven operators received funding from: Federal and/or State Government departments, agencies
and programs including: Indigenous Business Australia; Department of Education Employment and
Workplace Relations; Department of Employment, Economic Development and Innovation (QLD), the
former Aboriginal and Torres Strait Islander Commission and T-QUAL. Other businesses received
funding from the Australia Council for the Arts, Arts NT, Arts SA, and Office for the Arts. The Royalties
for Regions, the Small Business Development Corporation WA and Starfish Business
Solutions/Tourism Australia were the funding sources for some of the businesses. Participants also
identified that philanthropic support was forthcoming.
2.3.4 Interview Methods
Interviews were digitally recorded with the permission of the participant. All participants were provided
with a research summary and signed an ethics statement before the interviews commenced. These are
included in Appendix 3.
All interviews were transcribed verbatim by a professional transcription service and analysed using
manual thematic coding. In-depth interviews generally result in large amounts of rich data and this was
certainly the case in this research with 34 in-depth interview transcripts. Criteria for qualitative enquiry:
credibility (multiple sources of data), transferability (purposive sampling, interview schedule),
dependability (presentation of frequencies alongside quotes in the interview results, independent
coding by two researchers) and confirmability (presentation of the participants’ own voices) (DeCrop,
2004) were adhered to in the research design.
The interview transcripts were coded using content analysis techniques where the data was analysed
through a process of induction then the researcher constructed and reconstructed meaning in the data
in relation to the research question (Janesick 2000). A central idea in content analysis is that the many
words of the text are classified into much fewer content categories, which may consist of one, several
or many words (Weber 1990; Swift 1996). To achieve the objectives of the study, the interview
transcripts underwent manifest coding. Singular or multiple words and/or phrases deemed relevant to
the study objectives were selected from the transcripts.
Qualitative results are presented for ease of reference in bar charts using frequencies to represent the
number of times a particular theme arose during the interviews. Multiple responses were allowed for in
the coding so the charts will not sum to 100%.
34
2.4 Stage Two: The Chinese Inbound Market and Indigenous Tourism
2.4.1 Independent Chinese Tourist Survey
A face-to-face survey was administered by researchers to inbound Chinese tourists in four tourist
precincts around Australia: Sydney, Melbourne, Cairns and Darwin. This stage of the research was
undertaken concurrently with the international and domestic survey on Indigenous tourism but was
undertaken by two Mandarin speaking research assistants. The visitor survey instrument was translated
into Chinese for this purpose and iPad survey tools were utilised to facilitate the data collection.
The survey included:
financial and time scenario style questions designed to elicit the relative importance of
Indigenous tourism without prompting followed by,
more specific questions about past experience, exposure, interest and motivation to participate
in Indigenous tourism.
Each survey took 15 to 20 minutes to complete. The survey is included in Appendix 1.
A sample of 500 independent Chinese travellers was initially sought. The final sample achieved was
115 representing 14% of the total international sample. This was in spite of concerted attempts by the
data collectors to identify and improve the participation of Chinese tourists.
2.4.2. Chinese Tour Group Survey
Although tour group participants will generally have little influence over their itineraries, tours may be
chosen by tourists because of particular attributes and inclusions. Alternatively, tour group participants
may have a desire for certain experiences that are not being met. Given this context, and the
importance of the package tour market for the inbound Chinese market to Australia, a questionnaire
was administered to Chinese tour group participants. The survey was translated and self-completed by
participants. The surveys were distributed by data collectors fluent in Mandarin.
The survey was based on the instrument used in Stage One to elicit:
the relative importance of Indigenous tourism through scenario style questions
prior knowledge or experience as well as relative interest and motivation to participate in
Indigenous tourism in Australia.
35
These surveys were an abridged version of the larger international and domestic visitor survey
discussed previously. Due to the type of respondents sought and the time constraints of tour groups,
the survey could be completed in approximately five minutes (Appendix 4). Initially respondents were
provided with a small souvenir as a token of thanks for their participation. However, this was
discontinued after some problems with the respondents trying to complete multiple surveys to obtain
multiple souvenirs, or insisting the data collectors distribute multiple ‘thank you’ gifts.
A sample of 500 respondents for this survey was sought. The final sample achieved was 275. The
original proposal and data collection strategy was budgeted on establishing contacts with Chinese tour
operators and requesting their support and permission for researchers to join their tour groups to
distribute the survey. However, numerous attempts to gain access to the tour groups via this avenue
proved futile, resulting in the need for the research team to conduct the fieldwork in tourist precincts.
The very small budget allocated for data collection of Chinese tour groups (originally calculated on
distributing surveys to large tour groups simultaneously) meant research teams had to be sent to
precincts in Brisbane and the Gold Coast (the location base of the research team). While this approach
did generate 275 responses, it was not an ideal approach given the previously noted time constraints of
tour groups. Moreover, while some tour guides provided access to their tour groups, others were not
willing to allow their tourists to participate in the survey.
2.4.3 Chinese Tour Operator and Expert Informant Survey
The final data set sought for the Chinese inbound analysis was from the Chinese tour operators. Given
the high proportion of visitors travelling in tour groups, understanding the perceptions, expectations and
decision making process and choices of the inbound tour operators is crucial in investigating the
Chinese market’s perception of Australia’s Indigenous tourism product. Therefore the research design
sought to undertake in-depth, semi-structured interviews with a sample of inbound Chinese tour
operators. Initially a Mandarin speaking member of the research team made contact with a database of
Chinese tour operators, including those on the current ADS list available online. A second database of
tour operators servicing the Chinese market in Australia was also compiled. This initial contact was
made by telephone and email. Despite numerous attempts to gain access to this market via contacts
and colleagues in academia, industry and government, both in Australia and China, the target sample
was not responsive to requests to participate in the study. As a result, the research team developed an
online survey that covered the same questions that were to be posed in an interview. A total of 78
operators were contacted via email to complete the survey online via Survey Monkey. This strategy
elicited only seven responses (Appendix 5).
36
Support was received from the ADS division of the Department of RET who distributed hard copies of
the survey during a training forum with ADS operators on the 27th of November 2012. A total of 44
responses were obtained. Together with those responses received online, a total of 51 Chinese tour
operator responses were received.
Prior to receiving the support from RET the research team instigated an additional survey to
supplement the responses of the Chinese tour operators. The ‘expert informant’ survey is targeted at a
sample of experienced and knowledgeable experts in the Chinese inbound market. With a response
rate of 60%, a total of 18 responses to this online survey were received. The survey was distributed via
Survey Monkey (Appendix 6).
2.5 Ethical Considerations
The University of Queensland has strict guidelines relating to ethical approval for research. The
University’s ethical guidelines were adhered to during all stages of this study. These guidelines
extended to the establishment of procedures for the informed consent of research participants, the
protection of participant identity, as well as the appropriate management of research findings including
data storage and member cross checking.
Participants in the domestic and international visitor survey were read a short ethics statement by the
data collectors prior to commencing the survey. All online and hard copy surveys included an ethics
statement and the researchers’ contact details. Participants in the in-depth interviews were provided
with an information sheet to be retained for their record, detailing the nature of the project as well as the
contact details of the research should they wish to discuss the project further (Appendix 3). In addition,
participants were provided with a consent form, which was signed and returned to the researcher
before the interviews began. Participants were also made aware, both verbally and on the consent
form, that they were free to withdraw from the study at any time. Moreover, participants were notified
and their permission sought for the use of a digital recorder during the interview.
37
2.6 Research Limitations
Like all research, this study had a number of limitations and delimitations which included:
Only visitors in the four collection regions were included in the visitor survey sample via
convenience sampling in common and acknowledged ‘tourist’ areas of the cities.
Targeted efforts were only made to increase the participation of Chinese independent tourists
with the use of Mandarin speaking data collectors.
The research did not account for change in perceptions/visitor type due to seasonality.
Obtaining access to large samples of Chinese tour group participants was problematic
therefore projected sample sizes could not be reached.
The timeframe in which to conduct and report on the research.
Subjectivity is an essential part of the interpretive analysis, and the researcher’s values and
interests and Anglo-Celtic background may have influenced interpretation of the text pertaining
to Indigenous peoples.
38
Stage One:
Mapping the International and Domestic
Visitor Markets against Indigenous Tourism
Operators
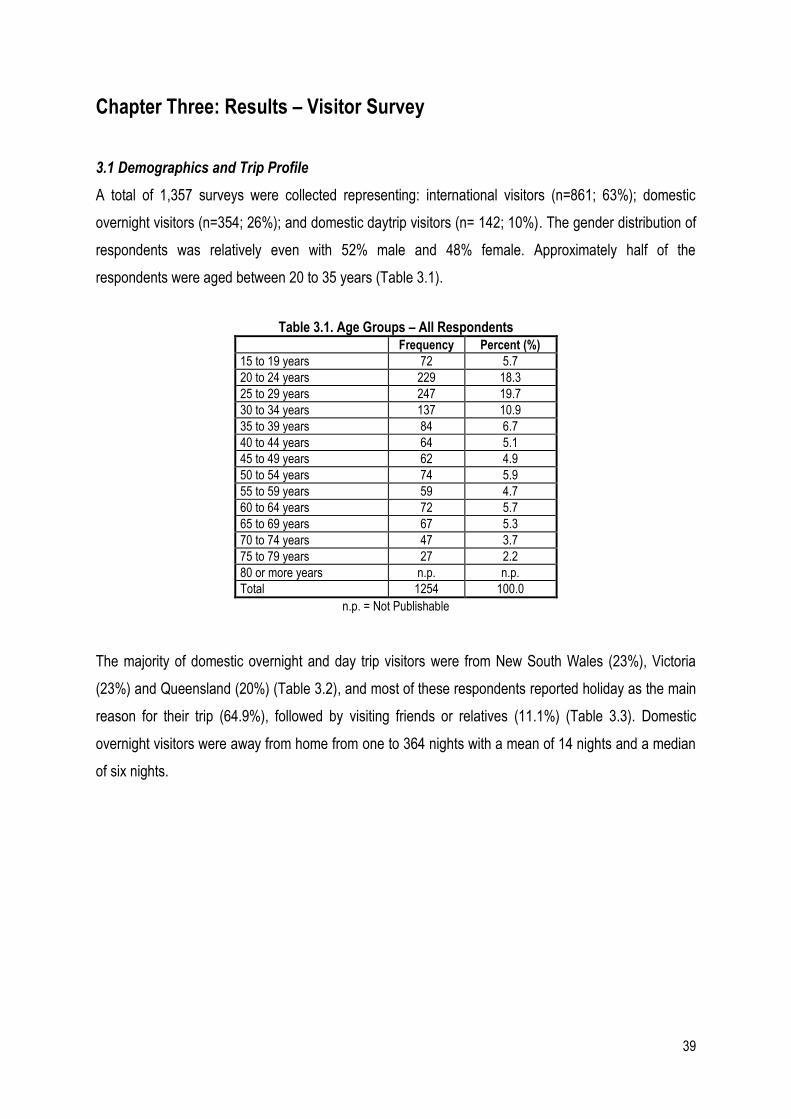
39
Chapter Three: Results – Visitor Survey
3.1 Demographics and Trip Profile
A total of 1,357 surveys were collected representing: international visitors (n=861; 63%); domestic
overnight visitors (n=354; 26%); and domestic daytrip visitors (n= 142; 10%). The gender distribution of
respondents was relatively even with 52% male and 48% female. Approximately half of the
respondents were aged between 20 to 35 years (Table 3.1).
Table 3.1. Age Groups – All Respondents
Frequency Percent (%)
15 to 19 years 72 5.7
20 to 24 years 229 18.3
25 to 29 years 247 19.7
30 to 34 years 137 10.9
35 to 39 years 84 6.7
40 to 44 years 64 5.1
45 to 49 years 62 4.9
50 to 54 years 74 5.9
55 to 59 years 59 4.7
60 to 64 years 72 5.7
65 to 69 years 67 5.3
70 to 74 years 47 3.7
75 to 79 years 27 2.2
80 or more years n.p. n.p.
Total 1254 100.0
n.p. = Not Publishable
The majority of domestic overnight and day trip visitors were from New South Wales (23%), Victoria
(23%) and Queensland (20%) (Table 3.2), and most of these respondents reported holiday as the main
reason for their trip (64.9%), followed by visiting friends or relatives (11.1%) (Table 3.3). Domestic
overnight visitors were away from home from one to 364 nights with a mean of 14 nights and a median
of six nights.
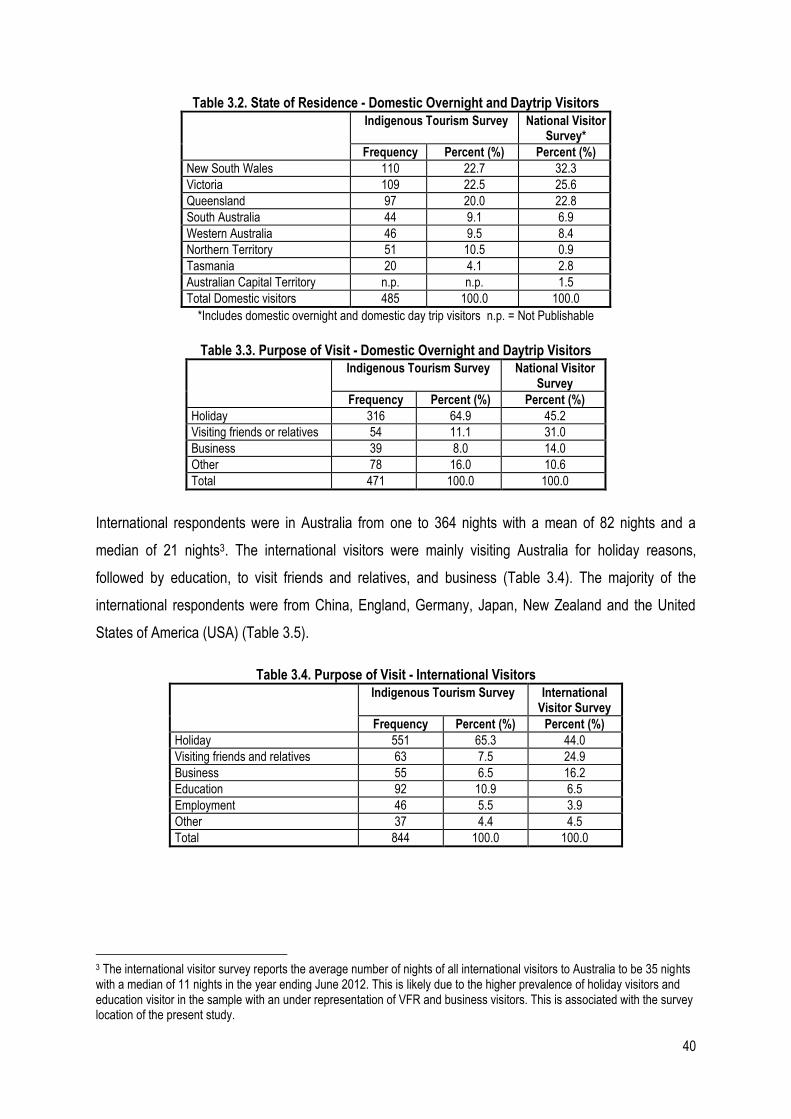
40
Table 3.2. State of Residence - Domestic Overnight and Daytrip Visitors
Indigenous Tourism Survey National Visitor Survey*
Frequency Percent (%) Percent (%)
New South Wales 110 22.7 32.3
Victoria 109 22.5 25.6
Queensland 97 20.0 22.8
South Australia 44 9.1 6.9
Western Australia 46 9.5 8.4
Northern Territory 51 10.5 0.9
Tasmania 20 4.1 2.8
Australian Capital Territory n.p. n.p. 1.5
Total Domestic visitors 485 100.0 100.0
*Includes domestic overnight and domestic day trip visitors n.p. = Not Publishable
Table 3.3. Purpose of Visit - Domestic Overnight and Daytrip Visitors
Indigenous Tourism Survey National Visitor Survey
Frequency Percent (%) Percent (%)
Holiday 316 64.9 45.2
Visiting friends or relatives 54 11.1 31.0
Business 39 8.0 14.0
Other 78 16.0 10.6
Total 471 100.0 100.0
International respondents were in Australia from one to 364 nights with a mean of 82 nights and a
median of 21 nights3. The international visitors were mainly visiting Australia for holiday reasons,
followed by education, to visit friends and relatives, and business (Table 3.4). The majority of the
international respondents were from China, England, Germany, Japan, New Zealand and the United
States of America (USA) (Table 3.5).
Table 3.4. Purpose of Visit - International Visitors
Indigenous Tourism Survey International Visitor Survey
Frequency Percent (%) Percent (%)
Holiday 551 65.3 44.0
Visiting friends and relatives 63 7.5 24.9
Business 55 6.5 16.2
Education 92 10.9 6.5
Employment 46 5.5 3.9
Other 37 4.4 4.5
Total 844 100.0 100.0
3 The international visitor survey reports the average number of nights of all international visitors to Australia to be 35 nights with a median of 11 nights in the year ending June 2012. This is likely due to the higher prevalence of holiday visitors and education visitor in the sample with an under representation of VFR and business visitors. This is associated with the survey location of the present study.
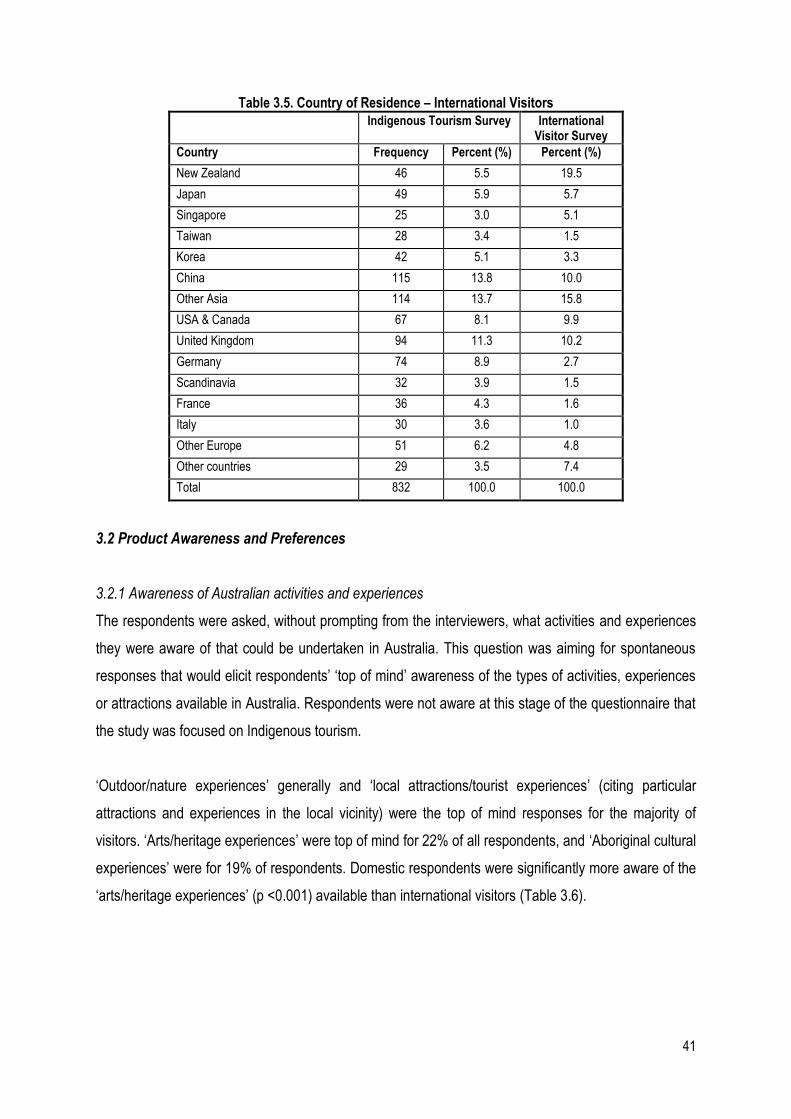
41
Table 3.5. Country of Residence – International Visitors
Indigenous Tourism Survey International Visitor Survey
Country Frequency Percent (%) Percent (%)
New Zealand 46 5.5 19.5
Japan 49 5.9 5.7
Singapore 25 3.0 5.1
Taiwan 28 3.4 1.5
Korea 42 5.1 3.3
China 115 13.8 10.0
Other Asia 114 13.7 15.8
USA & Canada 67 8.1 9.9
United Kingdom 94 11.3 10.2
Germany 74 8.9 2.7
Scandinavia 32 3.9 1.5
France 36 4.3 1.6
Italy 30 3.6 1.0
Other Europe 51 6.2 4.8
Other countries 29 3.5 7.4
Total 832 100.0 100.0
3.2 Product Awareness and Preferences
3.2.1 Awareness of Australian activities and experiences
The respondents were asked, without prompting from the interviewers, what activities and experiences
they were aware of that could be undertaken in Australia. This question was aiming for spontaneous
responses that would elicit respondents’ ‘top of mind’ awareness of the types of activities, experiences
or attractions available in Australia. Respondents were not aware at this stage of the questionnaire that
the study was focused on Indigenous tourism.
‘Outdoor/nature experiences’ generally and ‘local attractions/tourist experiences’ (citing particular
attractions and experiences in the local vicinity) were the top of mind responses for the majority of
visitors. ‘Arts/heritage experiences’ were top of mind for 22% of all respondents, and ‘Aboriginal cultural
experiences’ were for 19% of respondents. Domestic respondents were significantly more aware of the
‘arts/heritage experiences’ (p <0.001) available than international visitors (Table 3.6).
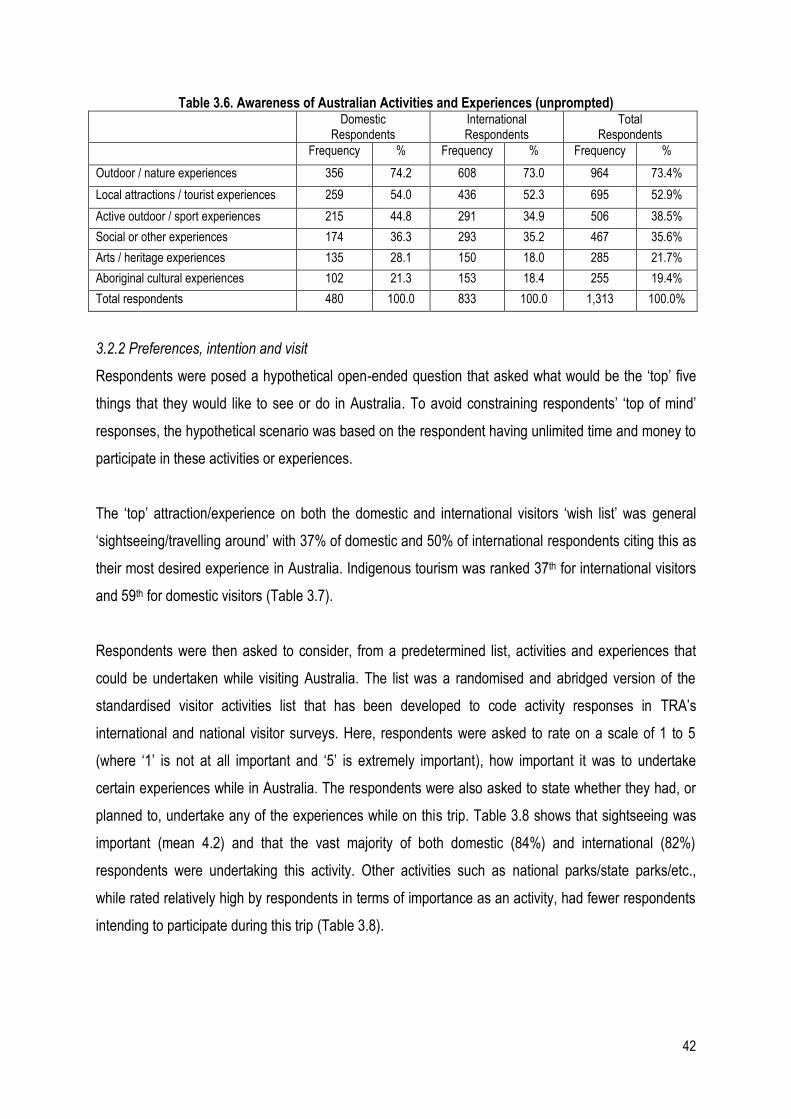
42
Table 3.6. Awareness of Australian Activities and Experiences (unprompted) Domestic
Respondents International Respondents
Total Respondents
Frequency % Frequency % Frequency %
Outdoor / nature experiences 356 74.2 608 73.0 964 73.4%
Local attractions / tourist experiences 259 54.0 436 52.3 695 52.9%
Active outdoor / sport experiences 215 44.8 291 34.9 506 38.5%
Social or other experiences 174 36.3 293 35.2 467 35.6%
Arts / heritage experiences 135 28.1 150 18.0 285 21.7%
Aboriginal cultural experiences 102 21.3 153 18.4 255 19.4%
Total respondents 480 100.0 833 100.0 1,313 100.0%
3.2.2 Preferences, intention and visit
Respondents were posed a hypothetical open-ended question that asked what would be the ‘top’ five
things that they would like to see or do in Australia. To avoid constraining respondents’ ‘top of mind’
responses, the hypothetical scenario was based on the respondent having unlimited time and money to
participate in these activities or experiences.
The ‘top’ attraction/experience on both the domestic and international visitors ‘wish list’ was general
‘sightseeing/travelling around’ with 37% of domestic and 50% of international respondents citing this as
their most desired experience in Australia. Indigenous tourism was ranked 37th for international visitors
and 59th for domestic visitors (Table 3.7).
Respondents were then asked to consider, from a predetermined list, activities and experiences that
could be undertaken while visiting Australia. The list was a randomised and abridged version of the
standardised visitor activities list that has been developed to code activity responses in TRA’s
international and national visitor surveys. Here, respondents were asked to rate on a scale of 1 to 5
(where ‘1’ is not at all important and ‘5’ is extremely important), how important it was to undertake
certain experiences while in Australia. The respondents were also asked to state whether they had, or
planned to, undertake any of the experiences while on this trip. Table 3.8 shows that sightseeing was
important (mean 4.2) and that the vast majority of both domestic (84%) and international (82%)
respondents were undertaking this activity. Other activities such as national parks/state parks/etc.,
while rated relatively high by respondents in terms of importance as an activity, had fewer respondents
intending to participate during this trip (Table 3.8).
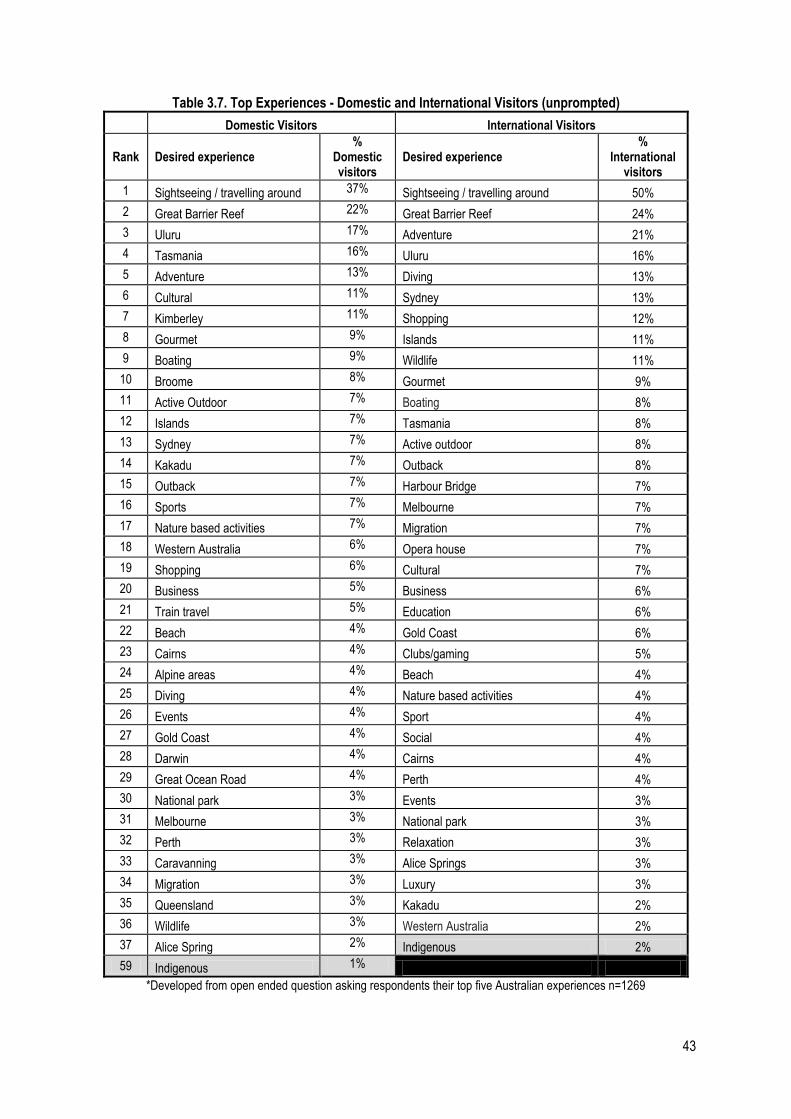
43
Table 3.7. Top Experiences - Domestic and International Visitors (unprompted)
Domestic Visitors International Visitors
Rank Desired experience %
Domestic visitors
Desired experience %
International visitors
1 Sightseeing / travelling around 37% Sightseeing / travelling around 50%
2 Great Barrier Reef 22% Great Barrier Reef 24%
3 Uluru 17% Adventure 21%
4 Tasmania 16% Uluru 16%
5 Adventure 13% Diving 13%
6 Cultural 11% Sydney 13%
7 Kimberley 11% Shopping 12%
8 Gourmet 9% Islands 11%
9 Boating 9% Wildlife 11%
10 Broome 8% Gourmet 9%
11 Active Outdoor 7% Boating 8%
12 Islands 7% Tasmania 8%
13 Sydney 7% Active outdoor 8%
14 Kakadu 7% Outback 8%
15 Outback 7% Harbour Bridge 7%
16 Sports 7% Melbourne 7%
17 Nature based activities 7% Migration 7%
18 Western Australia 6% Opera house 7%
19 Shopping 6% Cultural 7%
20 Business 5% Business 6%
21 Train travel 5% Education 6%
22 Beach 4% Gold Coast 6%
23 Cairns 4% Clubs/gaming 5%
24 Alpine areas 4% Beach 4%
25 Diving 4% Nature based activities 4%
26 Events 4% Sport 4%
27 Gold Coast 4% Social 4%
28 Darwin 4% Cairns 4%
29 Great Ocean Road 4% Perth 4%
30 National park 3% Events 3%
31 Melbourne 3% National park 3%
32 Perth 3% Relaxation 3%
33 Caravanning 3% Alice Springs 3%
34 Migration 3% Luxury 3%
35 Queensland 3% Kakadu 2%
36 Wildlife 3% Western Australia 2%
37 Alice Spring 2% Indigenous 2%
59 Indigenous 1%
*Developed from open ended question asking respondents their top five Australian experiences n=1269
44
Again, respondents were not aware at this point that the survey was focused on Indigenous tourism
although five of the experience options in the list related to Indigenous tourism. ‘Going on a tour with an
Aboriginal guide’, ‘visit and Aboriginal cultural centre/gallery’, ‘see an Aboriginal performance’, and ‘visit
and Aboriginal site or community’ ranked around the midpoint of the scale with means of 3.1 and 3.0 for
all visitors. Somewhat further down the importance scale was to ‘stay with an Aboriginal host’. For
domestic visitors few had intentions to participate in Indigenous activities: ‘going on a tour with an
Aboriginal guide’ 10%; ‘visit and Aboriginal cultural centre/gallery’ 14%; ‘see an Aboriginal performance’
10%; ‘visit and Aboriginal site or community’ 10%; and, ‘stay with an Aboriginal host’ 3%. For
international visitors ‘visit an Aboriginal cultural centre/gallery’ and ‘see an Aboriginal performance’
were more popular at 20% and 18% respectively (Table 3.8).
For each of the Indigenous related activities domestic respondents were significantly less likely than
international respondents to consider it important to:
go on a tour with an Aboriginal Guide (p=0.013).
stay with an Aboriginal host (in Aboriginal owned/run accommodation) (p=0.001).
visit an Aboriginal cultural centre/gallery (p<0.001).
see an Aboriginal performance (p<0.001).
visit an Aboriginal site or community (p=0.001)
In contrast, there were no significant differences found between domestic and international respondents
in terms of how important it was to them to visit national parks/state parks/world heritage sites/botanical
gardens; events, festivals, fairs and markets; shopping; museums, art galleries, history/heritage
buildings, sites or monuments; and, visit the Outback (Table 3.8).
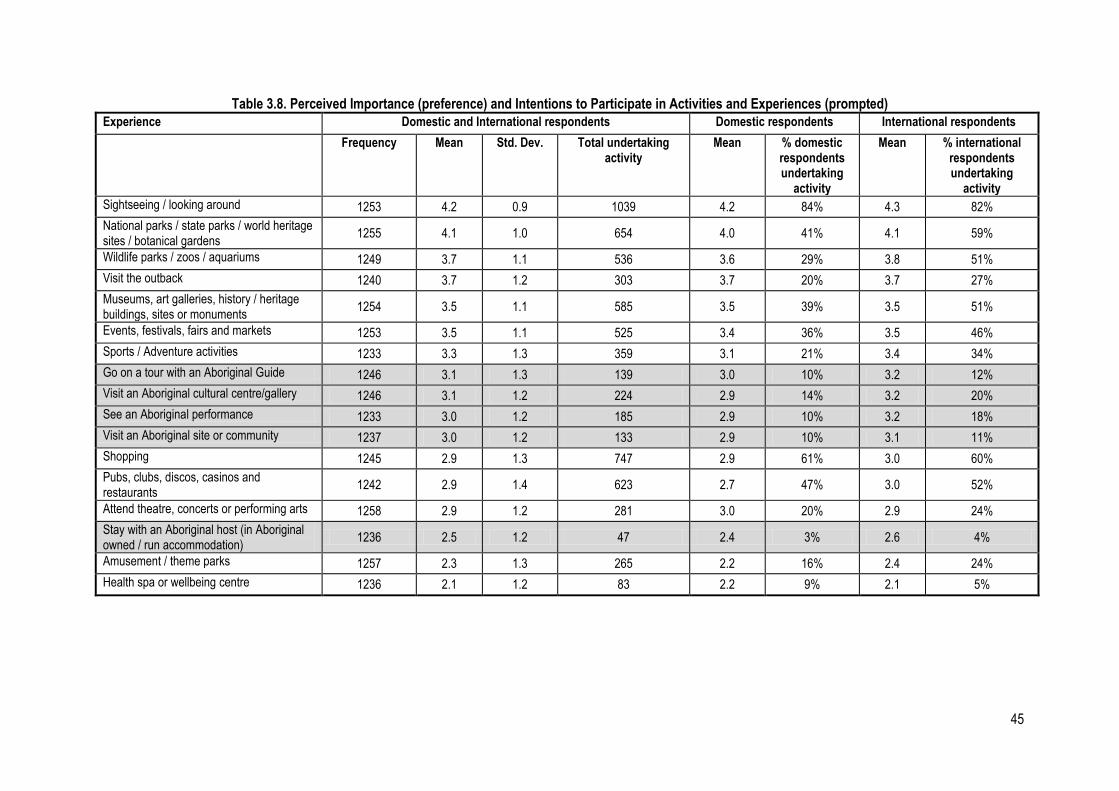
45
Table 3.8. Perceived Importance (preference) and Intentions to Participate in Activities and Experiences (prompted)
Experience Domestic and International respondents Domestic respondents International respondents
Frequency Mean Std. Dev. Total undertaking activity
Mean % domestic respondents undertaking
activity
Mean % international respondents undertaking
activity
Sightseeing / looking around 1253 4.2 0.9 1039 4.2 84% 4.3 82%
National parks / state parks / world heritage sites / botanical gardens
1255 4.1 1.0 654 4.0 41% 4.1 59%
Wildlife parks / zoos / aquariums 1249 3.7 1.1 536 3.6 29% 3.8 51%
Visit the outback 1240 3.7 1.2 303 3.7 20% 3.7 27%
Museums, art galleries, history / heritage buildings, sites or monuments
1254 3.5 1.1 585 3.5 39% 3.5 51%
Events, festivals, fairs and markets 1253 3.5 1.1 525 3.4 36% 3.5 46%
Sports / Adventure activities 1233 3.3 1.3 359 3.1 21% 3.4 34%
Go on a tour with an Aboriginal Guide 1246 3.1 1.3 139 3.0 10% 3.2 12%
Visit an Aboriginal cultural centre/gallery 1246 3.1 1.2 224 2.9 14% 3.2 20%
See an Aboriginal performance 1233 3.0 1.2 185 2.9 10% 3.2 18%
Visit an Aboriginal site or community 1237 3.0 1.2 133 2.9 10% 3.1 11%
Shopping 1245 2.9 1.3 747 2.9 61% 3.0 60%
Pubs, clubs, discos, casinos and restaurants
1242 2.9 1.4 623 2.7 47% 3.0 52%
Attend theatre, concerts or performing arts 1258 2.9 1.2 281 3.0 20% 2.9 24%
Stay with an Aboriginal host (in Aboriginal owned / run accommodation)
1236 2.5 1.2 47 2.4 3% 2.6 4%
Amusement / theme parks 1257 2.3 1.3 265 2.2 16% 2.4 24%
Health spa or wellbeing centre 1236 2.1 1.2 83 2.2 9% 2.1 5%
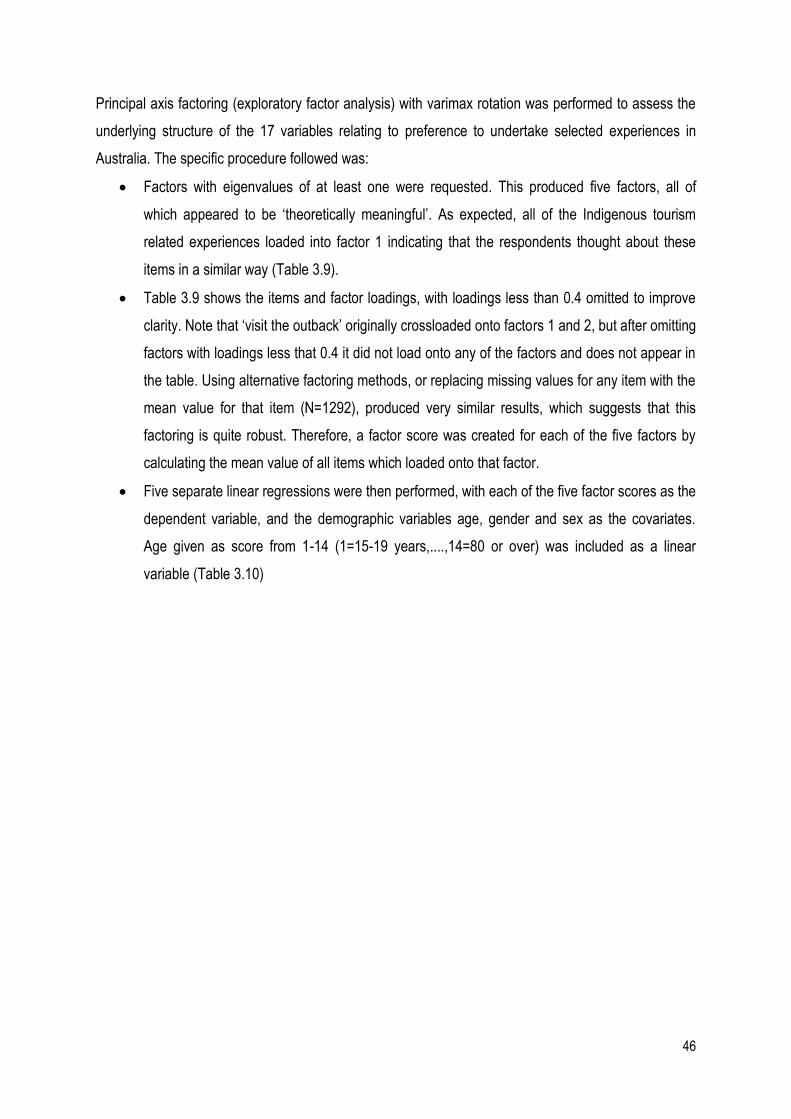
46
Principal axis factoring (exploratory factor analysis) with varimax rotation was performed to assess the
underlying structure of the 17 variables relating to preference to undertake selected experiences in
Australia. The specific procedure followed was:
Factors with eigenvalues of at least one were requested. This produced five factors, all of
which appeared to be ‘theoretically meaningful’. As expected, all of the Indigenous tourism
related experiences loaded into factor 1 indicating that the respondents thought about these
items in a similar way (Table 3.9).
Table 3.9 shows the items and factor loadings, with loadings less than 0.4 omitted to improve
clarity. Note that ‘visit the outback’ originally crossloaded onto factors 1 and 2, but after omitting
factors with loadings less that 0.4 it did not load onto any of the factors and does not appear in
the table. Using alternative factoring methods, or replacing missing values for any item with the
mean value for that item (N=1292), produced very similar results, which suggests that this
factoring is quite robust. Therefore, a factor score was created for each of the five factors by
calculating the mean value of all items which loaded onto that factor.
Five separate linear regressions were then performed, with each of the five factor scores as the
dependent variable, and the demographic variables age, gender and sex as the covariates.
Age given as score from 1-14 (1=15-19 years,....,14=80 or over) was included as a linear
variable (Table 3.10)
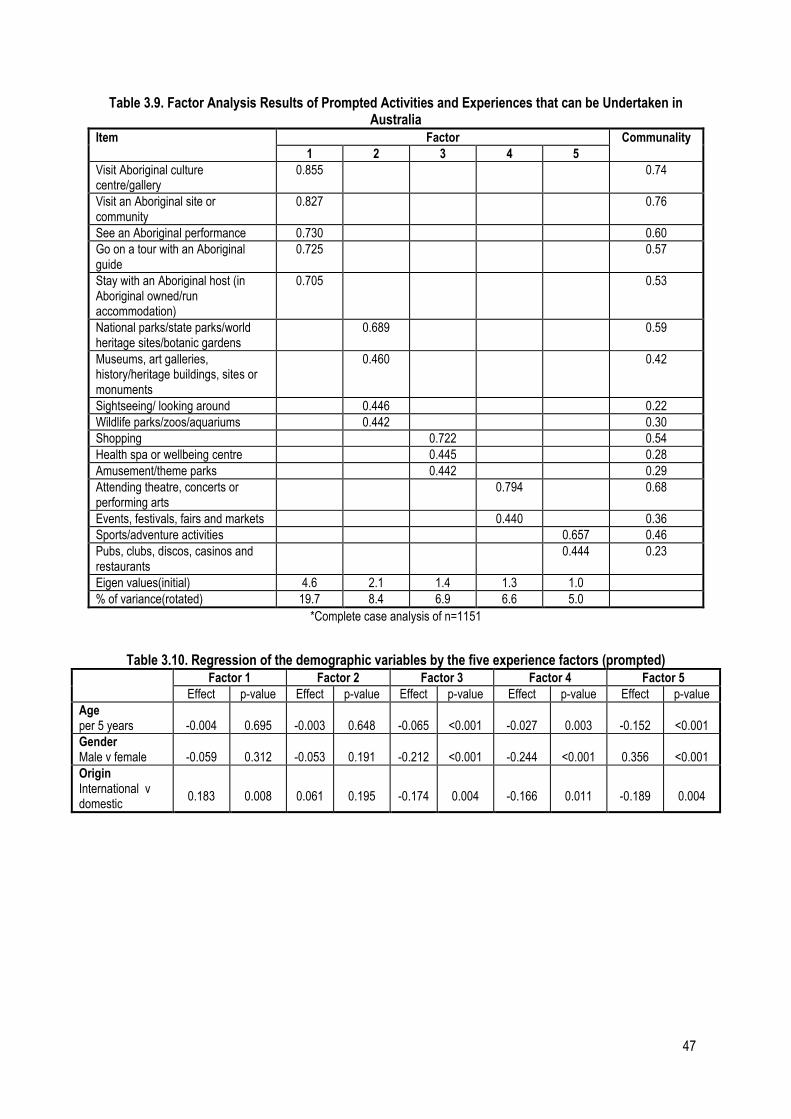
47
Table 3.9. Factor Analysis Results of Prompted Activities and Experiences that can be Undertaken in Australia
Item Factor Communality
1 2 3 4 5
Visit Aboriginal culture centre/gallery
0.855 0.74
Visit an Aboriginal site or community
0.827 0.76
See an Aboriginal performance 0.730 0.60
Go on a tour with an Aboriginal guide
0.725 0.57
Stay with an Aboriginal host (in Aboriginal owned/run accommodation)
0.705 0.53
National parks/state parks/world heritage sites/botanic gardens
0.689 0.59
Museums, art galleries, history/heritage buildings, sites or monuments
0.460 0.42
Sightseeing/ looking around 0.446 0.22
Wildlife parks/zoos/aquariums 0.442 0.30
Shopping 0.722 0.54
Health spa or wellbeing centre 0.445 0.28
Amusement/theme parks 0.442 0.29
Attending theatre, concerts or performing arts
0.794 0.68
Events, festivals, fairs and markets 0.440 0.36
Sports/adventure activities 0.657 0.46
Pubs, clubs, discos, casinos and restaurants
0.444 0.23
Eigen values(initial) 4.6 2.1 1.4 1.3 1.0
% of variance(rotated) 19.7 8.4 6.9 6.6 5.0
*Complete case analysis of n=1151
Table 3.10. Regression of the demographic variables by the five experience factors (prompted)
Factor 1 Factor 2 Factor 3 Factor 4 Factor 5
Effect p-value Effect p-value Effect p-value Effect p-value Effect p-value
Age per 5 years
-0.004
0.695
-0.003
0.648
-0.065
<0.001
-0.027
0.003
-0.152
<0.001
Gender Male v female
-0.059
0.312
-0.053
0.191
-0.212
<0.001
-0.244
<0.001
0.356
<0.001
Origin International v domestic
0.183
0.008
0.061
0.195
-0.174
0.004
-0.166
0.011
-0.189
0.004
48
The key findings of the factor analysis regarding preferences to undertake selected Australian
experiences include:
There was no evidence that preference for Indigenous tourism (factor 1) was related to age or
gender, but it appeared that international visitors on average, scored 0.183 points more highly
on this factor than domestic visitors (p=0.008). This means that international visitors are more
likely to have a preference to undertake Indigenous experiences then domestic visitors.
There was no evidence that sightseeing/looking around (factor 2) was related to age, gender or
visitor type (domestic/international).
However, shopping/spa/theme parks (factor 3) appeared to be related to age, gender and
origin. On average, older people scored less on this factor than younger people (0.065 points
per 5 years of age; p<0.001). Males scored on average, 0.212 points less than females on this
factor (p<0.001). International travellers scored on average, 0.174 points less than domestic
travellers on this factor (p=0.004).
Culture/events (factor 4) appeared to be related to age, gender and origin. On average, older
people scored less on this factor than younger people (0.027 points per 5 years of age;
p=0.003). Males scored on average, 0.244 points less than females on this factor (p<0.001).
International travellers scored on average, 0.166 points less than domestic travellers on this
factor (p=0.011).
Sport/social (factor 5) appeared to be related to age, gender and origin. On average, older
people scored less on this factor than younger people (0.152 points per 5 years of age;
p<0.001). Males scored on average, 0.356 points more than females on this factor (p<0.001).
International travellers scored on average, 0.189 points less than domestic travellers on this
factor (p=0.004).
3.2.3 Respondents not participating in an Indigenous experience
Those who indicated that they were not going to undertake one of the five Indigenous experiences in
the preferences and intentions questions (domestic n = 358; international n = 540) (Table 3.11) were
directed to a series of additional questions.
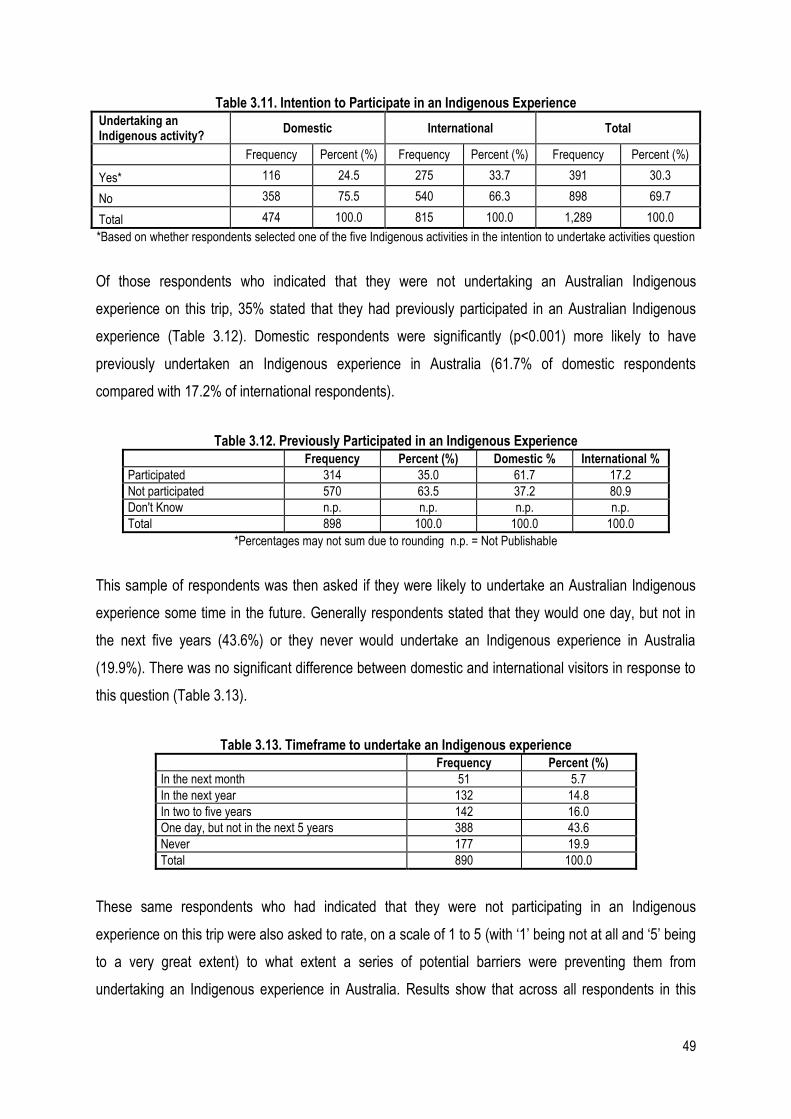
49
Table 3.11. Intention to Participate in an Indigenous Experience
Undertaking an Indigenous activity?
Domestic International Total
Frequency Percent (%) Frequency Percent (%) Frequency Percent (%)
Yes* 116 24.5 275 33.7 391 30.3
No 358 75.5 540 66.3 898 69.7
Total 474 100.0 815 100.0 1,289 100.0
*Based on whether respondents selected one of the five Indigenous activities in the intention to undertake activities question
Of those respondents who indicated that they were not undertaking an Australian Indigenous
experience on this trip, 35% stated that they had previously participated in an Australian Indigenous
experience (Table 3.12). Domestic respondents were significantly (p<0.001) more likely to have
previously undertaken an Indigenous experience in Australia (61.7% of domestic respondents
compared with 17.2% of international respondents).
Table 3.12. Previously Participated in an Indigenous Experience
Frequency Percent (%) Domestic % International %
Participated 314 35.0 61.7 17.2
Not participated 570 63.5 37.2 80.9
Don't Know n.p. n.p. n.p. n.p.
Total 898 100.0 100.0 100.0
*Percentages may not sum due to rounding n.p. = Not Publishable
This sample of respondents was then asked if they were likely to undertake an Australian Indigenous
experience some time in the future. Generally respondents stated that they would one day, but not in
the next five years (43.6%) or they never would undertake an Indigenous experience in Australia
(19.9%). There was no significant difference between domestic and international visitors in response to
this question (Table 3.13).
Table 3.13. Timeframe to undertake an Indigenous experience
Frequency Percent (%)
In the next month 51 5.7
In the next year 132 14.8
In two to five years 142 16.0
One day, but not in the next 5 years 388 43.6
Never 177 19.9
Total 890 100.0
These same respondents who had indicated that they were not participating in an Indigenous
experience on this trip were also asked to rate, on a scale of 1 to 5 (with ‘1’ being not at all and ‘5’ being
to a very great extent) to what extent a series of potential barriers were preventing them from
undertaking an Indigenous experience in Australia. Results show that across all respondents in this
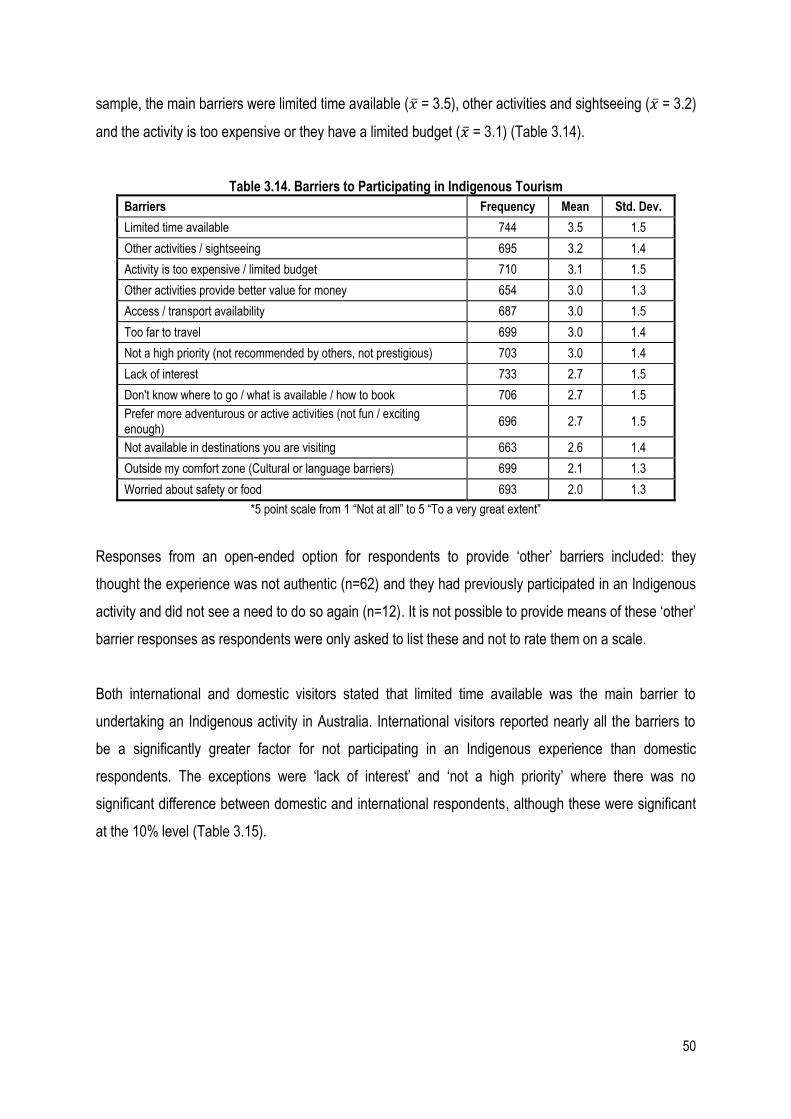
50
sample, the main barriers were limited time available ( ̅ = 3.5), other activities and sightseeing ( ̅ = 3.2)
and the activity is too expensive or they have a limited budget ( ̅ = 3.1) (Table 3.14).
Table 3.14. Barriers to Participating in Indigenous Tourism
Barriers Frequency Mean Std. Dev.
Limited time available 744 3.5 1.5
Other activities / sightseeing 695 3.2 1.4
Activity is too expensive / limited budget 710 3.1 1.5
Other activities provide better value for money 654 3.0 1.3
Access / transport availability 687 3.0 1.5
Too far to travel 699 3.0 1.4
Not a high priority (not recommended by others, not prestigious) 703 3.0 1.4
Lack of interest 733 2.7 1.5
Don't know where to go / what is available / how to book 706 2.7 1.5
Prefer more adventurous or active activities (not fun / exciting enough)
696 2.7 1.5
Not available in destinations you are visiting 663 2.6 1.4
Outside my comfort zone (Cultural or language barriers) 699 2.1 1.3
Worried about safety or food 693 2.0 1.3
*5 point scale from 1 “Not at all” to 5 “To a very great extent”
Responses from an open-ended option for respondents to provide ‘other’ barriers included: they
thought the experience was not authentic (n=62) and they had previously participated in an Indigenous
activity and did not see a need to do so again (n=12). It is not possible to provide means of these ‘other’
barrier responses as respondents were only asked to list these and not to rate them on a scale.
Both international and domestic visitors stated that limited time available was the main barrier to
undertaking an Indigenous activity in Australia. International visitors reported nearly all the barriers to
be a significantly greater factor for not participating in an Indigenous experience than domestic
respondents. The exceptions were ‘lack of interest’ and ‘not a high priority’ where there was no
significant difference between domestic and international respondents, although these were significant
at the 10% level (Table 3.15).
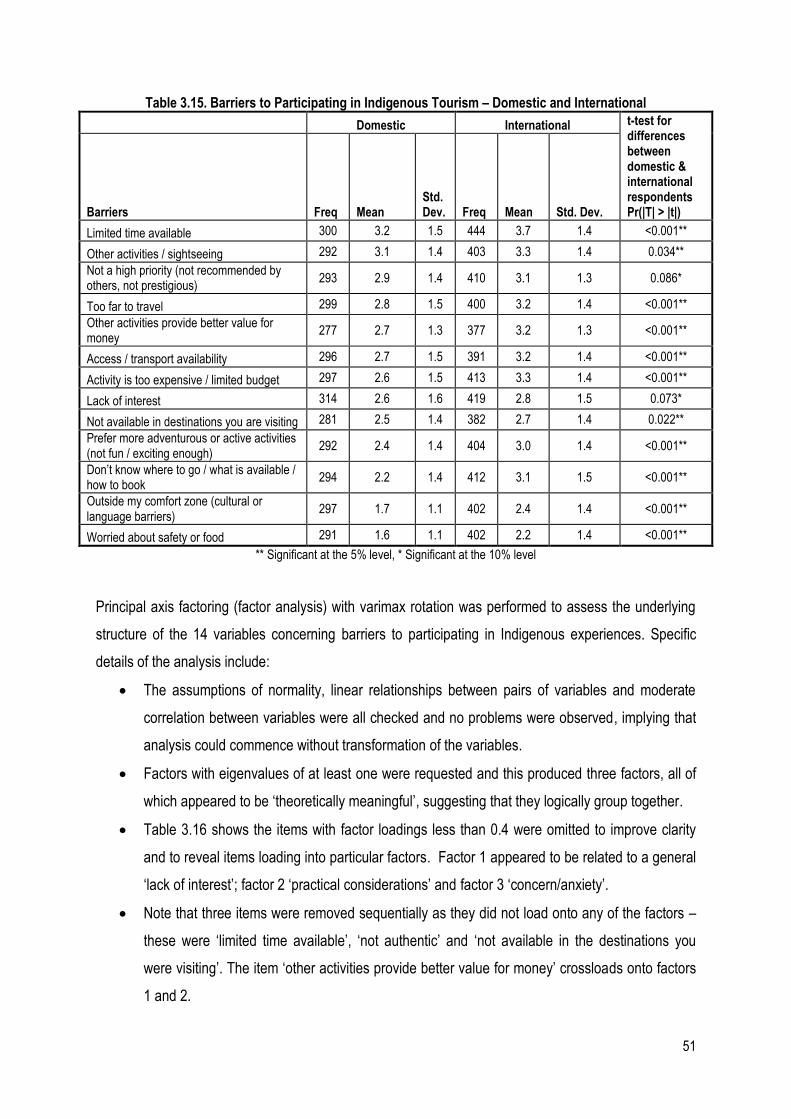
51
Table 3.15. Barriers to Participating in Indigenous Tourism – Domestic and International
Domestic International t-test for
differences between domestic & international respondents Pr(|T| > |t|) Barriers Freq Mean
Std. Dev. Freq Mean Std. Dev.
Limited time available 300 3.2 1.5 444 3.7 1.4 <0.001**
Other activities / sightseeing 292 3.1 1.4 403 3.3 1.4 0.034**
Not a high priority (not recommended by others, not prestigious)
293 2.9 1.4 410 3.1 1.3 0.086*
Too far to travel 299 2.8 1.5 400 3.2 1.4 <0.001**
Other activities provide better value for money
277 2.7 1.3 377 3.2 1.3 <0.001**
Access / transport availability 296 2.7 1.5 391 3.2 1.4 <0.001**
Activity is too expensive / limited budget 297 2.6 1.5 413 3.3 1.4 <0.001**
Lack of interest 314 2.6 1.6 419 2.8 1.5 0.073*
Not available in destinations you are visiting 281 2.5 1.4 382 2.7 1.4 0.022**
Prefer more adventurous or active activities (not fun / exciting enough)
292 2.4 1.4 404 3.0 1.4 <0.001**
Don’t know where to go / what is available / how to book
294 2.2 1.4 412 3.1 1.5 <0.001**
Outside my comfort zone (cultural or language barriers)
297 1.7 1.1 402 2.4 1.4 <0.001**
Worried about safety or food 291 1.6 1.1 402 2.2 1.4 <0.001**
** Significant at the 5% level, * Significant at the 10% level
Principal axis factoring (factor analysis) with varimax rotation was performed to assess the underlying
structure of the 14 variables concerning barriers to participating in Indigenous experiences. Specific
details of the analysis include:
The assumptions of normality, linear relationships between pairs of variables and moderate
correlation between variables were all checked and no problems were observed, implying that
analysis could commence without transformation of the variables.
Factors with eigenvalues of at least one were requested and this produced three factors, all of
which appeared to be ‘theoretically meaningful’, suggesting that they logically group together.
Table 3.16 shows the items with factor loadings less than 0.4 were omitted to improve clarity
and to reveal items loading into particular factors. Factor 1 appeared to be related to a general
‘lack of interest’; factor 2 ‘practical considerations’ and factor 3 ‘concern/anxiety’.
Note that three items were removed sequentially as they did not load onto any of the factors –
these were ‘limited time available’, ‘not authentic’ and ‘not available in the destinations you
were visiting’. The item ‘other activities provide better value for money’ crossloads onto factors
1 and 2.
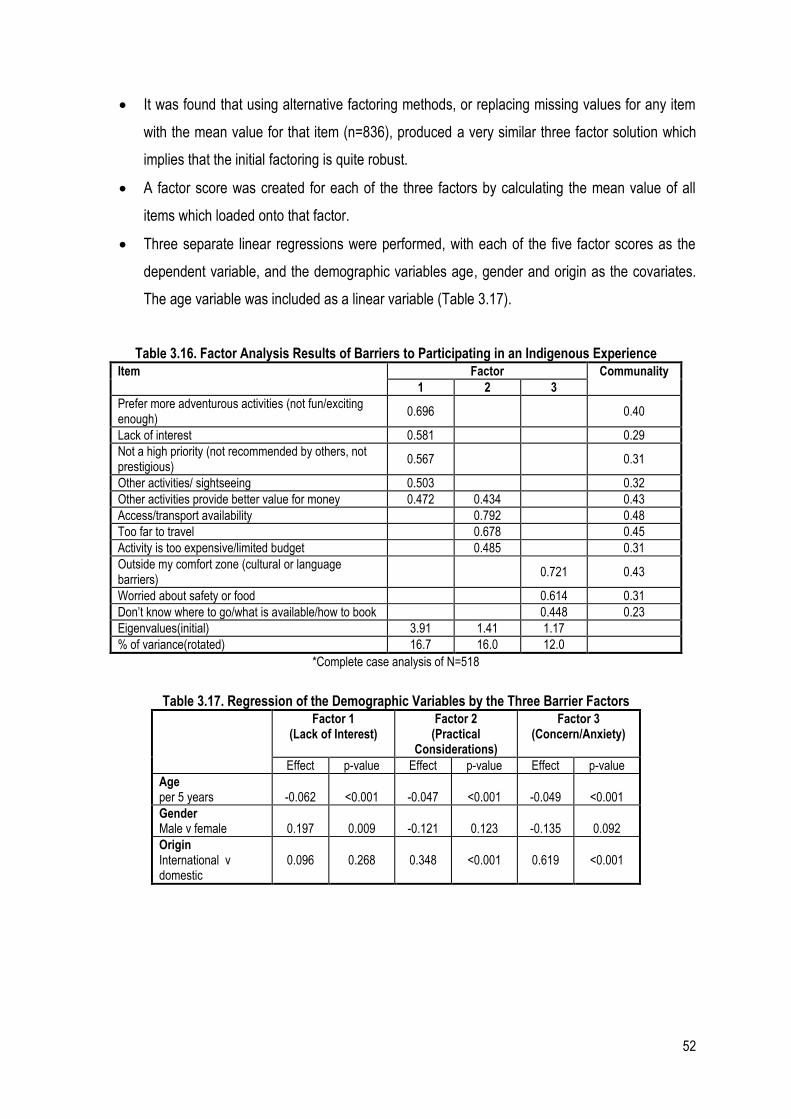
52
It was found that using alternative factoring methods, or replacing missing values for any item
with the mean value for that item (n=836), produced a very similar three factor solution which
implies that the initial factoring is quite robust.
A factor score was created for each of the three factors by calculating the mean value of all
items which loaded onto that factor.
Three separate linear regressions were performed, with each of the five factor scores as the
dependent variable, and the demographic variables age, gender and origin as the covariates.
The age variable was included as a linear variable (Table 3.17).
Table 3.16. Factor Analysis Results of Barriers to Participating in an Indigenous Experience
Item Factor Communality
1 2 3
Prefer more adventurous activities (not fun/exciting enough)
0.696 0.40
Lack of interest 0.581 0.29
Not a high priority (not recommended by others, not prestigious)
0.567 0.31
Other activities/ sightseeing 0.503 0.32
Other activities provide better value for money 0.472 0.434 0.43
Access/transport availability 0.792 0.48
Too far to travel 0.678 0.45
Activity is too expensive/limited budget 0.485 0.31
Outside my comfort zone (cultural or language barriers)
0.721 0.43
Worried about safety or food 0.614 0.31
Don’t know where to go/what is available/how to book 0.448 0.23
Eigenvalues(initial) 3.91 1.41 1.17
% of variance(rotated) 16.7 16.0 12.0
*Complete case analysis of N=518
Table 3.17. Regression of the Demographic Variables by the Three Barrier Factors
Factor 1 (Lack of Interest)
Factor 2 (Practical
Considerations)
Factor 3 (Concern/Anxiety)
Effect p-value Effect p-value Effect p-value
Age per 5 years
-0.062
<0.001
-0.047
<0.001
-0.049
<0.001
Gender Male v female
0.197
0.009
-0.121
0.123
-0.135
0.092
Origin International v domestic
0.096
0.268
0.348
<0.001
0.619
<0.001
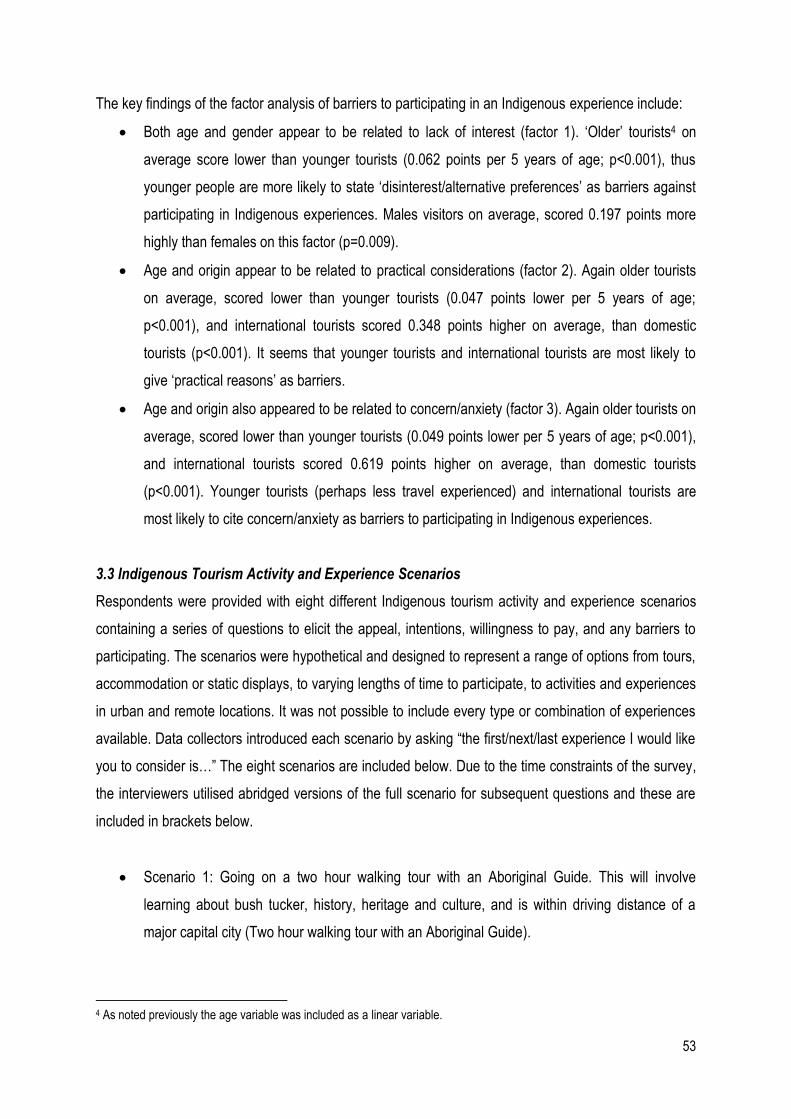
53
The key findings of the factor analysis of barriers to participating in an Indigenous experience include:
Both age and gender appear to be related to lack of interest (factor 1). ‘Older’ tourists4 on
average score lower than younger tourists (0.062 points per 5 years of age; p<0.001), thus
younger people are more likely to state ‘disinterest/alternative preferences’ as barriers against
participating in Indigenous experiences. Males visitors on average, scored 0.197 points more
highly than females on this factor (p=0.009).
Age and origin appear to be related to practical considerations (factor 2). Again older tourists
on average, scored lower than younger tourists (0.047 points lower per 5 years of age;
p<0.001), and international tourists scored 0.348 points higher on average, than domestic
tourists (p<0.001). It seems that younger tourists and international tourists are most likely to
give ‘practical reasons’ as barriers.
Age and origin also appeared to be related to concern/anxiety (factor 3). Again older tourists on
average, scored lower than younger tourists (0.049 points lower per 5 years of age; p<0.001),
and international tourists scored 0.619 points higher on average, than domestic tourists
(p<0.001). Younger tourists (perhaps less travel experienced) and international tourists are
most likely to cite concern/anxiety as barriers to participating in Indigenous experiences.
3.3 Indigenous Tourism Activity and Experience Scenarios
Respondents were provided with eight different Indigenous tourism activity and experience scenarios
containing a series of questions to elicit the appeal, intentions, willingness to pay, and any barriers to
participating. The scenarios were hypothetical and designed to represent a range of options from tours,
accommodation or static displays, to varying lengths of time to participate, to activities and experiences
in urban and remote locations. It was not possible to include every type or combination of experiences
available. Data collectors introduced each scenario by asking “the first/next/last experience I would like
you to consider is…” The eight scenarios are included below. Due to the time constraints of the survey,
the interviewers utilised abridged versions of the full scenario for subsequent questions and these are
included in brackets below.
Scenario 1: Going on a two hour walking tour with an Aboriginal Guide. This will involve
learning about bush tucker, history, heritage and culture, and is within driving distance of a
major capital city (Two hour walking tour with an Aboriginal Guide).
4 As noted previously the age variable was included as a linear variable.
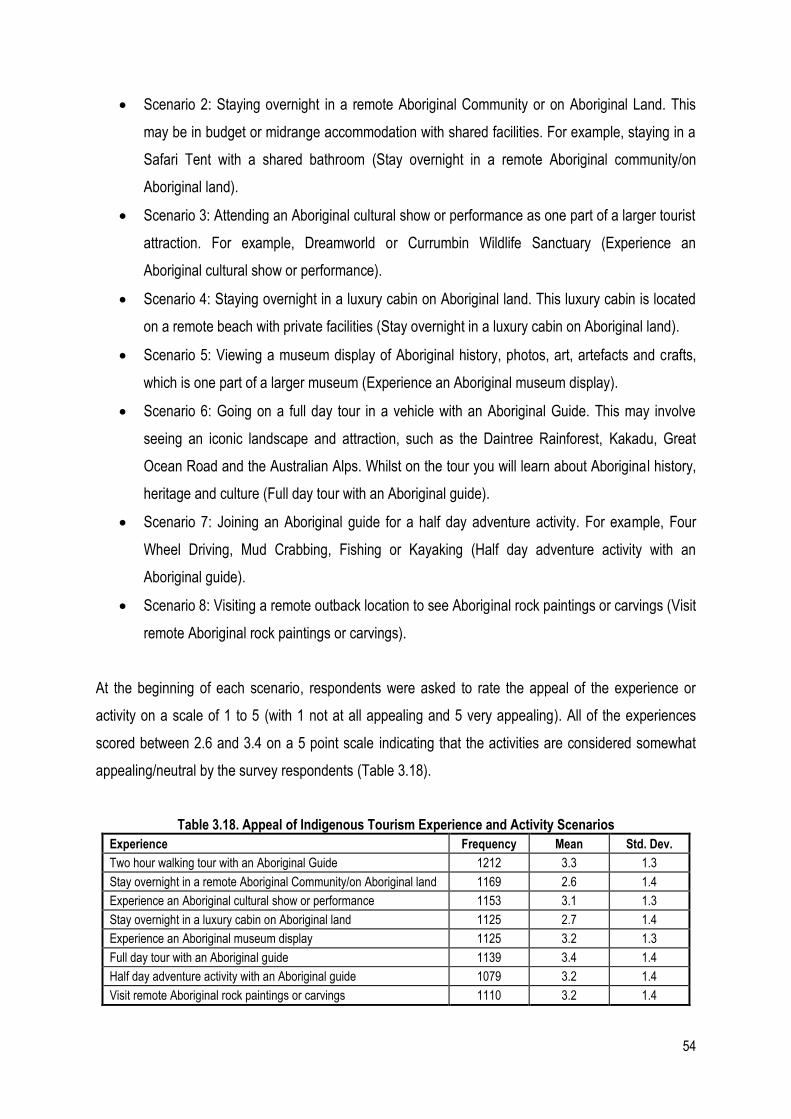
54
Scenario 2: Staying overnight in a remote Aboriginal Community or on Aboriginal Land. This
may be in budget or midrange accommodation with shared facilities. For example, staying in a
Safari Tent with a shared bathroom (Stay overnight in a remote Aboriginal community/on
Aboriginal land).
Scenario 3: Attending an Aboriginal cultural show or performance as one part of a larger tourist
attraction. For example, Dreamworld or Currumbin Wildlife Sanctuary (Experience an
Aboriginal cultural show or performance).
Scenario 4: Staying overnight in a luxury cabin on Aboriginal land. This luxury cabin is located
on a remote beach with private facilities (Stay overnight in a luxury cabin on Aboriginal land).
Scenario 5: Viewing a museum display of Aboriginal history, photos, art, artefacts and crafts,
which is one part of a larger museum (Experience an Aboriginal museum display).
Scenario 6: Going on a full day tour in a vehicle with an Aboriginal Guide. This may involve
seeing an iconic landscape and attraction, such as the Daintree Rainforest, Kakadu, Great
Ocean Road and the Australian Alps. Whilst on the tour you will learn about Aboriginal history,
heritage and culture (Full day tour with an Aboriginal guide).
Scenario 7: Joining an Aboriginal guide for a half day adventure activity. For example, Four
Wheel Driving, Mud Crabbing, Fishing or Kayaking (Half day adventure activity with an
Aboriginal guide).
Scenario 8: Visiting a remote outback location to see Aboriginal rock paintings or carvings (Visit
remote Aboriginal rock paintings or carvings).
At the beginning of each scenario, respondents were asked to rate the appeal of the experience or
activity on a scale of 1 to 5 (with 1 not at all appealing and 5 very appealing). All of the experiences
scored between 2.6 and 3.4 on a 5 point scale indicating that the activities are considered somewhat
appealing/neutral by the survey respondents (Table 3.18).
Table 3.18. Appeal of Indigenous Tourism Experience and Activity Scenarios
Experience Frequency Mean Std. Dev.
Two hour walking tour with an Aboriginal Guide 1212 3.3 1.3
Stay overnight in a remote Aboriginal Community/on Aboriginal land 1169 2.6 1.4
Experience an Aboriginal cultural show or performance 1153 3.1 1.3
Stay overnight in a luxury cabin on Aboriginal land 1125 2.7 1.4
Experience an Aboriginal museum display 1125 3.2 1.3
Full day tour with an Aboriginal guide 1139 3.4 1.4
Half day adventure activity with an Aboriginal guide 1079 3.2 1.4
Visit remote Aboriginal rock paintings or carvings 1110 3.2 1.4
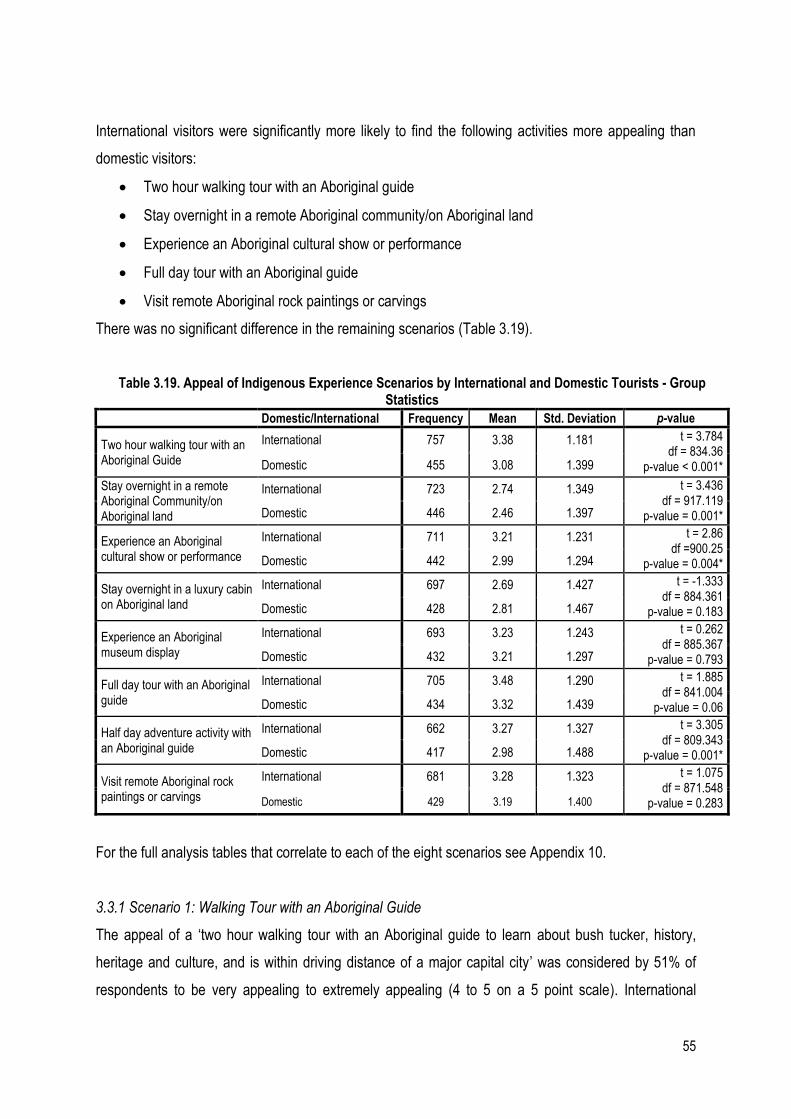
55
International visitors were significantly more likely to find the following activities more appealing than
domestic visitors:
Two hour walking tour with an Aboriginal guide
Stay overnight in a remote Aboriginal community/on Aboriginal land
Experience an Aboriginal cultural show or performance
Full day tour with an Aboriginal guide
Visit remote Aboriginal rock paintings or carvings
There was no significant difference in the remaining scenarios (Table 3.19).
Table 3.19. Appeal of Indigenous Experience Scenarios by International and Domestic Tourists - Group Statistics
Domestic/International Frequency Mean Std. Deviation p-value
Two hour walking tour with an Aboriginal Guide
International 757 3.38 1.181 t = 3.784 df = 834.36
p-value < 0.001* Domestic 455 3.08 1.399
Stay overnight in a remote Aboriginal Community/on Aboriginal land
International 723 2.74 1.349 t = 3.436 df = 917.119
p-value = 0.001* Domestic 446 2.46 1.397
Experience an Aboriginal cultural show or performance
International 711 3.21 1.231 t = 2.86 df =900.25
p-value = 0.004* Domestic 442 2.99 1.294
Stay overnight in a luxury cabin on Aboriginal land
International 697 2.69 1.427 t = -1.333 df = 884.361
p-value = 0.183 Domestic 428 2.81 1.467
Experience an Aboriginal museum display
International 693 3.23 1.243 t = 0.262 df = 885.367
p-value = 0.793 Domestic 432 3.21 1.297
Full day tour with an Aboriginal guide
International 705 3.48 1.290 t = 1.885 df = 841.004
p-value = 0.06 Domestic 434 3.32 1.439
Half day adventure activity with an Aboriginal guide
International 662 3.27 1.327 t = 3.305 df = 809.343
p-value = 0.001* Domestic 417 2.98 1.488
Visit remote Aboriginal rock paintings or carvings
International 681 3.28 1.323 t = 1.075 df = 871.548
p-value = 0.283 Domestic 429 3.19 1.400
For the full analysis tables that correlate to each of the eight scenarios see Appendix 10.
3.3.1 Scenario 1: Walking Tour with an Aboriginal Guide
The appeal of a ‘two hour walking tour with an Aboriginal guide to learn about bush tucker, history,
heritage and culture, and is within driving distance of a major capital city’ was considered by 51% of
respondents to be very appealing to extremely appealing (4 to 5 on a 5 point scale). International
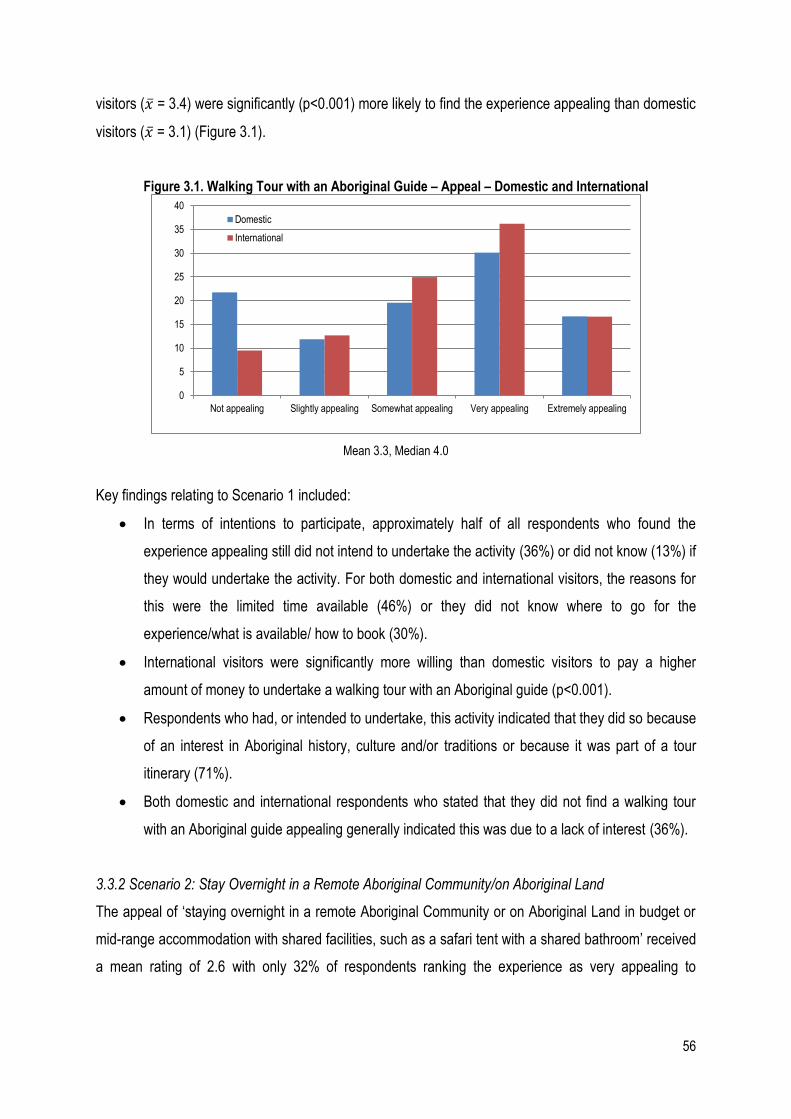
56
visitors ( ̅ = 3.4) were significantly (p<0.001) more likely to find the experience appealing than domestic
visitors ( ̅ = 3.1) (Figure 3.1).
Figure 3.1. Walking Tour with an Aboriginal Guide – Appeal – Domestic and International
Mean 3.3, Median 4.0
Key findings relating to Scenario 1 included:
In terms of intentions to participate, approximately half of all respondents who found the
experience appealing still did not intend to undertake the activity (36%) or did not know (13%) if
they would undertake the activity. For both domestic and international visitors, the reasons for
this were the limited time available (46%) or they did not know where to go for the
experience/what is available/ how to book (30%).
International visitors were significantly more willing than domestic visitors to pay a higher
amount of money to undertake a walking tour with an Aboriginal guide (p<0.001).
Respondents who had, or intended to undertake, this activity indicated that they did so because
of an interest in Aboriginal history, culture and/or traditions or because it was part of a tour
itinerary (71%).
Both domestic and international respondents who stated that they did not find a walking tour
with an Aboriginal guide appealing generally indicated this was due to a lack of interest (36%).
3.3.2 Scenario 2: Stay Overnight in a Remote Aboriginal Community/on Aboriginal Land
The appeal of ‘staying overnight in a remote Aboriginal Community or on Aboriginal Land in budget or
mid-range accommodation with shared facilities, such as a safari tent with a shared bathroom’ received
a mean rating of 2.6 with only 32% of respondents ranking the experience as very appealing to
0
5
10
15
20
25
30
35
40
Not appealing Slightly appealing Somewhat appealing Very appealing Extremely appealing
Domestic
International
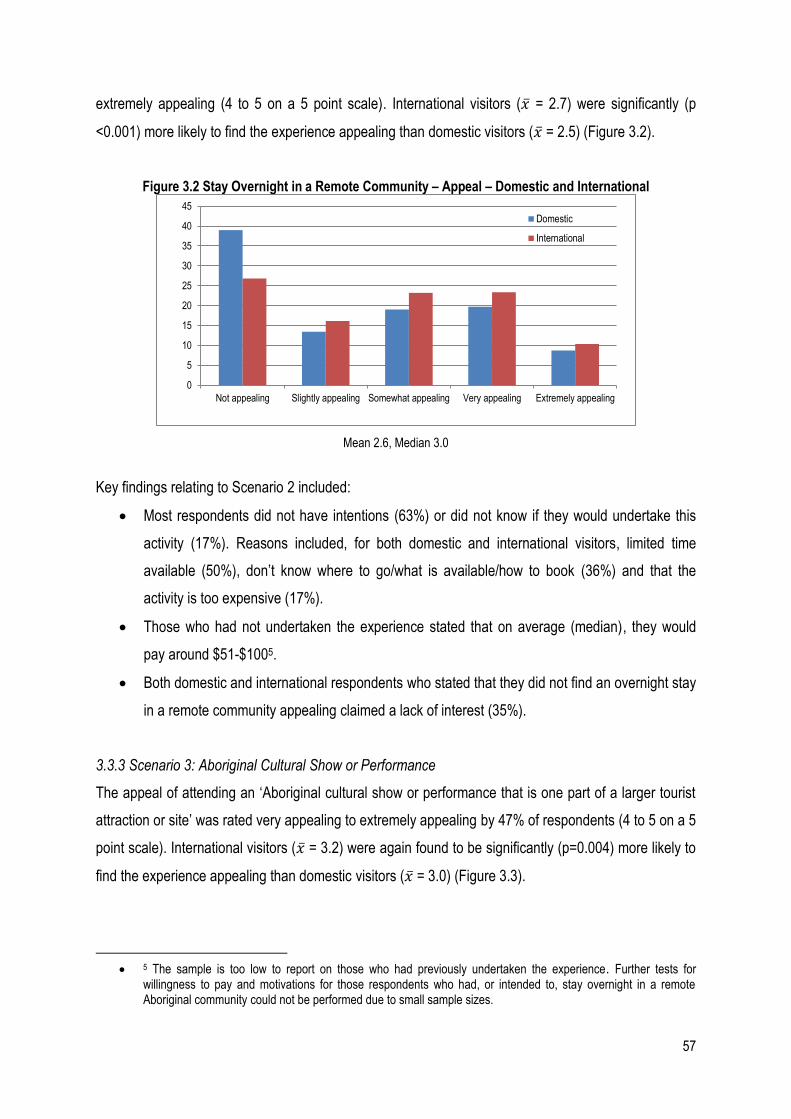
57
extremely appealing (4 to 5 on a 5 point scale). International visitors ( ̅ = 2.7) were significantly (p
<0.001) more likely to find the experience appealing than domestic visitors ( ̅ = 2.5) (Figure 3.2).
Figure 3.2 Stay Overnight in a Remote Community – Appeal – Domestic and International
Mean 2.6, Median 3.0
Key findings relating to Scenario 2 included:
Most respondents did not have intentions (63%) or did not know if they would undertake this
activity (17%). Reasons included, for both domestic and international visitors, limited time
available (50%), don’t know where to go/what is available/how to book (36%) and that the
activity is too expensive (17%).
Those who had not undertaken the experience stated that on average (median), they would
pay around $51-$1005.
Both domestic and international respondents who stated that they did not find an overnight stay
in a remote community appealing claimed a lack of interest (35%).
3.3.3 Scenario 3: Aboriginal Cultural Show or Performance
The appeal of attending an ‘Aboriginal cultural show or performance that is one part of a larger tourist
attraction or site’ was rated very appealing to extremely appealing by 47% of respondents (4 to 5 on a 5
point scale). International visitors ( ̅ = 3.2) were again found to be significantly (p=0.004) more likely to
find the experience appealing than domestic visitors ( ̅ = 3.0) (Figure 3.3).
5 The sample is too low to report on those who had previously undertaken the experience. Further tests for
willingness to pay and motivations for those respondents who had, or intended to, stay overnight in a remote Aboriginal community could not be performed due to small sample sizes.
0
5
10
15
20
25
30
35
40
45
Not appealing Slightly appealing Somewhat appealing Very appealing Extremely appealing
Domestic
International
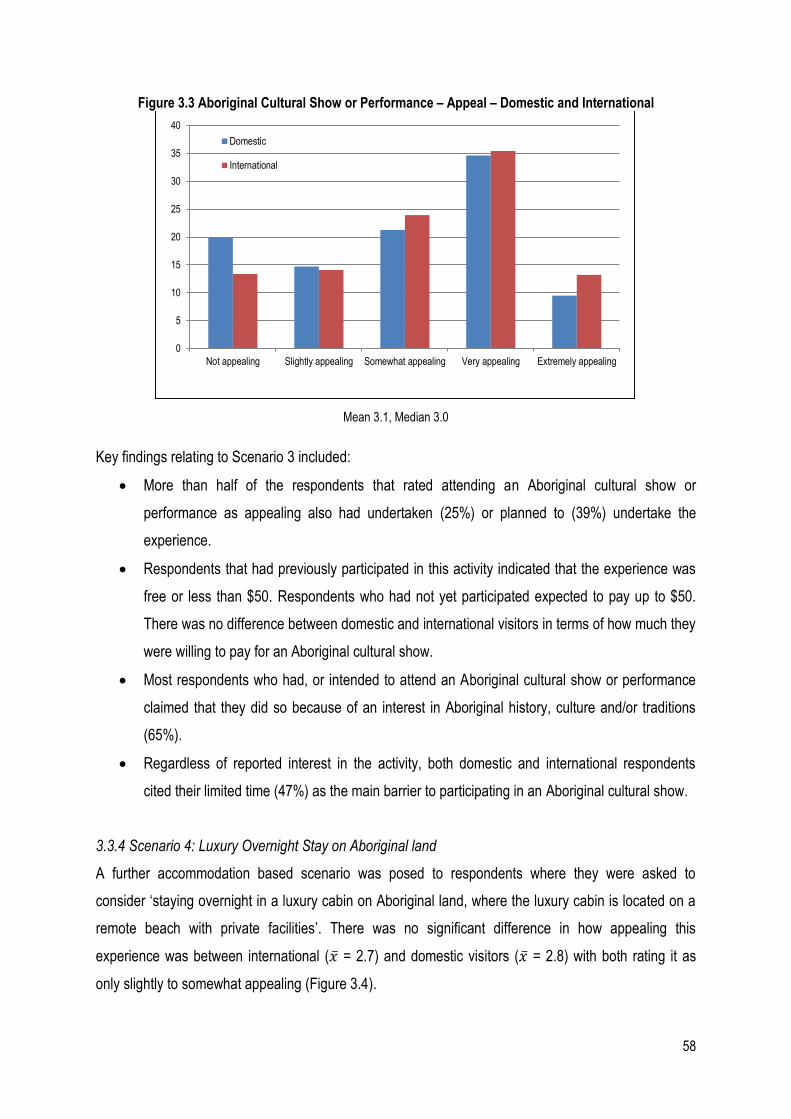
58
Figure 3.3 Aboriginal Cultural Show or Performance – Appeal – Domestic and International
Mean 3.1, Median 3.0
Key findings relating to Scenario 3 included:
More than half of the respondents that rated attending an Aboriginal cultural show or
performance as appealing also had undertaken (25%) or planned to (39%) undertake the
experience.
Respondents that had previously participated in this activity indicated that the experience was
free or less than $50. Respondents who had not yet participated expected to pay up to $50.
There was no difference between domestic and international visitors in terms of how much they
were willing to pay for an Aboriginal cultural show.
Most respondents who had, or intended to attend an Aboriginal cultural show or performance
claimed that they did so because of an interest in Aboriginal history, culture and/or traditions
(65%).
Regardless of reported interest in the activity, both domestic and international respondents
cited their limited time (47%) as the main barrier to participating in an Aboriginal cultural show.
3.3.4 Scenario 4: Luxury Overnight Stay on Aboriginal land
A further accommodation based scenario was posed to respondents where they were asked to
consider ‘staying overnight in a luxury cabin on Aboriginal land, where the luxury cabin is located on a
remote beach with private facilities’. There was no significant difference in how appealing this
experience was between international ( ̅ = 2.7) and domestic visitors ( ̅ = 2.8) with both rating it as
only slightly to somewhat appealing (Figure 3.4).
0
5
10
15
20
25
30
35
40
Not appealing Slightly appealing Somewhat appealing Very appealing Extremely appealing
Domestic
International
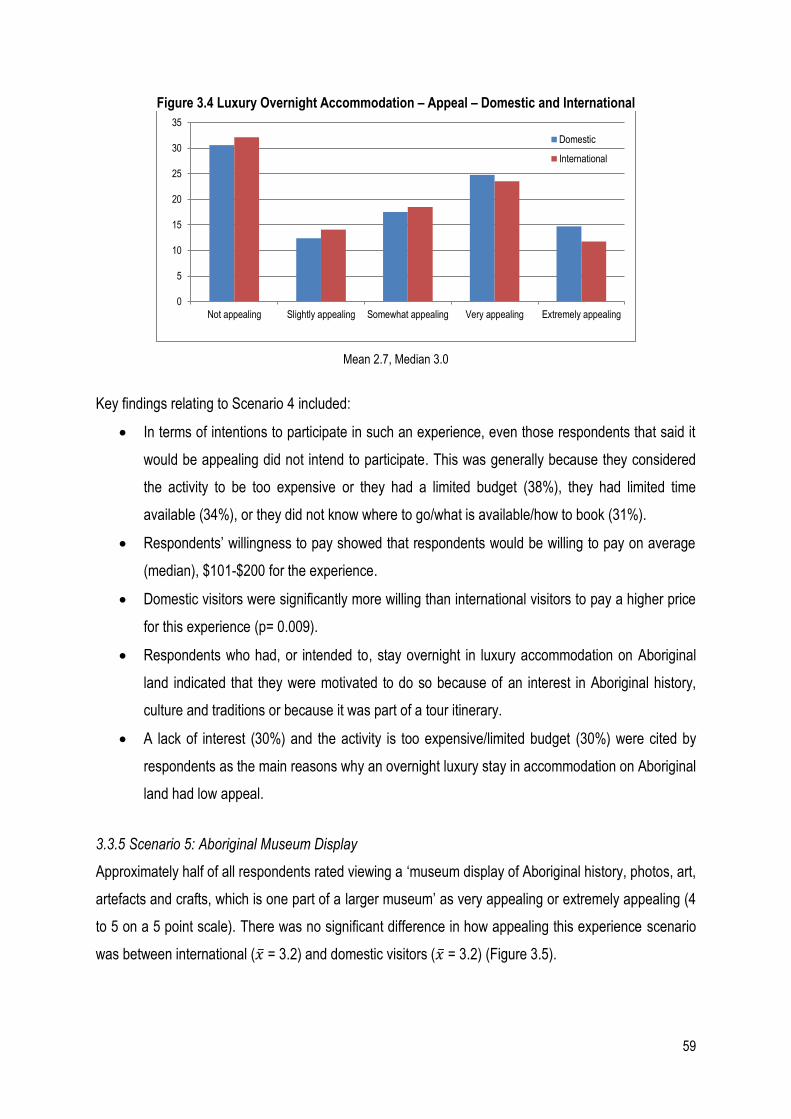
59
Figure 3.4 Luxury Overnight Accommodation – Appeal – Domestic and International
Mean 2.7, Median 3.0
Key findings relating to Scenario 4 included:
In terms of intentions to participate in such an experience, even those respondents that said it
would be appealing did not intend to participate. This was generally because they considered
the activity to be too expensive or they had a limited budget (38%), they had limited time
available (34%), or they did not know where to go/what is available/how to book (31%).
Respondents’ willingness to pay showed that respondents would be willing to pay on average
(median), $101-$200 for the experience.
Domestic visitors were significantly more willing than international visitors to pay a higher price
for this experience (p= 0.009).
Respondents who had, or intended to, stay overnight in luxury accommodation on Aboriginal
land indicated that they were motivated to do so because of an interest in Aboriginal history,
culture and traditions or because it was part of a tour itinerary.
A lack of interest (30%) and the activity is too expensive/limited budget (30%) were cited by
respondents as the main reasons why an overnight luxury stay in accommodation on Aboriginal
land had low appeal.
3.3.5 Scenario 5: Aboriginal Museum Display
Approximately half of all respondents rated viewing a ‘museum display of Aboriginal history, photos, art,
artefacts and crafts, which is one part of a larger museum’ as very appealing or extremely appealing (4
to 5 on a 5 point scale). There was no significant difference in how appealing this experience scenario
was between international ( ̅ = 3.2) and domestic visitors ( ̅ = 3.2) (Figure 3.5).
0
5
10
15
20
25
30
35
Not appealing Slightly appealing Somewhat appealing Very appealing Extremely appealing
Domestic
International
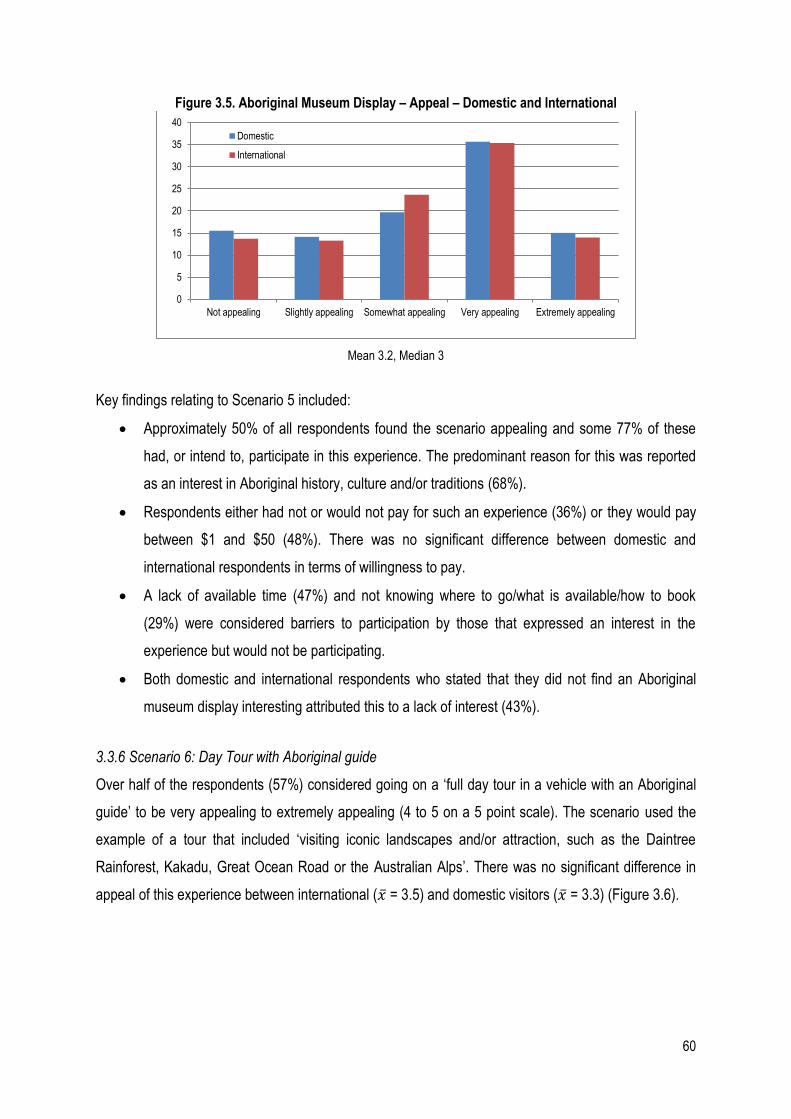
60
Figure 3.5. Aboriginal Museum Display – Appeal – Domestic and International
Mean 3.2, Median 3
Key findings relating to Scenario 5 included:
Approximately 50% of all respondents found the scenario appealing and some 77% of these
had, or intend to, participate in this experience. The predominant reason for this was reported
as an interest in Aboriginal history, culture and/or traditions (68%).
Respondents either had not or would not pay for such an experience (36%) or they would pay
between $1 and $50 (48%). There was no significant difference between domestic and
international respondents in terms of willingness to pay.
A lack of available time (47%) and not knowing where to go/what is available/how to book
(29%) were considered barriers to participation by those that expressed an interest in the
experience but would not be participating.
Both domestic and international respondents who stated that they did not find an Aboriginal
museum display interesting attributed this to a lack of interest (43%).
3.3.6 Scenario 6: Day Tour with Aboriginal guide
Over half of the respondents (57%) considered going on a ‘full day tour in a vehicle with an Aboriginal
guide’ to be very appealing to extremely appealing (4 to 5 on a 5 point scale). The scenario used the
example of a tour that included ‘visiting iconic landscapes and/or attraction, such as the Daintree
Rainforest, Kakadu, Great Ocean Road or the Australian Alps’. There was no significant difference in
appeal of this experience between international ( ̅ = 3.5) and domestic visitors ( ̅ = 3.3) (Figure 3.6).
0
5
10
15
20
25
30
35
40
Not appealing Slightly appealing Somewhat appealing Very appealing Extremely appealing
Domestic
International
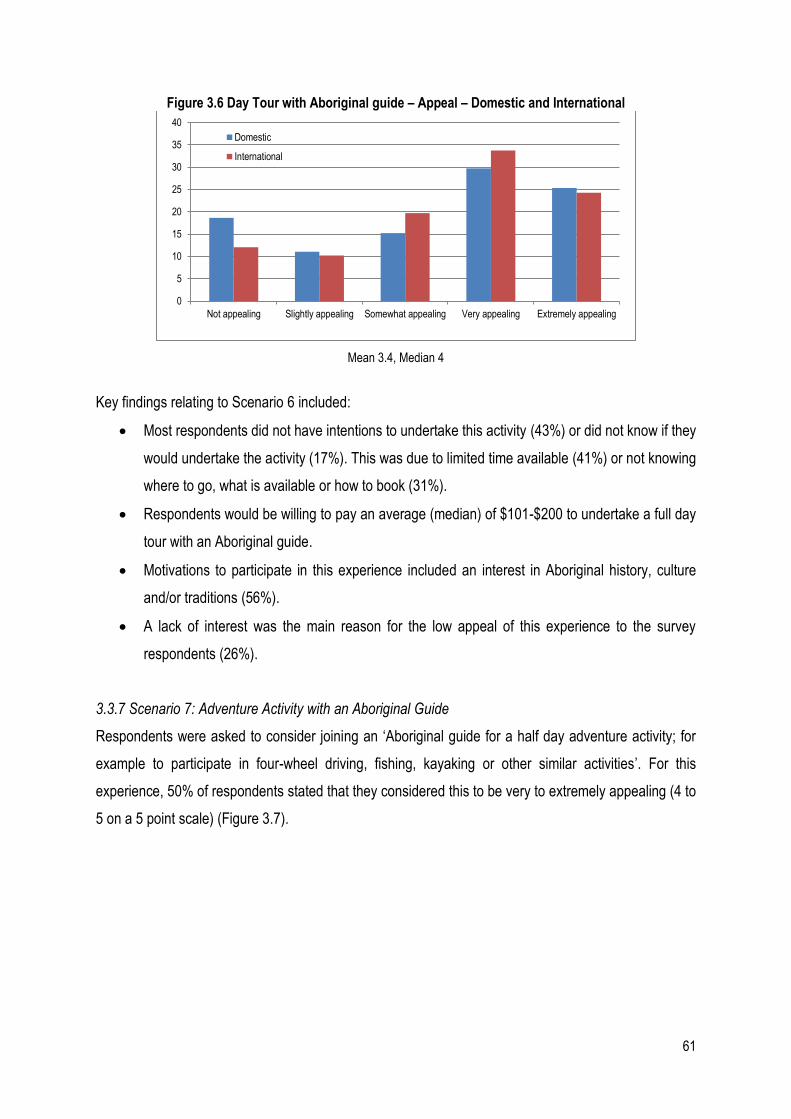
61
Figure 3.6 Day Tour with Aboriginal guide – Appeal – Domestic and International
Mean 3.4, Median 4
Key findings relating to Scenario 6 included:
Most respondents did not have intentions to undertake this activity (43%) or did not know if they
would undertake the activity (17%). This was due to limited time available (41%) or not knowing
where to go, what is available or how to book (31%).
Respondents would be willing to pay an average (median) of $101-$200 to undertake a full day
tour with an Aboriginal guide.
Motivations to participate in this experience included an interest in Aboriginal history, culture
and/or traditions (56%).
A lack of interest was the main reason for the low appeal of this experience to the survey
respondents (26%).
3.3.7 Scenario 7: Adventure Activity with an Aboriginal Guide
Respondents were asked to consider joining an ‘Aboriginal guide for a half day adventure activity; for
example to participate in four-wheel driving, fishing, kayaking or other similar activities’. For this
experience, 50% of respondents stated that they considered this to be very to extremely appealing (4 to
5 on a 5 point scale) (Figure 3.7).
0
5
10
15
20
25
30
35
40
Not appealing Slightly appealing Somewhat appealing Very appealing Extremely appealing
Domestic
International
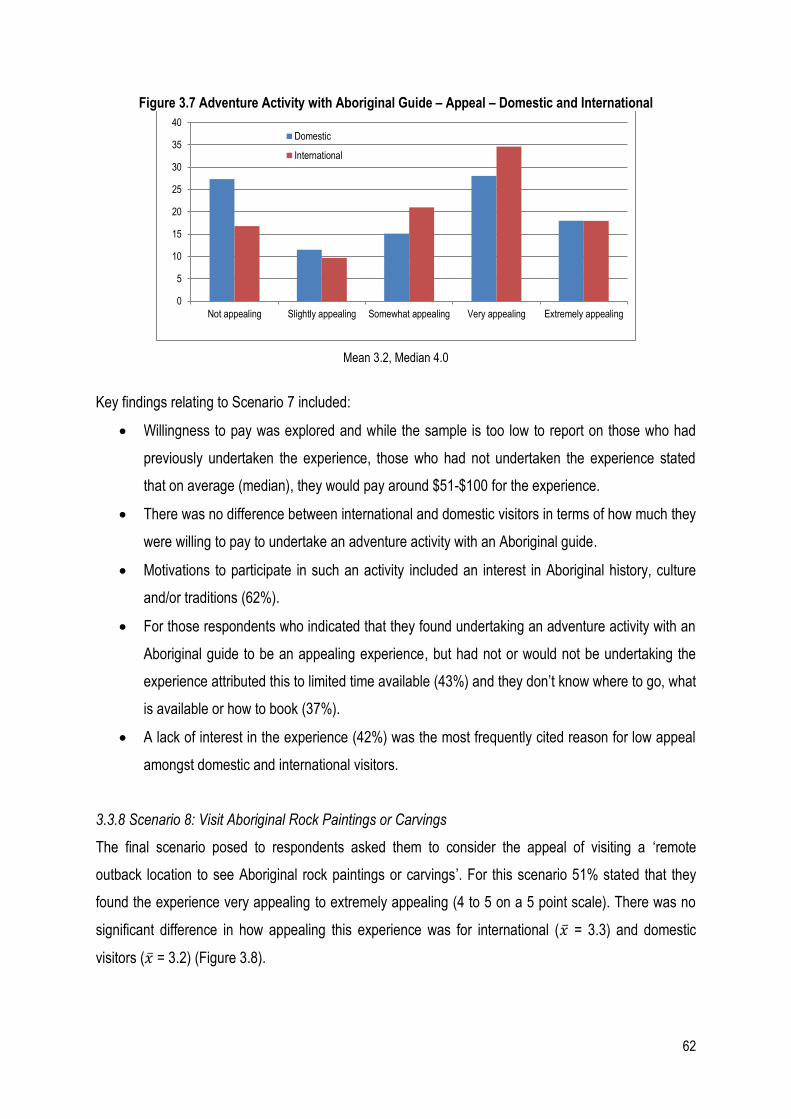
62
Figure 3.7 Adventure Activity with Aboriginal Guide – Appeal – Domestic and International
Mean 3.2, Median 4.0
Key findings relating to Scenario 7 included:
Willingness to pay was explored and while the sample is too low to report on those who had
previously undertaken the experience, those who had not undertaken the experience stated
that on average (median), they would pay around $51-$100 for the experience.
There was no difference between international and domestic visitors in terms of how much they
were willing to pay to undertake an adventure activity with an Aboriginal guide.
Motivations to participate in such an activity included an interest in Aboriginal history, culture
and/or traditions (62%).
For those respondents who indicated that they found undertaking an adventure activity with an
Aboriginal guide to be an appealing experience, but had not or would not be undertaking the
experience attributed this to limited time available (43%) and they don’t know where to go, what
is available or how to book (37%).
A lack of interest in the experience (42%) was the most frequently cited reason for low appeal
amongst domestic and international visitors.
3.3.8 Scenario 8: Visit Aboriginal Rock Paintings or Carvings
The final scenario posed to respondents asked them to consider the appeal of visiting a ‘remote
outback location to see Aboriginal rock paintings or carvings’. For this scenario 51% stated that they
found the experience very appealing to extremely appealing (4 to 5 on a 5 point scale). There was no
significant difference in how appealing this experience was for international ( ̅ = 3.3) and domestic
visitors ( ̅ = 3.2) (Figure 3.8).
0
5
10
15
20
25
30
35
40
Not appealing Slightly appealing Somewhat appealing Very appealing Extremely appealing
Domestic
International
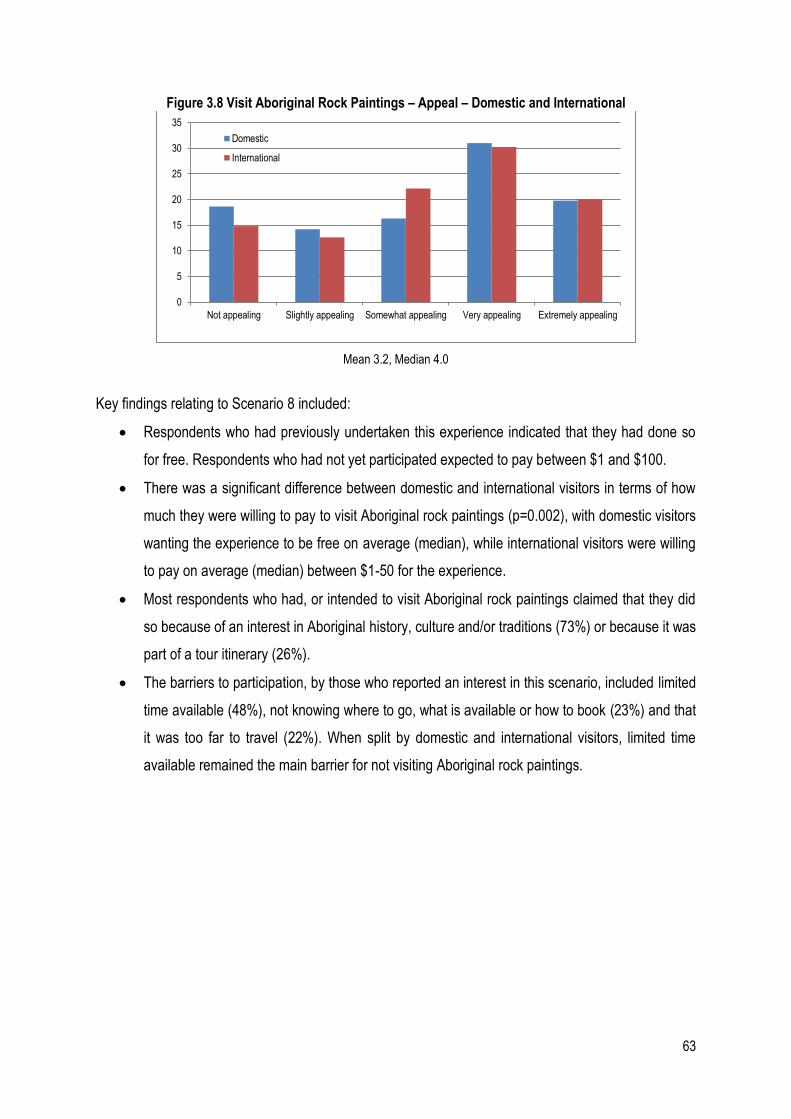
63
Figure 3.8 Visit Aboriginal Rock Paintings – Appeal – Domestic and International
Mean 3.2, Median 4.0
Key findings relating to Scenario 8 included:
Respondents who had previously undertaken this experience indicated that they had done so
for free. Respondents who had not yet participated expected to pay between $1 and $100.
There was a significant difference between domestic and international visitors in terms of how
much they were willing to pay to visit Aboriginal rock paintings (p=0.002), with domestic visitors
wanting the experience to be free on average (median), while international visitors were willing
to pay on average (median) between $1-50 for the experience.
Most respondents who had, or intended to visit Aboriginal rock paintings claimed that they did
so because of an interest in Aboriginal history, culture and/or traditions (73%) or because it was
part of a tour itinerary (26%).
The barriers to participation, by those who reported an interest in this scenario, included limited
time available (48%), not knowing where to go, what is available or how to book (23%) and that
it was too far to travel (22%). When split by domestic and international visitors, limited time
available remained the main barrier for not visiting Aboriginal rock paintings.
0
5
10
15
20
25
30
35
Not appealing Slightly appealing Somewhat appealing Very appealing Extremely appealing
Domestic
International
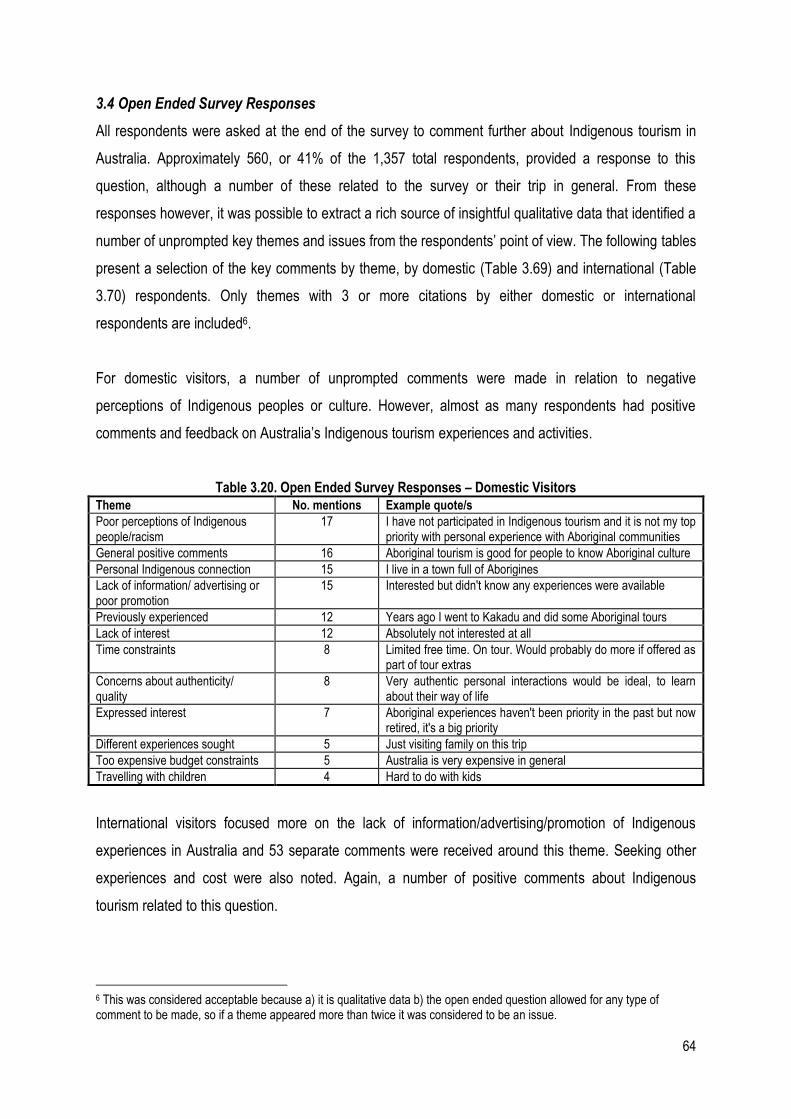
64
3.4 Open Ended Survey Responses
All respondents were asked at the end of the survey to comment further about Indigenous tourism in
Australia. Approximately 560, or 41% of the 1,357 total respondents, provided a response to this
question, although a number of these related to the survey or their trip in general. From these
responses however, it was possible to extract a rich source of insightful qualitative data that identified a
number of unprompted key themes and issues from the respondents’ point of view. The following tables
present a selection of the key comments by theme, by domestic (Table 3.69) and international (Table
3.70) respondents. Only themes with 3 or more citations by either domestic or international
respondents are included6.
For domestic visitors, a number of unprompted comments were made in relation to negative
perceptions of Indigenous peoples or culture. However, almost as many respondents had positive
comments and feedback on Australia’s Indigenous tourism experiences and activities.
Table 3.20. Open Ended Survey Responses – Domestic Visitors
Theme No. mentions Example quote/s
Poor perceptions of Indigenous people/racism
17 I have not participated in Indigenous tourism and it is not my top priority with personal experience with Aboriginal communities
General positive comments 16 Aboriginal tourism is good for people to know Aboriginal culture
Personal Indigenous connection 15 I live in a town full of Aborigines
Lack of information/ advertising or poor promotion
15 Interested but didn't know any experiences were available
Previously experienced 12 Years ago I went to Kakadu and did some Aboriginal tours
Lack of interest 12 Absolutely not interested at all
Time constraints 8 Limited free time. On tour. Would probably do more if offered as part of tour extras
Concerns about authenticity/ quality
8 Very authentic personal interactions would be ideal, to learn about their way of life
Expressed interest 7 Aboriginal experiences haven't been priority in the past but now retired, it's a big priority
Different experiences sought 5 Just visiting family on this trip
Too expensive budget constraints 5 Australia is very expensive in general
Travelling with children 4 Hard to do with kids
International visitors focused more on the lack of information/advertising/promotion of Indigenous
experiences in Australia and 53 separate comments were received around this theme. Seeking other
experiences and cost were also noted. Again, a number of positive comments about Indigenous
tourism related to this question.
6 This was considered acceptable because a) it is qualitative data b) the open ended question allowed for any type of comment to be made, so if a theme appeared more than twice it was considered to be an issue.
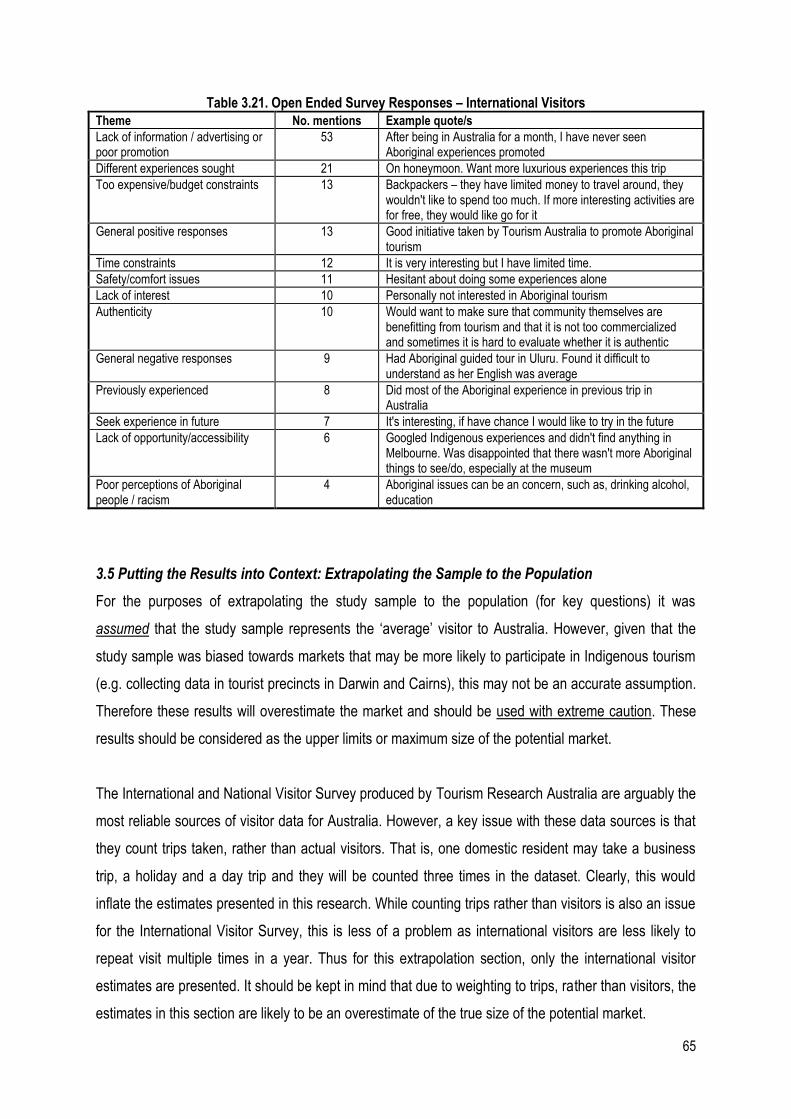
65
Table 3.21. Open Ended Survey Responses – International Visitors
Theme No. mentions Example quote/s
Lack of information / advertising or poor promotion
53 After being in Australia for a month, I have never seen Aboriginal experiences promoted
Different experiences sought 21 On honeymoon. Want more luxurious experiences this trip
Too expensive/budget constraints 13 Backpackers – they have limited money to travel around, they wouldn't like to spend too much. If more interesting activities are for free, they would like go for it
General positive responses 13 Good initiative taken by Tourism Australia to promote Aboriginal tourism
Time constraints 12 It is very interesting but I have limited time.
Safety/comfort issues 11 Hesitant about doing some experiences alone
Lack of interest 10 Personally not interested in Aboriginal tourism
Authenticity 10 Would want to make sure that community themselves are benefitting from tourism and that it is not too commercialized and sometimes it is hard to evaluate whether it is authentic
General negative responses 9 Had Aboriginal guided tour in Uluru. Found it difficult to understand as her English was average
Previously experienced 8 Did most of the Aboriginal experience in previous trip in Australia
Seek experience in future 7 It's interesting, if have chance I would like to try in the future
Lack of opportunity/accessibility 6 Googled Indigenous experiences and didn't find anything in Melbourne. Was disappointed that there wasn't more Aboriginal things to see/do, especially at the museum
Poor perceptions of Aboriginal people / racism
4 Aboriginal issues can be an concern, such as, drinking alcohol, education
3.5 Putting the Results into Context: Extrapolating the Sample to the Population
For the purposes of extrapolating the study sample to the population (for key questions) it was
assumed that the study sample represents the ‘average’ visitor to Australia. However, given that the
study sample was biased towards markets that may be more likely to participate in Indigenous tourism
(e.g. collecting data in tourist precincts in Darwin and Cairns), this may not be an accurate assumption.
Therefore these results will overestimate the market and should be used with extreme caution. These
results should be considered as the upper limits or maximum size of the potential market.
The International and National Visitor Survey produced by Tourism Research Australia are arguably the
most reliable sources of visitor data for Australia. However, a key issue with these data sources is that
they count trips taken, rather than actual visitors. That is, one domestic resident may take a business
trip, a holiday and a day trip and they will be counted three times in the dataset. Clearly, this would
inflate the estimates presented in this research. While counting trips rather than visitors is also an issue
for the International Visitor Survey, this is less of a problem as international visitors are less likely to
repeat visit multiple times in a year. Thus for this extrapolation section, only the international visitor
estimates are presented. It should be kept in mind that due to weighting to trips, rather than visitors, the
estimates in this section are likely to be an overestimate of the true size of the potential market.
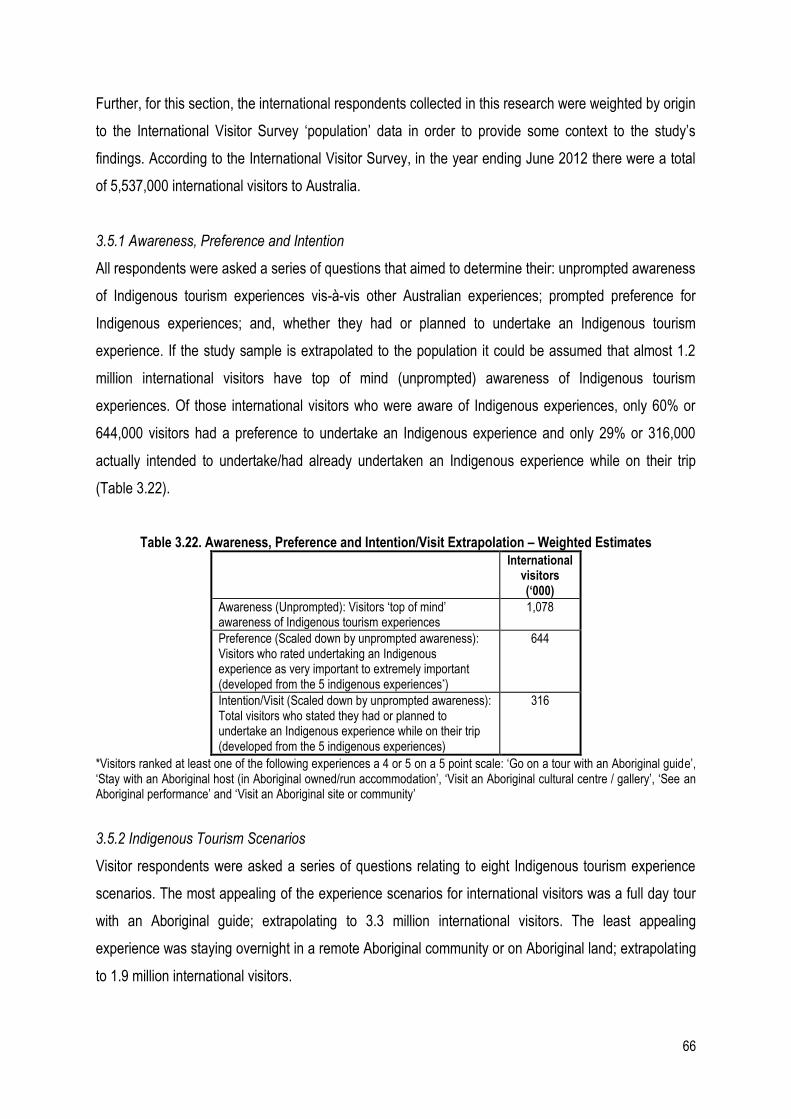
66
Further, for this section, the international respondents collected in this research were weighted by origin
to the International Visitor Survey ‘population’ data in order to provide some context to the study’s
findings. According to the International Visitor Survey, in the year ending June 2012 there were a total
of 5,537,000 international visitors to Australia.
3.5.1 Awareness, Preference and Intention
All respondents were asked a series of questions that aimed to determine their: unprompted awareness
of Indigenous tourism experiences vis-à-vis other Australian experiences; prompted preference for
Indigenous experiences; and, whether they had or planned to undertake an Indigenous tourism
experience. If the study sample is extrapolated to the population it could be assumed that almost 1.2
million international visitors have top of mind (unprompted) awareness of Indigenous tourism
experiences. Of those international visitors who were aware of Indigenous experiences, only 60% or
644,000 visitors had a preference to undertake an Indigenous experience and only 29% or 316,000
actually intended to undertake/had already undertaken an Indigenous experience while on their trip
(Table 3.22).
Table 3.22. Awareness, Preference and Intention/Visit Extrapolation – Weighted Estimates
International visitors (‘000)
Awareness (Unprompted): Visitors ‘top of mind’ awareness of Indigenous tourism experiences
1,078
Preference (Scaled down by unprompted awareness): Visitors who rated undertaking an Indigenous experience as very important to extremely important (developed from the 5 indigenous experiences*)
644
Intention/Visit (Scaled down by unprompted awareness): Total visitors who stated they had or planned to undertake an Indigenous experience while on their trip (developed from the 5 indigenous experiences)
316
*Visitors ranked at least one of the following experiences a 4 or 5 on a 5 point scale: ‘Go on a tour with an Aboriginal guide’, ‘Stay with an Aboriginal host (in Aboriginal owned/run accommodation’, ‘Visit an Aboriginal cultural centre / gallery’, ‘See an Aboriginal performance’ and ‘Visit an Aboriginal site or community’
3.5.2 Indigenous Tourism Scenarios
Visitor respondents were asked a series of questions relating to eight Indigenous tourism experience
scenarios. The most appealing of the experience scenarios for international visitors was a full day tour
with an Aboriginal guide; extrapolating to 3.3 million international visitors. The least appealing
experience was staying overnight in a remote Aboriginal community or on Aboriginal land; extrapolating
to 1.9 million international visitors.
67
The international respondents were also asked to state whether they had ever previously undertaken
an Indigenous experience in Australia or intended to do so in the future. The Indigenous experience
most likely to be/had been undertaken was attending an Aboriginal museum display (extrapolation 2.1
million visitors) while the least likely to be undertaken was staying overnight in a luxury cabin on
Aboriginal land (extrapolation 770,000 visitors). Again, these figures should be viewed with caution as
the upper limits of a potential market. As noted elsewhere in the report there is a tendency for
respondents to overestimate their future intentions.
International respondents were also asked how much they had paid or were willing to pay for each of
the Indigenous tourism experience scenarios. Due to the expenditure figures being collected as a
categorical rather than continuous variable, it was necessary to extrapolate out to a total expenditure
range, rather than a point estimate. Therefore, this modelling exercise estimates maximum potential for
expenditure on an Indigenous tourism experience in a range. The Indigenous experience with the
highest total expenditure range was undertaking a full day tour with an Aboriginal guide. The
experience with the lowest expenditure range was the Aboriginal museum display. Although the
museum based experience had the highest potential for visitation it had low potential for revenue
generation.
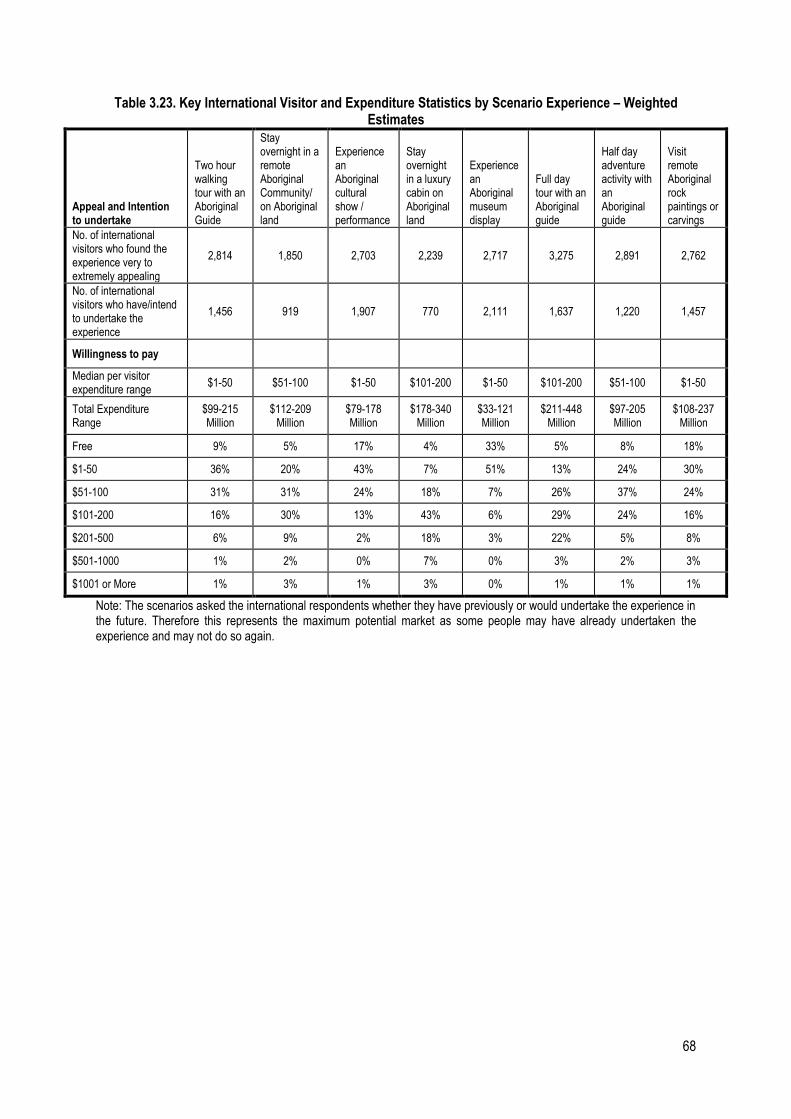
68
Table 3.23. Key International Visitor and Expenditure Statistics by Scenario Experience – Weighted Estimates
Appeal and Intention to undertake
Two hour walking tour with an Aboriginal Guide
Stay overnight in a remote Aboriginal Community/ on Aboriginal land
Experience an Aboriginal cultural show / performance
Stay overnight in a luxury cabin on Aboriginal land
Experience an Aboriginal museum display
Full day tour with an Aboriginal guide
Half day adventure activity with an Aboriginal guide
Visit remote Aboriginal rock paintings or carvings
No. of international visitors who found the experience very to extremely appealing
2,814 1,850 2,703 2,239 2,717 3,275 2,891 2,762
No. of international visitors who have/intend to undertake the experience
1,456 919 1,907 770 2,111 1,637 1,220 1,457
Willingness to pay
Median per visitor expenditure range
$1-50 $51-100 $1-50 $101-200 $1-50 $101-200 $51-100 $1-50
Total Expenditure Range
$99-215 Million
$112-209 Million
$79-178 Million
$178-340 Million
$33-121 Million
$211-448 Million
$97-205 Million
$108-237 Million
Free 9% 5% 17% 4% 33% 5% 8% 18%
$1-50 36% 20% 43% 7% 51% 13% 24% 30%
$51-100 31% 31% 24% 18% 7% 26% 37% 24%
$101-200 16% 30% 13% 43% 6% 29% 24% 16%
$201-500 6% 9% 2% 18% 3% 22% 5% 8%
$501-1000 1% 2% 0% 7% 0% 3% 2% 3%
$1001 or More 1% 3% 1% 3% 0% 1% 1% 1%
Note: The scenarios asked the international respondents whether they have previously or would undertake the experience in the future. Therefore this represents the maximum potential market as some people may have already undertaken the experience and may not do so again.
69
Chapter Four: Results – Indigenous Tourism Operator Interviews
In-depth, semi-structured, face-to-face interviews were undertaken with a sample of 34 Indigenous
tourism operators across Australia. The interview guide (Appendix 2) included questions around the:
Business operating environment
Perceptions of visitor demand, motivations, expectation and satisfaction
Perceptions of barriers and challenges to visitor demand
Authenticity
Chinese visitor market (presented in Chapter 6).
Specific details about the type, structure and size of each of the 34 Indigenous tourism operators is
outlined in Chapter 2. Throughout this Chapter, participant quotes are provided in italics. Appendix 7
presents a selection of quotes provided by participants for each question.
4.1 Context
Several context setting questions were posed to interview participants to identify background
information about their business and its current issues and challenges. For instance, most Indigenous
tourism operators reiterated the challenge associated with the current economic environment. Lower
international visitor numbers (“we are more than 50 per cent down on what we should be at the
moment…but the volume is way down on both - way down”) and the high Australian dollar, with its
impact on both inbound and outbound tourism (“I've tried to adjust and readjust and readjust my
prices…but I'm getting so close to my…purchase price…but it just gets to a point where you can't do
anything about it”).
Macro challenges included: intensifying competition with an increasing number of Indigenous tourism
businesses entering the market (“my biggest issue is…with xxxx opening; the awareness of that is
brilliant”); competition with the mining industry for available accommodation stock (“quite a bit of
accommodation has been taken up by people involved in mining and gas exploration. That only puts up
the pressure on the prices, the room prices”) and seasonality (“the weather has a lot to do with it In
terms of my business”).
Micro challenges noted by interview participants included: sourcing, training and retaining appropriate
staff generally (“finding the people with the degree of skill and the degree of commitment, like getting
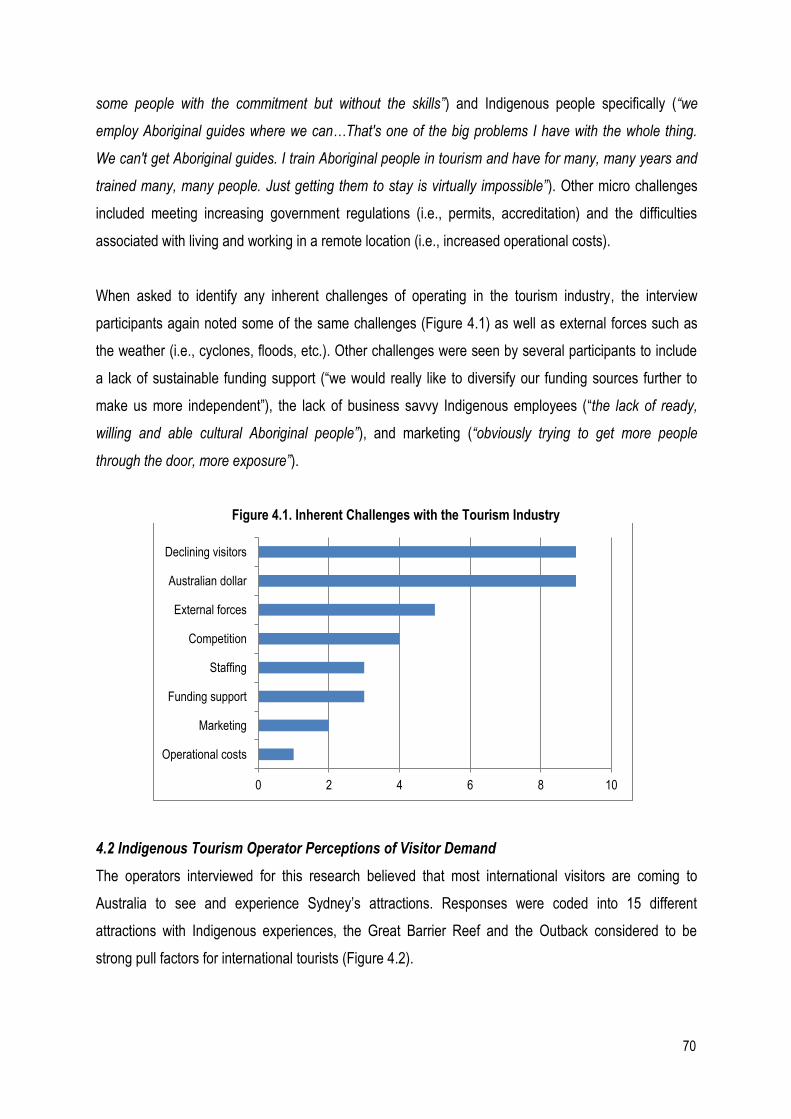
70
some people with the commitment but without the skills”) and Indigenous people specifically (“we
employ Aboriginal guides where we can…That's one of the big problems I have with the whole thing.
We can't get Aboriginal guides. I train Aboriginal people in tourism and have for many, many years and
trained many, many people. Just getting them to stay is virtually impossible”). Other micro challenges
included meeting increasing government regulations (i.e., permits, accreditation) and the difficulties
associated with living and working in a remote location (i.e., increased operational costs).
When asked to identify any inherent challenges of operating in the tourism industry, the interview
participants again noted some of the same challenges (Figure 4.1) as well as external forces such as
the weather (i.e., cyclones, floods, etc.). Other challenges were seen by several participants to include
a lack of sustainable funding support (“we would really like to diversify our funding sources further to
make us more independent”), the lack of business savvy Indigenous employees (“the lack of ready,
willing and able cultural Aboriginal people”), and marketing (“obviously trying to get more people
through the door, more exposure”).
Figure 4.1. Inherent Challenges with the Tourism Industry
4.2 Indigenous Tourism Operator Perceptions of Visitor Demand
The operators interviewed for this research believed that most international visitors are coming to
Australia to see and experience Sydney’s attractions. Responses were coded into 15 different
attractions with Indigenous experiences, the Great Barrier Reef and the Outback considered to be
strong pull factors for international tourists (Figure 4.2).
0 2 4 6 8 10
Operational costs
Marketing
Funding support
Staffing
Competition
External forces
Australian dollar
Declining visitors
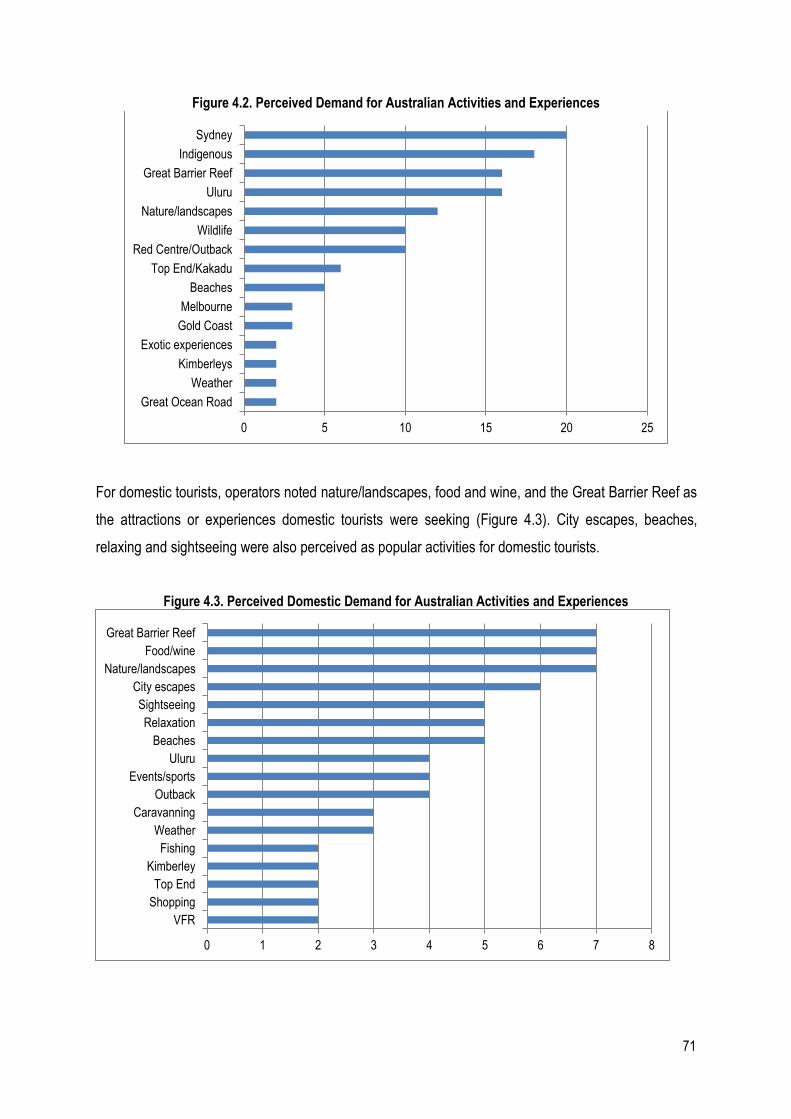
71
Figure 4.2. Perceived Demand for Australian Activities and Experiences
For domestic tourists, operators noted nature/landscapes, food and wine, and the Great Barrier Reef as
the attractions or experiences domestic tourists were seeking (Figure 4.3). City escapes, beaches,
relaxing and sightseeing were also perceived as popular activities for domestic tourists.
Figure 4.3. Perceived Domestic Demand for Australian Activities and Experiences
0 5 10 15 20 25
Great Ocean Road
Weather
Kimberleys
Exotic experiences
Gold Coast
Melbourne
Beaches
Top End/Kakadu
Red Centre/Outback
Wildlife
Nature/landscapes
Uluru
Great Barrier Reef
Indigenous
Sydney
0 1 2 3 4 5 6 7 8
VFR
Shopping
Top End
Kimberley
Fishing
Weather
Caravanning
Outback
Events/sports
Uluru
Beaches
Relaxation
Sightseeing
City escapes
Nature/landscapes
Food/wine
Great Barrier Reef
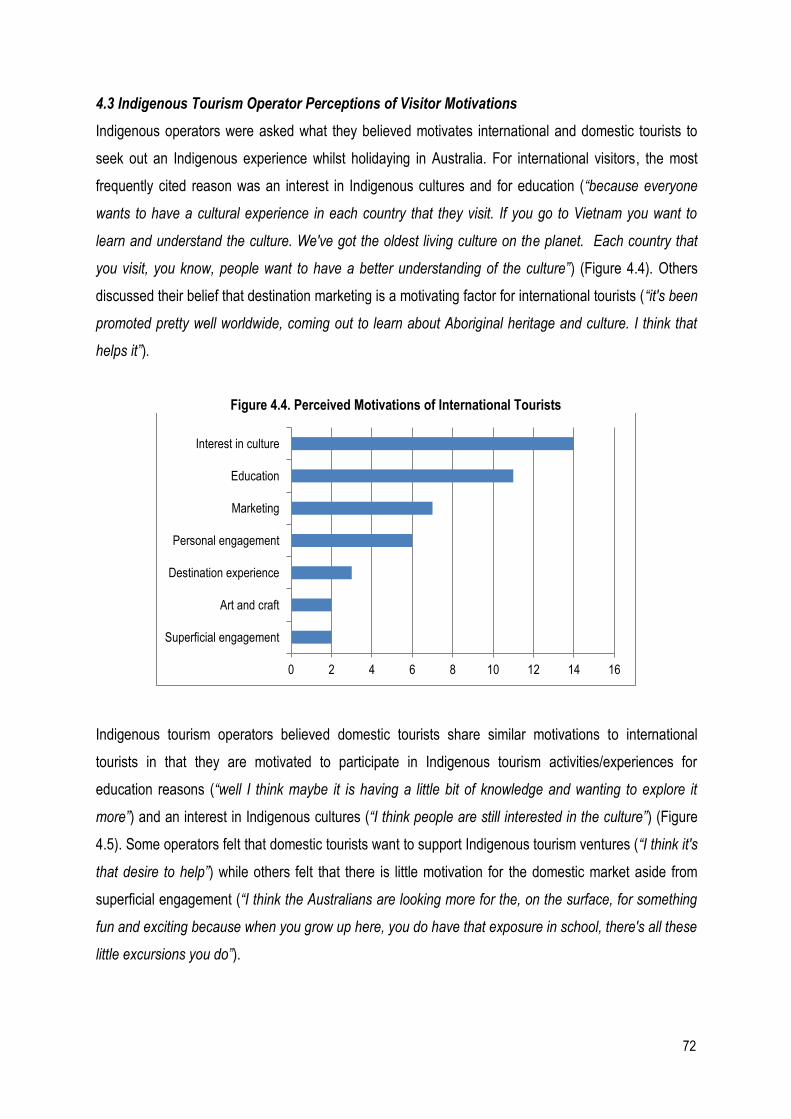
72
4.3 Indigenous Tourism Operator Perceptions of Visitor Motivations
Indigenous operators were asked what they believed motivates international and domestic tourists to
seek out an Indigenous experience whilst holidaying in Australia. For international visitors, the most
frequently cited reason was an interest in Indigenous cultures and for education (“because everyone
wants to have a cultural experience in each country that they visit. If you go to Vietnam you want to
learn and understand the culture. We've got the oldest living culture on the planet. Each country that
you visit, you know, people want to have a better understanding of the culture”) (Figure 4.4). Others
discussed their belief that destination marketing is a motivating factor for international tourists (“it's been
promoted pretty well worldwide, coming out to learn about Aboriginal heritage and culture. I think that
helps it”).
Figure 4.4. Perceived Motivations of International Tourists
Indigenous tourism operators believed domestic tourists share similar motivations to international
tourists in that they are motivated to participate in Indigenous tourism activities/experiences for
education reasons (“well I think maybe it is having a little bit of knowledge and wanting to explore it
more”) and an interest in Indigenous cultures (“I think people are still interested in the culture”) (Figure
4.5). Some operators felt that domestic tourists want to support Indigenous tourism ventures (“I think it's
that desire to help”) while others felt that there is little motivation for the domestic market aside from
superficial engagement (“I think the Australians are looking more for the, on the surface, for something
fun and exciting because when you grow up here, you do have that exposure in school, there's all these
little excursions you do”).
0 2 4 6 8 10 12 14 16
Superficial engagement
Art and craft
Destination experience
Personal engagement
Marketing
Education
Interest in culture
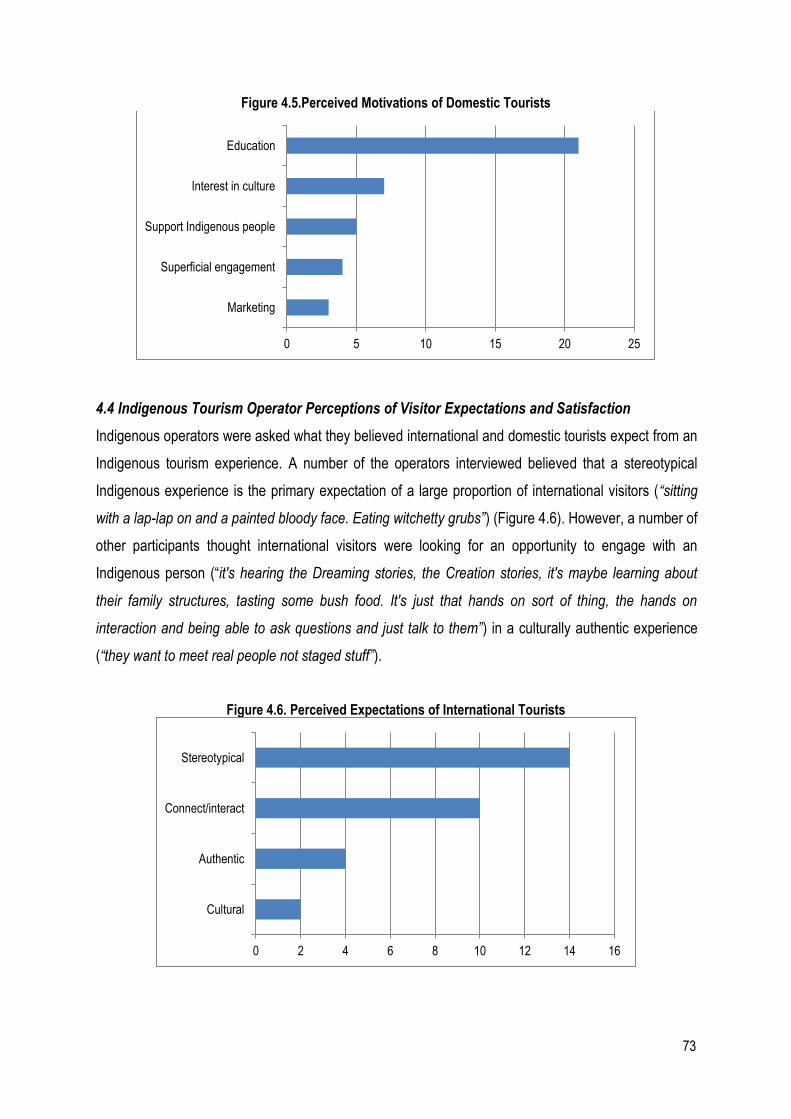
73
Figure 4.5.Perceived Motivations of Domestic Tourists
4.4 Indigenous Tourism Operator Perceptions of Visitor Expectations and Satisfaction
Indigenous operators were asked what they believed international and domestic tourists expect from an
Indigenous tourism experience. A number of the operators interviewed believed that a stereotypical
Indigenous experience is the primary expectation of a large proportion of international visitors (“sitting
with a lap-lap on and a painted bloody face. Eating witchetty grubs”) (Figure 4.6). However, a number of
other participants thought international visitors were looking for an opportunity to engage with an
Indigenous person (“it's hearing the Dreaming stories, the Creation stories, it's maybe learning about
their family structures, tasting some bush food. It's just that hands on sort of thing, the hands on
interaction and being able to ask questions and just talk to them”) in a culturally authentic experience
(“they want to meet real people not staged stuff”).
Figure 4.6. Perceived Expectations of International Tourists
0 5 10 15 20 25
Marketing
Superficial engagement
Support Indigenous people
Interest in culture
Education
0 2 4 6 8 10 12 14 16
Cultural
Authentic
Connect/interact
Stereotypical
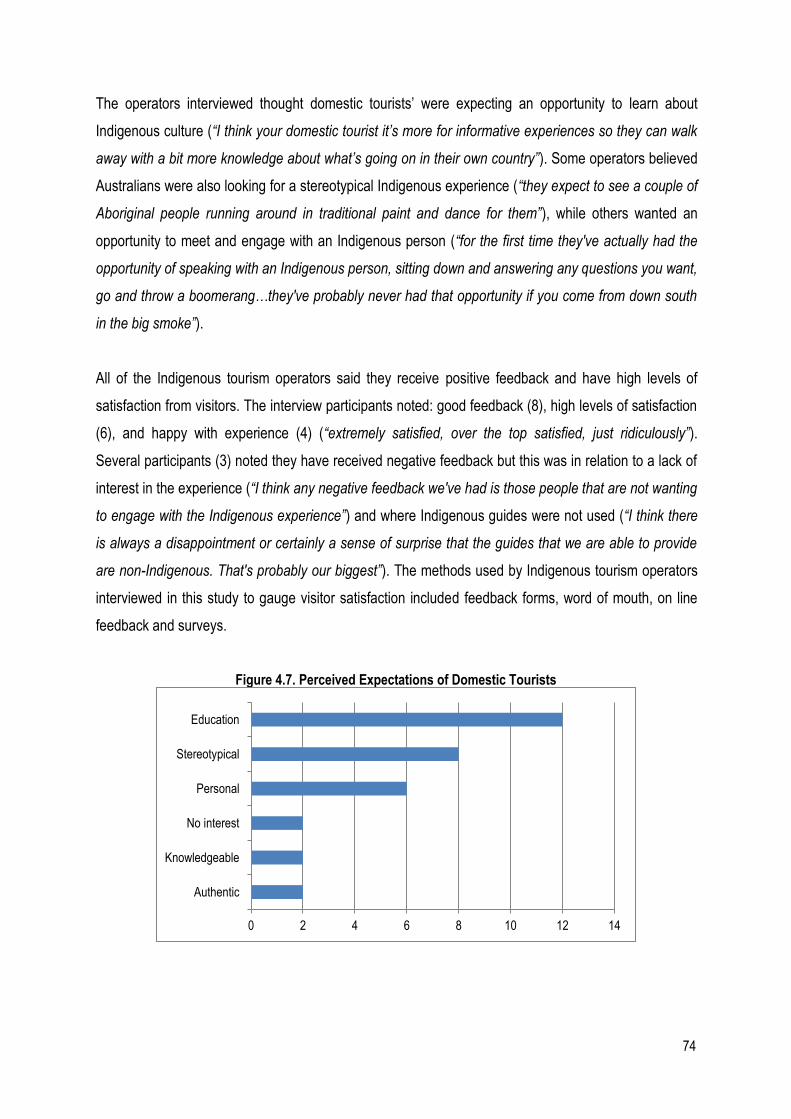
74
The operators interviewed thought domestic tourists’ were expecting an opportunity to learn about
Indigenous culture (“I think your domestic tourist it’s more for informative experiences so they can walk
away with a bit more knowledge about what’s going on in their own country”). Some operators believed
Australians were also looking for a stereotypical Indigenous experience (“they expect to see a couple of
Aboriginal people running around in traditional paint and dance for them”), while others wanted an
opportunity to meet and engage with an Indigenous person (“for the first time they've actually had the
opportunity of speaking with an Indigenous person, sitting down and answering any questions you want,
go and throw a boomerang…they've probably never had that opportunity if you come from down south
in the big smoke”).
All of the Indigenous tourism operators said they receive positive feedback and have high levels of
satisfaction from visitors. The interview participants noted: good feedback (8), high levels of satisfaction
(6), and happy with experience (4) (“extremely satisfied, over the top satisfied, just ridiculously”).
Several participants (3) noted they have received negative feedback but this was in relation to a lack of
interest in the experience (“I think any negative feedback we've had is those people that are not wanting
to engage with the Indigenous experience”) and where Indigenous guides were not used (“I think there
is always a disappointment or certainly a sense of surprise that the guides that we are able to provide
are non-Indigenous. That's probably our biggest”). The methods used by Indigenous tourism operators
interviewed in this study to gauge visitor satisfaction included feedback forms, word of mouth, on line
feedback and surveys.
Figure 4.7. Perceived Expectations of Domestic Tourists
0 2 4 6 8 10 12 14
Authentic
Knowledgeable
No interest
Personal
Stereotypical
Education
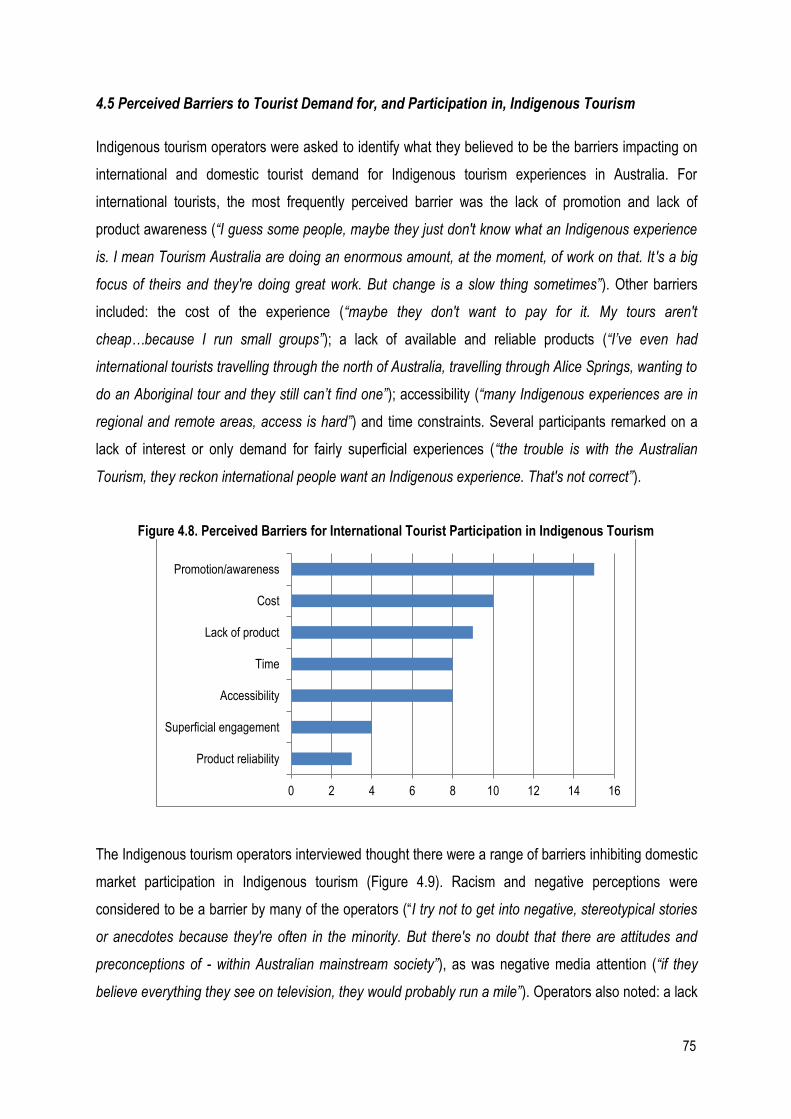
75
4.5 Perceived Barriers to Tourist Demand for, and Participation in, Indigenous Tourism
Indigenous tourism operators were asked to identify what they believed to be the barriers impacting on
international and domestic tourist demand for Indigenous tourism experiences in Australia. For
international tourists, the most frequently perceived barrier was the lack of promotion and lack of
product awareness (“I guess some people, maybe they just don't know what an Indigenous experience
is. I mean Tourism Australia are doing an enormous amount, at the moment, of work on that. It 's a big
focus of theirs and they're doing great work. But change is a slow thing sometimes”). Other barriers
included: the cost of the experience (“maybe they don't want to pay for it. My tours aren't
cheap…because I run small groups”); a lack of available and reliable products (“I’ve even had
international tourists travelling through the north of Australia, travelling through Alice Springs, wanting to
do an Aboriginal tour and they still can’t find one”); accessibility (“many Indigenous experiences are in
regional and remote areas, access is hard”) and time constraints. Several participants remarked on a
lack of interest or only demand for fairly superficial experiences (“the trouble is with the Australian
Tourism, they reckon international people want an Indigenous experience. That's not correct”).
Figure 4.8. Perceived Barriers for International Tourist Participation in Indigenous Tourism
The Indigenous tourism operators interviewed thought there were a range of barriers inhibiting domestic
market participation in Indigenous tourism (Figure 4.9). Racism and negative perceptions were
considered to be a barrier by many of the operators (“I try not to get into negative, stereotypical stories
or anecdotes because they're often in the minority. But there's no doubt that there are attitudes and
preconceptions of - within Australian mainstream society”), as was negative media attention (“if they
believe everything they see on television, they would probably run a mile”). Operators also noted: a lack
0 2 4 6 8 10 12 14 16
Product reliability
Superficial engagement
Accessibility
Time
Lack of product
Cost
Promotion/awareness
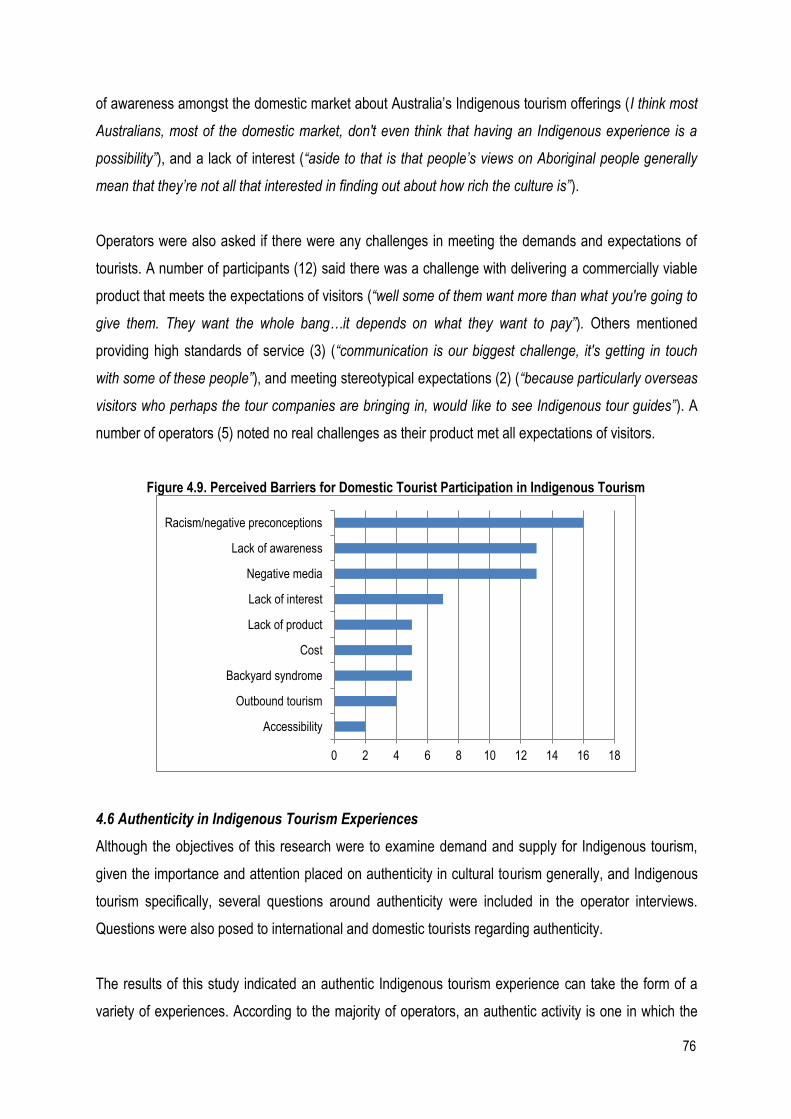
76
of awareness amongst the domestic market about Australia’s Indigenous tourism offerings (I think most
Australians, most of the domestic market, don't even think that having an Indigenous experience is a
possibility”), and a lack of interest (“aside to that is that people’s views on Aboriginal people generally
mean that they’re not all that interested in finding out about how rich the culture is”).
Operators were also asked if there were any challenges in meeting the demands and expectations of
tourists. A number of participants (12) said there was a challenge with delivering a commercially viable
product that meets the expectations of visitors (“well some of them want more than what you're going to
give them. They want the whole bang…it depends on what they want to pay”). Others mentioned
providing high standards of service (3) (“communication is our biggest challenge, it's getting in touch
with some of these people”), and meeting stereotypical expectations (2) (“because particularly overseas
visitors who perhaps the tour companies are bringing in, would like to see Indigenous tour guides”). A
number of operators (5) noted no real challenges as their product met all expectations of visitors.
Figure 4.9. Perceived Barriers for Domestic Tourist Participation in Indigenous Tourism
4.6 Authenticity in Indigenous Tourism Experiences
Although the objectives of this research were to examine demand and supply for Indigenous tourism,
given the importance and attention placed on authenticity in cultural tourism generally, and Indigenous
tourism specifically, several questions around authenticity were included in the operator interviews.
Questions were also posed to international and domestic tourists regarding authenticity.
The results of this study indicated an authentic Indigenous tourism experience can take the form of a
variety of experiences. According to the majority of operators, an authentic activity is one in which the
0 2 4 6 8 10 12 14 16 18
Accessibility
Outbound tourism
Backyard syndrome
Cost
Lack of product
Lack of interest
Negative media
Lack of awareness
Racism/negative preconceptions
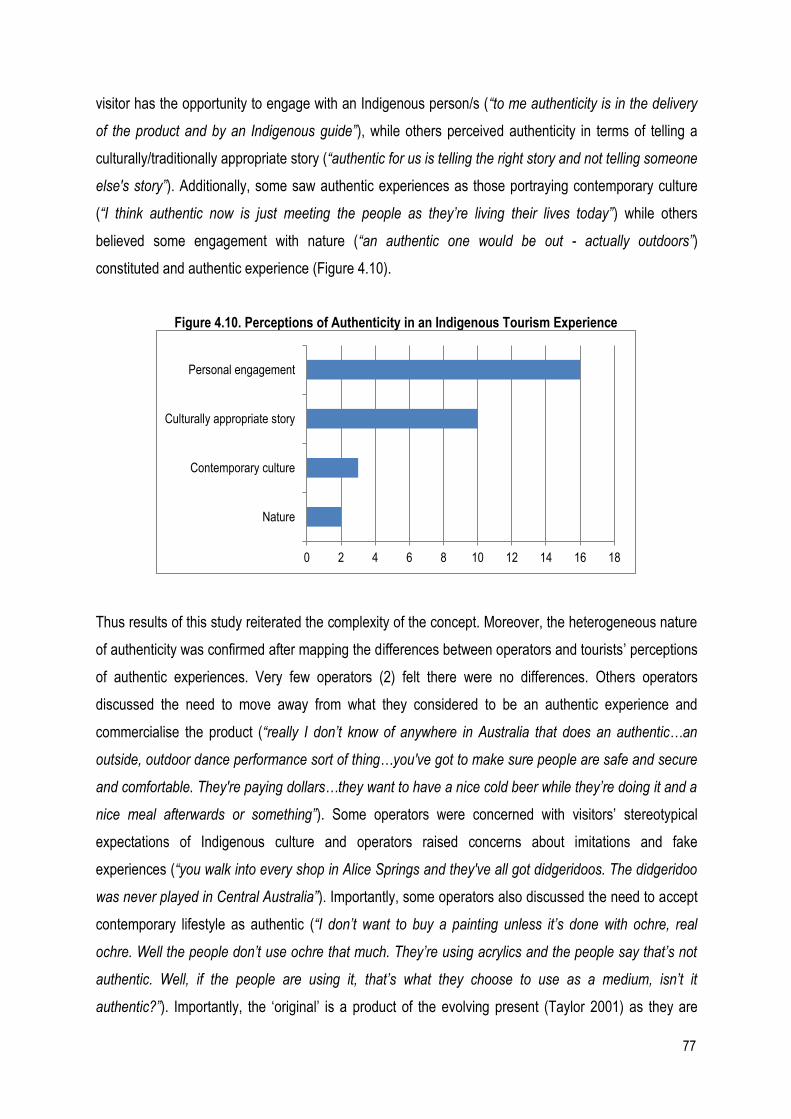
77
visitor has the opportunity to engage with an Indigenous person/s (“to me authenticity is in the delivery
of the product and by an Indigenous guide”), while others perceived authenticity in terms of telling a
culturally/traditionally appropriate story (“authentic for us is telling the right story and not telling someone
else's story”). Additionally, some saw authentic experiences as those portraying contemporary culture
(“I think authentic now is just meeting the people as they’re living their lives today”) while others
believed some engagement with nature (“an authentic one would be out - actually outdoors”)
constituted and authentic experience (Figure 4.10).
Figure 4.10. Perceptions of Authenticity in an Indigenous Tourism Experience
Thus results of this study reiterated the complexity of the concept. Moreover, the heterogeneous nature
of authenticity was confirmed after mapping the differences between operators and tourists’ perceptions
of authentic experiences. Very few operators (2) felt there were no differences. Others operators
discussed the need to move away from what they considered to be an authentic experience and
commercialise the product (“really I don’t know of anywhere in Australia that does an authentic…an
outside, outdoor dance performance sort of thing…you've got to make sure people are safe and secure
and comfortable. They're paying dollars…they want to have a nice cold beer while they’re doing it and a
nice meal afterwards or something”). Some operators were concerned with visitors’ stereotypical
expectations of Indigenous culture and operators raised concerns about imitations and fake
experiences (“you walk into every shop in Alice Springs and they've all got didgeridoos. The didgeridoo
was never played in Central Australia”). Importantly, some operators also discussed the need to accept
contemporary lifestyle as authentic (“I don’t want to buy a painting unless it’s done with ochre, real
ochre. Well the people don’t use ochre that much. They’re using acrylics and the people say that’s not
authentic. Well, if the people are using it, that’s what they choose to use as a medium, isn’t it
authentic?”). Importantly, the ‘original’ is a product of the evolving present (Taylor 2001) as they are
0 2 4 6 8 10 12 14 16 18
Nature
Contemporary culture
Culturally appropriate story
Personal engagement
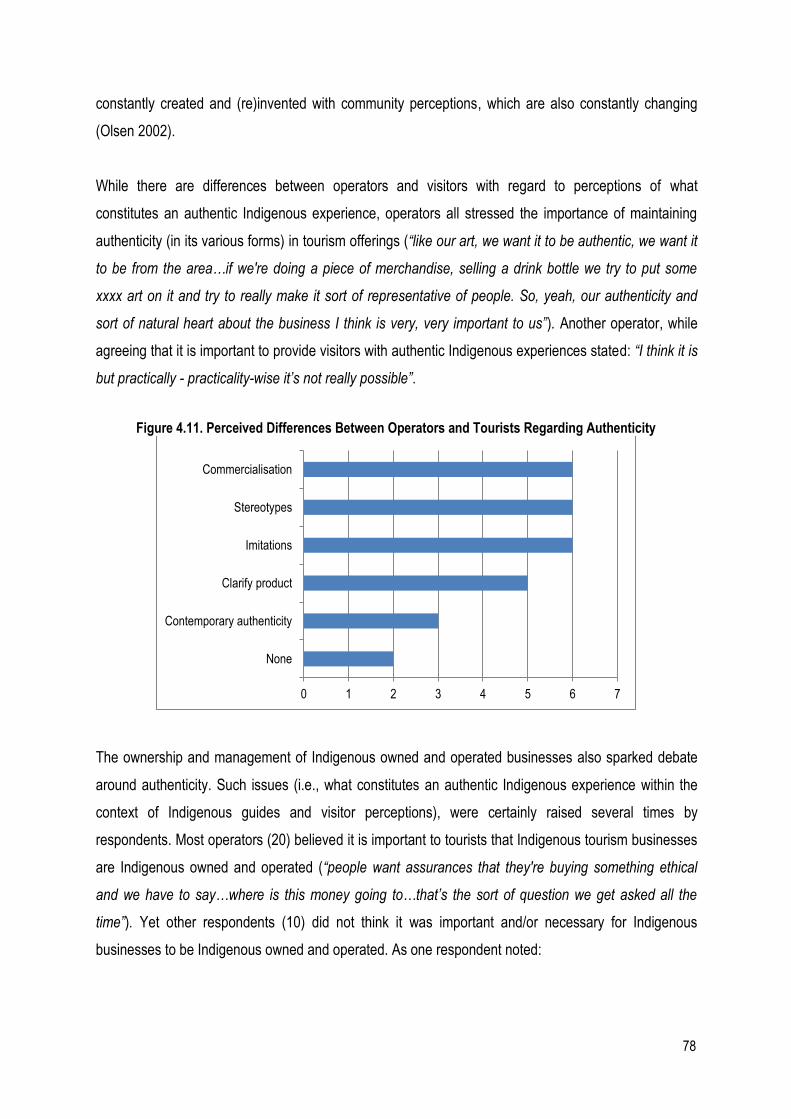
78
constantly created and (re)invented with community perceptions, which are also constantly changing
(Olsen 2002).
While there are differences between operators and visitors with regard to perceptions of what
constitutes an authentic Indigenous experience, operators all stressed the importance of maintaining
authenticity (in its various forms) in tourism offerings (“like our art, we want it to be authentic, we want it
to be from the area…if we're doing a piece of merchandise, selling a drink bottle we try to put some
xxxx art on it and try to really make it sort of representative of people. So, yeah, our authenticity and
sort of natural heart about the business I think is very, very important to us”). Another operator, while
agreeing that it is important to provide visitors with authentic Indigenous experiences stated: “I think it is
but practically - practicality-wise it’s not really possible”.
Figure 4.11. Perceived Differences Between Operators and Tourists Regarding Authenticity
The ownership and management of Indigenous owned and operated businesses also sparked debate
around authenticity. Such issues (i.e., what constitutes an authentic Indigenous experience within the
context of Indigenous guides and visitor perceptions), were certainly raised several times by
respondents. Most operators (20) believed it is important to tourists that Indigenous tourism businesses
are Indigenous owned and operated (“people want assurances that they're buying something ethical
and we have to say…where is this money going to…that’s the sort of question we get asked all the
time”). Yet other respondents (10) did not think it was important and/or necessary for Indigenous
businesses to be Indigenous owned and operated. As one respondent noted:
0 1 2 3 4 5 6 7
None
Contemporary authenticity
Clarify product
Imitations
Stereotypes
Commercialisation

79
“I think it's the experience on the day that's the really important thing. Indigenous owned -
I mean I think you'd probably love to think that they're supporting something that's 100 per
cent Indigenous owned so that all the money is going back into that Indigenous family and
community but the reality is some experiences wouldn't work just by being Indigenous
owned. So I don't know, I've never - it's not a question I've really asked them. They want to
know if the guide's Indigenous”.
80
Chapter Five: Discussion – Stage One
The objective of the research was to undertake a gap analysis of the demand for, and supply of,
Indigenous tourism in Australia. The impetus for this study was borne from a widely recognized gap in
knowledge about the demand patterns of international and domestic visitors for Indigenous tourism in
Australia. While previous research has shown that tourists express reasonably high levels of interest in
Indigenous tourism, the results of this study point towards evidence of a disconnect between tourists’
interest in, and partaking of, Indigenous tourism experiences. In short, reported interest has not
translated into visitation and expenditure. For instance, in scoping this research study, one of the
project stakeholders noted that, “real demand for Indigenous cultural tourism has not been effectively
demonstrated through existing research. In some studies of demand, there has been a tendency
towards optimistic projections of the value of the Indigenous cultural tourism market”. It was noted by
way of example, that “definitions of Indigenous tourism may not exclude free or low-cost experiences in
major centres, meaning that demand and price sensitivity for Indigenous tourism beyond those easily-
accessible experiences cannot be determined”. It is within this context that this research was instigated
to explore the ‘real’ or actual visitor demand through a research design that sought information, not
represented in previous studies of the market.
An important part of this study was also to map the findings from the visitor study against the voices,
experiences and insights of Indigenous tourism operators. The objective was not only to draw out
further insights from those at the ‘front line’ with regards to the realities, challenges and opportunities of
the tourism sector, but also to explore the extent to which the Indigenous operators views of the tourist
market were consistent with the opinions of the tourists themselves. The objective of identifying and
then mapping the gap was to ascertain any points of disconnect that, when going forward, can be used
by policy makers, agencies and operators to underpin the development of more sustainable Indigenous
tourism business enterprises. Specifically, the findings will have implications for future product
development, funding decisions, marketing strategy and policy development.
This chapter draws together and discusses, the findings of Stage One of the study which was to: 1)
investigate the expectations, experiences and motivations of both international and domestic tourists
regarding Indigenous tourism products and services in Australia via a visitor survey undertaken with
1357 international and domestic tourists (Chapter 3); and, 2) investigate the expectations, experiences
and motivations of Indigenous tourism operators regarding the provision of activities and experiences to
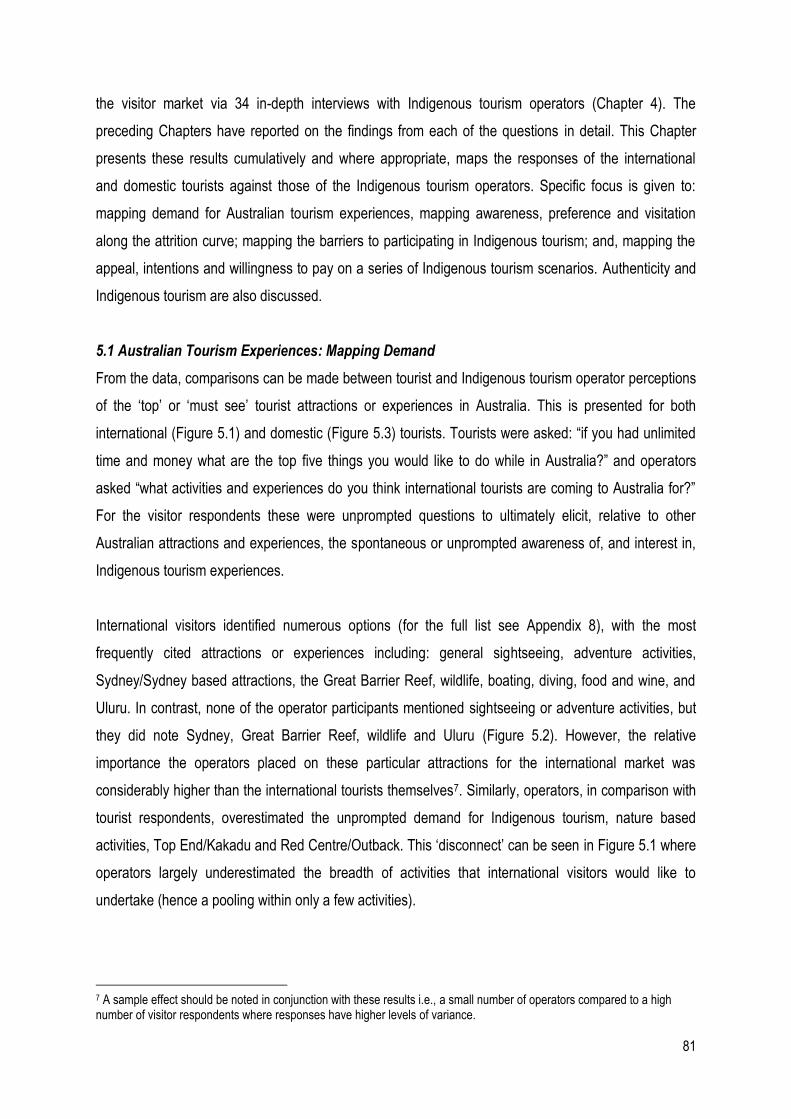
81
the visitor market via 34 in-depth interviews with Indigenous tourism operators (Chapter 4). The
preceding Chapters have reported on the findings from each of the questions in detail. This Chapter
presents these results cumulatively and where appropriate, maps the responses of the international
and domestic tourists against those of the Indigenous tourism operators. Specific focus is given to:
mapping demand for Australian tourism experiences, mapping awareness, preference and visitation
along the attrition curve; mapping the barriers to participating in Indigenous tourism; and, mapping the
appeal, intentions and willingness to pay on a series of Indigenous tourism scenarios. Authenticity and
Indigenous tourism are also discussed.
5.1 Australian Tourism Experiences: Mapping Demand
From the data, comparisons can be made between tourist and Indigenous tourism operator perceptions
of the ‘top’ or ‘must see’ tourist attractions or experiences in Australia. This is presented for both
international (Figure 5.1) and domestic (Figure 5.3) tourists. Tourists were asked: “if you had unlimited
time and money what are the top five things you would like to do while in Australia?” and operators
asked “what activities and experiences do you think international tourists are coming to Australia for?”
For the visitor respondents these were unprompted questions to ultimately elicit, relative to other
Australian attractions and experiences, the spontaneous or unprompted awareness of, and interest in,
Indigenous tourism experiences.
International visitors identified numerous options (for the full list see Appendix 8), with the most
frequently cited attractions or experiences including: general sightseeing, adventure activities,
Sydney/Sydney based attractions, the Great Barrier Reef, wildlife, boating, diving, food and wine, and
Uluru. In contrast, none of the operator participants mentioned sightseeing or adventure activities, but
they did note Sydney, Great Barrier Reef, wildlife and Uluru (Figure 5.2). However, the relative
importance the operators placed on these particular attractions for the international market was
considerably higher than the international tourists themselves7. Similarly, operators, in comparison with
tourist respondents, overestimated the unprompted demand for Indigenous tourism, nature based
activities, Top End/Kakadu and Red Centre/Outback. This ‘disconnect’ can be seen in Figure 5.1 where
operators largely underestimated the breadth of activities that international visitors would like to
undertake (hence a pooling within only a few activities).
7 A sample effect should be noted in conjunction with these results i.e., a small number of operators compared to a high number of visitor respondents where responses have higher levels of variance.
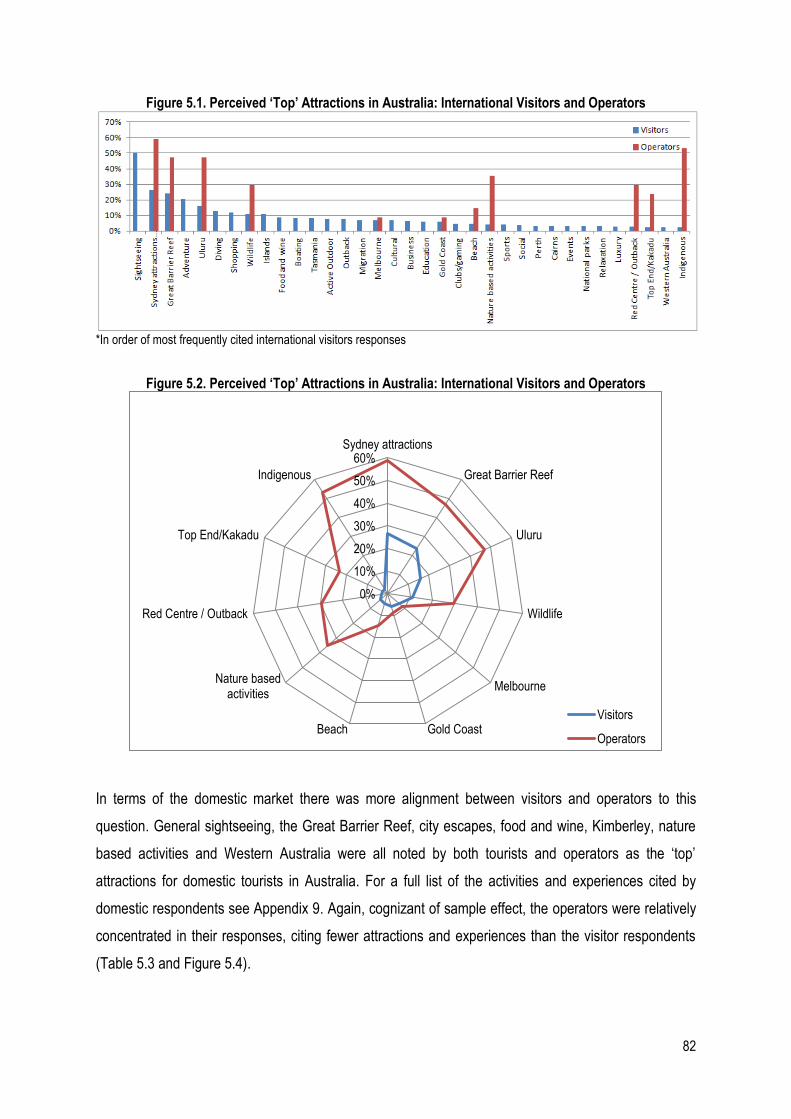
82
Figure 5.1. Perceived ‘Top’ Attractions in Australia: International Visitors and Operators
*In order of most frequently cited international visitors responses
Figure 5.2. Perceived ‘Top’ Attractions in Australia: International Visitors and Operators
In terms of the domestic market there was more alignment between visitors and operators to this
question. General sightseeing, the Great Barrier Reef, city escapes, food and wine, Kimberley, nature
based activities and Western Australia were all noted by both tourists and operators as the ‘top’
attractions for domestic tourists in Australia. For a full list of the activities and experiences cited by
domestic respondents see Appendix 9. Again, cognizant of sample effect, the operators were relatively
concentrated in their responses, citing fewer attractions and experiences than the visitor respondents
(Table 5.3 and Figure 5.4).
0%
10%
20%
30%
40%
50%
60%Sydney attractions
Great Barrier Reef
Uluru
Wildlife
Melbourne
Gold CoastBeach
Nature basedactivities
Red Centre / Outback
Top End/Kakadu
Indigenous
Visitors
Operators
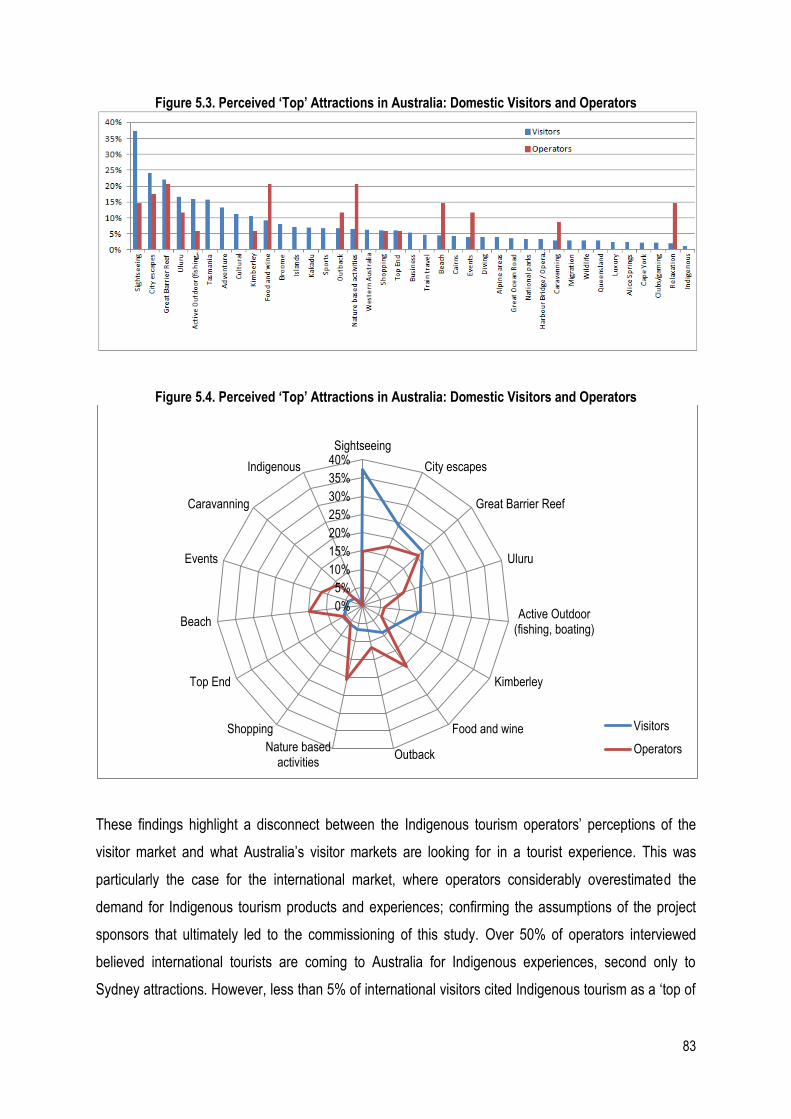
83
Figure 5.3. Perceived ‘Top’ Attractions in Australia: Domestic Visitors and Operators
Figure 5.4. Perceived ‘Top’ Attractions in Australia: Domestic Visitors and Operators
These findings highlight a disconnect between the Indigenous tourism operators’ perceptions of the
visitor market and what Australia’s visitor markets are looking for in a tourist experience. This was
particularly the case for the international market, where operators considerably overestimated the
demand for Indigenous tourism products and experiences; confirming the assumptions of the project
sponsors that ultimately led to the commissioning of this study. Over 50% of operators interviewed
believed international tourists are coming to Australia for Indigenous experiences, second only to
Sydney attractions. However, less than 5% of international visitors cited Indigenous tourism as a ‘top of
0%
5%
10%
15%
20%
25%
30%
35%
40%Sightseeing
City escapes
Great Barrier Reef
Uluru
Active Outdoor(fishing, boating)
Kimberley
Food and wine
OutbackNature based
activities
Shopping
Top End
Beach
Events
Caravanning
Indigenous
Visitors
Operators
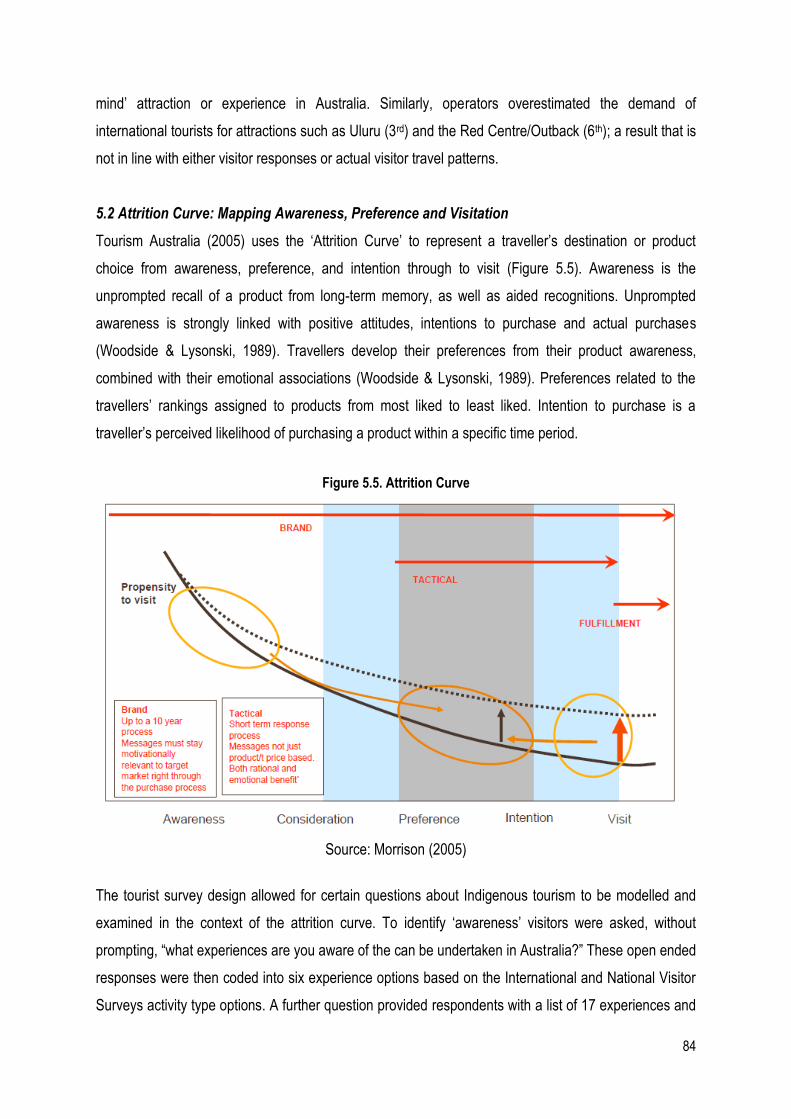
84
mind’ attraction or experience in Australia. Similarly, operators overestimated the demand of
international tourists for attractions such as Uluru (3rd) and the Red Centre/Outback (6th); a result that is
not in line with either visitor responses or actual visitor travel patterns.
5.2 Attrition Curve: Mapping Awareness, Preference and Visitation
Tourism Australia (2005) uses the ‘Attrition Curve’ to represent a traveller’s destination or product
choice from awareness, preference, and intention through to visit (Figure 5.5). Awareness is the
unprompted recall of a product from long-term memory, as well as aided recognitions. Unprompted
awareness is strongly linked with positive attitudes, intentions to purchase and actual purchases
(Woodside & Lysonski, 1989). Travellers develop their preferences from their product awareness,
combined with their emotional associations (Woodside & Lysonski, 1989). Preferences related to the
travellers’ rankings assigned to products from most liked to least liked. Intention to purchase is a
traveller’s perceived likelihood of purchasing a product within a specific time period.
Figure 5.5. Attrition Curve
Source: Morrison (2005)
The tourist survey design allowed for certain questions about Indigenous tourism to be modelled and
examined in the context of the attrition curve. To identify ‘awareness’ visitors were asked, without
prompting, “what experiences are you aware of the can be undertaken in Australia?” These open ended
responses were then coded into six experience options based on the International and National Visitor
Surveys activity type options. A further question provided respondents with a list of 17 experiences and
85
activities that can be undertaken in Australia, including five specific options for Indigenous tourism (see
Appendix 1). For this question respondents were asked to rate, on a scale of 1 to 5, how important it is
that they experience these activities while holidaying in Australia. These responses were recoded into
the six experience categories and allowed for measurement of ‘preferences’. Finally, using the same list
of 17 experiences and activities, respondents were asked whether they had, or would be, participating
in any of these experiences and activities while in Australia. Again these were recoded into the six
experience categories which allowed for the measurement of ‘intention/visit’.
Modelling was necessary to develop the attrition curve. The survey collected unprompted awareness,
prompted preferences and prompted intentions/visit. The prompted preferences and intentions were
scaled down by the unprompted awareness. This is based on the assumption that if the visitor was not
aware of the experience, they cannot have a preference or intention to visit (i.e., preferences are a
function of awareness and emotional associations). Awareness includes unaided recall from long-term
memory and aided recognitions. Consumer responses to unaided awareness questions have been
found to be associated strongly with positive attitudes, intentions to buy, and actual purchase (e.g.,
Axelrod 1968; Bronner & de Hoog 1974; Woodside & Carr 1988). Thus, to encourage a traveller’s
preference for a specific destination, an effective tourism marketing strategy is to gain a large share of
first mentions among such travellers who are considering competing travel destinations. The shares of
first mentions would be estimated by using responses to a question such as: "Of all the vacation-
holiday destinations that would be available for you to visit in 1988, what destination first comes to your
mind" (Woodside & Lyonski, 1989, p.9). The destination responses are henceforth referred to as the
consideration set.
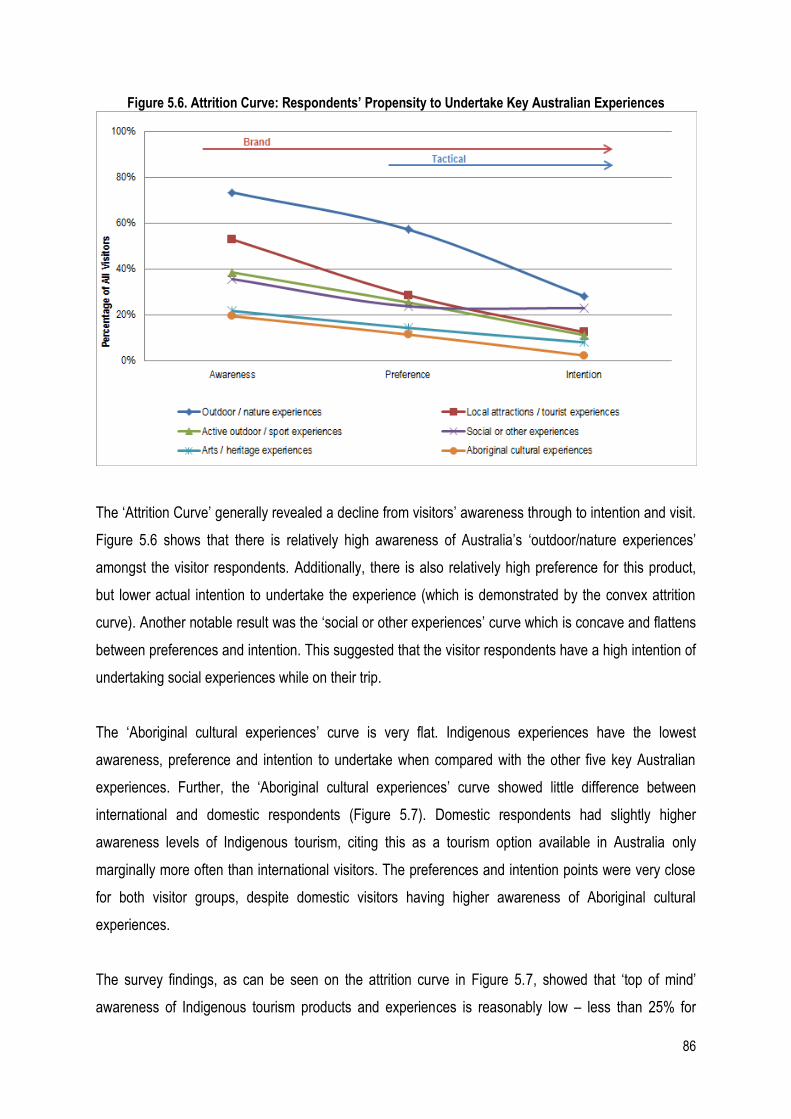
86
Figure 5.6. Attrition Curve: Respondents’ Propensity to Undertake Key Australian Experiences
The ‘Attrition Curve’ generally revealed a decline from visitors’ awareness through to intention and visit.
Figure 5.6 shows that there is relatively high awareness of Australia’s ‘outdoor/nature experiences’
amongst the visitor respondents. Additionally, there is also relatively high preference for this product,
but lower actual intention to undertake the experience (which is demonstrated by the convex attrition
curve). Another notable result was the ‘social or other experiences’ curve which is concave and flattens
between preferences and intention. This suggested that the visitor respondents have a high intention of
undertaking social experiences while on their trip.
The ‘Aboriginal cultural experiences’ curve is very flat. Indigenous experiences have the lowest
awareness, preference and intention to undertake when compared with the other five key Australian
experiences. Further, the ‘Aboriginal cultural experiences’ curve showed little difference between
international and domestic respondents (Figure 5.7). Domestic respondents had slightly higher
awareness levels of Indigenous tourism, citing this as a tourism option available in Australia only
marginally more often than international visitors. The preferences and intention points were very close
for both visitor groups, despite domestic visitors having higher awareness of Aboriginal cultural
experiences.
The survey findings, as can be seen on the attrition curve in Figure 5.7, showed that ‘top of mind’
awareness of Indigenous tourism products and experiences is reasonably low – less than 25% for
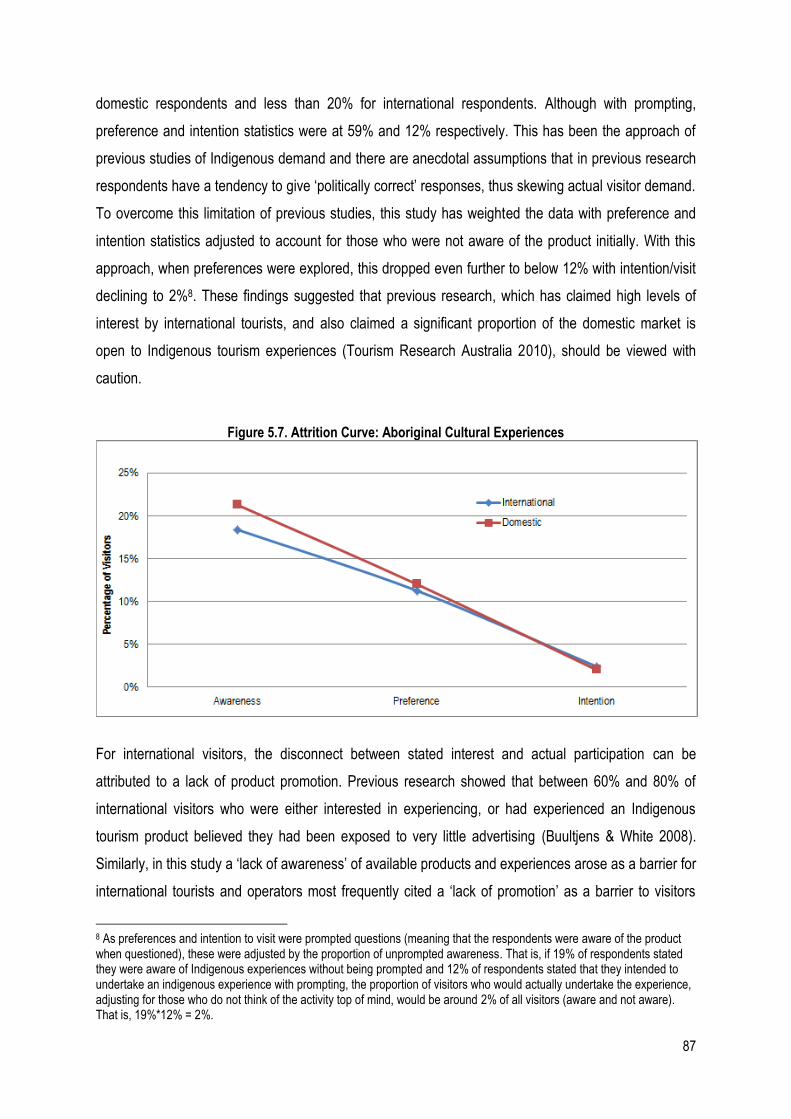
87
domestic respondents and less than 20% for international respondents. Although with prompting,
preference and intention statistics were at 59% and 12% respectively. This has been the approach of
previous studies of Indigenous demand and there are anecdotal assumptions that in previous research
respondents have a tendency to give ‘politically correct’ responses, thus skewing actual visitor demand.
To overcome this limitation of previous studies, this study has weighted the data with preference and
intention statistics adjusted to account for those who were not aware of the product initially. With this
approach, when preferences were explored, this dropped even further to below 12% with intention/visit
declining to 2%8. These findings suggested that previous research, which has claimed high levels of
interest by international tourists, and also claimed a significant proportion of the domestic market is
open to Indigenous tourism experiences (Tourism Research Australia 2010), should be viewed with
caution.
Figure 5.7. Attrition Curve: Aboriginal Cultural Experiences
For international visitors, the disconnect between stated interest and actual participation can be
attributed to a lack of product promotion. Previous research showed that between 60% and 80% of
international visitors who were either interested in experiencing, or had experienced an Indigenous
tourism product believed they had been exposed to very little advertising (Buultjens & White 2008).
Similarly, in this study a ‘lack of awareness’ of available products and experiences arose as a barrier for
international tourists and operators most frequently cited a ‘lack of promotion’ as a barrier to visitors
8 As preferences and intention to visit were prompted questions (meaning that the respondents were aware of the product when questioned), these were adjusted by the proportion of unprompted awareness. That is, if 19% of respondents stated they were aware of Indigenous experiences without being prompted and 12% of respondents stated that they intended to undertake an indigenous experience with prompting, the proportion of visitors who would actually undertake the experience, adjusting for those who do not think of the activity top of mind, would be around 2% of all visitors (aware and not aware). That is, 19%*12% = 2%.
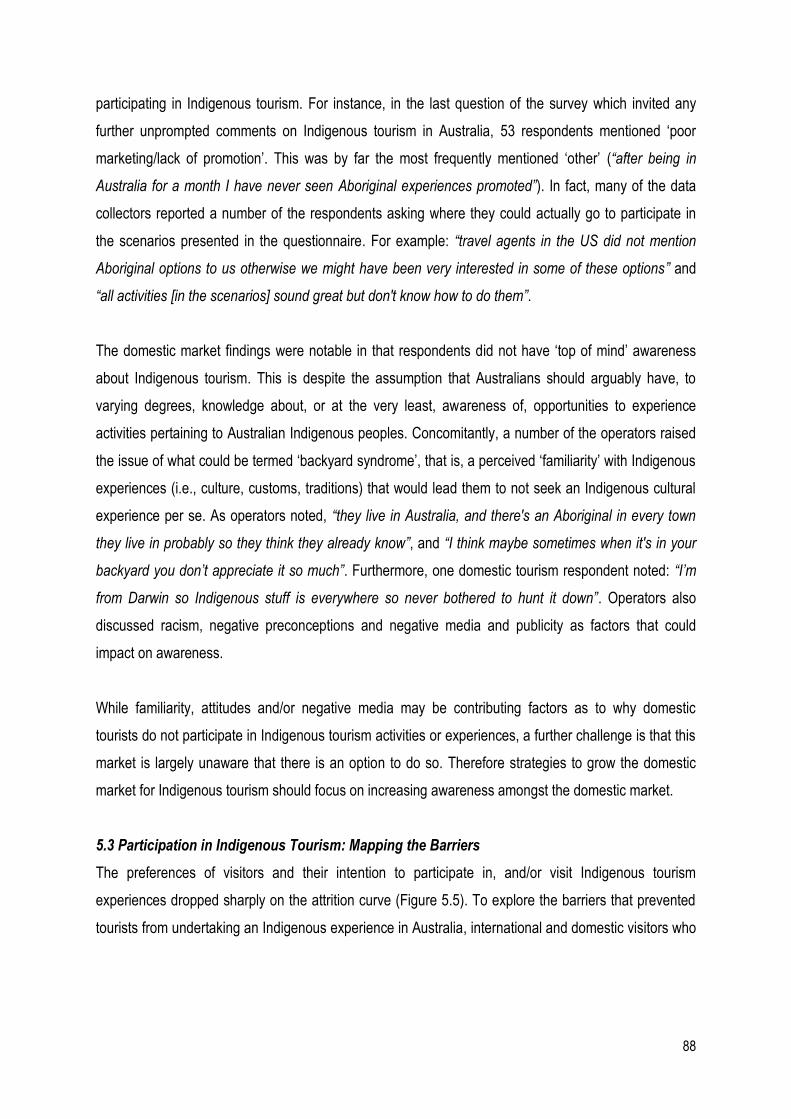
88
participating in Indigenous tourism. For instance, in the last question of the survey which invited any
further unprompted comments on Indigenous tourism in Australia, 53 respondents mentioned ‘poor
marketing/lack of promotion’. This was by far the most frequently mentioned ‘other’ (“after being in
Australia for a month I have never seen Aboriginal experiences promoted”). In fact, many of the data
collectors reported a number of the respondents asking where they could actually go to participate in
the scenarios presented in the questionnaire. For example: “travel agents in the US did not mention
Aboriginal options to us otherwise we might have been very interested in some of these options” and
“all activities [in the scenarios] sound great but don't know how to do them”.
The domestic market findings were notable in that respondents did not have ‘top of mind’ awareness
about Indigenous tourism. This is despite the assumption that Australians should arguably have, to
varying degrees, knowledge about, or at the very least, awareness of, opportunities to experience
activities pertaining to Australian Indigenous peoples. Concomitantly, a number of the operators raised
the issue of what could be termed ‘backyard syndrome’, that is, a perceived ‘familiarity’ with Indigenous
experiences (i.e., culture, customs, traditions) that would lead them to not seek an Indigenous cultural
experience per se. As operators noted, “they live in Australia, and there's an Aboriginal in every town
they live in probably so they think they already know”, and “I think maybe sometimes when it's in your
backyard you don’t appreciate it so much”. Furthermore, one domestic tourism respondent noted: “I’m
from Darwin so Indigenous stuff is everywhere so never bothered to hunt it down”. Operators also
discussed racism, negative preconceptions and negative media and publicity as factors that could
impact on awareness.
While familiarity, attitudes and/or negative media may be contributing factors as to why domestic
tourists do not participate in Indigenous tourism activities or experiences, a further challenge is that this
market is largely unaware that there is an option to do so. Therefore strategies to grow the domestic
market for Indigenous tourism should focus on increasing awareness amongst the domestic market.
5.3 Participation in Indigenous Tourism: Mapping the Barriers
The preferences of visitors and their intention to participate in, and/or visit Indigenous tourism
experiences dropped sharply on the attrition curve (Figure 5.5). To explore the barriers that prevented
tourists from undertaking an Indigenous experience in Australia, international and domestic visitors who
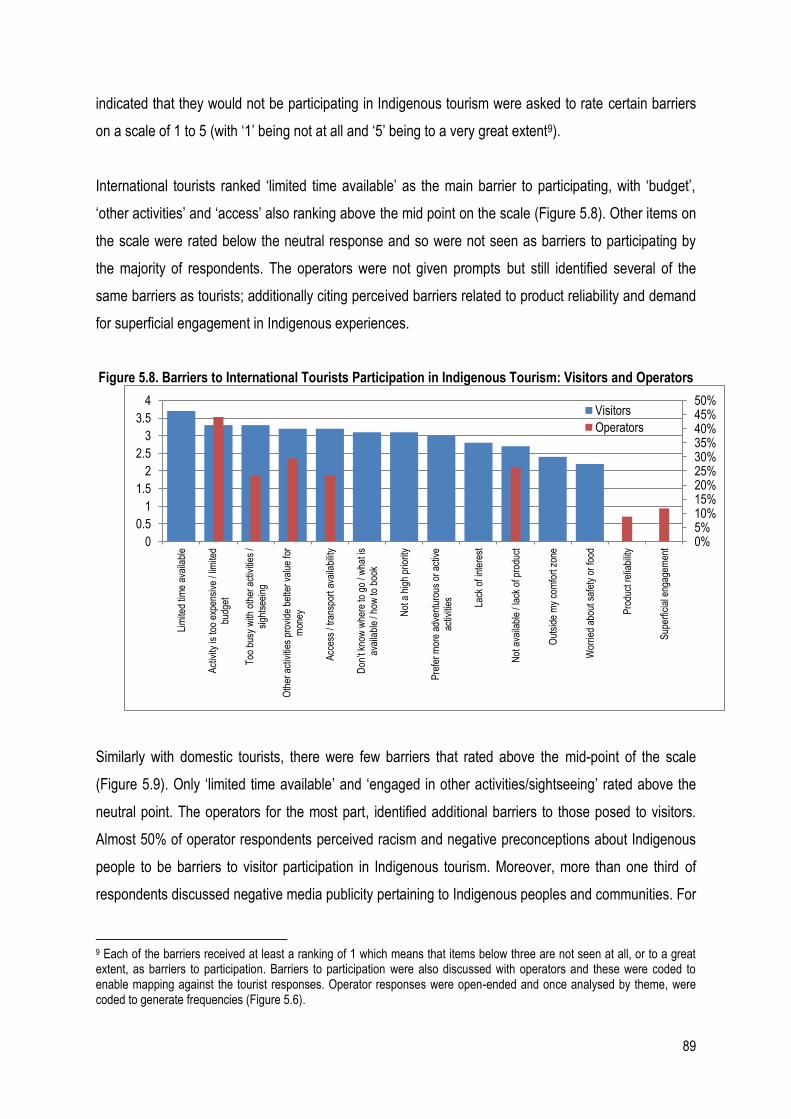
89
indicated that they would not be participating in Indigenous tourism were asked to rate certain barriers
on a scale of 1 to 5 (with ‘1’ being not at all and ‘5’ being to a very great extent9).
International tourists ranked ‘limited time available’ as the main barrier to participating, with ‘budget’,
‘other activities’ and ‘access’ also ranking above the mid point on the scale (Figure 5.8). Other items on
the scale were rated below the neutral response and so were not seen as barriers to participating by
the majority of respondents. The operators were not given prompts but still identified several of the
same barriers as tourists; additionally citing perceived barriers related to product reliability and demand
for superficial engagement in Indigenous experiences.
Figure 5.8. Barriers to International Tourists Participation in Indigenous Tourism: Visitors and Operators
Similarly with domestic tourists, there were few barriers that rated above the mid-point of the scale
(Figure 5.9). Only ‘limited time available’ and ‘engaged in other activities/sightseeing’ rated above the
neutral point. The operators for the most part, identified additional barriers to those posed to visitors.
Almost 50% of operator respondents perceived racism and negative preconceptions about Indigenous
people to be barriers to visitor participation in Indigenous tourism. Moreover, more than one third of
respondents discussed negative media publicity pertaining to Indigenous peoples and communities. For
9 Each of the barriers received at least a ranking of 1 which means that items below three are not seen at all, or to a great extent, as barriers to participation. Barriers to participation were also discussed with operators and these were coded to enable mapping against the tourist responses. Operator responses were open-ended and once analysed by theme, were coded to generate frequencies (Figure 5.6).
0%5%10%15%20%25%30%35%40%45%50%
0
0.5
1
1.5
2
2.5
3
3.5
4
Lim
ited
time
avai
labl
e
Act
ivity
is to
o ex
pens
ive
/ lim
ited
budg
et
Too
bus
y w
ith o
ther
act
iviti
es /
sigh
tsee
ing
Oth
er a
ctiv
ities
pro
vide
bet
ter
valu
e fo
rm
oney
Acc
ess
/ tra
nspo
rt a
vaila
bilit
y
Don
’t kn
ow w
here
to g
o / w
hat i
s av
aila
ble
/ how
to b
ook
Not
a h
igh
prio
rity
Pre
fer
mor
e ad
vent
urou
s or
act
ive
activ
ities La
ck o
f int
eres
t
Not
ava
ilabl
e / l
ack
of p
rodu
ct
Out
side
my
com
fort
zon
e
Wor
ried
abou
t saf
ety
or fo
od
Pro
duct
rel
iabi
lity
Sup
erfic
ial e
ngag
emen
t
Visitors
Operators
90
instance, one operator participant noted, “the way the media depicts Aboriginals. We only ever…hear
about the negative side”.
Figure 5.9. Barriers to Domestic Tourists Participation in Indigenous Tourism: Visitors and Operators
Within the visitor survey there was an option for respondents to list any other factors that they
considered to be barriers. Respondents indicated ‘other’ barriers as:
the experience was not deemed authentic (n=62),
they had previously participated in an Indigenous activity and did not see a need to do so
again (n=12).
While a low sample, several responses also related to previous negative interactions with Indigenous
individuals and/or communities; and having close contact with Indigenous peoples and/or communities
via friendships, employment or living in Indigenous communities. Some respondents had participated in
an Indigenous experience in another country and did not wish to do so again in Australia.
Given the relatively low levels of preference and intention/visit discussed previously with regards to the
attrition curve, the extent to which these results (i.e., the neutrality of most of the barriers in Figure 5.9)
truly reflect the barriers to participating in Indigenous tourism should be questioned. For instance,
respondents may have been hesitant to articulate broader barriers pertaining to otherwise culturally
sensitivity issues relating to Indigenous peoples and/or communities. In essence, respondents may
0%5%10%15%20%25%30%35%40%45%50%
0
0.5
1
1.5
2
2.5
3
3.5
Lim
ited
time
avai
labl
e
Too
bus
y w
ith o
ther
act
iviti
es /
sigh
tsee
ing
Not
a h
igh
prio
rity
Too
far
to tr
avel
Acc
ess
/ tra
nspo
rt a
vaila
bilit
y
Act
ivity
is to
o ex
pens
ive
/ lim
ited
budg
et
Lack
of i
nter
est
Not
ava
ilabl
e in
des
tinat
ions
you
are
visi
ting
Pre
fer
mor
e ad
vent
urou
s or
act
ive
activ
ities
Don
’t kn
ow w
here
to g
o / w
hat i
s av
aila
ble
/ how
to b
ook
Out
side
my
com
fort
zon
e
Wor
ried
abou
t saf
ety
or fo
od
Rac
ism
/neg
ativ
e pr
econ
cept
ions
Neg
ativ
e m
edia
pub
licity
Out
boun
d to
uris
m
Bac
kyar
d sy
ndro
me
Visitors
Operators
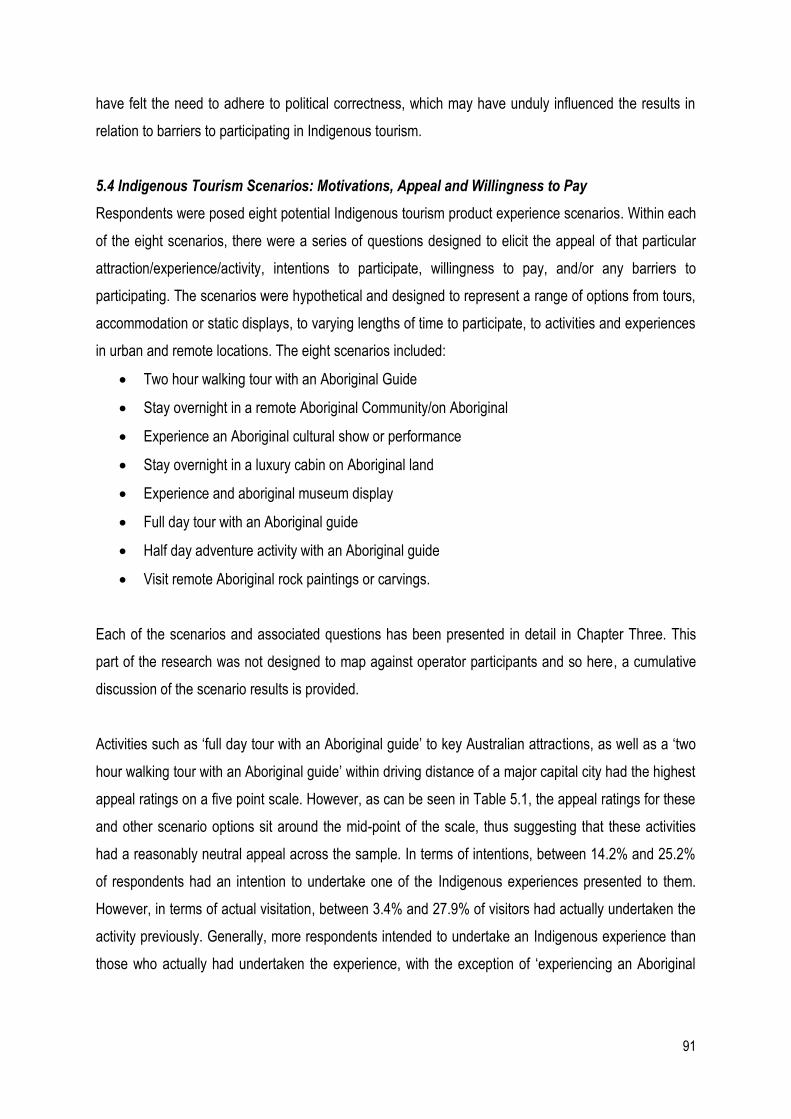
91
have felt the need to adhere to political correctness, which may have unduly influenced the results in
relation to barriers to participating in Indigenous tourism.
5.4 Indigenous Tourism Scenarios: Motivations, Appeal and Willingness to Pay
Respondents were posed eight potential Indigenous tourism product experience scenarios. Within each
of the eight scenarios, there were a series of questions designed to elicit the appeal of that particular
attraction/experience/activity, intentions to participate, willingness to pay, and/or any barriers to
participating. The scenarios were hypothetical and designed to represent a range of options from tours,
accommodation or static displays, to varying lengths of time to participate, to activities and experiences
in urban and remote locations. The eight scenarios included:
Two hour walking tour with an Aboriginal Guide
Stay overnight in a remote Aboriginal Community/on Aboriginal
Experience an Aboriginal cultural show or performance
Stay overnight in a luxury cabin on Aboriginal land
Experience and aboriginal museum display
Full day tour with an Aboriginal guide
Half day adventure activity with an Aboriginal guide
Visit remote Aboriginal rock paintings or carvings.
Each of the scenarios and associated questions has been presented in detail in Chapter Three. This
part of the research was not designed to map against operator participants and so here, a cumulative
discussion of the scenario results is provided.
Activities such as ‘full day tour with an Aboriginal guide’ to key Australian attractions, as well as a ‘two
hour walking tour with an Aboriginal guide’ within driving distance of a major capital city had the highest
appeal ratings on a five point scale. However, as can be seen in Table 5.1, the appeal ratings for these
and other scenario options sit around the mid-point of the scale, thus suggesting that these activities
had a reasonably neutral appeal across the sample. In terms of intentions, between 14.2% and 25.2%
of respondents had an intention to undertake one of the Indigenous experiences presented to them.
However, in terms of actual visitation, between 3.4% and 27.9% of visitors had actually undertaken the
activity previously. Generally, more respondents intended to undertake an Indigenous experience than
those who actually had undertaken the experience, with the exception of ‘experiencing an Aboriginal
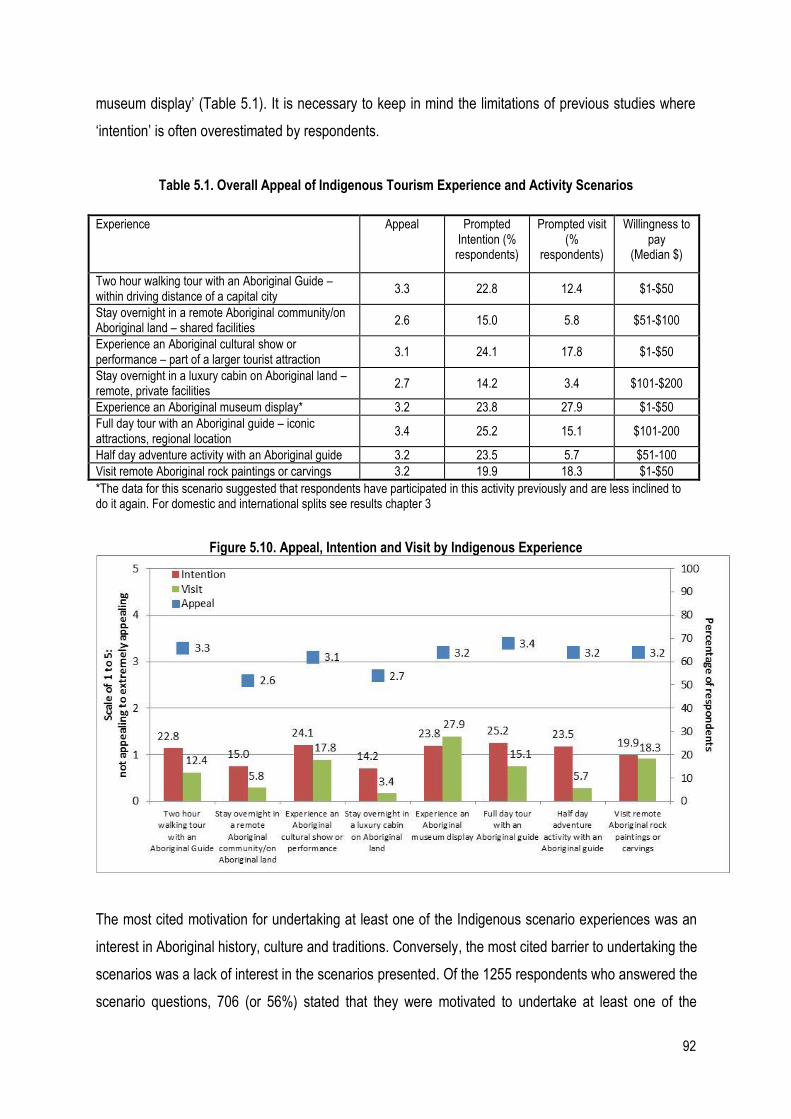
92
museum display’ (Table 5.1). It is necessary to keep in mind the limitations of previous studies where
‘intention’ is often overestimated by respondents.
Table 5.1. Overall Appeal of Indigenous Tourism Experience and Activity Scenarios
*The data for this scenario suggested that respondents have participated in this activity previously and are less inclined to do it again. For domestic and international splits see results chapter 3
Figure 5.10. Appeal, Intention and Visit by Indigenous Experience
The most cited motivation for undertaking at least one of the Indigenous scenario experiences was an
interest in Aboriginal history, culture and traditions. Conversely, the most cited barrier to undertaking the
scenarios was a lack of interest in the scenarios presented. Of the 1255 respondents who answered the
scenario questions, 706 (or 56%) stated that they were motivated to undertake at least one of the
Experience Appeal Prompted Intention (% respondents)
Prompted visit (%
respondents)
Willingness to pay
(Median $)
Two hour walking tour with an Aboriginal Guide – within driving distance of a capital city
3.3 22.8 12.4 $1-$50
Stay overnight in a remote Aboriginal community/on Aboriginal land – shared facilities
2.6 15.0 5.8 $51-$100
Experience an Aboriginal cultural show or performance – part of a larger tourist attraction
3.1 24.1 17.8 $1-$50
Stay overnight in a luxury cabin on Aboriginal land – remote, private facilities
2.7 14.2 3.4 $101-$200
Experience an Aboriginal museum display* 3.2 23.8 27.9 $1-$50
Full day tour with an Aboriginal guide – iconic attractions, regional location
3.4 25.2 15.1 $101-200
Half day adventure activity with an Aboriginal guide 3.2 23.5 5.7 $51-100
Visit remote Aboriginal rock paintings or carvings 3.2 19.9 18.3 $1-$50
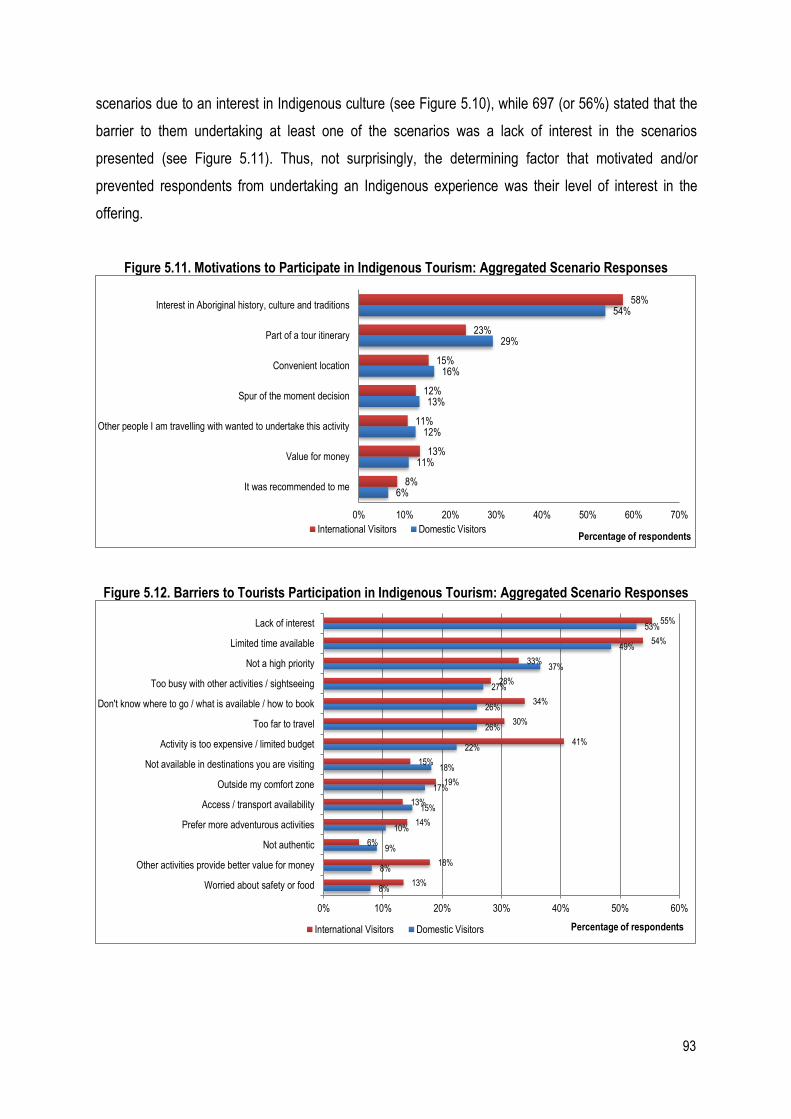
93
scenarios due to an interest in Indigenous culture (see Figure 5.10), while 697 (or 56%) stated that the
barrier to them undertaking at least one of the scenarios was a lack of interest in the scenarios
presented (see Figure 5.11). Thus, not surprisingly, the determining factor that motivated and/or
prevented respondents from undertaking an Indigenous experience was their level of interest in the
offering.
Figure 5.11. Motivations to Participate in Indigenous Tourism: Aggregated Scenario Responses
Figure 5.12. Barriers to Tourists Participation in Indigenous Tourism: Aggregated Scenario Responses
6%
11%
12%
13%
16%
29%
54%
8%
13%
11%
12%
15%
23%
58%
0% 10% 20% 30% 40% 50% 60% 70%
It was recommended to me
Value for money
Other people I am travelling with wanted to undertake this activity
Spur of the moment decision
Convenient location
Part of a tour itinerary
Interest in Aboriginal history, culture and traditions
Percentage of respondents International Visitors Domestic Visitors
8%
8%
9%
10%
15%
17%
18%
22%
26%
26%
27%
37%
49%
53%
13%
18%
6%
14%
13%
19%
15%
41%
30%
34%
28%
33%
54%
55%
0% 10% 20% 30% 40% 50% 60%
Worried about safety or food
Other activities provide better value for money
Not authentic
Prefer more adventurous activities
Access / transport availability
Outside my comfort zone
Not available in destinations you are visiting
Activity is too expensive / limited budget
Too far to travel
Don't know where to go / what is available / how to book
Too busy with other activities / sightseeing
Not a high priority
Limited time available
Lack of interest
Percentage of respondents International Visitors Domestic Visitors
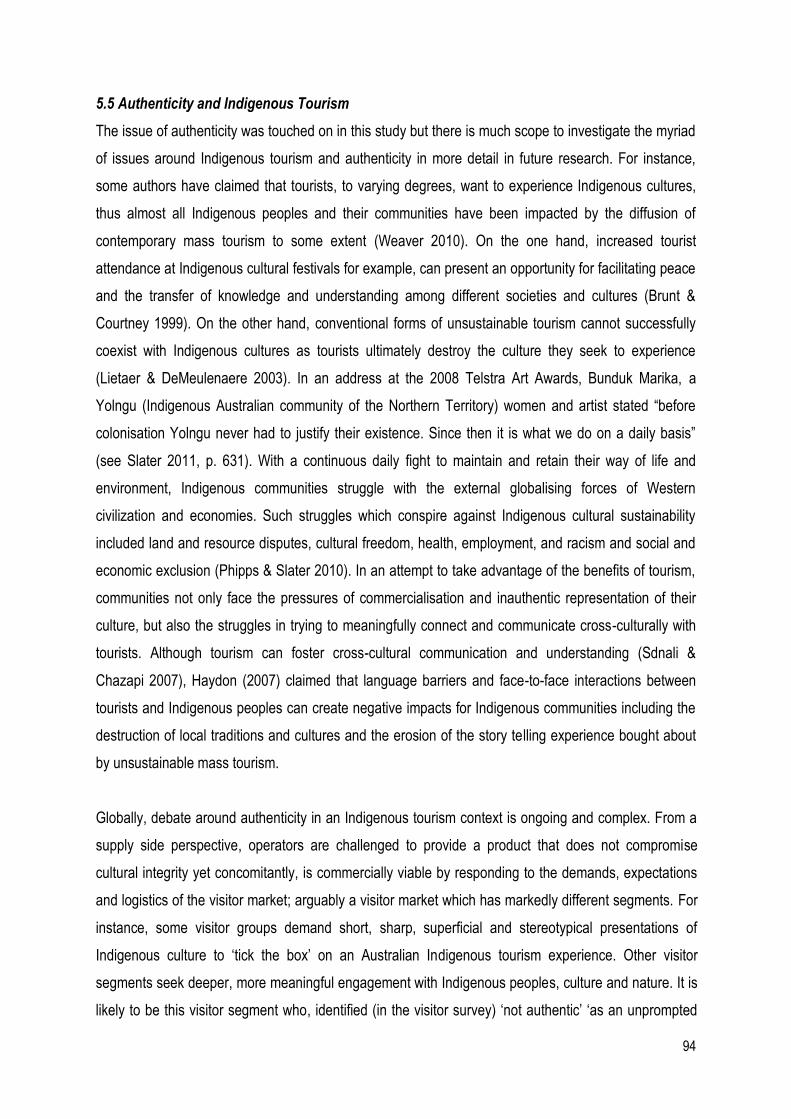
94
5.5 Authenticity and Indigenous Tourism
The issue of authenticity was touched on in this study but there is much scope to investigate the myriad
of issues around Indigenous tourism and authenticity in more detail in future research. For instance,
some authors have claimed that tourists, to varying degrees, want to experience Indigenous cultures,
thus almost all Indigenous peoples and their communities have been impacted by the diffusion of
contemporary mass tourism to some extent (Weaver 2010). On the one hand, increased tourist
attendance at Indigenous cultural festivals for example, can present an opportunity for facilitating peace
and the transfer of knowledge and understanding among different societies and cultures (Brunt &
Courtney 1999). On the other hand, conventional forms of unsustainable tourism cannot successfully
coexist with Indigenous cultures as tourists ultimately destroy the culture they seek to experience
(Lietaer & DeMeulenaere 2003). In an address at the 2008 Telstra Art Awards, Bunduk Marika, a
Yolngu (Indigenous Australian community of the Northern Territory) women and artist stated “before
colonisation Yolngu never had to justify their existence. Since then it is what we do on a daily basis”
(see Slater 2011, p. 631). With a continuous daily fight to maintain and retain their way of life and
environment, Indigenous communities struggle with the external globalising forces of Western
civilization and economies. Such struggles which conspire against Indigenous cultural sustainability
included land and resource disputes, cultural freedom, health, employment, and racism and social and
economic exclusion (Phipps & Slater 2010). In an attempt to take advantage of the benefits of tourism,
communities not only face the pressures of commercialisation and inauthentic representation of their
culture, but also the struggles in trying to meaningfully connect and communicate cross-culturally with
tourists. Although tourism can foster cross-cultural communication and understanding (Sdnali &
Chazapi 2007), Haydon (2007) claimed that language barriers and face-to-face interactions between
tourists and Indigenous peoples can create negative impacts for Indigenous communities including the
destruction of local traditions and cultures and the erosion of the story telling experience bought about
by unsustainable mass tourism.
Globally, debate around authenticity in an Indigenous tourism context is ongoing and complex. From a
supply side perspective, operators are challenged to provide a product that does not compromise
cultural integrity yet concomitantly, is commercially viable by responding to the demands, expectations
and logistics of the visitor market; arguably a visitor market which has markedly different segments. For
instance, some visitor groups demand short, sharp, superficial and stereotypical presentations of
Indigenous culture to ‘tick the box’ on an Australian Indigenous tourism experience. Other visitor
segments seek deeper, more meaningful engagement with Indigenous peoples, culture and nature. It is
likely to be this visitor segment who, identified (in the visitor survey) ‘not authentic’ ‘as an unprompted
95
reason for not participating (n=62) in Indigenous tourism: “in Australia it's more 'put-on' and touristy”.
Similarly, a number of respondents (n=15) identified ‘too commercial’ as a reason why some Indigenous
tourism scenarios (in the visitor survey) did not/would not appeal. The challenge for Indigenous tourism
operators then, is undoubtedly finding the common ground between the two groups, and/or, making a
conscious decision to position the product to a particular target market.
For the operators involved in this study, authenticity meant a personal experience or engagement with
an Indigenous person. They regarded this as important for both the international and domestic market.
Similarly, Tourism Research Australia (2010) proposed Indigenous people should be employed to
deliver the Indigenous tourism experience in order to increase visitors’ perception that the experience is
authentic. While most operators concurred, they noted a problem arose from challenges associated with
the employment of Indigenous guides, largely due to a lack of employee capacity (i.e., suitably
qualified) and commitment.
Indigenous ownership, control and participation in the presentation of Indigenous tourism constitute a
complex issue and one that also impacts on discussions of authenticity. Tourism ventures may, and
indeed have been created around Indigenous culture and themes. However, the respective Indigenous
peoples and communities connected to such ventures, have varying degrees of control over the
presentation and representation of their culture and traditions. Globally, many Indigenous tourism
ventures have been controversial and continue to create heated debate about cultural expropriation,
Indigenous intellectual property rights and copyright infringement. Moreover, commercialisation of the
Indigenous tourism ‘product’ significantly contribute to increasing criticism that Indigenous products are
inauthentic and/or highly commodified (Butler & Hinch, 2007).
Indigenous tourism operator participants in this research were mixed in their responses to issues about
product authenticity. Most thought that it was important in principle, but few claimed authentic product
was actually important to the visitors. Several noted that from a visitor perspective, what would be more
important was whether the guide was Indigenous. Some visitor respondents (n=10), were invited to
make further comments about Indigenous tourism in Australia and discussed issues of ownership and
authenticity: “would want to make sure that community themselves are benefitting from tourism and that
it is not too commercialized and sometimes it is hard to evaluate whether it is authentic”.
The issue of contemporary authenticity also emerged at several points in the operator interviews. For
instance, some participants felt that an authentic experience was “meeting the people as they’re living
96
their lives today”. This contrasted with what many operators felt was a desire by visitors for a
stereotypical or ‘traditional’ portrayal of Indigenous culture. Certainly, both in Australia and overseas it is
acknowledged that marketing is a big contributor in reinforcing stereotypes of Indigenous culture where
images of Indigenous peoples are used to embellish the cultural attractiveness of the country as a
tourism destination (Pomering, 2011; Whitford & Ruhanen, 2009). The interview respondents discussed
this issue at length, with many expressing dissatisfaction with the expectation of visitors that Aboriginals
will be “sitting with a lap-lap on and a painted…face”.
The results of this study clearly demonstrated the notion of authenticity is neither absolute nor all-
encompassing but rather socially constructed, interpreted and relative, depending on changes in the
context and of individual perceptions (Yang & Wall 2009). As such, there are not one but many
perceptions of this highly complex and contested concept, which is exacerbated by its extreme
heterogeneity and diversity of usage (Belhassen & Caton 2006). The results also revealed that tourism
has the capacity to induce cultural change and commercialisation which can ultimately diminish the
importance of meanings and destroy the authenticity of culture (Taylor 2001).
The issue at hand then, centres on how Indigenous tourism experiences can be deemed authentic if
they are commodified and packaged for tourism (Hillman 2007), and when they are performed outside
their true traditional context (Fredline 2000). For those operators who do not want tourism impinging
upon and giving cause to alter their culture and traditions, consideration can be given to implementing
‘staged authenticity’ where the host constructs artificial sites to keep the inquisitive tourist at bay (Urry
1995). That is, the host community can protect their culture by creating front-regions (i.e., limited
activities for tourists as staged authenticity), and back-regions (i.e., sacred traditional ceremonies away
from tourists’ gazes). Concomitantly, Ryan and Huyton (2002) suggested adopting the term
authorisation over authenticity as this redirects the attention to authority instead of defining a concept
that constantly changes. While there is no clear solution to reaching consensus on what constitutes
authenticity, arguably there will be consensus that “authenticity still matters” (Pearce 2007, p. 86).
97
Stage Two:
The Chinese Inbound Market and
Indigenous Tourism
98
Chapter Six: Results – Chinese Visitor Surveys
Two separate data sets were collected from inbound Chinese visitors for Stage Two of the study. The
first was the visitor survey that was undertaken for Stage One of the research in Sydney, Melbourne,
Darwin and Cairns (referred to from here as Chinese visitor survey). Of the 861 international visitors
surveyed, 115 were Chinese respondents. The second inbound data set was a survey undertaken with
275 Chinese tourists travelling on group tours (referred to from here as Chinese tour group). Where
data is available, results for both data sets are presented together. However, the Chinese tour group
survey was self-administered and due to various limitations associated with surveying in this way, it was
considerably shorter and consisted of fewer questions and/or question configurations that were different
to the ‘main’ Chinese visitor survey.
6.1 Demographics and Trip Profile:
A total of 861 international visitors were surveyed in the main visitor survey. Of these, 115 were
Chinese respondents. The gender distribution of the Chinese visitor survey respondents was slightly
skewed towards females (56%). Approximately half (51%) of the respondents were aged 15 to 29
years, with the remainder being 30 years or over. The majority of the Chinese respondents were in
Australia for a holiday (62%), followed by other purposes such as education and business.
The gender distribution of the 275 Chinese tour group respondents was 59% male and 41% female and
just over half of the respondents were aged between 25-49 years. The average length of stay in
Australia for Chinese visitors in a tour group was 8.3 nights.
6.2 Product Awareness and Preferences
6.2.1 Awareness of Australian activities and experiences
Chinese visitor survey respondents were asked, without prompting from the interviewers, what activities
and experiences they were aware of that could be undertaken in Australia. This question was aiming for
spontaneous responses that would elicit respondents’ ‘top of mind’ awareness of the types of activities,
experiences or attractions available in Australia (Table 6.1).
Similarly the Chinese tour group survey also asked respondents to indicate which of the following list of
experiences they were aware of that could be undertaken in Australia. As this was a self-administered
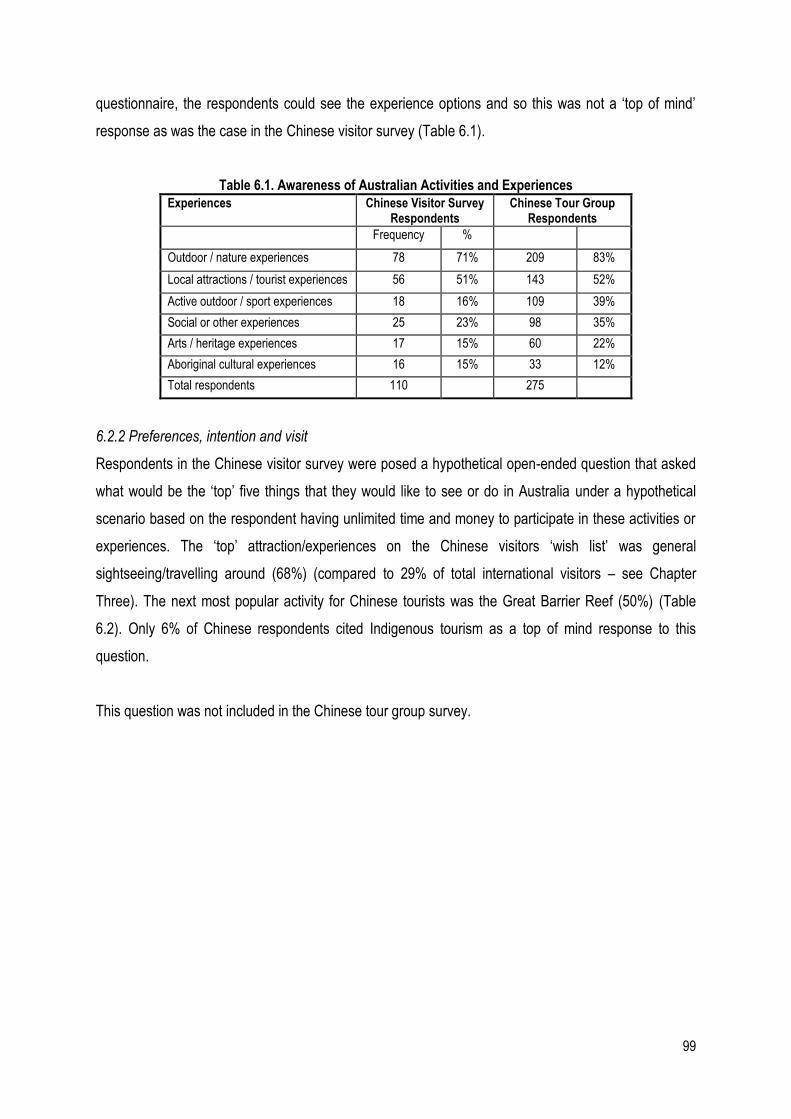
99
questionnaire, the respondents could see the experience options and so this was not a ‘top of mind’
response as was the case in the Chinese visitor survey (Table 6.1).
Table 6.1. Awareness of Australian Activities and Experiences
Experiences Chinese Visitor Survey Respondents
Chinese Tour Group Respondents
Frequency %
Outdoor / nature experiences 78 71% 209 83%
Local attractions / tourist experiences 56 51% 143 52%
Active outdoor / sport experiences 18 16% 109 39%
Social or other experiences 25 23% 98 35%
Arts / heritage experiences 17 15% 60 22%
Aboriginal cultural experiences 16 15% 33 12%
Total respondents 110 275
6.2.2 Preferences, intention and visit
Respondents in the Chinese visitor survey were posed a hypothetical open-ended question that asked
what would be the ‘top’ five things that they would like to see or do in Australia under a hypothetical
scenario based on the respondent having unlimited time and money to participate in these activities or
experiences. The ‘top’ attraction/experiences on the Chinese visitors ‘wish list’ was general
sightseeing/travelling around (68%) (compared to 29% of total international visitors – see Chapter
Three). The next most popular activity for Chinese tourists was the Great Barrier Reef (50%) (Table
6.2). Only 6% of Chinese respondents cited Indigenous tourism as a top of mind response to this
question.
This question was not included in the Chinese tour group survey.
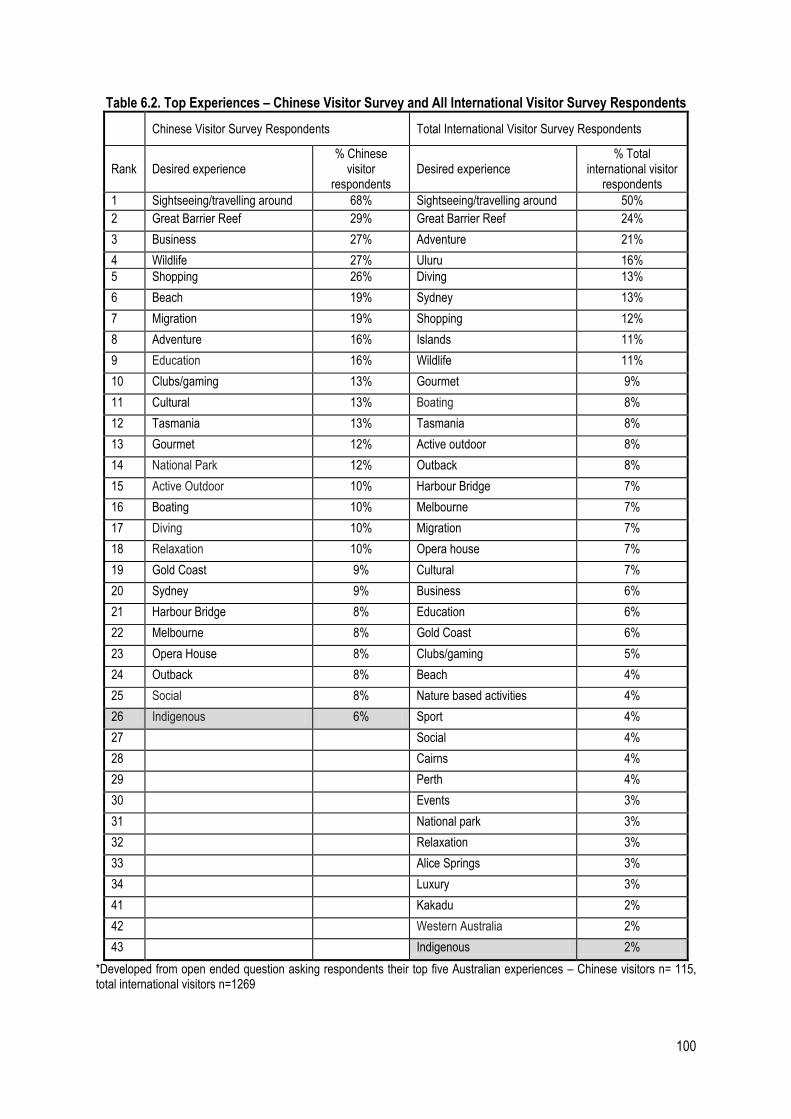
100
Table 6.2. Top Experiences – Chinese Visitor Survey and All International Visitor Survey Respondents
Chinese Visitor Survey Respondents Total International Visitor Survey Respondents
Rank Desired experience % Chinese
visitor respondents
Desired experience % Total
international visitor respondents
1 Sightseeing/travelling around 68% Sightseeing/travelling around 50%
2 Great Barrier Reef 29% Great Barrier Reef 24%
3 Business 27% Adventure 21%
4 Wildlife 27% Uluru 16%
5 Shopping 26% Diving 13%
6 Beach 19% Sydney 13%
7 Migration 19% Shopping 12%
8 Adventure 16% Islands 11%
9 Education 16% Wildlife 11%
10 Clubs/gaming 13% Gourmet 9%
11 Cultural 13% Boating 8%
12 Tasmania 13% Tasmania 8%
13 Gourmet 12% Active outdoor 8%
14 National Park 12% Outback 8%
15 Active Outdoor 10% Harbour Bridge 7%
16 Boating 10% Melbourne 7%
17 Diving 10% Migration 7%
18 Relaxation 10% Opera house 7%
19 Gold Coast 9% Cultural 7%
20 Sydney 9% Business 6%
21 Harbour Bridge 8% Education 6%
22 Melbourne 8% Gold Coast 6%
23 Opera House 8% Clubs/gaming 5%
24 Outback 8% Beach 4%
25 Social 8% Nature based activities 4%
26 Indigenous 6% Sport 4%
27 Social 4%
28 Cairns 4%
29 Perth 4%
30 Events 3%
31 National park 3%
32 Relaxation 3%
33 Alice Springs 3%
34 Luxury 3%
41 Kakadu 2%
42 Western Australia 2%
43 Indigenous 2%
*Developed from open ended question asking respondents their top five Australian experiences – Chinese visitors n= 115, total international visitors n=1269
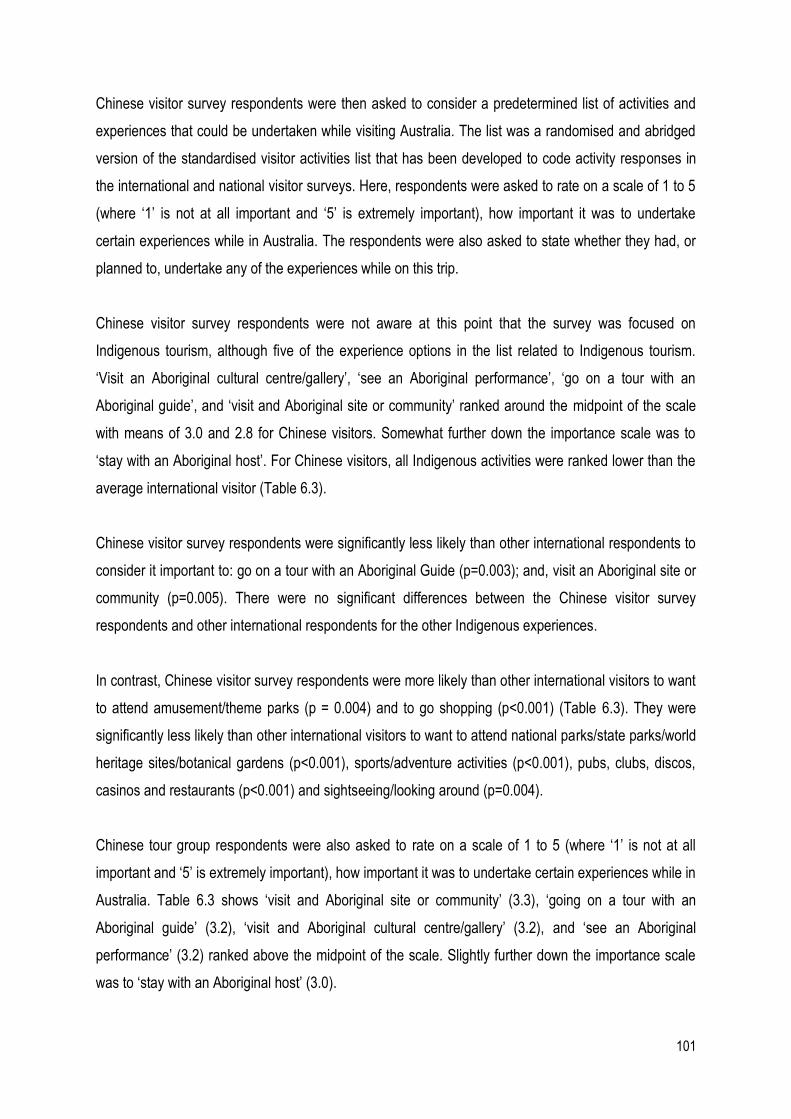
101
Chinese visitor survey respondents were then asked to consider a predetermined list of activities and
experiences that could be undertaken while visiting Australia. The list was a randomised and abridged
version of the standardised visitor activities list that has been developed to code activity responses in
the international and national visitor surveys. Here, respondents were asked to rate on a scale of 1 to 5
(where ‘1’ is not at all important and ‘5’ is extremely important), how important it was to undertake
certain experiences while in Australia. The respondents were also asked to state whether they had, or
planned to, undertake any of the experiences while on this trip.
Chinese visitor survey respondents were not aware at this point that the survey was focused on
Indigenous tourism, although five of the experience options in the list related to Indigenous tourism.
‘Visit an Aboriginal cultural centre/gallery’, ‘see an Aboriginal performance’, ‘go on a tour with an
Aboriginal guide’, and ‘visit and Aboriginal site or community’ ranked around the midpoint of the scale
with means of 3.0 and 2.8 for Chinese visitors. Somewhat further down the importance scale was to
‘stay with an Aboriginal host’. For Chinese visitors, all Indigenous activities were ranked lower than the
average international visitor (Table 6.3).
Chinese visitor survey respondents were significantly less likely than other international respondents to
consider it important to: go on a tour with an Aboriginal Guide (p=0.003); and, visit an Aboriginal site or
community (p=0.005). There were no significant differences between the Chinese visitor survey
respondents and other international respondents for the other Indigenous experiences.
In contrast, Chinese visitor survey respondents were more likely than other international visitors to want
to attend amusement/theme parks (p = 0.004) and to go shopping (p<0.001) (Table 6.3). They were
significantly less likely than other international visitors to want to attend national parks/state parks/world
heritage sites/botanical gardens (p<0.001), sports/adventure activities (p<0.001), pubs, clubs, discos,
casinos and restaurants (p<0.001) and sightseeing/looking around (p=0.004).
Chinese tour group respondents were also asked to rate on a scale of 1 to 5 (where ‘1’ is not at all
important and ‘5’ is extremely important), how important it was to undertake certain experiences while in
Australia. Table 6.3 shows ‘visit and Aboriginal site or community’ (3.3), ‘going on a tour with an
Aboriginal guide’ (3.2), ‘visit and Aboriginal cultural centre/gallery’ (3.2), and ‘see an Aboriginal
performance’ (3.2) ranked above the midpoint of the scale. Slightly further down the importance scale
was to ‘stay with an Aboriginal host’ (3.0).
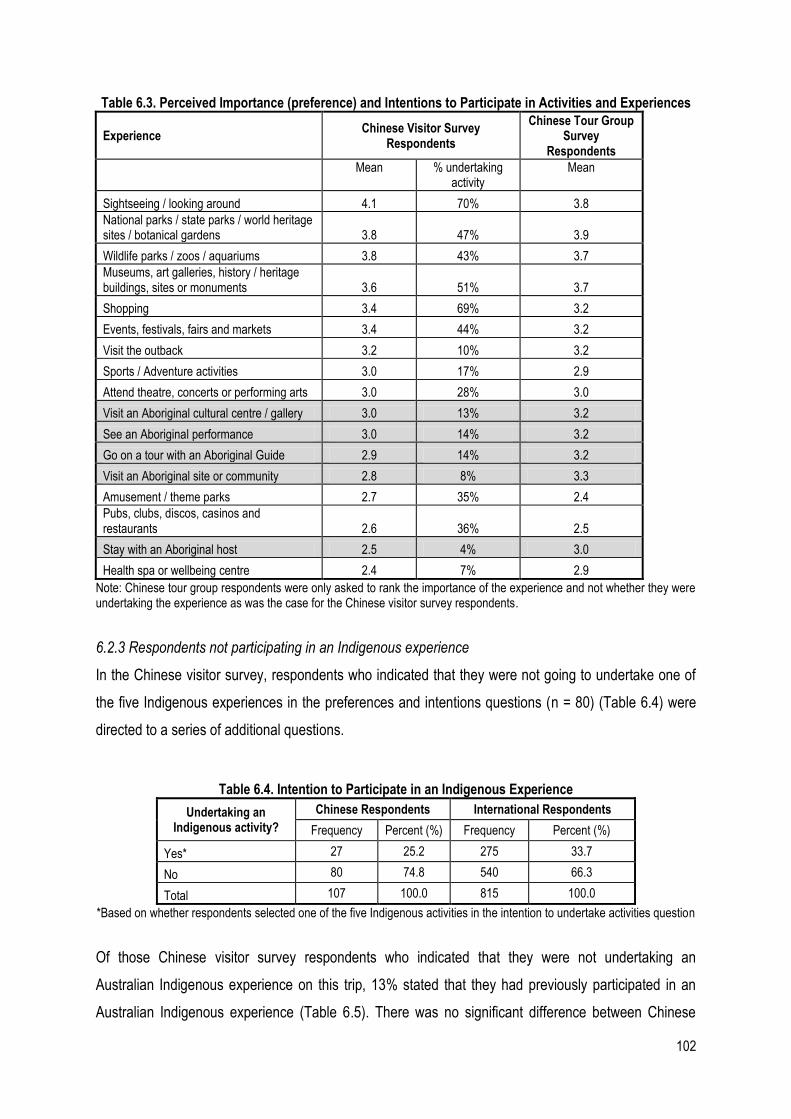
102
Table 6.3. Perceived Importance (preference) and Intentions to Participate in Activities and Experiences
Experience Chinese Visitor Survey
Respondents
Chinese Tour Group Survey
Respondents
Mean % undertaking activity
Mean
Sightseeing / looking around 4.1 70% 3.8
National parks / state parks / world heritage sites / botanical gardens 3.8 47% 3.9
Wildlife parks / zoos / aquariums 3.8 43% 3.7
Museums, art galleries, history / heritage buildings, sites or monuments 3.6 51% 3.7
Shopping 3.4 69% 3.2
Events, festivals, fairs and markets 3.4 44% 3.2
Visit the outback 3.2 10% 3.2
Sports / Adventure activities 3.0 17% 2.9
Attend theatre, concerts or performing arts 3.0 28% 3.0
Visit an Aboriginal cultural centre / gallery 3.0 13% 3.2
See an Aboriginal performance 3.0 14% 3.2
Go on a tour with an Aboriginal Guide 2.9 14% 3.2
Visit an Aboriginal site or community 2.8 8% 3.3
Amusement / theme parks 2.7 35% 2.4
Pubs, clubs, discos, casinos and restaurants 2.6 36% 2.5
Stay with an Aboriginal host 2.5 4% 3.0
Health spa or wellbeing centre 2.4 7% 2.9
Note: Chinese tour group respondents were only asked to rank the importance of the experience and not whether they were undertaking the experience as was the case for the Chinese visitor survey respondents.
6.2.3 Respondents not participating in an Indigenous experience
In the Chinese visitor survey, respondents who indicated that they were not going to undertake one of
the five Indigenous experiences in the preferences and intentions questions (n = 80) (Table 6.4) were
directed to a series of additional questions.
Table 6.4. Intention to Participate in an Indigenous Experience
Undertaking an Indigenous activity?
Chinese Respondents International Respondents
Frequency Percent (%) Frequency Percent (%)
Yes* 27 25.2 275 33.7
No 80 74.8 540 66.3
Total 107 100.0 815 100.0
*Based on whether respondents selected one of the five Indigenous activities in the intention to undertake activities question
Of those Chinese visitor survey respondents who indicated that they were not undertaking an
Australian Indigenous experience on this trip, 13% stated that they had previously participated in an
Australian Indigenous experience (Table 6.5). There was no significant difference between Chinese
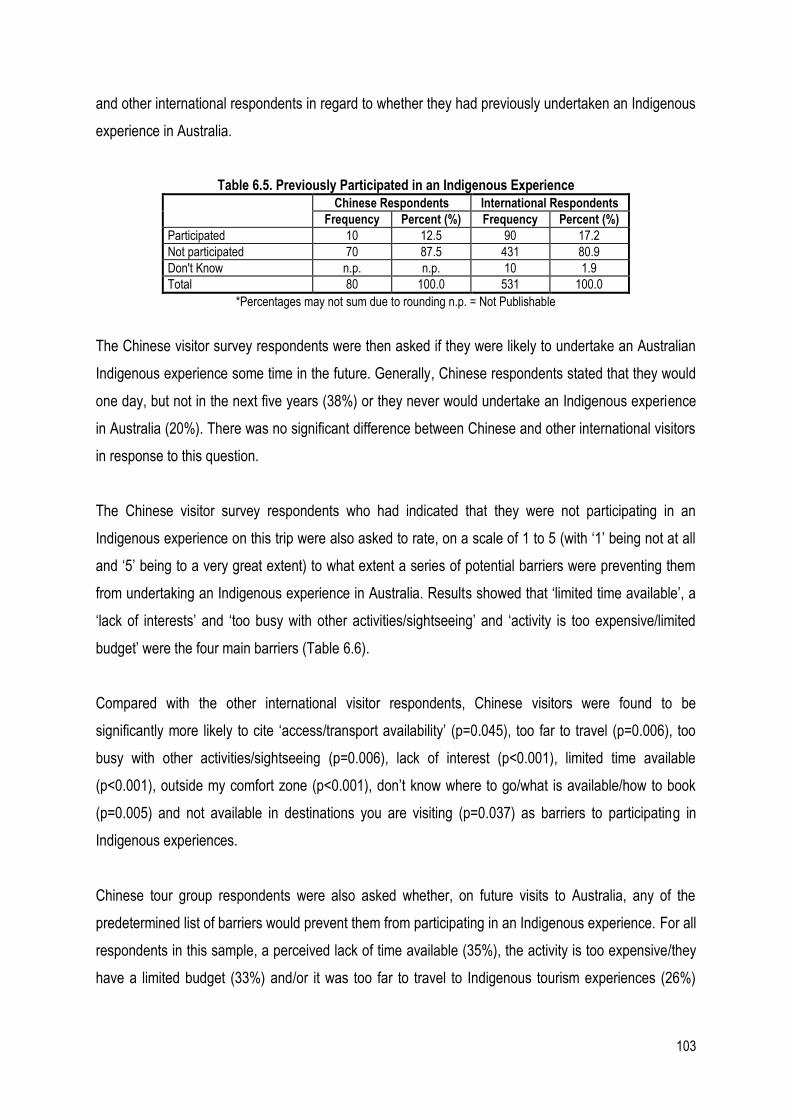
103
and other international respondents in regard to whether they had previously undertaken an Indigenous
experience in Australia.
Table 6.5. Previously Participated in an Indigenous Experience
Chinese Respondents International Respondents
Frequency Percent (%) Frequency Percent (%)
Participated 10 12.5 90 17.2
Not participated 70 87.5 431 80.9
Don't Know n.p. n.p. 10 1.9
Total 80 100.0 531 100.0
*Percentages may not sum due to rounding n.p. = Not Publishable
The Chinese visitor survey respondents were then asked if they were likely to undertake an Australian
Indigenous experience some time in the future. Generally, Chinese respondents stated that they would
one day, but not in the next five years (38%) or they never would undertake an Indigenous experience
in Australia (20%). There was no significant difference between Chinese and other international visitors
in response to this question.
The Chinese visitor survey respondents who had indicated that they were not participating in an
Indigenous experience on this trip were also asked to rate, on a scale of 1 to 5 (with ‘1’ being not at all
and ‘5’ being to a very great extent) to what extent a series of potential barriers were preventing them
from undertaking an Indigenous experience in Australia. Results showed that ‘limited time available’, a
‘lack of interests’ and ‘too busy with other activities/sightseeing’ and ‘activity is too expensive/limited
budget’ were the four main barriers (Table 6.6).
Compared with the other international visitor respondents, Chinese visitors were found to be
significantly more likely to cite ‘access/transport availability’ (p=0.045), too far to travel (p=0.006), too
busy with other activities/sightseeing (p=0.006), lack of interest (p<0.001), limited time available
(p<0.001), outside my comfort zone (p<0.001), don’t know where to go/what is available/how to book
(p=0.005) and not available in destinations you are visiting (p=0.037) as barriers to participating in
Indigenous experiences.
Chinese tour group respondents were also asked whether, on future visits to Australia, any of the
predetermined list of barriers would prevent them from participating in an Indigenous experience. For all
respondents in this sample, a perceived lack of time available (35%), the activity is too expensive/they
have a limited budget (33%) and/or it was too far to travel to Indigenous tourism experiences (26%)
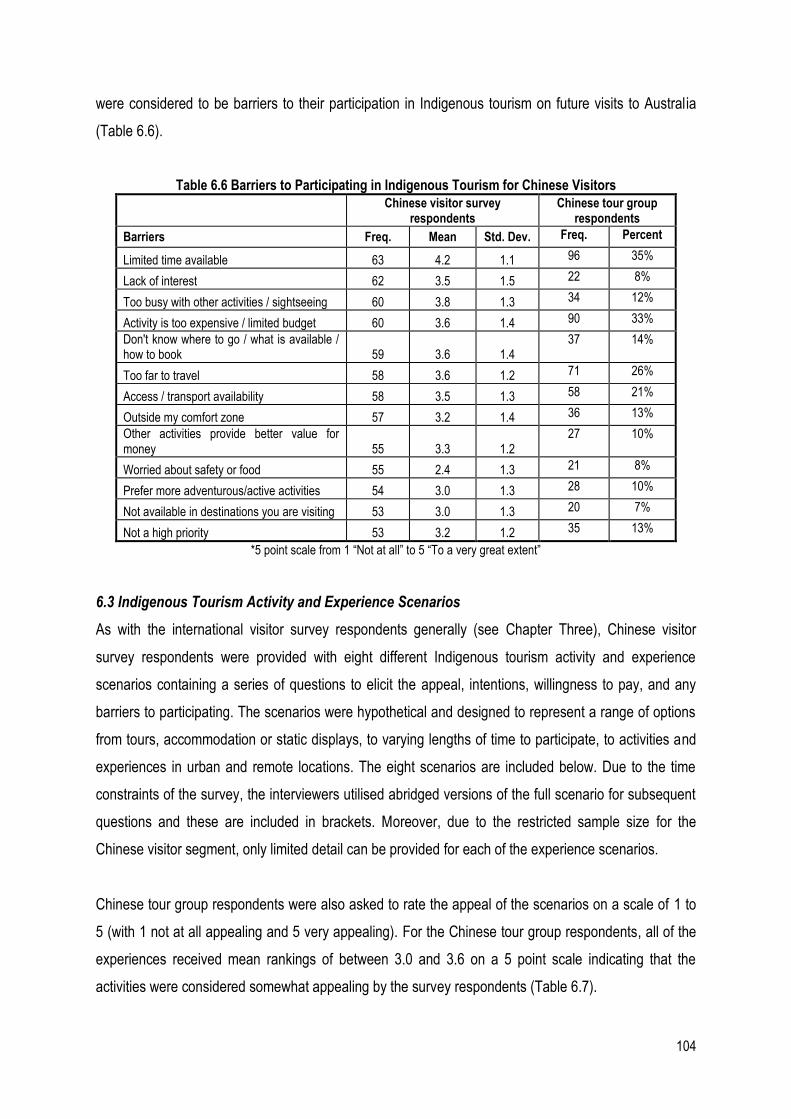
104
were considered to be barriers to their participation in Indigenous tourism on future visits to Australia
(Table 6.6).
Table 6.6 Barriers to Participating in Indigenous Tourism for Chinese Visitors
Chinese visitor survey
respondents Chinese tour group
respondents
Barriers Freq. Mean Std. Dev. Freq. Percent
Limited time available 63 4.2 1.1 96 35%
Lack of interest 62 3.5 1.5 22 8%
Too busy with other activities / sightseeing 60 3.8 1.3 34 12%
Activity is too expensive / limited budget 60 3.6 1.4 90 33%
Don't know where to go / what is available / how to book 59 3.6 1.4
37 14%
Too far to travel 58 3.6 1.2 71 26%
Access / transport availability 58 3.5 1.3 58 21%
Outside my comfort zone 57 3.2 1.4 36 13%
Other activities provide better value for money 55 3.3 1.2
27 10%
Worried about safety or food 55 2.4 1.3 21 8%
Prefer more adventurous/active activities 54 3.0 1.3 28 10%
Not available in destinations you are visiting 53 3.0 1.3 20 7%
Not a high priority 53 3.2 1.2 35 13%
*5 point scale from 1 “Not at all” to 5 “To a very great extent”
6.3 Indigenous Tourism Activity and Experience Scenarios
As with the international visitor survey respondents generally (see Chapter Three), Chinese visitor
survey respondents were provided with eight different Indigenous tourism activity and experience
scenarios containing a series of questions to elicit the appeal, intentions, willingness to pay, and any
barriers to participating. The scenarios were hypothetical and designed to represent a range of options
from tours, accommodation or static displays, to varying lengths of time to participate, to activities and
experiences in urban and remote locations. The eight scenarios are included below. Due to the time
constraints of the survey, the interviewers utilised abridged versions of the full scenario for subsequent
questions and these are included in brackets. Moreover, due to the restricted sample size for the
Chinese visitor segment, only limited detail can be provided for each of the experience scenarios.
Chinese tour group respondents were also asked to rate the appeal of the scenarios on a scale of 1 to
5 (with 1 not at all appealing and 5 very appealing). For the Chinese tour group respondents, all of the
experiences received mean rankings of between 3.0 and 3.6 on a 5 point scale indicating that the
activities were considered somewhat appealing by the survey respondents (Table 6.7).
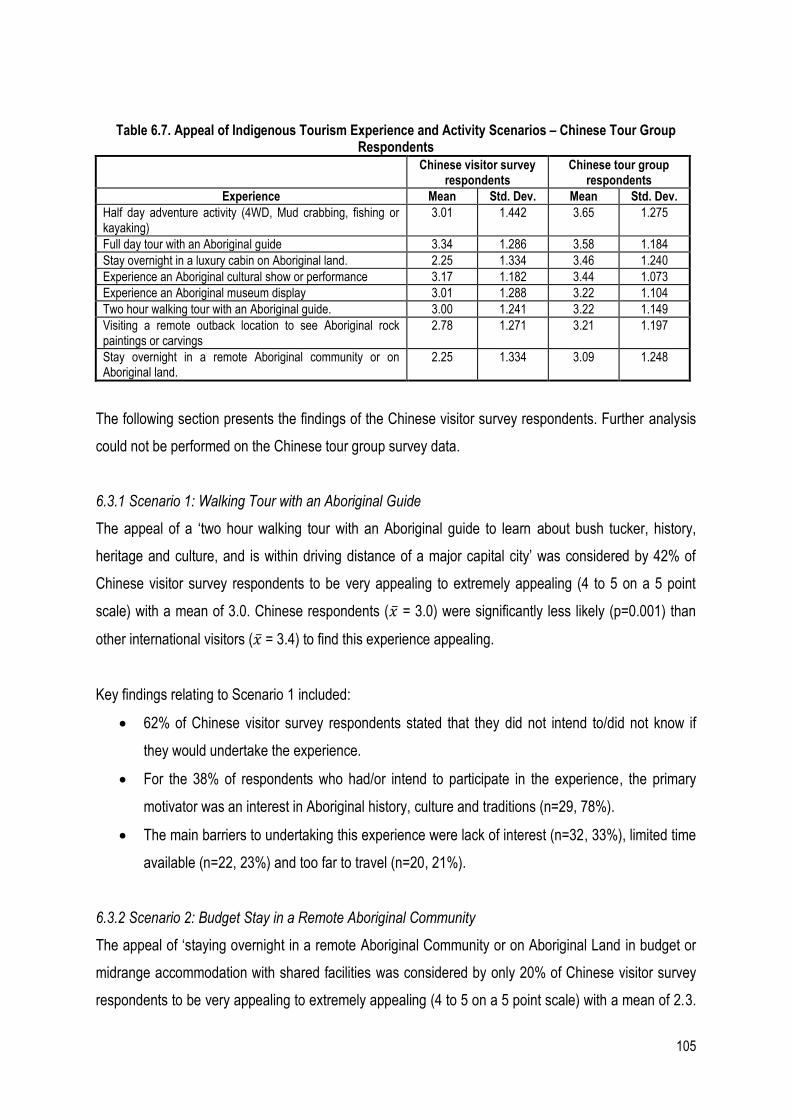
105
Table 6.7. Appeal of Indigenous Tourism Experience and Activity Scenarios – Chinese Tour Group Respondents
Chinese visitor survey respondents
Chinese tour group respondents
Experience Mean Std. Dev. Mean Std. Dev.
Half day adventure activity (4WD, Mud crabbing, fishing or kayaking)
3.01 1.442 3.65 1.275
Full day tour with an Aboriginal guide 3.34 1.286 3.58 1.184
Stay overnight in a luxury cabin on Aboriginal land. 2.25 1.334 3.46 1.240
Experience an Aboriginal cultural show or performance 3.17 1.182 3.44 1.073
Experience an Aboriginal museum display 3.01 1.288 3.22 1.104
Two hour walking tour with an Aboriginal guide. 3.00 1.241 3.22 1.149
Visiting a remote outback location to see Aboriginal rock paintings or carvings
2.78 1.271 3.21 1.197
Stay overnight in a remote Aboriginal community or on Aboriginal land.
2.25 1.334 3.09 1.248
The following section presents the findings of the Chinese visitor survey respondents. Further analysis
could not be performed on the Chinese tour group survey data.
6.3.1 Scenario 1: Walking Tour with an Aboriginal Guide
The appeal of a ‘two hour walking tour with an Aboriginal guide to learn about bush tucker, history,
heritage and culture, and is within driving distance of a major capital city’ was considered by 42% of
Chinese visitor survey respondents to be very appealing to extremely appealing (4 to 5 on a 5 point
scale) with a mean of 3.0. Chinese respondents ( ̅ = 3.0) were significantly less likely (p=0.001) than
other international visitors ( ̅ = 3.4) to find this experience appealing.
Key findings relating to Scenario 1 included:
62% of Chinese visitor survey respondents stated that they did not intend to/did not know if
they would undertake the experience.
For the 38% of respondents who had/or intend to participate in the experience, the primary
motivator was an interest in Aboriginal history, culture and traditions (n=29, 78%).
The main barriers to undertaking this experience were lack of interest (n=32, 33%), limited time
available (n=22, 23%) and too far to travel (n=20, 21%).
6.3.2 Scenario 2: Budget Stay in a Remote Aboriginal Community
The appeal of ‘staying overnight in a remote Aboriginal Community or on Aboriginal Land in budget or
midrange accommodation with shared facilities was considered by only 20% of Chinese visitor survey
respondents to be very appealing to extremely appealing (4 to 5 on a 5 point scale) with a mean of 2.3.
106
Chinese respondents ( ̅ = 2.3) were significantly less likely (p<0.001) than other international visitors ( ̅
= 2.7) to find this experience appealing.
Key findings relating to Scenario 2 included:
77% of Chinese visitor survey respondents did not intend to or did not know if they would
undertake this experience.
The primary barriers to undertaking this experience were lack of interest (n=28, 42%), limited
time available (n=20, 30%) and too far to travel (n=20, 30%).
6.3.3 Scenario 3: Aboriginal Cultural Show or Performance
The appeal of ‘attending an Aboriginal cultural show or performance as one part of a larger tourist
attraction’ was considered by 48% of Chinese visitor survey respondents to be very appealing to
extremely appealing (4 to 5 on a 5 point scale) with a mean of 3.2. There was no significant difference
between Chinese respondents and other international respondents in terms of how appealing they
found this experience.
Key findings relating to Scenario 3 included:
62% of Chinese visitor survey respondents stated that they have or intended to undertake this
experience. An interest in Aboriginal history, culture and traditions was the main motivator for
participating in this experience (n=33, 59%).
The highest proportion of respondents (46%) stated that they would be willing to pay between
$51 and $200 for the experience, with a further 38% stating they would pay between $1 and
$50.
6.3.4 Scenario 4: Luxury Overnight Stay on Aboriginal land
The appeal of ‘staying overnight in a luxury cabin on Aboriginal land on a remote beach with private
facilities’ was considered by 42% of Chinese visitor survey respondents to be very appealing to
extremely appealing (4 to 5 on a 5 point scale) with a mean of 3.0. Chinese respondents ( ̅ = 3.0) were
significantly more likely (p=0.034) than other international visitors ( ̅ = 2.7) to find this experience
appealing.
107
Key findings relating to Scenario 4 included:
29% of Chinese visitor survey respondents stated that they have or intended to undertake this
experience, with 71% stating that they did not intend to or did not know if they would undertake
the experience.
The primary barriers to undertaking this experience were that the activity is too expensive or
they had a limited budget (n=27, 42%) and limited time available (n=22, 34%).
6.3.5 Scenario 5: Aboriginal Museum Display
The appeal of ‘viewing a museum display of Aboriginal history, photos, art, artefacts and crafts, which is
one part of a larger museum’ was considered by 47% of Chinese visitor survey respondents to be very
appealing to extremely appealing (4 to 5 on a 5 point scale) with a mean of 3.0. There was no
significant difference between Chinese respondents and other international respondents in terms of
how appealing they found this experience.
Key findings relating to Scenario 5 included:
Approximately half (51%) of Chinese visitor survey respondents stated that they have or
intended to undertake this experience and would be willing to pay between $1 and $50 for the
experience.
An interest in Aboriginal history, culture and traditions was the primary motivator (n=27, 59% of
respondents with intention to undertake) while a lack of interest was the primary barrier
identified (n=25, 56%).
6.3.6 Scenario 6: Day Tour with Aboriginal guide
The appeal of ‘going on a full day tour in a vehicle with an Aboriginal Guide to an iconic landscape and
attraction, and whilst on the tour you will learn about Aboriginal history, heritage and culture’ was
considered by 58% of Chinese visitor survey respondents to be very appealing to extremely appealing
(4 to 5 on a 5 point scale) with a mean of 3.3. There was no significant difference between Chinese
respondents and other international respondents in terms of how appealing they found this experience.
Key findings relating to Scenario 6 included:
58% of Chinese visitor survey respondents stated that they have or intended to undertake this
experience.
108
Most Chinese respondents (70%) stated that they would be willing to pay between $51 and
$500 for the experience, with 45% of these respondents being willing to pay between $51 and
$100.
The primary motivator was an interest in Aboriginal history, culture and traditions (n=29, 76% of
those intending to undertake the activity) and the primary barrier to undertaking this experience
was that it is not available in the destinations the tourists were visiting (n=19, 90% of those not
intending to undertake the activity).
6.3.7 Scenario 7: Adventure Activity with an Aboriginal Guide
The appeal of ‘joining an Aboriginal guide for a half day adventure activity’ was considered by 46% of
Chinese visitor survey respondents to be very appealing to extremely appealing (4 to 5 on a 5 point
scale) with a mean of 3.0. Chinese respondents ( ̅ = 3.0) were significantly less likely (p=0.045) than
other international visitors ( ̅ = 3.3) to find this experience appealing.
Key findings relating to Scenario 7 included:
Almost half (49%) of Chinese visitor survey respondents stated that they have or intended to
undertake this experience. The primary motivator to undertake this experience was an interest
in Aboriginal history, culture and traditions (n=20, 45% of those intending to undertake the
experience).
The primary barrier to undertaking this experience was identified as a lack of interest (n=22,
49% of those not intending to undertake the experience).
6.3.8 Scenario 8: Visit Aboriginal Rock Paintings or Carvings
The appeal of ‘visiting a remote outback location to see Aboriginal rock paintings or carvings’ was
considered by 31% of Chinese visitor survey respondents to be very appealing to extremely appealing
(4 to 5 on a 5 point scale) with a mean of 2.8. Chinese respondents ( ̅ = 2.8) were significantly less
likely (p<0.001) than other international visitors ( ̅ = 3.3) to find this experience appealing.
Key findings relating to Scenario 8 included:
69% of Chinese visitor survey respondents did not intend to or did not know if they would
undertake the experience. This was largely due to a lack of interest (n=28, 47% of those not
intending to undertake the activity).
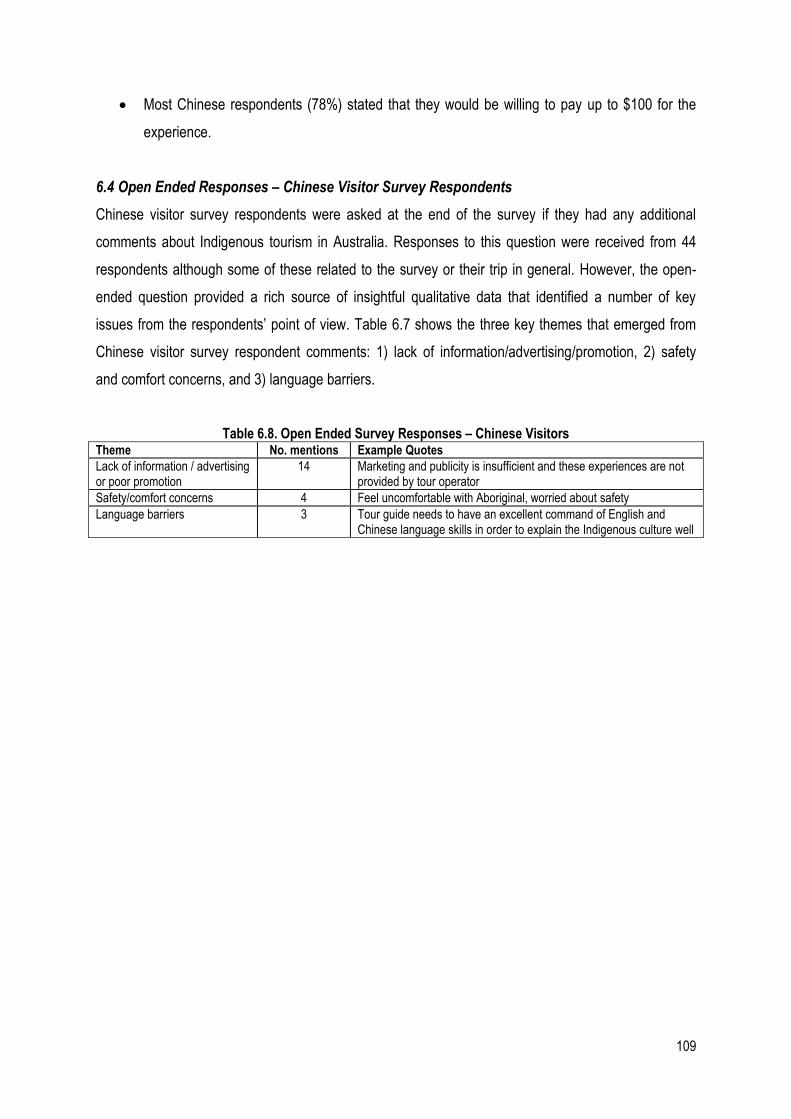
109
Most Chinese respondents (78%) stated that they would be willing to pay up to $100 for the
experience.
6.4 Open Ended Responses – Chinese Visitor Survey Respondents
Chinese visitor survey respondents were asked at the end of the survey if they had any additional
comments about Indigenous tourism in Australia. Responses to this question were received from 44
respondents although some of these related to the survey or their trip in general. However, the open-
ended question provided a rich source of insightful qualitative data that identified a number of key
issues from the respondents’ point of view. Table 6.7 shows the three key themes that emerged from
Chinese visitor survey respondent comments: 1) lack of information/advertising/promotion, 2) safety
and comfort concerns, and 3) language barriers.
Table 6.8. Open Ended Survey Responses – Chinese Visitors Theme No. mentions Example Quotes
Lack of information / advertising or poor promotion
14 Marketing and publicity is insufficient and these experiences are not provided by tour operator
Safety/comfort concerns 4 Feel uncomfortable with Aboriginal, worried about safety
Language barriers 3 Tour guide needs to have an excellent command of English and Chinese language skills in order to explain the Indigenous culture well
110
Chapter Seven: Results – Chinese Inbound Tour Operators, Chinese
Expert Informants and Indigenous Tourism Operator Interviews
Three data sets were collected that focused on the supply side of Indigenous tourism and the inbound
Chinese market:
1. Self-administered paper based surveys to 51 Chinese inbound tour operators.
2. Online survey for 18 Chinese expert informants
3. In-depth, semi-structured interviews with 34 Indigenous tourism operators (as per stage one of
the study).
This Chapter will present the data sets for the Chinese inbound tour operators and where appropriate
the results of the Chinese expert informant survey. Following this, the results emanating from the
questions posed to Indigenous tourism operator interviews about the Chinese inbound market will be
outlined.
7.1 Chinese Inbound Tour Operators and Chinese Expert Informant Results
7.1.1 Awareness of Australian activities and experiences
The majority of inbound tour operators (90.5%) and expert informants (93.8%) believed that Chinese
visitors to Australia do not have much prior knowledge of the Indigenous tourism experiences available
in Australia. Nevertheless, 78% of tour operators and 77% of expert informants believed that Chinese
visitors to Australia do want an Indigenous experience. Further, 80% of Chinese tour operators claimed
that they have some form of Indigenous content included in their tour itineraries (Table 7.1).
Inbound tour operator and expert informant respondents identified the following reasons that would
drive Chinese demand for Indigenous tourism experiences:
To meet an Indigenous person/take a tour with an Indigenous guide
Buy a small genuine Indigenous art or artefacts
Have a general introduction to Indigenous culture
On the other hand Chinese inbound tour operator respondents noted that Chinese visitors would not
want an Indigenous tourism experience due to a variety of reasons which included:
A general lack of knowledge/information of Indigenous culture
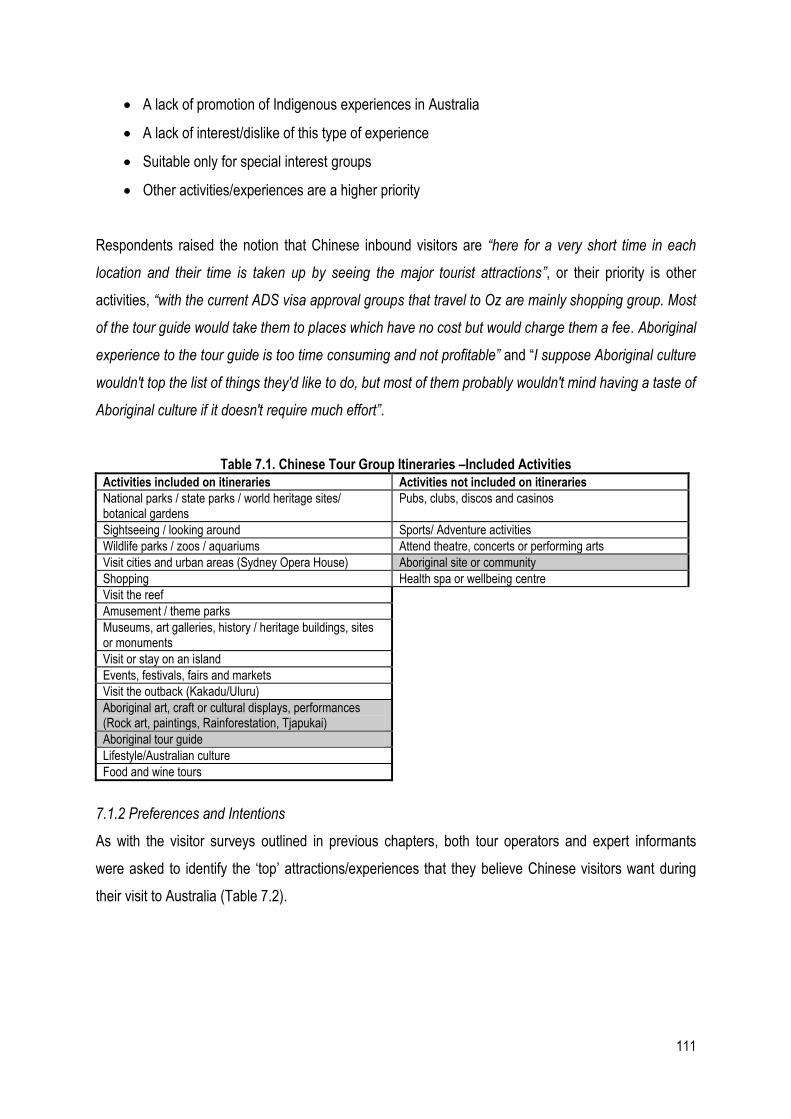
111
A lack of promotion of Indigenous experiences in Australia
A lack of interest/dislike of this type of experience
Suitable only for special interest groups
Other activities/experiences are a higher priority
Respondents raised the notion that Chinese inbound visitors are “here for a very short time in each
location and their time is taken up by seeing the major tourist attractions”, or their priority is other
activities, “with the current ADS visa approval groups that travel to Oz are mainly shopping group. Most
of the tour guide would take them to places which have no cost but would charge them a fee. Aboriginal
experience to the tour guide is too time consuming and not profitable” and “I suppose Aboriginal culture
wouldn't top the list of things they'd like to do, but most of them probably wouldn't mind having a taste of
Aboriginal culture if it doesn't require much effort”.
Table 7.1. Chinese Tour Group Itineraries –Included Activities
Activities included on itineraries Activities not included on itineraries
National parks / state parks / world heritage sites/ botanical gardens
Pubs, clubs, discos and casinos
Sightseeing / looking around Sports/ Adventure activities
Wildlife parks / zoos / aquariums Attend theatre, concerts or performing arts
Visit cities and urban areas (Sydney Opera House) Aboriginal site or community
Shopping Health spa or wellbeing centre
Visit the reef
Amusement / theme parks
Museums, art galleries, history / heritage buildings, sites or monuments
Visit or stay on an island
Events, festivals, fairs and markets
Visit the outback (Kakadu/Uluru)
Aboriginal art, craft or cultural displays, performances (Rock art, paintings, Rainforestation, Tjapukai)
Aboriginal tour guide
Lifestyle/Australian culture
Food and wine tours
7.1.2 Preferences and Intentions
As with the visitor surveys outlined in previous chapters, both tour operators and expert informants
were asked to identify the ‘top’ attractions/experiences that they believe Chinese visitors want during
their visit to Australia (Table 7.2).
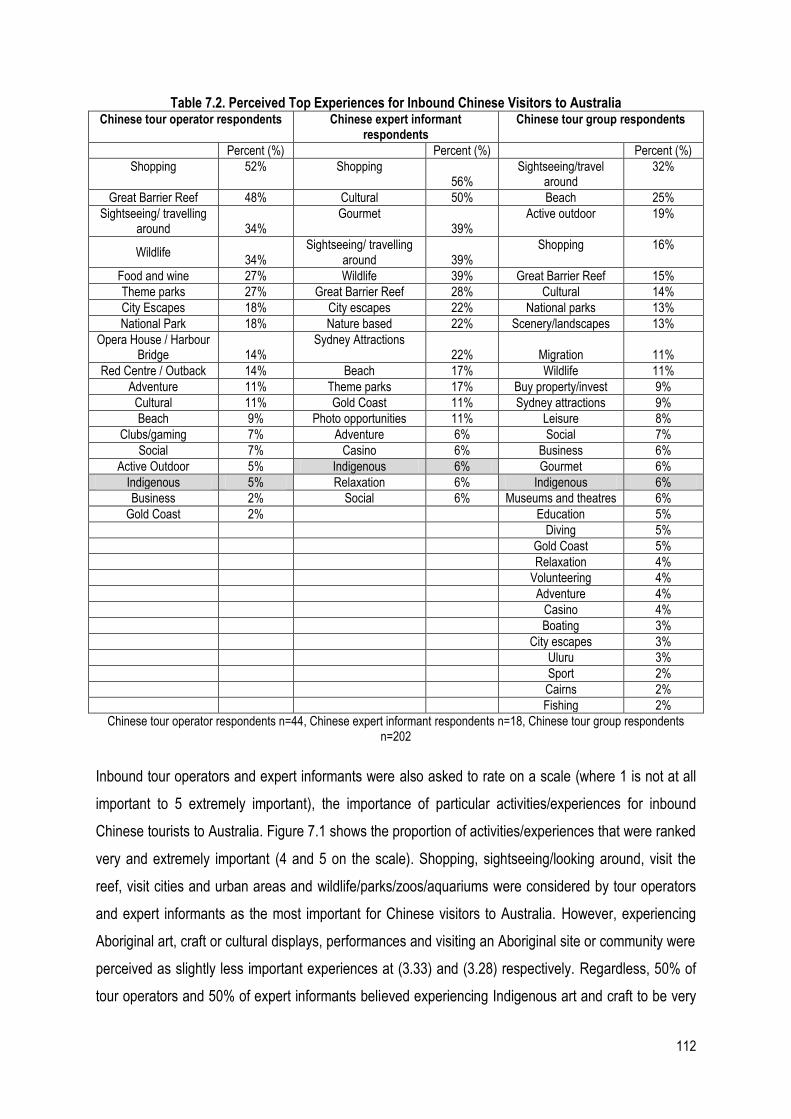
112
Table 7.2. Perceived Top Experiences for Inbound Chinese Visitors to Australia Chinese tour operator respondents Chinese expert informant
respondents Chinese tour group respondents
Percent (%) Percent (%) Percent (%)
Shopping 52% Shopping 56%
Sightseeing/travel around
32%
Great Barrier Reef 48% Cultural 50% Beach 25%
Sightseeing/ travelling around 34%
Gourmet 39%
Active outdoor 19%
Wildlife 34%
Sightseeing/ travelling around 39%
Shopping 16%
Food and wine 27% Wildlife 39% Great Barrier Reef 15%
Theme parks 27% Great Barrier Reef 28% Cultural 14%
City Escapes 18% City escapes 22% National parks 13%
National Park 18% Nature based 22% Scenery/landscapes 13%
Opera House / Harbour Bridge 14%
Sydney Attractions 22% Migration 11%
Red Centre / Outback 14% Beach 17% Wildlife 11%
Adventure 11% Theme parks 17% Buy property/invest 9%
Cultural 11% Gold Coast 11% Sydney attractions 9%
Beach 9% Photo opportunities 11% Leisure 8%
Clubs/gaming 7% Adventure 6% Social 7%
Social 7% Casino 6% Business 6%
Active Outdoor 5% Indigenous 6% Gourmet 6%
Indigenous 5% Relaxation 6% Indigenous 6%
Business 2% Social 6% Museums and theatres 6%
Gold Coast 2% Education 5%
Diving 5%
Gold Coast 5%
Relaxation 4%
Volunteering 4%
Adventure 4%
Casino 4%
Boating 3%
City escapes 3%
Uluru 3%
Sport 2%
Cairns 2%
Fishing 2%
Chinese tour operator respondents n=44, Chinese expert informant respondents n=18, Chinese tour group respondents n=202
Inbound tour operators and expert informants were also asked to rate on a scale (where 1 is not at all
important to 5 extremely important), the importance of particular activities/experiences for inbound
Chinese tourists to Australia. Figure 7.1 shows the proportion of activities/experiences that were ranked
very and extremely important (4 and 5 on the scale). Shopping, sightseeing/looking around, visit the
reef, visit cities and urban areas and wildlife/parks/zoos/aquariums were considered by tour operators
and expert informants as the most important for Chinese visitors to Australia. However, experiencing
Aboriginal art, craft or cultural displays, performances and visiting an Aboriginal site or community were
perceived as slightly less important experiences at (3.33) and (3.28) respectively. Regardless, 50% of
tour operators and 50% of expert informants believed experiencing Indigenous art and craft to be very
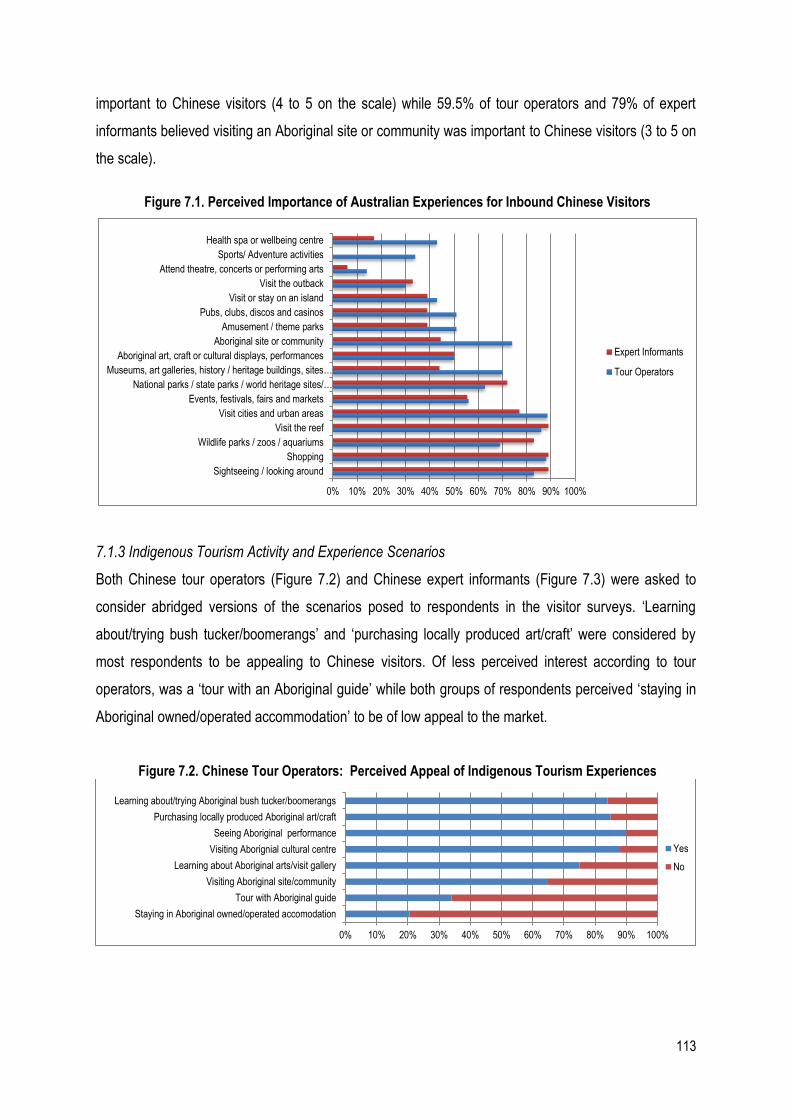
113
important to Chinese visitors (4 to 5 on the scale) while 59.5% of tour operators and 79% of expert
informants believed visiting an Aboriginal site or community was important to Chinese visitors (3 to 5 on
the scale).
Figure 7.1. Perceived Importance of Australian Experiences for Inbound Chinese Visitors
7.1.3 Indigenous Tourism Activity and Experience Scenarios
Both Chinese tour operators (Figure 7.2) and Chinese expert informants (Figure 7.3) were asked to
consider abridged versions of the scenarios posed to respondents in the visitor surveys. ‘Learning
about/trying bush tucker/boomerangs’ and ‘purchasing locally produced art/craft’ were considered by
most respondents to be appealing to Chinese visitors. Of less perceived interest according to tour
operators, was a ‘tour with an Aboriginal guide’ while both groups of respondents perceived ‘staying in
Aboriginal owned/operated accommodation’ to be of low appeal to the market.
Figure 7.2. Chinese Tour Operators: Perceived Appeal of Indigenous Tourism Experiences
0% 10% 20% 30% 40% 50% 60% 70% 80% 90% 100%
Sightseeing / looking around
Shopping
Wildlife parks / zoos / aquariums
Visit the reef
Visit cities and urban areas
Events, festivals, fairs and markets
National parks / state parks / world heritage sites/…
Museums, art galleries, history / heritage buildings, sites…
Aboriginal art, craft or cultural displays, performances
Aboriginal site or community
Amusement / theme parks
Pubs, clubs, discos and casinos
Visit or stay on an island
Visit the outback
Attend theatre, concerts or performing arts
Sports/ Adventure activities
Health spa or wellbeing centre
Expert Informants
Tour Operators
0% 10% 20% 30% 40% 50% 60% 70% 80% 90% 100%
Staying in Aboriginal owned/operated accomodation
Tour with Aboriginal guide
Visiting Aboriginal site/community
Learning about Aboriginal arts/visit gallery
Visiting Aborignial cultural centre
Seeing Aboriginal performance
Purchasing locally produced Aboriginal art/craft
Learning about/trying Aboriginal bush tucker/boomerangs
Yes
No
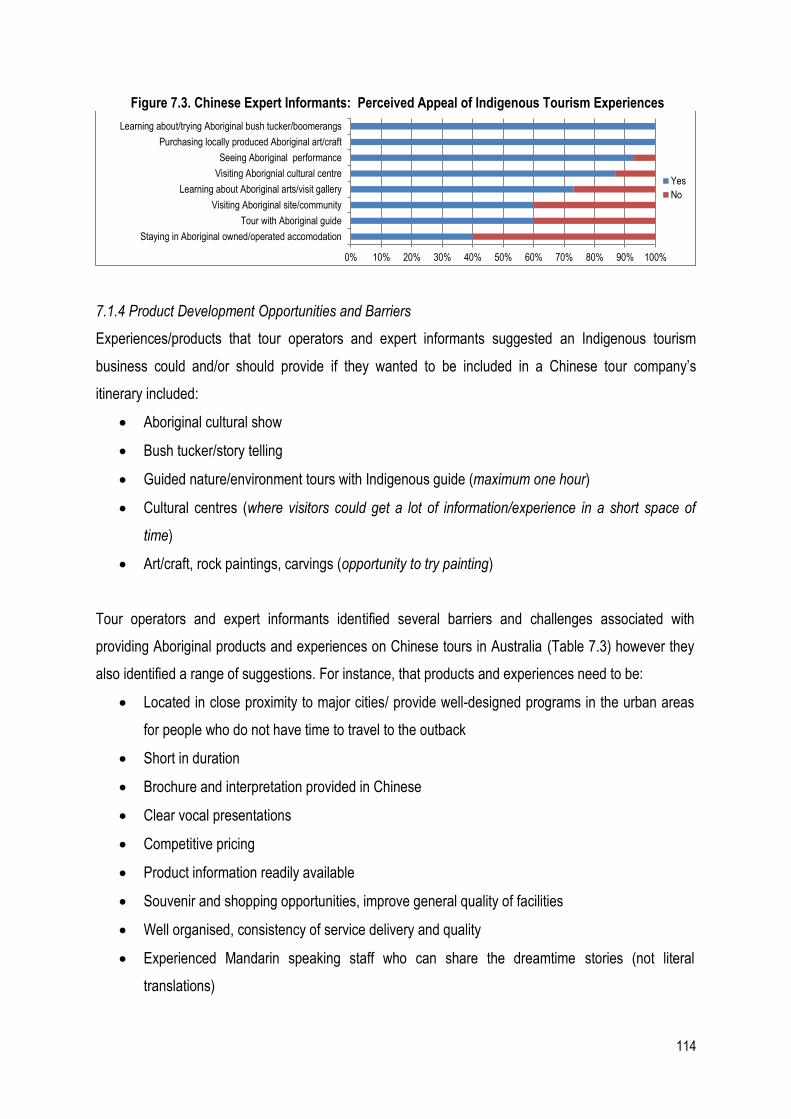
114
Figure 7.3. Chinese Expert Informants: Perceived Appeal of Indigenous Tourism Experiences
7.1.4 Product Development Opportunities and Barriers
Experiences/products that tour operators and expert informants suggested an Indigenous tourism
business could and/or should provide if they wanted to be included in a Chinese tour company’s
itinerary included:
Aboriginal cultural show
Bush tucker/story telling
Guided nature/environment tours with Indigenous guide (maximum one hour)
Cultural centres (where visitors could get a lot of information/experience in a short space of
time)
Art/craft, rock paintings, carvings (opportunity to try painting)
Tour operators and expert informants identified several barriers and challenges associated with
providing Aboriginal products and experiences on Chinese tours in Australia (Table 7.3) however they
also identified a range of suggestions. For instance, that products and experiences need to be:
Located in close proximity to major cities/ provide well-designed programs in the urban areas
for people who do not have time to travel to the outback
Short in duration
Brochure and interpretation provided in Chinese
Clear vocal presentations
Competitive pricing
Product information readily available
Souvenir and shopping opportunities, improve general quality of facilities
Well organised, consistency of service delivery and quality
Experienced Mandarin speaking staff who can share the dreamtime stories (not literal
translations)
0% 10% 20% 30% 40% 50% 60% 70% 80% 90% 100%
Staying in Aboriginal owned/operated accomodation
Tour with Aboriginal guide
Visiting Aboriginal site/community
Learning about Aboriginal arts/visit gallery
Visiting Aborignial cultural centre
Seeing Aboriginal performance
Purchasing locally produced Aboriginal art/craft
Learning about/trying Aboriginal bush tucker/boomerangs
Yes
No
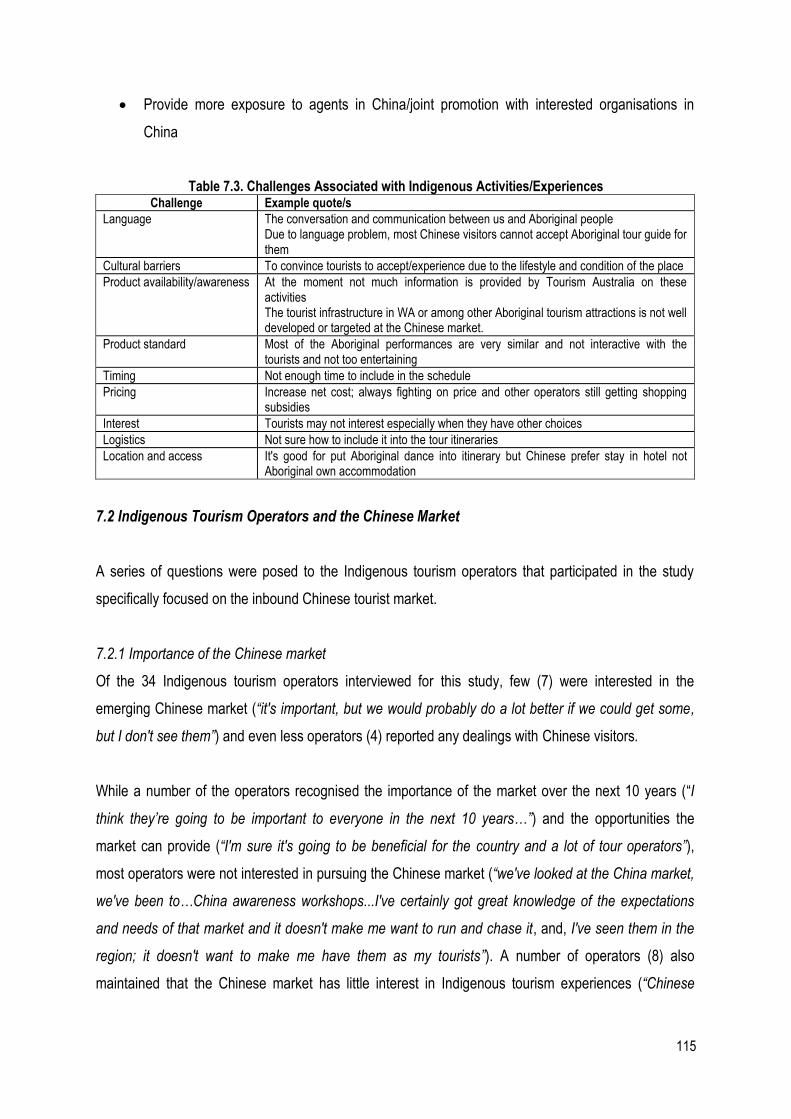
115
Provide more exposure to agents in China/joint promotion with interested organisations in
China
Table 7.3. Challenges Associated with Indigenous Activities/Experiences Challenge Example quote/s
Language The conversation and communication between us and Aboriginal people Due to language problem, most Chinese visitors cannot accept Aboriginal tour guide for them
Cultural barriers To convince tourists to accept/experience due to the lifestyle and condition of the place
Product availability/awareness At the moment not much information is provided by Tourism Australia on these activities The tourist infrastructure in WA or among other Aboriginal tourism attractions is not well developed or targeted at the Chinese market.
Product standard Most of the Aboriginal performances are very similar and not interactive with the tourists and not too entertaining
Timing Not enough time to include in the schedule
Pricing Increase net cost; always fighting on price and other operators still getting shopping subsidies
Interest Tourists may not interest especially when they have other choices
Logistics Not sure how to include it into the tour itineraries
Location and access It's good for put Aboriginal dance into itinerary but Chinese prefer stay in hotel not Aboriginal own accommodation
7.2 Indigenous Tourism Operators and the Chinese Market
A series of questions were posed to the Indigenous tourism operators that participated in the study
specifically focused on the inbound Chinese tourist market.
7.2.1 Importance of the Chinese market
Of the 34 Indigenous tourism operators interviewed for this study, few (7) were interested in the
emerging Chinese market (“it's important, but we would probably do a lot better if we could get some,
but I don't see them”) and even less operators (4) reported any dealings with Chinese visitors.
While a number of the operators recognised the importance of the market over the next 10 years (“I
think they’re going to be important to everyone in the next 10 years…”) and the opportunities the
market can provide (“I'm sure it's going to be beneficial for the country and a lot of tour operators”),
most operators were not interested in pursuing the Chinese market (“we've looked at the China market,
we've been to…China awareness workshops...I've certainly got great knowledge of the expectations
and needs of that market and it doesn't make me want to run and chase it, and, I've seen them in the
region; it doesn't want to make me have them as my tourists”). A number of operators (8) also
maintained that the Chinese market has little interest in Indigenous tourism experiences (“Chinese
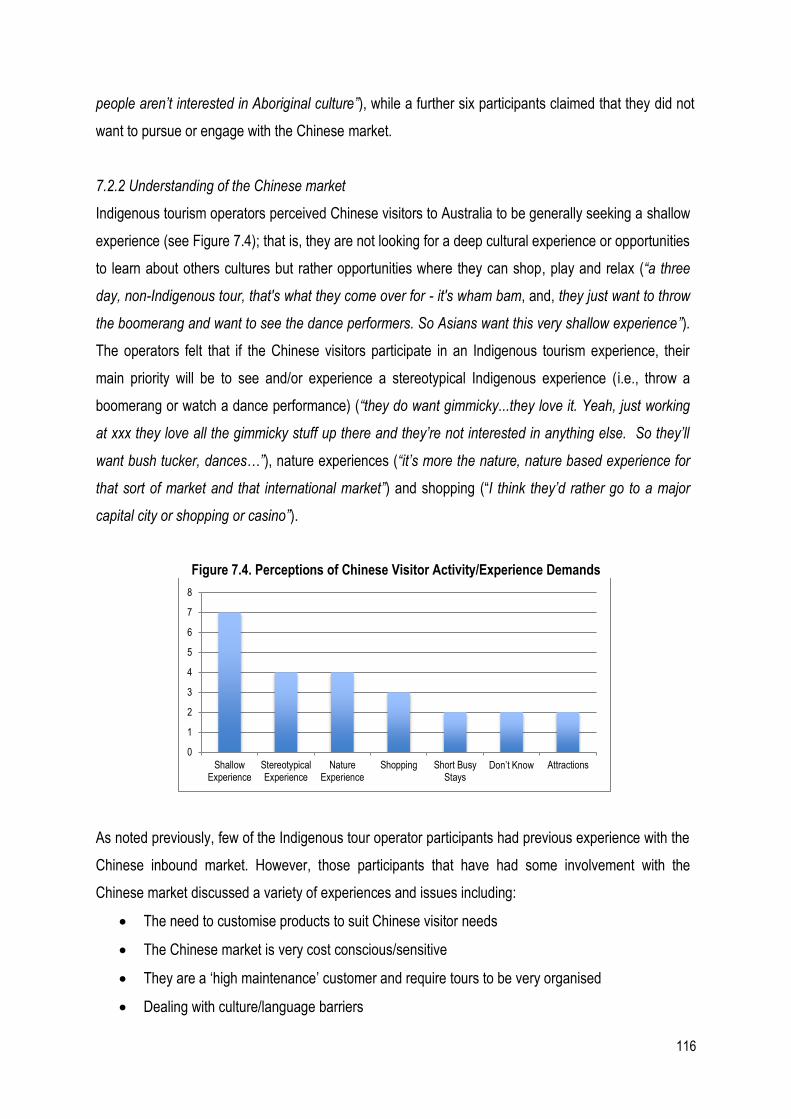
116
people aren’t interested in Aboriginal culture”), while a further six participants claimed that they did not
want to pursue or engage with the Chinese market.
7.2.2 Understanding of the Chinese market
Indigenous tourism operators perceived Chinese visitors to Australia to be generally seeking a shallow
experience (see Figure 7.4); that is, they are not looking for a deep cultural experience or opportunities
to learn about others cultures but rather opportunities where they can shop, play and relax (“a three
day, non-Indigenous tour, that's what they come over for - it's wham bam, and, they just want to throw
the boomerang and want to see the dance performers. So Asians want this very shallow experience”).
The operators felt that if the Chinese visitors participate in an Indigenous tourism experience, their
main priority will be to see and/or experience a stereotypical Indigenous experience (i.e., throw a
boomerang or watch a dance performance) (“they do want gimmicky...they love it. Yeah, just working
at xxx they love all the gimmicky stuff up there and they’re not interested in anything else. So they’ll
want bush tucker, dances…”), nature experiences (“it’s more the nature, nature based experience for
that sort of market and that international market”) and shopping (“I think they’d rather go to a major
capital city or shopping or casino”).
Figure 7.4. Perceptions of Chinese Visitor Activity/Experience Demands
As noted previously, few of the Indigenous tour operator participants had previous experience with the
Chinese inbound market. However, those participants that have had some involvement with the
Chinese market discussed a variety of experiences and issues including:
The need to customise products to suit Chinese visitor needs
The Chinese market is very cost conscious/sensitive
They are a ‘high maintenance’ customer and require tours to be very organised
Dealing with culture/language barriers
0
1
2
3
4
5
6
7
8
ShallowExperience
StereotypicalExperience
NatureExperience
Shopping Short BusyStays
Don’t Know Attractions
117
They have little to no understanding of Indigenous culture and are not interested in cultural
tours
Indigenous tourism operators reported obtaining their knowledge about the Chinese inbound visitor
market from a variety of sources including:
Government organisations such as STO’s and peak associations
Market research
Networks
Personal observations
Seminars/workshops
Don’t seek/receive knowledge on this market
7.2.3 Strategies for the Chinese market
Although a number of participants claimed that they are not seeking to target the Chinese market,
those businesses that are targeting the Chinese market, currently employ a number of strategies
including:
Marketing (i.e., advertising in Chinese publications, website launch, listing on Chinese search
engine, employing a Chinese wholesaler, staff attending trade shows in China)
Employing Mandarin speaking staff, training guides in Mandarin
Leveraging government agencies
Utilising technology (i.e., developing digital content, iPhone for translation)
Looking into becoming ADS approved and attending Meeting Place (inbound tourism
operators)
Modifying product to suit market including evaluating pricing
Nothing “just watching at the moment”
118
Chapter Eight: Discussion – Stage Two
The overall aim of the second stage of the research was to provide some of the first insights into
inbound Chinese visitor demand and consider this in the context of Indigenous tourism supply.
Although China is regarded as one of Australia’s growth tourism markets, there has been no empirical
research in this area with the exception of the national statistical collections.
Chapters Six and Seven have reported on the findings from each of the questions relating to Stage Two
of the study. Specifically, the Stage Two findings relate to the following objectives: 1) investigate the
expectations, experiences and motivations, of Chinese visitors (independent and tour) regarding
Indigenous tourism products and services in Australia (Chapter 6), 2) investigate the perceptions,
expectations and decision making processes of Chinese inbound tour operators (complimented with
Chinese expert informants) regarding Australian Indigenous tourism products and services (Chapter 7)
and 3) investigate the expectations, experiences and motivations of Indigenous tourism operators
regarding the provision of activities and experiences for the Chinese visitor market via 34 in-depth
interviews with Indigenous tourism operators (Chapter 7).
This Chapter will present the analysis and mapping of: demand for Australian tourism experiences,
awareness, preference and visitation along the attrition curve; the barriers to participating in Indigenous
tourism; and, the appeal, intentions and willingness to pay on a series of Indigenous tourism scenarios.
8.1 Australian Tourism Experiences: Mapping Chinese Demand
Comparisons can be made between the various data sets with regard to what are perceived to be the
‘top’ or ‘must see’ tourist attractions or experiences for Chinese visitors to Australia. This is presented in
Figure 8.1 for Chinese visitors, Chinese tour operators and expert informants, and Indigenous tourism
operators. Chinese visitor survey respondents were asked: “if you had unlimited time and money what
are the top 5 things you would like to do while in Australia?” and Chinese tour operators and expert
informants asked “what activities and experiences do you think Chinese tourists are coming to Australia
for?”
‘Sightseeing/travelling around’ was the most frequently cited attraction or experience by both Chinese
visitors and Chinese tour groups, followed closely by ‘shopping’ and ‘going to the beach’. Indigenous
tourism operators and expert informants perceived ‘visiting the Great Barrier Reef’ as one of the top

119
attractions Chinese visitors wanted to experience. Importantly, Indigenous tourism operators placed
‘visiting the red centre/ outback’ and ‘Indigenous tourism’ as the two top attractions Chinese visitors
wanted to experience, despite the fact that most operators were reasonably sceptical of the Chinese
market’s interest in Indigenous tourism. Figure 8.1 highlights considerable disparity in the perceptions
of the various groups regarding the attractions and experiences/activities inbound Chinese visitors
would like to undertake while in Australia.
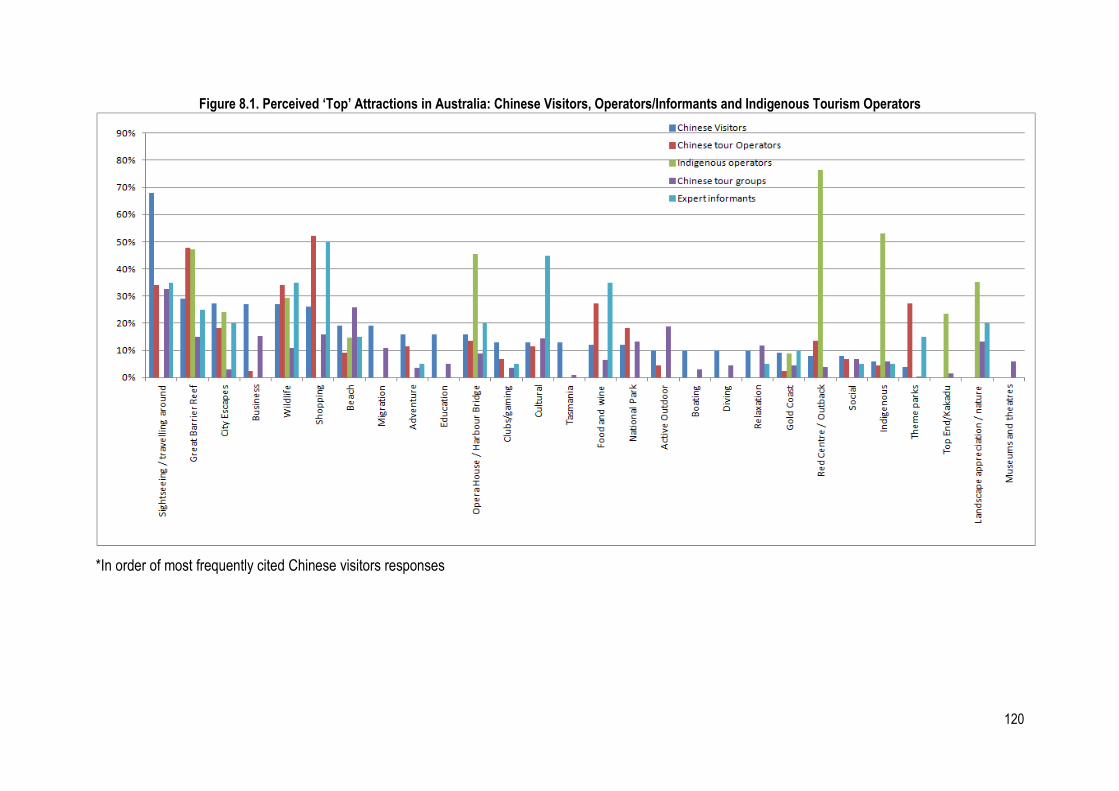
120
Figure 8.1. Perceived ‘Top’ Attractions in Australia: Chinese Visitors, Operators/Informants and Indigenous Tourism Operators
*In order of most frequently cited Chinese visitors responses
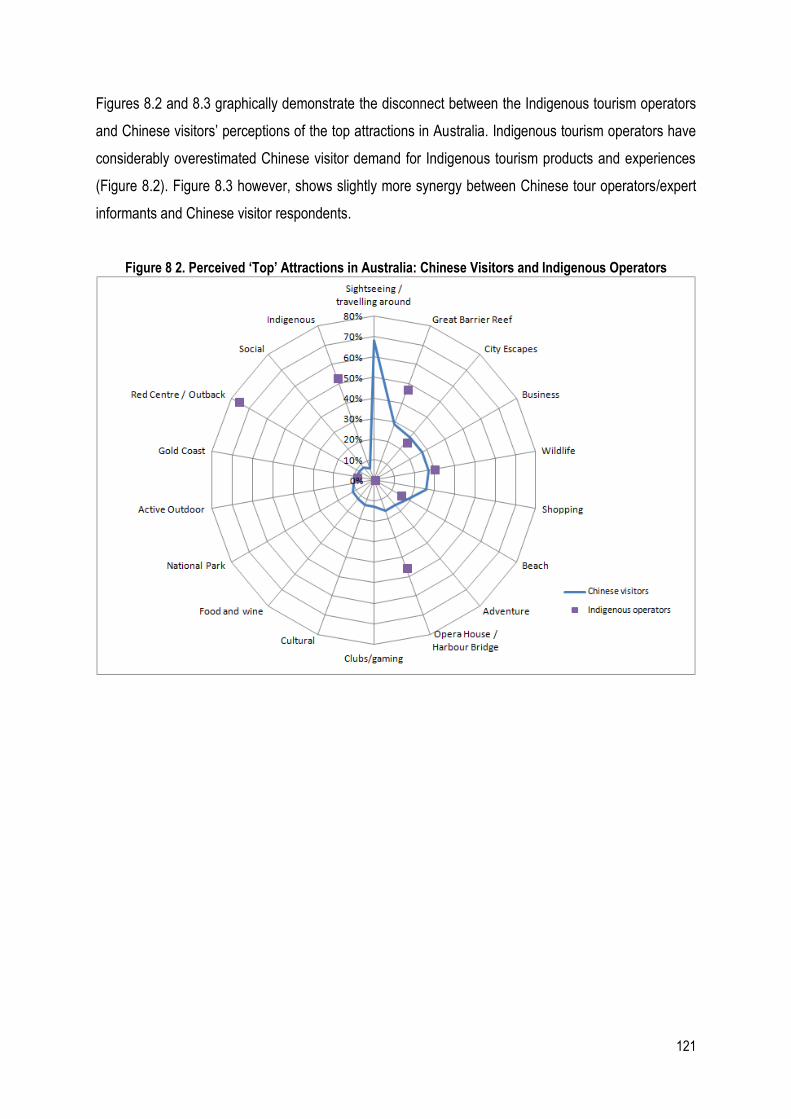
121
Figures 8.2 and 8.3 graphically demonstrate the disconnect between the Indigenous tourism operators
and Chinese visitors’ perceptions of the top attractions in Australia. Indigenous tourism operators have
considerably overestimated Chinese visitor demand for Indigenous tourism products and experiences
(Figure 8.2). Figure 8.3 however, shows slightly more synergy between Chinese tour operators/expert
informants and Chinese visitor respondents.
Figure 8 2. Perceived ‘Top’ Attractions in Australia: Chinese Visitors and Indigenous Operators
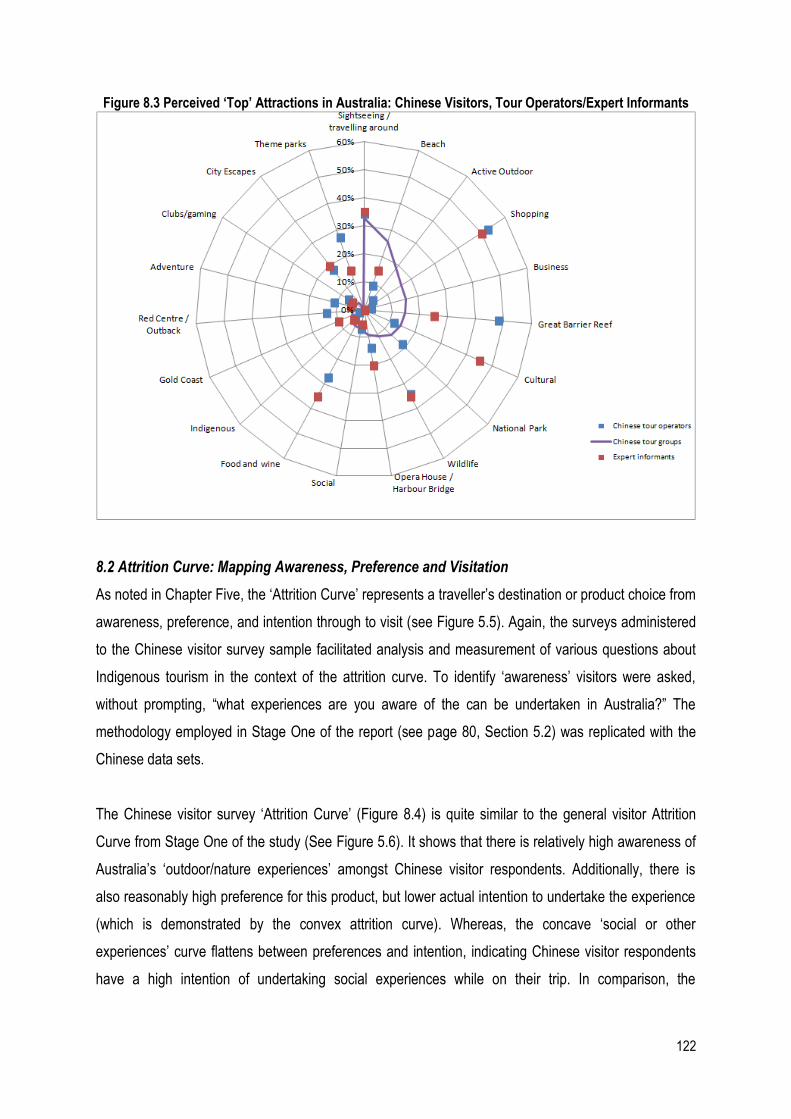
122
Figure 8.3 Perceived ‘Top’ Attractions in Australia: Chinese Visitors, Tour Operators/Expert Informants
8.2 Attrition Curve: Mapping Awareness, Preference and Visitation
As noted in Chapter Five, the ‘Attrition Curve’ represents a traveller’s destination or product choice from
awareness, preference, and intention through to visit (see Figure 5.5). Again, the surveys administered
to the Chinese visitor survey sample facilitated analysis and measurement of various questions about
Indigenous tourism in the context of the attrition curve. To identify ‘awareness’ visitors were asked,
without prompting, “what experiences are you aware of the can be undertaken in Australia?” The
methodology employed in Stage One of the report (see page 80, Section 5.2) was replicated with the
Chinese data sets.
The Chinese visitor survey ‘Attrition Curve’ (Figure 8.4) is quite similar to the general visitor Attrition
Curve from Stage One of the study (See Figure 5.6). It shows that there is relatively high awareness of
Australia’s ‘outdoor/nature experiences’ amongst Chinese visitor respondents. Additionally, there is
also reasonably high preference for this product, but lower actual intention to undertake the experience
(which is demonstrated by the convex attrition curve). Whereas, the concave ‘social or other
experiences’ curve flattens between preferences and intention, indicating Chinese visitor respondents
have a high intention of undertaking social experiences while on their trip. In comparison, the
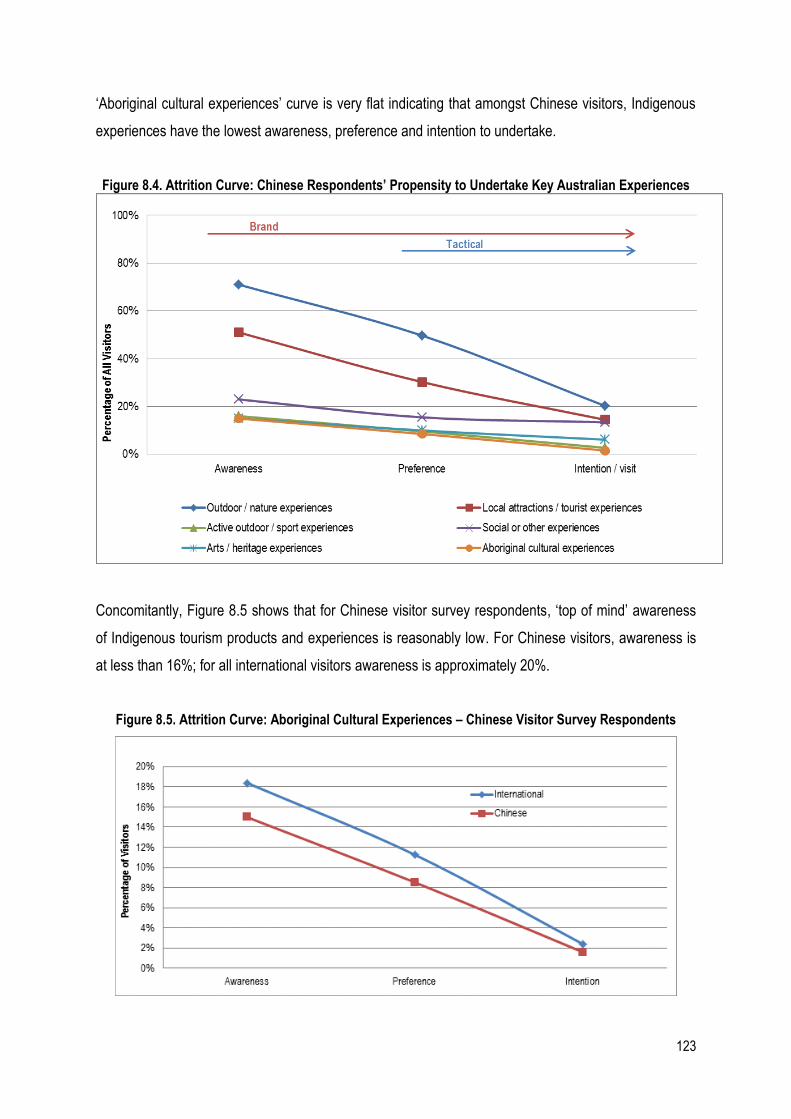
123
‘Aboriginal cultural experiences’ curve is very flat indicating that amongst Chinese visitors, Indigenous
experiences have the lowest awareness, preference and intention to undertake.
Figure 8.4. Attrition Curve: Chinese Respondents’ Propensity to Undertake Key Australian Experiences
Concomitantly, Figure 8.5 shows that for Chinese visitor survey respondents, ‘top of mind’ awareness
of Indigenous tourism products and experiences is reasonably low. For Chinese visitors, awareness is
at less than 16%; for all international visitors awareness is approximately 20%.
Figure 8.5. Attrition Curve: Aboriginal Cultural Experiences – Chinese Visitor Survey Respondents
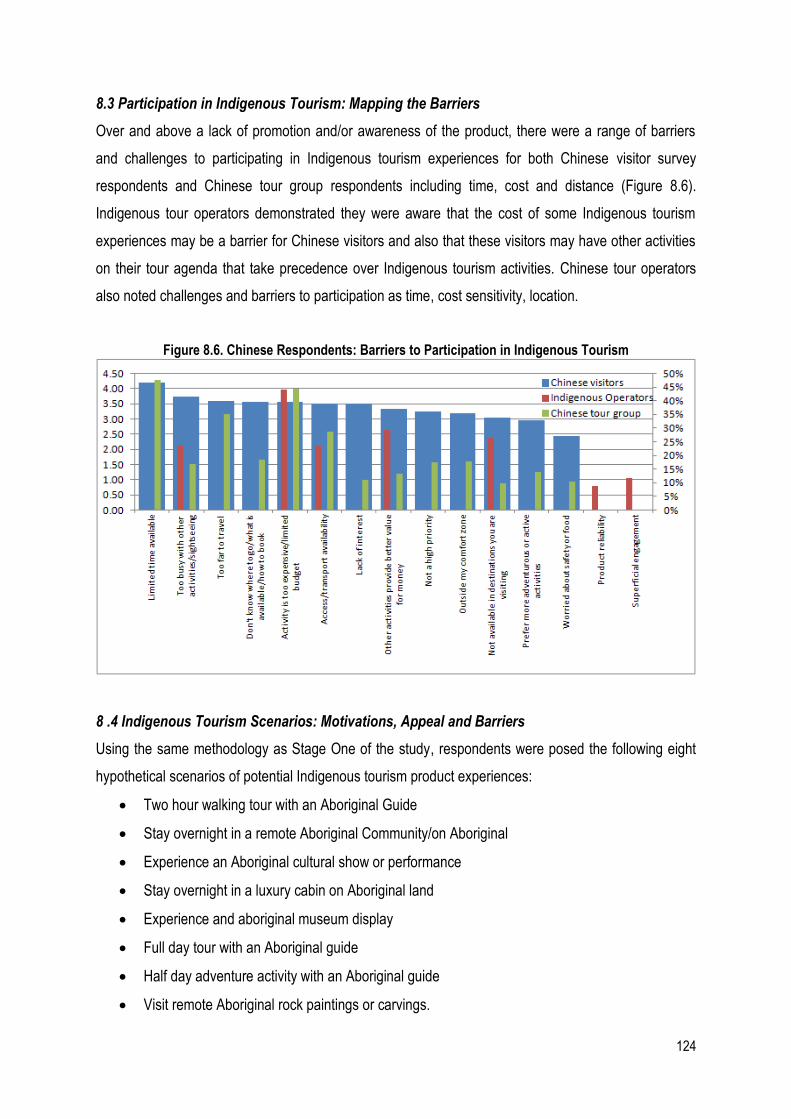
124
8.3 Participation in Indigenous Tourism: Mapping the Barriers
Over and above a lack of promotion and/or awareness of the product, there were a range of barriers
and challenges to participating in Indigenous tourism experiences for both Chinese visitor survey
respondents and Chinese tour group respondents including time, cost and distance (Figure 8.6).
Indigenous tour operators demonstrated they were aware that the cost of some Indigenous tourism
experiences may be a barrier for Chinese visitors and also that these visitors may have other activities
on their tour agenda that take precedence over Indigenous tourism activities. Chinese tour operators
also noted challenges and barriers to participation as time, cost sensitivity, location.
Figure 8.6. Chinese Respondents: Barriers to Participation in Indigenous Tourism
8 .4 Indigenous Tourism Scenarios: Motivations, Appeal and Barriers
Using the same methodology as Stage One of the study, respondents were posed the following eight
hypothetical scenarios of potential Indigenous tourism product experiences:
Two hour walking tour with an Aboriginal Guide
Stay overnight in a remote Aboriginal Community/on Aboriginal
Experience an Aboriginal cultural show or performance
Stay overnight in a luxury cabin on Aboriginal land
Experience and aboriginal museum display
Full day tour with an Aboriginal guide
Half day adventure activity with an Aboriginal guide
Visit remote Aboriginal rock paintings or carvings.
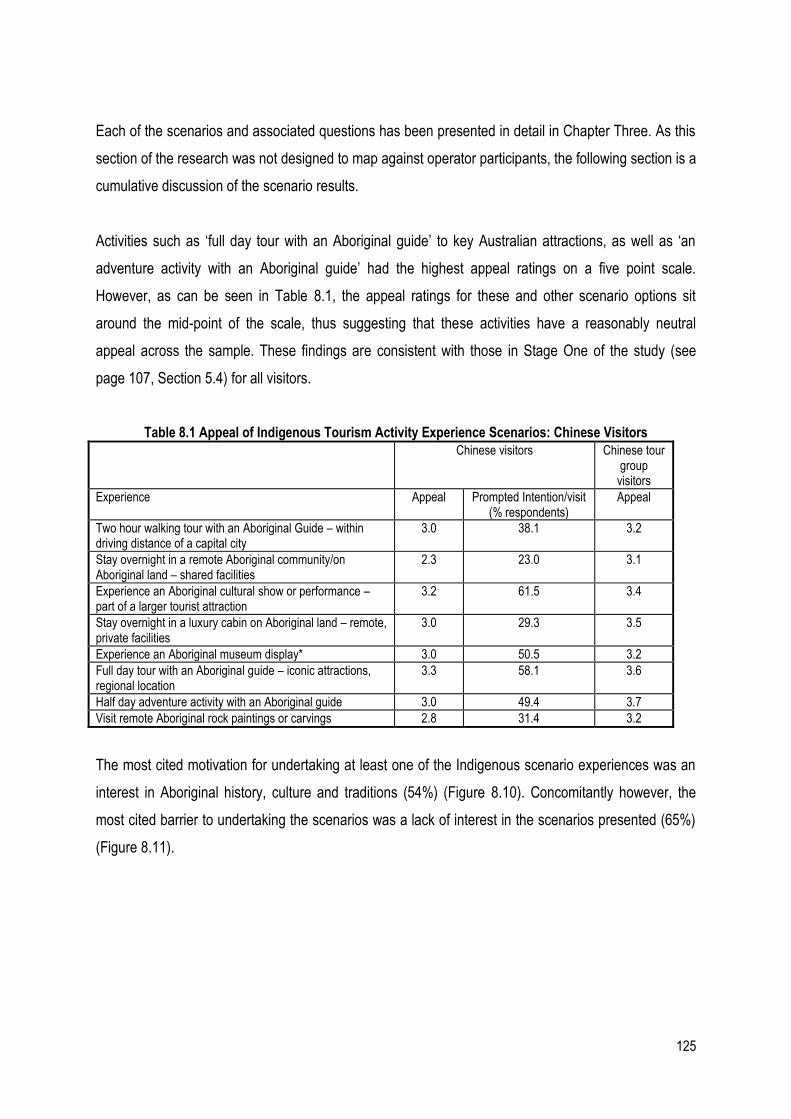
125
Each of the scenarios and associated questions has been presented in detail in Chapter Three. As this
section of the research was not designed to map against operator participants, the following section is a
cumulative discussion of the scenario results.
Activities such as ‘full day tour with an Aboriginal guide’ to key Australian attractions, as well as ‘an
adventure activity with an Aboriginal guide’ had the highest appeal ratings on a five point scale.
However, as can be seen in Table 8.1, the appeal ratings for these and other scenario options sit
around the mid-point of the scale, thus suggesting that these activities have a reasonably neutral
appeal across the sample. These findings are consistent with those in Stage One of the study (see
page 107, Section 5.4) for all visitors.
Table 8.1 Appeal of Indigenous Tourism Activity Experience Scenarios: Chinese Visitors
Chinese visitors Chinese tour group
visitors
Experience Appeal Prompted Intention/visit (% respondents)
Appeal
Two hour walking tour with an Aboriginal Guide – within driving distance of a capital city
3.0 38.1 3.2
Stay overnight in a remote Aboriginal community/on Aboriginal land – shared facilities
2.3 23.0 3.1
Experience an Aboriginal cultural show or performance – part of a larger tourist attraction
3.2 61.5 3.4
Stay overnight in a luxury cabin on Aboriginal land – remote, private facilities
3.0 29.3 3.5
Experience an Aboriginal museum display* 3.0 50.5 3.2
Full day tour with an Aboriginal guide – iconic attractions, regional location
3.3 58.1 3.6
Half day adventure activity with an Aboriginal guide 3.0 49.4 3.7
Visit remote Aboriginal rock paintings or carvings 2.8 31.4 3.2
The most cited motivation for undertaking at least one of the Indigenous scenario experiences was an
interest in Aboriginal history, culture and traditions (54%) (Figure 8.10). Concomitantly however, the
most cited barrier to undertaking the scenarios was a lack of interest in the scenarios presented (65%)
(Figure 8.11).
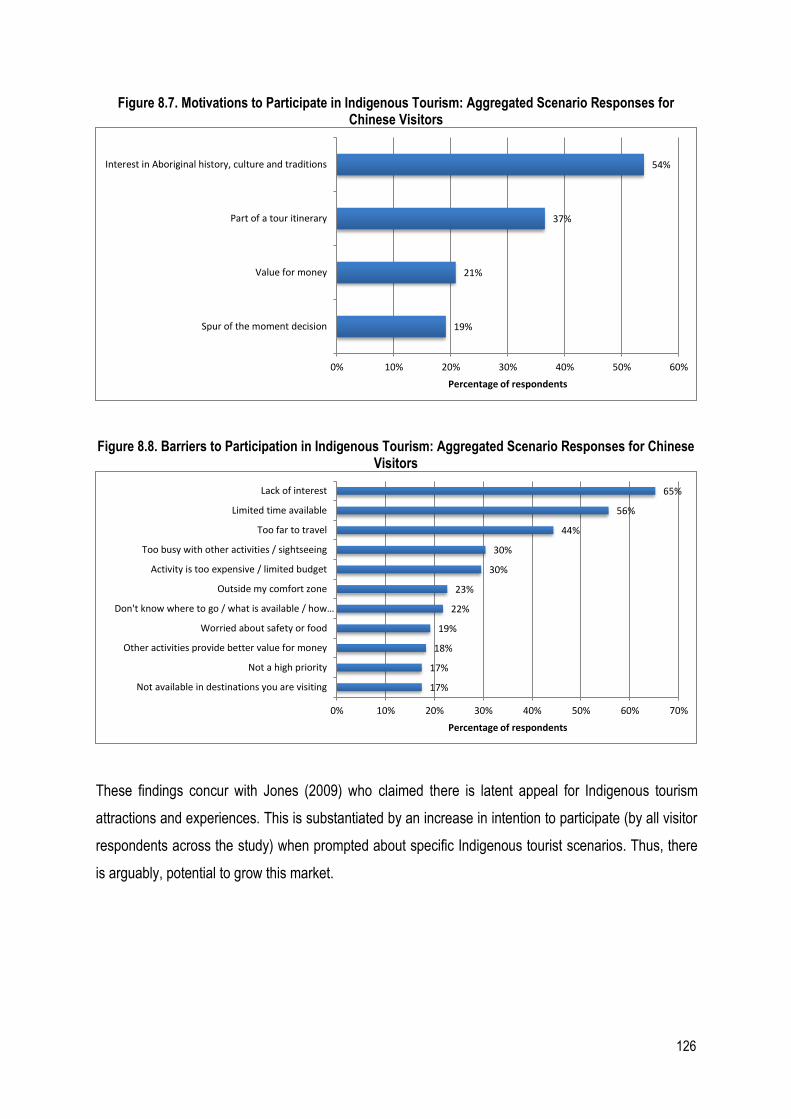
126
Figure 8.7. Motivations to Participate in Indigenous Tourism: Aggregated Scenario Responses for Chinese Visitors
Figure 8.8. Barriers to Participation in Indigenous Tourism: Aggregated Scenario Responses for Chinese Visitors
These findings concur with Jones (2009) who claimed there is latent appeal for Indigenous tourism
attractions and experiences. This is substantiated by an increase in intention to participate (by all visitor
respondents across the study) when prompted about specific Indigenous tourist scenarios. Thus, there
is arguably, potential to grow this market.
19%
21%
37%
54%
0% 10% 20% 30% 40% 50% 60%
Spur of the moment decision
Value for money
Part of a tour itinerary
Interest in Aboriginal history, culture and traditions
Percentage of respondents
17%
17%
18%
19%
22%
23%
30%
30%
44%
56%
65%
0% 10% 20% 30% 40% 50% 60% 70%
Not available in destinations you are visiting
Not a high priority
Other activities provide better value for money
Worried about safety or food
Don't know where to go / what is available / how…
Outside my comfort zone
Activity is too expensive / limited budget
Too busy with other activities / sightseeing
Too far to travel
Limited time available
Lack of interest
Percentage of respondents
127
Chapter Nine: Conclusions and Recommendations – Stage One and
Two
The purpose of this study was to undertake a gap analysis to increase understanding about the
demand for, and supply of, Indigenous tourism in Australia. Indigenous tourism is an integral part of
Australia’s tourism product with Indigenous tourism being one of the key experiences underpinning
Tourism Australia’s global marketing activities. Yet engagement in Indigenous tourism experiences by
both international and domestic markets has been declining since 2006 (Tourism Research Australia,
2011). Despite conflicting reports pertaining to the success (or not) of Indigenous tourism in Australia,
arguably, this sector of the tourism industry has not been realising its full potential nor is it convincingly
securing a sustainable presence in the increasingly competitive global marketplace.
Over and above contending with external pressures including an unstable global economy, a high
Australian dollar and declining inbound visitor numbers, the Indigenous tourism ‘sector’ in Australia has
also had to contend with internal pressures such as negative perceptions about Indigenous Australians,
lack of capacity, concerns over marketing messages, and in many instances, the range of challenges
inherent in operating in remote locations. Therefore, this study sought to identify and understand
discrepancies between the demand for, and supply of, Indigenous tourism products in Australia in order
to identify, understand and develop strategies for responding to the discrepancies between demand for,
and supply of, Indigenous tourism products in Australia. The findings of this study provide the basis for
the project stakeholders to develop appropriate strategies to recognise the potential of this sector.
Based on the findings presented in the preceding chapters, a series of recommendations and
implications are proposed around:
9.1 Understanding the Market
The findings of the study clearly indicated that Indigenous tourism operators are not in sync with what
the inbound market to Australia is looking for. While the operator participants did identify a number of
similar experiences they believed tourists are looking for, in many cases the perceived importance of
these experiences were overestimated. A particular example here would certainly include the operators’
understanding of the international market’s demand for Indigenous tourism, ranking it second, while
international tourists’ preference for Indigenous tourism was less than 5%. Similarly, overestimating
visitor demand for remote or non-urban locations shows a lack of understanding of Australia’s visitor
128
markets. This suggests that some Indigenous tourism operators have a lack of understanding about
their market(s), despite having access to some of the best, readily and freely available tourism market
intelligence. Indigenous tourism operators must fully understand the needs and demands of the market
to bridge the identified demand and supply gaps.
These findings indicate action is required in regard to exploring the information needs of operators as
well as the dissemination channels; as noted Australia has some of the most comprehensive tourism
statistical and market data available. A suggested starting point should be to ascertain operator’s
current usage of the available statistical and market data provided by tourism agencies.
Recommendations:
Explore the knowledge needs of Indigenous tourism operators, as well as the uptake and usage of
tourism market data.
Re-evaluate and/or develop more appropriate communication channels to meet Indigenous tourism
operators’ knowledge needs.
Assist Indigenous tourism operators with identifying, interpreting and/or collecting relevant data
sources.
9.2 Awareness of Indigenous Tourism
Modelling awareness, preferences and intentions of visitors along the Attrition Curve; specifically
designed to elicit more realistic insights into actual market perceptions and intention; provided valuable
insights into the market. While there have been assumptions about the high levels of interest from the
international market, the Attrition Curve showed that there was in fact very little difference between the
international and domestic markets. International visitors have low unprompted awareness of available
product. Of more concern is the preference for Indigenous tourism, which falls sharply on the Attrition
Curve. Here the preference is largely on par with domestic tourists.
The domestic market is largely unaware that there is an Indigenous tourism sector in Australia. This
finding is surmountable through increased education and targeted marketing strategies. However,
addressing the issue of preference and intention is more challenging. This study found that once
respondents were made aware of the range of product options via the scenario questions, preferences
and intention still declined sharply. Despite this, the domestic market should not be dismissed as a
129
potential target market given that the findings of this study show it to be on par with international
interest.
Recommendations:
Continue/increase the promotion of export ready Indigenous tourism businesses through
international distribution channels and targeted marketing campaigns.
Integrate micro, small and start-up businesses into local tourism distribution channels to increase
product awareness.
Develop awareness/marketing programs targeted at the domestic market that highlight the range of
Indigenous offerings available in Australia. Strategies to overcome the low levels of interest and
participation in Indigenous tourism will also be necessary.
Develop strategies to overcome negative perceptions amongst the domestic market.
The development of a brand logo may contribute to enhancing the profile of Indigenous tourism
products in the marketplace. The use of a consistent and recognisable logo could address some of
the identified awareness issues amongst the visitor segments and provide a means for visitors to
more readily identify Indigenous tourism product that is embedded in mainstream tourism
operations.
9.3 Barriers
The survey design, by operational necessity, did constrain the option to elicit richer understandings of
the barriers for visitors engaging in Indigenous tourism activities and experiences. However, most of the
barriers were neutral in their impact (i.e., rated at the mid-point of the scale).
The operators appeared to be focused on the issue of racism and negativity towards Indigenous
peoples. However, while it is acknowledged that visitor respondents may not have disclosed their true
thoughts on culturally sensitive issues, arguably there were ‘racist’ and/or negative connotations in
many of the open ended comments. Issues pertaining to racism are well beyond the scope of this
research. More targeted research, focused solely around eliciting barriers through alternative
methodologies could address this knowledge gap. Certainly the Indigenous tourism operators need a
better understanding of the barriers to Indigenous tourism to ensure the ongoing development of
sustainable enterprises.
130
Recommendations:
Develop a targeted marketing and educational campaign to demonstrate to the broader community,
the scope and breadth of Indigenous tourism operations in Australia.
Develop strategies to assist operators overcome barriers to participation.
9.4 Authenticity
Visitor respondents identified motivations for participating in Indigenous tourism that included a desire
to learn more (i.e., education) and an interest in Indigenous cultures. However, the main issue to arise
is centred on the ‘authentic’ portrayal of Indigenous peoples and their culture and traditions. Operators
voiced concerns pertaining to visitors’ desires and expectations to see stereotypical images of
Indigenous people with little to no acceptance of, and/or expectation to, engage with contemporary
Indigenous Australians.
Recommendation:
Support Indigenous tourism operators in developing products and experiences that are reflective of
contemporary Indigenous culture while balancing visitor demand and expectations.
9.5 Indigenous Tourism Scenarios
An important part of the methodology of this study was the scenario questions. The use of scenarios
were designed to measure the relative appeal of a number of different experiences that could be
undertaken in urban or remote areas, and would target different visitor interests (i.e., adventure, luxury).
The scenarios also sought to identify some approximate price points that visitors would be willing to pay
as cost related to Indigenous tourism activities has also a big factor. The willingness to pay is a further
(and arguably more insightful) indicator of actual demand for Indigenous tourism.
The scenarios provided some definitive findings with regard to the appeal of a wide range of product
and experience options. However, there was little difference in the relative appeal of these in spite of
the nature or location of the activity. Where respondents did indicate an options was appealing,
participation or intention halved as was seen on the various Attrition Curves. Willingness to pay for the
activities is a further indicator of demand and in this visitor sample respondents had reasonably low
price points relative to the types of activities or experiences.
131
A number of barriers were confirmed through the scenarios which are consistent with other data
collected in this study. Those that had expressed an interest in Indigenous tourism activities saw
barriers to their participation such as: a lack of time, other activities taking precedence, and
budget/expense of the activity. Not surprisingly for those that reported low appeal and intentions in the
scenarios, the reason was due to a lack of interest.
Recommendations:
Undertake realistic assessments of product gaps vis-à-vis tourist flows and demand patterns thus
moving away from supply led, ‘build it and they will come’, approaches to demand driven product
development.
Focus on development in urban centres and surrounds to capitalise on existing visitor traffic.
9.6 Chinese Inbound Market
The Chinese visitors surveyed in this study also showed little interest in participating in Indigenous
tourism opportunities due to, among other things, a lack of awareness of Indigenous tourism.
Nevertheless, the results of the scenarios suggested there is latent demand (albeit minimal at this
stage) for Indigenous product however, barriers including pricing, location and safety were cited by
Chinese visitors as reasons for not pursing an Indigenous tourism experience during their visit to
Australia. Furthermore, inbound tour operators cited numerous barriers to including Indigenous tourism
experiences on their tour itineraries while many Indigenous tourism operators expressed little to no
interest in pursuing the Chinese inbound market in the near future.
Recommendations:
Develop marketing campaigns to increase awareness of Australia’s Indigenous tourism products;
this should be targeted at both visitors and tour operators given the prevalence of group tours in
this market.
Assess identified barriers to participation and re-evaluate and/or develop product for the Chinese
inbound market.
Investigate lack of interest from some Indigenous tourism operators to pursue the Chinese inbound
market and facilitate opportunities for operators to explore the potential of this growth market.
132
9.7 Closing Remarks
This study has identified a number of points where a disconnect exists between Indigenous tourism
operators, visitor markets and government (via policy and marketing). The research design is such that
much emphasis has been placed throughout the report on the shortcomings of the Indigenous
operators themselves. However, ‘blame’ cannot be apportioned to any one group. There is certainly an
ongoing challenge in balancing the often contradictory expectations of visitor segments’ inherent
expectations and demands of an Indigenous experience against the realities of a contemporary
Indigenous tourism offering.
Although marketing strategies were not a focus of this research per se, the identified low levels of
awareness and demand do point to issues of marketing and promotion. It must be acknowledged
however, that agencies such as Tourism Australia have been, and continue working to launch market
ready Indigenous tourism product.
Low levels of demand for current product do point to opportunities such as packaging of Indigenous
tourism content into mainstream tourism product offerings such as accommodation, restaurants and
retail. This approach is advocated for instance in Tourism Queensland’s Indigenous Tourism Strategy.
Other options include complimenting an existing tourism attraction or experience with an Indigenous
element, in culture, interpretation, history or nature (i.e., Dreamworld, Currumbin Wildlife Sanctuary).
The findings of this study provided valuable and empirical insights into actual demand, preferences and
intentions of international and domestic tourists. Mapping this demand against Indigenous tourism
operators highlights key junctures where strategies are required. Although since the publication of the
first National Aboriginal and Torres Strait Islander Tourism Strategy in 1997 there has been much
progress in the development of this niche sector, which now has world class export businesses
operating around the country such as those in Tourism Australia’s Indigenous Tourism Champions
program, this study has clearly demonstrated there still remains much scope to improve the
sustainability of Australia’s Indigenous tourism sector.
133
References
Alston, R. (1998). Playing, visions, festivals: Remarks by Senator Richard Alston. Retrieved from http://www.search.aph.gov.au/search/Parlinfo.ASP?action=view&item=0&resultsID=66JKJ
Altman, J. C., & Finlayson, J. (1992) Aborigines, Tourism and Sustainable Development. Canberra: Centre for Aboriginal Economic Policy Research.
Axelrod, J. (1968). Attitude measures that predict purchase. Journal of Advertising Research, 8(January-February), 3-17.
Bronner, F. & de Hoog, R. (1985). A recipe for mixing decision ingredients. European Research, 13 (September), 109-115.
Brunt, P., & Courtney, P. (1999). Host perceptions of sociocultural impacts. Annals of Tourism Research, 26(3), 493-515.
Butler, R., & Hinch, T. (2007). Tourism and Indigenous Peoples: Issues and Implications. Amsterdam: Butterworth-Heinmann.
Buultjens, J. W., & White, N. (2008). Indigenous Tourism: The Possibilities into the Future. Paper presented at the Desert Knowledge Symposium 2008 - Developing Desert Directions: Rethinking the Future, Alice Springs. Retrieved from http://www.desertknowledgecrc.com.au/resource/DKCRC_Indigenous-Tourism_-The-Possibilities-into-the-Future.pdf
Chang, J. (2006). Segmenting tourists to aboriginal cultural festivals: An example in the Rukai tribal area, Taiwan. Tourism Management, 27(6), 1224-1234.
DeCrop, A. (2004). Trustworthiness in qualitative tourism research. In J. Phillimore & L. Goodson (Eds.), Qualitative Research in Tourism: Ontologies, Epistemologies and Methodologies (pp. 156-169). London: Routledge.
Fredline, L. (2000). Host community reactions to major sporting events: The Gold Coast Indy and the Australian Formula One Grand Prix in Melbourne. degree of Doctor of Philosophy, School of Tourism and Hotel Management, Griffith University.
Fuller, D., Buultjens, J., & Cummings, E. (2005). Ecotourism and Indigenous micro-enterprise formation in northern Australia: Opportunities and constraints. Tourism Management, 26(6), 891-904.
Haydon, J. (2007). Indigenous community festivals – top end: An evaluation using Encore event evaluation kit Retrieved 14th August 2011, from http://www.crctourism.com.au/WMS/Upload/Resources/bookshop/Haydon_IndigFesti vals.pdf
Hillman, W. (2007). Revisiting the concept of (objective) authenticity. Paper presented at the TASA Conference, Auckland, New Zealand.
Hollinshead, K. (1996). The disidentification of Aboriginal life. In R. Butler & T. Hinch (Eds.), Tourism and Indigenous peoples (pp. 308-348). London: International Thomson Business Press.
Janesick, V. J. (2000). The choreography of qualitative research design. In N. K. Denzin & Y. S. Lincoln (Eds), Handbook of Qualitative Research, 2nd edn (pp. 379-399). Thousand Oaks: Sage.
Jones Donald Strategy Partners. (2009). Project Indigenous Tourism: a research based consultancy to assist TA/RET to provide marketing guidance to promoters and suppliers of Indigenous tourism experiences for the domestic market. Sydney.
Lietaer, B., & DeMeulenaere, S. (2003). Sustaining cultural vitality in a globalizing world: The Balinese example. International Journal of Social Economics, 30(9), 967-984.
Morrison, S. (2005). A competitive future for destination Australia. Presented at the Tourism Futures Conference. Gold Coast, Australia.
Nielsen, N., Buultjens, J. & Gale, D., (2008). Indigenous tourism involvement in Queensland. Gold Coast: Sustainable Tourism Cooperative Research Centre.
Olsen, K. (2002). Authenticity as a concept in tourism research. Tourist Studies, 2(2), 159- 182. Pearce, P. (2007). Persisting with authenticity: Gleaning contemporary insights for future tourism
studies. Tourism Recreation Research, 32(2), 86-89.
134
Pearce, P. L., Moscardo, G., Green, D., Greenwood, T., Clark, A. & Tati, M. (1997). Visitor Satisfaction at Tjapukai. An Analysis of Satisfaction Considering the Geographical Origin of Visitors. Townsville: Department of Tourism, James Cook University.
Phipps, P., & Slater, L. (2010). Indigenous cultural festivals: Evaluating impact on community health and wellbeing. Melbourne, Australia: Globalism Research Centre, Royal Melbourne Institute of Technology.
Ryan, C., & Huyton, J. (2002). Tourists and Aboriginal People. Annals of Tourism Research, 29(3), 631-647.
Sdnali, D., & Chazapi, K. (2007). Cultural tourism in Greek insular community: The residents perspective. Tourismos: An International Multi-Disciplinary Journal of Tourism, 2(2), 61-78.
Slater, L. (2011). Don't let the sport and rec officer get hold of it: Indigenous festivals, big aspirations and local knowledge. Asia Pacific Journal of Arts and Cultural Management, 8(1), 630-644.
Swift, B. (1996). Preparing numerical data. In R. Sapsford & V. Jupp (Eds), Data Collection and Analysis (pp. 153-183). London: SAGE Publications.
Taylor, J. (2001). Authenticity and sincerity in tourism. Annals of Tourism Research, 28(1), 7-26. Tourism Australia. (2007). Australian Government Response to National Tourism Emerging Markets
Strategy and National Tourism Investment Strategy Reports. Canberra: Department of Industry, Tourism and Resources.
Tourism Australia. (2009). Driving visitation to Australia using experience themes. Tourism Australia. Retrieved from http://www.tourism.australia.com/en-au/downloads/Experience_Fact_Sheet.pdf.
Tourism Australia. (2012). China Market Profile Retrieved 20/11/2012, from http://www.tourism.australia.com/en-au/downloads/MarketProfiles2012_China.pdf
Tourism Australia. (2012a). 2020 China Strategic Plan Progress Report Retrieved 20/11/2012, from http://www.tourism.australia.com/TACP7018_China2020_1YearOn_Sept_12_WEB.pdf
Tourism Australia. (2012b). 2020 China..building the foundations - knowing the customer, from http://www.tourism.australia.com/China2020-Building_the_Foundations-Online-version2.pdf
Tourism Queensland. (2004). Indigenous Tourism Strategy: Including Indigenous People in Tourism. Brisbane: Queensland Government.
Tourism Research Australia. (2007). Indigenous Tourism Visitors in Australia. Canberra: Tourism Australia.
Tourism Research Australia. (2008). Indigenous Snapshot. Retrieved from http://www.tra.australia.com/niche.asp?lang=EN&sub=0081
Tourism Research Australia. (2010). Indigenous tourism in Australia: Profiling the domestic market. Retrieved from http://www.ret.gov.au/tourism/Documents/tra/Domestic%20Analysis/Indigenous_Tourism_in_Australia_FINAL.pdf.
Tourism Research Australia. (2011). Snapshots 2011: Indigenous Tourism Visitors in Australia. Retrieved from http://www.ret.gov.au/tourism/Documents/tra/Snapshots%20and%20Factsheets/2011/Snapshots2011Indigenous.pdf.
Tourism Research Australia (2011a). Destination Visitor Survey: Strategic Regional Research – Northern Territory, Dispersing Beyond Darwin. Canberra: Department of Resources Energy and Tourism, Tourism Research Australia.
Tourism Research Australia. (2012). International Visitors in Australia. Retrieved from: http://www.ret.gov.au/tourism/Documents/tra/International%20Visitor%20Survey/IVS-June2012.pdf.
Tremblay, P. & Wegner, A. (2009). Indigenous/Aboriginal Tourism Research in Australia (2000-2008): Industry lessons and future research needs. Gold Coast: Sustainable Tourism Cooperative Research Centre.
Urry, J. (1995). Consuming Places. London: Routledge.
135
Weaver, D. (2010). Indigenous tourism stages and their implications for sustainability. Journal of Sustainable Tourism, 18(1), 43-60.
Weber, R. P. (1990). Basic Content Analysis, 2nd edn. Newbury Park: SAGE Publications. Whitford, M. & Ruhanen, L. (2009). Indigenous Tourism Businesses in Australia. Development,
Analysis and Evaluation of a National Diagnostic Tool Profiling SME Indigenous Tourism Product. Gold Coast: Sustainable Tourism Cooperative Research Centre.
Winters, T. (2009). Media Release: Indigenous Australia to Play Greater Role. Retrieved from http://minister2.ret.gov.au/MediaCentre/MediaReleases/Pages/IndigenousAustraliatoPlayGreaterRole.aspx
Woodside, A.G. & Carr, J.A. (1988). Consumer decision making and competitive marketing strategies: Applications for tourism planning. Journal of Travel Research, 26, 2-7.
Woodside, A.G. & Lysonski, S.A (1989). General model of traveler destination choice. Journal of Travel Research, 27(8), 8-14.