Embed Size (px)
Citation preview
Demand for Services Rendered to Families in Brazil in the 2000’s: An Empirical Analysis of Consumer
Patterns and Social Expansion
Andre de Queiroz Brunelli
March, 2015
381
ISSN 1518-3548 CGC 00.038.166/0001-05
Working Paper Series Brasília n. 381 March 2015 p. 1-34
Working Paper Series
Edited by Research Department (Depep) – E-mail: [email protected]
Editor: Francisco Marcos Rodrigues Figueiredo – E-mail: [email protected]
Editorial Assistant: Jane Sofia Moita – E-mail: [email protected]
Head of Research Department: Eduardo José Araújo Lima – E-mail: [email protected]
The Banco Central do Brasil Working Papers are all evaluated in double blind referee process.
Reproduction is permitted only if source is stated as follows: Working Paper n. 381.
Authorized by Luiz Awazu Pereira da Silva, Deputy Governor for Economic Policy.
General Control of Publications
Banco Central do Brasil
Comun/Dipiv/Coivi
SBS – Quadra 3 – Bloco B – Edifício-Sede – 14º andar
Caixa Postal 8.670
70074-900 Brasília – DF – Brazil
Phones: +55 (61) 3414-3710 and 3414-3565
Fax: +55 (61) 3414-1898
E-mail: [email protected]
The views expressed in this work are those of the authors and do not necessarily reflect those of the Banco Central or
its members.
Although these Working Papers often represent preliminary work, citation of source is required when used or reproduced.
As opiniões expressas neste trabalho são exclusivamente do(s) autor(es) e não refletem, necessariamente, a visão do Banco
Central do Brasil.
Ainda que este artigo represente trabalho preliminar, é requerida a citação da fonte, mesmo quando reproduzido parcialmente.
Citizen Service Division
Banco Central do Brasil
Deati/Diate
SBS – Quadra 3 – Bloco B – Edifício-Sede – 2º subsolo
70074-900 Brasília – DF – Brazil
Toll Free: 0800 9792345
Fax: +55 (61) 3414-2553
Internet: <http//www.bcb.gov.br/?CONTACTUS>
Demand for Services Rendered to Families in Brazil in the
2000’s: An Empirical Analysis of Consumer Patterns and
Social Expansion*
Andre de Queiroz Brunelli**
Abstract
This paper aims at investigating the structural relation between patterns of
services consumption and income. We focus on how patterns of services
consumption adjust to different levels of income by using the perspective of
social expansion as a narrative approach for the Brazilian case in the last
decade. We present evidence of nonlinearity in the relation between services
consumption and income by using data of the last two versions (2002-2003
and 2008-2009) of the POF-IBGE. The main conclusion follows. Although
the population rise of the middle class was remarkably larger than the
increase of the richest class, total expenditure and its share on services of the
richest class was sufficiently large for this class to outweigh the middle class
in accounting for the growth of families’ total expenditure on services.
Thus, a policy implication arises. If one assume that Brazil is able to keep in
a similar developing path that was experienced in the past decade, which
combines expansion of the middle class and the richest class, then unless
there are systematic increases in productivity stemming especially from the
tradable sector, demand for services rendered to families is likely to be a
source of persistent pressures on consumer inflation. The results additionally
suggest that, other things equal, demand pressures will stem in special from
personal services and transportation since consumption of these IPCA
clusters has the particular feature of combining both a high share of total
services consumption and a high sensitivity to income rises of Brazilian
households in the period.
Keywords: Consumer demand; services consumption; social expansion
JEL Classification: D12; E31; C31
* The author thanks the staff of the Economic Consultancy – Chairman’s Office, Fabio Jose Ferreira da
Silva – Economic Department – and anonymous referees for helpful comments. Special thanks are due to
Matheus Stivali – IPEA – for giving a valuable help with the POF database.**Economic Consultancy – Chairman’s office, Banco Central do Brasil. E-mail:
The Working Papers should not be reported as representing the views of the Banco
Central do Brasil. The views expressed in the paper are those of the authors and do not
necessarily reflect those of the Banco Central do Brasil
3
1. Introduction
The Brazilian economy has experienced in the past decade structural changes
and a rise of relative prices in favor of non-tradables activities, especially in the services
sector. As a consequence, both the weight and the level of inflation of services prices
that comprise de Brazilian consumer price index – IPCA – increased considerably
(BCB, 2011a; BCB, 2011b; BCB, 2013).
Although this stylized fact seems challenging for economic policy, there is a
lack of applied literature in Brazil up this time about the determinants of supply and
demand of the services inflation. One exception is Santos (2014). The author stresses
the sub-sectorial heterogeneity of the services inflation dynamics by doing a broad
analysis of demand determinants and, especially, cost determinants of services inflation.
The contribution of this paper is to take a step back from the analysis of the links
between services inflation and its determinants. In particular, we investigate the
structural relation between patterns of services consumption and income. Therefore, we
stand at the demand side of the services inflation analysis. However, we do not intend to
investigate the determinants of services demand. Instead, we focus on how patterns of
services consumption adjust to different levels of income by using the perspective of
social expansion as a narrative approach for the Brazilian case in the last decade.
For this purpose, the data are drawn from the last two versions of the Family
Budget Survey (POF) of the Brazilian Institute of Geography and Statistics (IBGE) – a
household level data of families’ budget and expenditures for the whole country in the
years 2002-2003 and 2008-2009. Since our intent is to contribute to services inflation
analysis, we define expenditures on services by including exactly the same basket of
services comprised by services inflation that follows the current classification of the
Central Bank of Brazil (BCB) since 2012 (BCB, 2011c).
Despite data limitation with respect to availability of price levels of goods and
services and also the low frequency in which the POF is carried, the results raised are
consistent with international literature. Clark (1951) argues that demand for services is
non-homothetic: the expenditure share of services rises with income. Mazzorali and
Ragusa (2013) present evidence consistent with Clark’s view. They study, particularly,
the provision increase of non-tradable time-intensive services – such as food preparation
4
and cleaning – in the US and show evidence that consumption of home services is
responsive to income increases among higher wage-income groups.
Furthermore, consistently with Clark’s view, we argue that demand for services
is relatively income elastic. We show that between 2003 and 2009 (the last two versions
of the POF), while per capita income increased especially among groups of lower
income, the shape of the distribution of tradable goods consumption in the aggregate
level virtually did not change with respect to per capita income. However, the
distribution of services consumption became less unequal, which suggests that families
in the left tail of the income distribution adjusted their consumption patterns to
increased income.
We also assume that demand for services is relatively price inelastic, once we
are not able to develop a complete (well-specified) demand system due to data
limitation. Thus, we will not capture ideally how household characteristics interact with
both income and price effects. However, that assumption might be weakened by the
extensive literature that has arisen since Baumol (1967), which shows plenty of
evidence that demand for task-intensive work – services in particular – is relatively
price inelastic (Autor and Dorn, 2013).
In his seminal paper, Baumol (1967) argues that growing expenditures on
services reflects unbalanced growth: because relative prices of technologically lagging
activities (e.g., haircuts and educational courses) necessarily rise over time, an
increasing share of societal income must be expended on these activities to maintain
balanced consumption. As a corollary, demand for these activities is relatively price
inelastic – otherwise expenditure would fall as relative prices rose.
All these considerations are references for other results that were raised. For
example, we estimate Engels curves for services demand. Despite the limitations
mentioned and under reasonable assumptions, the overall results are in line with
prominent studies on this topic. In estimating the Engels curves, we consider an
extension of the linear (Deaton and Muellbauer, 1980) and quadratic (Blundell et
al.,1993) “almost ideal demand system” estimated on British data. Consumer demand
patterns typically found in micro data sets vary considerably with different levels of
income. Thus, we allow for nonlinear log-income terms in the expenditure-share
equation, which as we shall see, represents the observed behavior in the POF survey
5
data quite adequately. This means that the relation between services consumption and
income in Brazil is clearly nonlinear, which is consistent with the literature.
This stylized fact is important because the main result of this study stems from
it. By considering the remarkable social expansion between 2003 and 2009, we follow
Neri (2010) to define four economic classes ordered by real per capita income from the
poorest to the richest families (E, D, C – middle class – and A/B – richest class). During
this period, we see that population of both the richest class and especially the middle
class grew at the expense of the decline of the poorest classes, E and D. The richest
class increased by around 9 million people, while the middle class rose by
approximately 42 million people. Although the population growth of the middle class
was more than four times the one of the richest class (larger extensive margin of
consumption), the average expenditure share on services of the richest class was
considerably higher relative to middle class (larger intensive margin of consumption).
Interestingly, it was sufficiently large for the richest class to outweigh the middle class
in accounting for the rise of families’ total expenditure on services in this period.
The results additionally state that food away from household, housing charges,
personal services and transportation were the IPCA services clusters with the largest
shares (weights) in families’ total expenditure on services. Moreover, the parameters
estimated on POF’s data can be used to evaluate income elasticities across IPCA
clusters (and its sub-items) and also across each economic class. To this respect, we
argue that personal services and transportation not only stood out as shares in families’
total expenditure on services, but they were also one of the most income elastic IPCA
clusters in overall Brazilian society. It suggests, other things being equal, that the
continuity of a similar pattern of social expansion that Brazil experienced in the past
decade will imply demand pressures stemming especially from these groups.
In this regard, first, consider this structural nonlinearity between services
consumption and income. Moreover, Baumol (1967) argues that in most of the services
rendered to families there are only sporadic increases in productivity since inherent in
technological structure of these activities are forces working almost unavoidably for
progressive and cumulative increases in the real costs incurred in supplying them. In
addition, conceive a hypothesis that Brazil is able to keep in a developing path that
combines economic growth and social expansion. That is, both the middle class and the
richest class – the economic classes that have expanded and whose expenditure shares
6
on services are relatively larger – are able to expand further. Thus, unless there are
systematic increases in productivity especially in activities that are allowed by its
technologically progressive structure (usually in the tradable sector) so that,
innovations, capital accumulation and economies of large scale can offset this secular
trend of cost increases in non-tradable activities; demand for services rendered to
families is likely to be a source of persistent pressure on consumer inflation.
Besides this introduction, this paper is organized as follows: section 2 presents
the data description. Section 3 discusses the results and section 4 presents the
concluding remarks.
2. Data Description
In this study we draw data from the last two versions of the Family Budget
Survey (POF) of the Brazilian Institute of Geography and Statistics (IBGE) – a
household level data of families’ budget and expenditure for the whole country in the
years 2002-2003 and 2008-2009.
We use this data to characterize patterns of services consumption of families in
Brazil in this period. Since our intent is to contribute to services inflation analysis, we
define expenditure on services by including exactly the same basket of services
comprised by services inflation that follows the current classification of the BCB in
2012. Furthermore, we focus specifically on how patterns of services consumption
adjust to different levels of income. Thus, we use the perspective of social expansion as
a narrative approach for characterizing the developments on families’ (households’)2
services consumption and income in the Brazilian case.
With respect to the classification of the BCB, we pick services from the POF
following the set of records of goods and services for each survey (2002-2003 and
2008-2009). Then, we cluster these services among the 66 sub-items3 of the IPCA
comprised in the basket of the BCB classification of services inflation in 2012.4
Therefore, it includes only services freely traded (does not include supervised services).
We opted for this year’s classification because it is the current one and also for
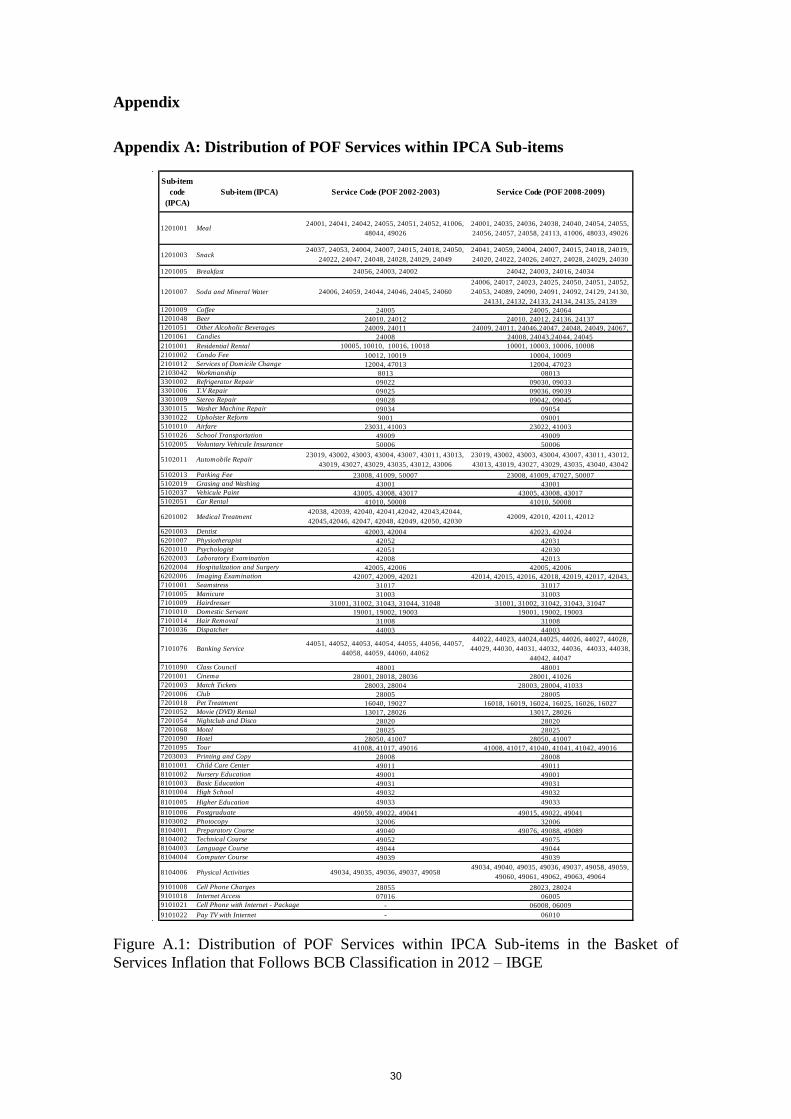
2 We take families and households as synonyms for convenience. See footnote 8. 3 Sub-items are the smallest type of classification within the IPCA basket of goods and services. 4 Table A1 in the appendix shows the distribution of the services that we consider in both POF surveys
(2002-2003 and 2008-2009) among 66 sub-items of the IPCA comprised in the basket of the BCB
classification of services inflation in 2012.
7
comparability, since the basket that defines the BCB series of services inflation has
changed over time (BCB, 2011c).5
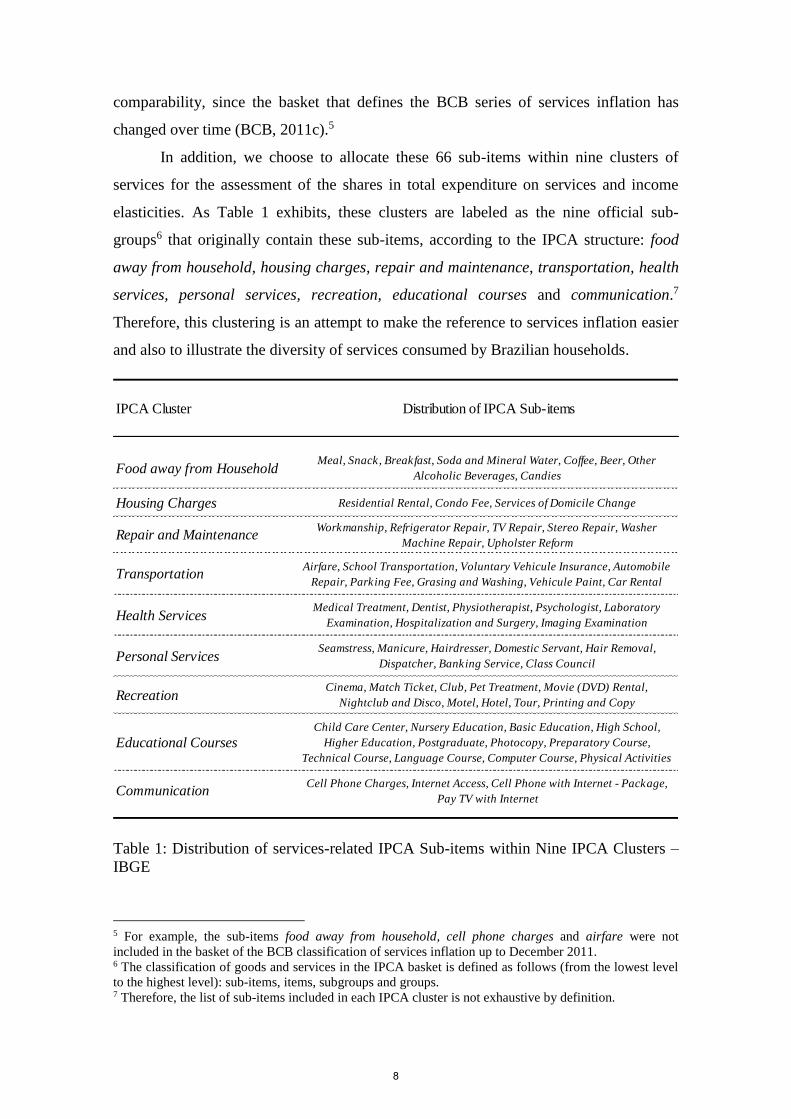
In addition, we choose to allocate these 66 sub-items within nine clusters of
services for the assessment of the shares in total expenditure on services and income
elasticities. As Table 1 exhibits, these clusters are labeled as the nine official sub-
groups6 that originally contain these sub-items, according to the IPCA structure: food
away from household, housing charges, repair and maintenance, transportation, health
services, personal services, recreation, educational courses and communication.7
Therefore, this clustering is an attempt to make the reference to services inflation easier
and also to illustrate the diversity of services consumed by Brazilian households.
Table 1: Distribution of services-related IPCA Sub-items within Nine IPCA Clusters –
IBGE
5 For example, the sub-items food away from household, cell phone charges and airfare were not
included in the basket of the BCB classification of services inflation up to December 2011. 6 The classification of goods and services in the IPCA basket is defined as follows (from the lowest level
to the highest level): sub-items, items, subgroups and groups. 7 Therefore, the list of sub-items included in each IPCA cluster is not exhaustive by definition.
IPCA Cluster Distribution of IPCA Sub-items
Food away from HouseholdMeal, Snack, Breakfast, Soda and Mineral Water, Coffee, Beer, Other
Alcoholic Beverages, Candies
Housing Charges Residential Rental, Condo Fee, Services of Domicile Change
Repair and MaintenanceWorkmanship, Refrigerator Repair, TV Repair, Stereo Repair, Washer
Machine Repair, Upholster Reform
TransportationAirfare, School Transportation, Voluntary Vehicule Insurance, Automobile
Repair, Parking Fee, Grasing and Washing, Vehicule Paint, Car Rental
Health ServicesMedical Treatment, Dentist, Physiotherapist, Psychologist, Laboratory
Examination, Hospitalization and Surgery, Imaging Examination
Personal ServicesSeamstress, Manicure, Hairdresser, Domestic Servant, Hair Removal,
Dispatcher, Banking Service, Class Council
RecreationCinema, Match Ticket, Club, Pet Treatment, Movie (DVD) Rental,
Nightclub and Disco, Motel, Hotel, Tour, Printing and Copy
Educational CoursesChild Care Center, Nursery Education, Basic Education, High School,
Higher Education, Postgraduate, Photocopy, Preparatory Course,
Technical Course, Language Course, Computer Course, Physical Activities
CommunicationCell Phone Charges, Internet Access, Cell Phone with Internet - Package,
Pay TV with Internet
8
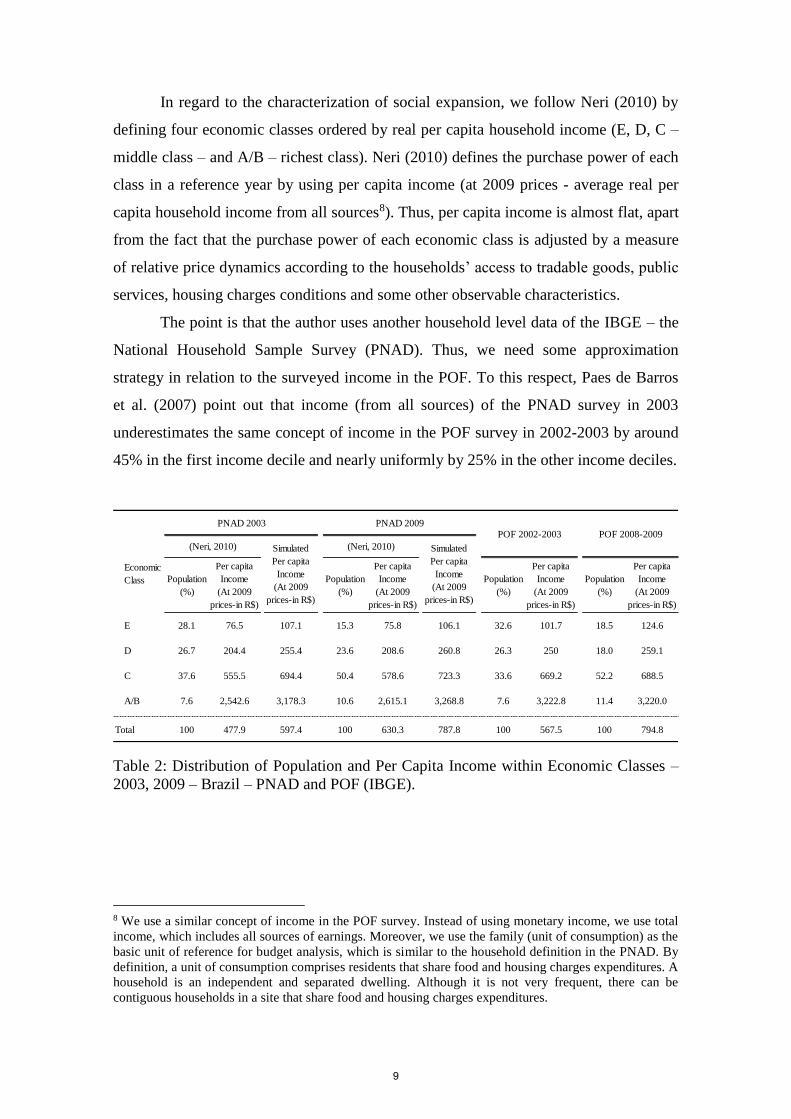
In regard to the characterization of social expansion, we follow Neri (2010) by
defining four economic classes ordered by real per capita household income (E, D, C –
middle class – and A/B – richest class). Neri (2010) defines the purchase power of each
class in a reference year by using per capita income (at 2009 prices - average real per
capita household income from all sources8). Thus, per capita income is almost flat, apart
from the fact that the purchase power of each economic class is adjusted by a measure
of relative price dynamics according to the households’ access to tradable goods, public
services, housing charges conditions and some other observable characteristics.
The point is that the author uses another household level data of the IBGE – the
National Household Sample Survey (PNAD). Thus, we need some approximation
strategy in relation to the surveyed income in the POF. To this respect, Paes de Barros
et al. (2007) point out that income (from all sources) of the PNAD survey in 2003
underestimates the same concept of income in the POF survey in 2002-2003 by around
45% in the first income decile and nearly uniformly by 25% in the other income deciles.
Table 2: Distribution of Population and Per Capita Income within Economic Classes –
2003, 2009 – Brazil – PNAD and POF (IBGE).
8 We use a similar concept of income in the POF survey. Instead of using monetary income, we use total
income, which includes all sources of earnings. Moreover, we use the family (unit of consumption) as the
basic unit of reference for budget analysis, which is similar to the household definition in the PNAD. By
definition, a unit of consumption comprises residents that share food and housing charges expenditures. A
household is an independent and separated dwelling. Although it is not very frequent, there can be
contiguous households in a site that share food and housing charges expenditures.
Population
(%)
Per capita
Income
(At 2009
prices-in R$)
Population
(%)
Per capita
Income
(At 2009
prices-in R$)
Population
(%)
Per capita
Income
(At 2009
prices-in R$)
Population
(%)
Per capita
Income
(At 2009
prices-in R$)
E 28.1 76.5 107.1 15.3 75.8 106.1 32.6 101.7 18.5 124.6
D 26.7 204.4 255.4 23.6 208.6 260.8 26.3 250 18.0 259.1
C 37.6 555.5 694.4 50.4 578.6 723.3 33.6 669.2 52.2 688.5
A/B 7.6 2,542.6 3,178.3 10.6 2,615.1 3,268.8 7.6 3,222.8 11.4 3,220.0
Total 100 477.9 597.4 100 630.3 787.8 100 567.5 100 794.8
POF 2008-2009
Economic
Class
Simulated
Per capita
Income
(At 2009
prices-in R$)
(Neri, 2010) Simulated
Per capita
Income
(At 2009
prices-in R$)
PNAD 2003 PNAD 2009POF 2002-2003
(Neri, 2010)
9
Therefore, our rough strategy of approximation between POF and PNAD apply
the above mentioned factors of underestimation9 in Paes de Barros et al. (2007) on the
average of real per capita household income in each economic class in Neri (2010) that
uses PNAD data. Then, we use this simulated (per capita) income variable to define the
economic classes both in the 2002-200310 and 2008-200911 POF surveys. Table 2
compares per capita income (monthly average) and population distribution by economic
classes in Neri (2010) and by using our strategy of approximation.
Note that the definition of economic classes is not a central objective in this
study. Instead, we use the social expansion perspective in order to stress the structural
relation between consumption patterns of services and income in the Brazilian case.
Thus, we judge the figures of our approximation strategy as reasonable in the sense that
we believe any eventual measurement error in our definition of economic classes
relative to Neri’s would not be large enough to alter the generality of the core
conclusions raised in this study.
3. Patterns of Services Consumption and Social Expansion in Brazil
In this section we document the results by using the POF data. First, we show
evidence that services demand in the country rises with income and how it frames the
relevance of the middle class and, especially, the richest class for the increase of
services demand in the period. Subsequently, we document the shares (weights) of
services clusters in total family’s expenditure and evaluate income elasticities. By these
9 This application is weighted proportionally by income deciles. According to available data in Neri
(2010), class E accounted for 28.1% of total population in 2003, while it accounted for 15.3% of total
population in 2009. 10 For comparison between the 2002-2003 and 2008-2009 POF Surveys, income and expenditure figures
of POF 2002-2003 were corrected to the reference date of POF 2008-2009, taking the accumulated IPCA
which was 39.37%, according to the POF Methodology. For further details, see:
ftp://ftp.ibge.gov.br/Orcamentos_Familiares/Pesquisa_de_Orcamentos_Familiares_2008_2009/Perfil_das
_Despesas_no_Brasil/POF2008_2009_perfil.pdf. 11 We assume that the analysis in Paes de Barros et al. (2007), which uses data in 2003, applies to data in
2009. In this year, data seem to fit quite reasonably by using the authors’ factors of underestimation,
except for class E. It seems that the income underestimation of PNAD with respect to POF is higher in
2009 than in 2003 for the poorer percentiles. Thus, we apply a higher factor for class E (around 64%) in
order to have better approach to Neri (2010) for all classes. This fact seems to reflect the inequality
decrease, which might be better captured by the POF survey as income is better measured in the poorer
tail of income distribution. However, since robustness of income distribution is not in this study's scope,
we have left a more accurate analysis on this topic as an extension.
10
means, we can point out which types of services accounted for (and might account for)
the rise of services demand.
3.1. The Outlines of the Macroeconomic Background
The Brazilian economy has undergone important macro and microeconomic
reforms over the past two decades.12 Prices were stabilized, the economy was opened up
to foreign trade and investment, and a macroeconomic policy framework based on
inflation targeting, floating exchange rates and fiscal responsibility was established.
After decades of vulnerability to external shocks, Brazil built up a robust foreign
liquidity buffer as the result of a policy of foreign reserve accumulation.
Microeconomic reforms were implemented, such as, for example, new bankruptcy
legislation and credit market reforms including the creation of new credit instruments
and reduction of legal risks.
Brazil has also made considerable progress in reducing poverty and inequality
over the last decade. Targeted antipoverty programs have been implemented, along with
policies that increased purchasing power of the minimum wage in real terms and
expanded the social safety net. In addition, access to educational courses has improved
substantially. Investment in educational courses has fuelled a relatively fast expansion
in mean years of schooling.13
Another development that is worth mentioning is demographics. Brazil is
approaching the final stage of its first demographic dividend, since it is projected to
taper off by mid-2020’s. As a result, first, all else being equal, per capita income grows
more rapidly during this time when the working age population temporarily grows
faster than the dependent population – youth and elderly.14 Second, it is likely to have
strengthened the fall in the actual and natural unemployment rate during the past decade
as the age structure of the labor force has shifted towards groups with relatively lower
unemployment rates and away from groups with persistently large unemployment rates
– young workers (Barbosa Filho and Pessôa, 2011; Brunelli, 2014). Third, demography
12 See, for example, Bonelli (2010). 13 According to the United Nations Human Development Report 2014, the mean years of schooling in
Brazil increased from 5.6 in 2000 to 7.2 in 2012. 14 See Eggleston and Fuchs (2012).
11
also plays a role in educational improvements, as smaller families are associated with
greater human capital investment in children and young adults.15
In the meantime, Brazil has come across a favorable international scenario. Non-
tradables benefited from exchange rate appreciation due to increasing commodity prices
and high global liquidity. This trend increased the demand for housing and services,
especially those that are relatively intensive in low-skilled labor. Thus, the interaction
between labor supply and demand trends for qualification has resulted in a tighter labor
market for low-skilled workers.16 Consequently, although wage premia for higher levels
of educational attainment remain relatively high, they have fallen continuously.
As a consequence, the unemployment rate declined considerably during the
2000’s and is currently at historic lows. Moreover, wage developments have specially
favored less skilled workers, many of which had difficulty finding steady employment
previously. It was strengthened by an increase in the share of formal jobs, at the expense
of informal jobs.
In short, greater demand for low-skilled labor, wider access to education and
targeted antipoverty programs, implications of the demographic transition and also a
favorable international scenario help explain how Brazil was able to reconcile economic
growth and lower inequality in the past decade,17 as earnings increased relatively more
in the left tail of the wage distribution.
3.2. Income and Patterns of Services Consumption
3.2.1. An Initial Motivation: Income and Consumption of Services and Goods
Over the past decade Brazil indeed experienced economic growth with
decreasing inequality, according to the POF surveys. Between 2003 and 2009, per
capita income raised by about 20% in real terms. Furthermore, it favored especially the
left tail of the wage distribution, since the Gini index fell by approximately 4 p.p.18
15 Lee and Mason (2010). 16 See Pauli et al. (2012). 17 Lustig et al. (2013). 18 The concept of per capita income, to be precise, is per capita household income from all sources. The
Gini index declined from 0.595 to 0.558 from 2003 to 2009. It was computed at the percentiles of
household per capita income.
12
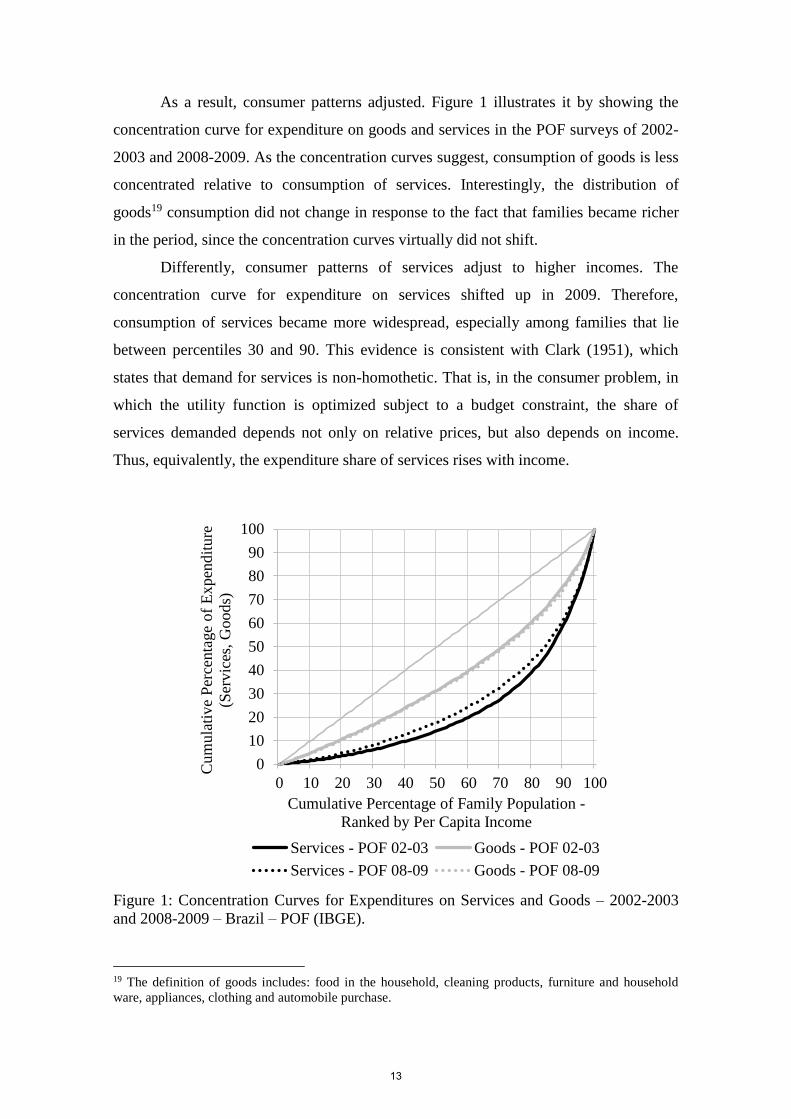
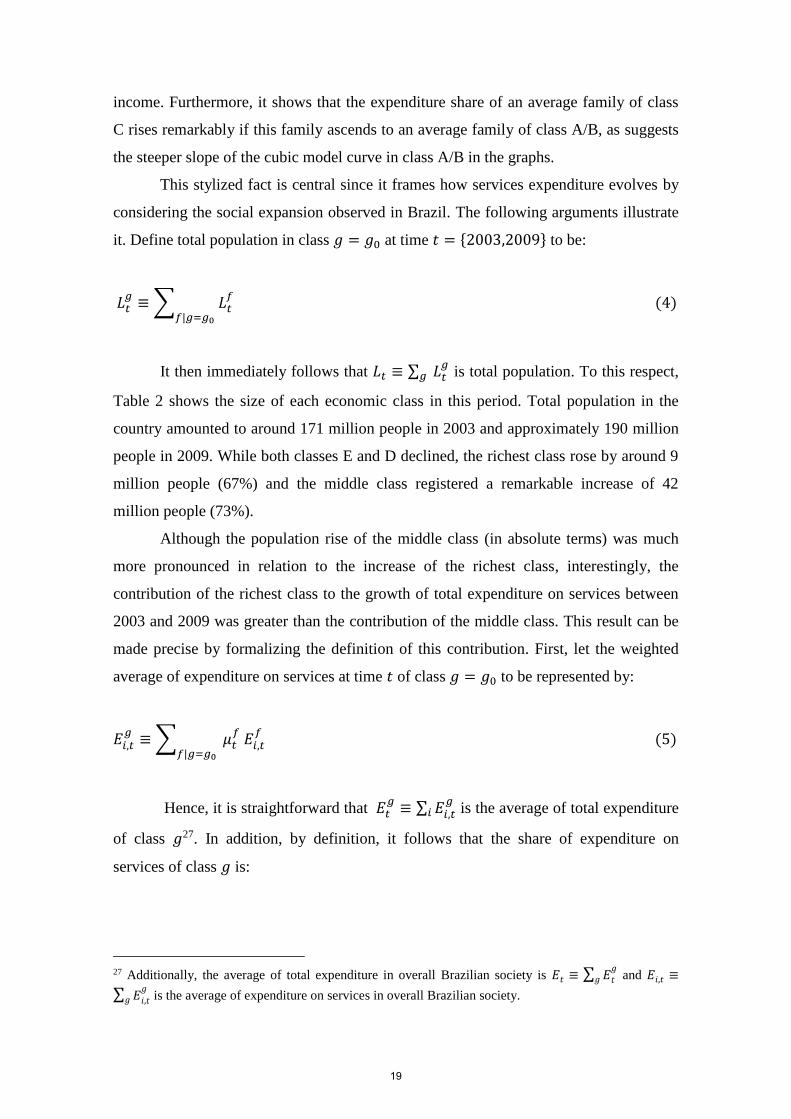
As a result, consumer patterns adjusted. Figure 1 illustrates it by showing the
concentration curve for expenditure on goods and services in the POF surveys of 2002-
2003 and 2008-2009. As the concentration curves suggest, consumption of goods is less
concentrated relative to consumption of services. Interestingly, the distribution of
goods19 consumption did not change in response to the fact that families became richer
in the period, since the concentration curves virtually did not shift.
Differently, consumer patterns of services adjust to higher incomes. The
concentration curve for expenditure on services shifted up in 2009. Therefore,
consumption of services became more widespread, especially among families that lie
between percentiles 30 and 90. This evidence is consistent with Clark (1951), which
states that demand for services is non-homothetic. That is, in the consumer problem, in
which the utility function is optimized subject to a budget constraint, the share of
services demanded depends not only on relative prices, but also depends on income.
Thus, equivalently, the expenditure share of services rises with income.
Figure 1: Concentration Curves for Expenditures on Services and Goods – 2002-2003
and 2008-2009 – Brazil – POF (IBGE).
19 The definition of goods includes: food in the household, cleaning products, furniture and household
ware, appliances, clothing and automobile purchase.
0
10
20
30
40
50
60
70
80
90
100
0 10 20 30 40 50 60 70 80 90 100
Cu
mu
lati
ve
Per
cen
tage
of
Ex
pen
dit
ure
(Ser
vic
es,
Go
od
s)
Cumulative Percentage of Family Population -
Ranked by Per Capita Income
Services - POF 02-03 Goods - POF 02-03
Services - POF 08-09 Goods - POF 08-09
13
An additional way of illustrating that expenditure share of services rises with
income is by doing a specification approach to household preferences in the next
subsection.
3.2.2. The Specification of Household Preferences over Services Consumption
A complete demand system is an attempt to characterize preferences of families
(households) regarding the consumption of goods or services. In a period 𝑡, a family 𝑓
makes decisions on how much to consume of a good or service depending on the
relative prices of goods and services and household income. These choices are generally
conditioned on a set of variables, 𝐳, that includes various household characteristics and
the consumption levels of a second group of possible less flexible demands.20
The family may wish to save or to borrow in period 𝑡 and this determines how
much expenditure to allocate to current consumption of goods and services. Total
expenditure allocated to goods and services in 𝑡 is the first stage in two-stage allocation
process, as pointed out by Blundell et al (1993). Therefore, if utility is weakly separable
across time then the within-period preferences, ℎ, can be determined without reference
to prices and incomes outside the period (Blundell and Walker, 1986). Letting 𝑞𝑖,𝑡𝑓
represent consumption of a good or service 𝑖; 𝑥𝑡𝑓 is total income – each variable defined
at period 𝑡 and for family 𝑓 – and 𝐩𝑡 is the n-vector of period-𝑡 prices, it follows that:
𝑝𝑖,𝑡𝑞𝑖,𝑡𝑓 = ℎ𝑖(𝐩𝑡, 𝑥𝑡
𝑓, 𝐳𝑡
𝑓) (1)
In this study, we specifically analyze household choices over consumption of
services. Due to data limitation with respect to availability of price levels of goods and
services and also the low frequency in which the POF is carried, we propose an initial
approach to households’ preferences. We aggregate data on services consumption by
using the definition described in section 2 and ordered it across one hundred
observations of per capita household income21 that represent income percentiles.
Therefore, to describe household preferences we abstract from most differences in 𝐳𝑡𝑓,
20 See Blundell et al. (1993). 21 We define income as the average per capita household income from all sources.
14
except the implicit control over the number of people in each family (household), by
definition of per capita income that we consider.
Furthermore, we suppose that relative prices are flat. Thus, household choices
over expenditure allocation on service can be interpreted as dependent on income and
prior to substitution effects. To this respect, two comments that might lessen this
hypothesis. First, the applied literature points out that services, especially the intensive-
task ones (most of our sample), are relatively price inelastic (Clark, 1951; Baumol,
1967; Mazzorali And Ragusa, 2013; Autor and Dorn, 2013). For example, Blundell et
al. (1993) estimate, with British data, that uncompensated own-price elasticity of
services is -0.725, while uncompensated cross-price elasticity of services with other
goods (food, alcohol, fuel and clothing) are in a range between -0.084 (alcohol) and -
0.372 (clothing).22
Second, specifically with respect to Brazil between 2003 and 2009, although
relative prices of services rose, the weight of services prices that comprise the Brazilian
consumer price index also increased (BCB, 2011a; BCB, 2013), which is by definition,
consistent to POF data on household’s expenditure. In fact, according to POF surveys,
the weighted average of services share in total expenditure rose by 1.2 p.p23 between
2003 and 2009. Therefore, if one consider that during this period real wages rose
considerably (Brunelli, 2014; BCB 2011b), then any potential negative effect on
services demand24 that arise from the increase of relative prices of services was not
enough to offset the positive effect stemming from the increased income25. This stylized
fact is consistent with the literature and suggest that the bias over the estimation of the
share of expenditures and income elasticities due to this misspecification might not be
large.
We must also point out that, in the calculation of income elasticity at a more
disaggregated level in each of the nine IPCA clusters and further in each of the 66
services sub-items, we assume that utility is weakly separable across services and
goods. In particular, the category of services consumed by families is weakly separable
from the other goods. That is, the definition of the share of each IPCA cluster and also
of each sub-item is related to total expenditure on services.
22 These estimations are computed by GMM. They also document OLS compensated own-elasticity for
services: -0.667. 23 From 17.5% to 18.7% of total expenditure. 24 By considering that services do not violates the law of demand – ordinary service (good). 25 We show in subsection 3.2.4 that services are a luxury.
15
Additionally, it is important to mention that since we deal with an incomplete
demand system that does not evaluate price effects; we implicitly suppose that usual
conditions in agents’ utility optimization are satisfied. As such, integrability conditions
of demand theory, in particular, a negative semidefinite Slutzky matrix – adherence to
concavity – is not too much at odds with the observed data.
In a nutshell, this study assumes that the decisions of households with respect to
how much to allocate their spending on services depends primarily on income and the
size of the family. This means that we assume flat relative prices, adherence to
concavity is satisfied and utility is weakly separable across time and across services and
goods. Thus, by setting z𝑡𝑓 the number of people in family 𝑓 and by defining 𝑏𝑙(𝑥𝑡
𝑓) as
known polynomials in household total income, we write the share of expenditure on
services (in total expenditure), in period 𝑡 for family 𝑓 as:
𝑆𝑖,𝑡𝑓 = ℎ𝑖(��𝑡, 𝑏𝑙(𝑥𝑡
𝑓), z𝑡
𝑓) (2)
where 𝑖 stands for services henceforward.
To illustrate the share of expenditure on services more explicitly, consider the
following cubic extension of Blundell et al. (1993) “Quadratic Almost Ideal Demand
System”, which, as we shall see, represents the income-expenditure relation in our POF
data quite reasonably. In this model, the 𝑏𝑙’s are simply polynomial logarithmic terms
so that (2) represents an Engel curve. It may be written as:
𝑆𝑖,𝑡𝑐 =∑Θ𝑘,𝑡(ln 𝑤𝑡
𝑐)𝑘 + 𝜀𝑡
3
𝑘=0
(3)
where we define 𝑤𝑡𝑐 ≡ ∑ 𝜇𝑡
𝑓𝑓|𝑐=𝑐0 (
𝑥𝑡𝑓
z𝑡𝑓) as the weighted average of per capita
household income from all sources by percentile 𝑐 = 𝑐0 at time 𝑡, such that 𝜇𝑡𝑓 is the
sample weight of family 𝑓 in the POF survey. In addition, Θ𝑘=0,𝑡 is a constant and
Θ𝑘>0,𝑡 are the coefficients on the polynomial logarithmic terms in 𝑤𝑡𝑐 and 𝜀𝑡 is an error
term. Thus, 𝑆𝑖,𝑡𝑐 may be defined as the weighted average of the expenditure share of
services of the percentile 𝑐 of per capita household income.
16
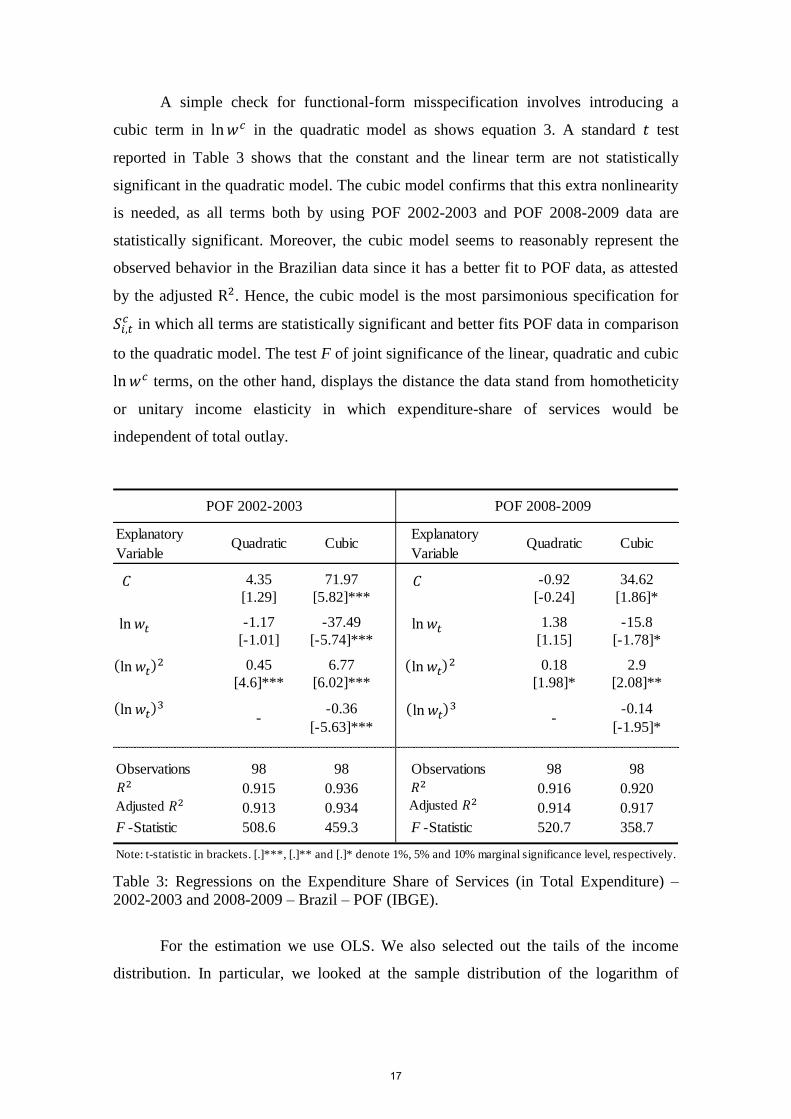
A simple check for functional-form misspecification involves introducing a
cubic term in ln𝑤𝑐 in the quadratic model as shows equation 3. A standard 𝑡 test
reported in Table 3 shows that the constant and the linear term are not statistically
significant in the quadratic model. The cubic model confirms that this extra nonlinearity
is needed, as all terms both by using POF 2002-2003 and POF 2008-2009 data are
statistically significant. Moreover, the cubic model seems to reasonably represent the
observed behavior in the Brazilian data since it has a better fit to POF data, as attested
by the adjusted R2. Hence, the cubic model is the most parsimonious specification for
𝑆𝑖,𝑡𝑐 in which all terms are statistically significant and better fits POF data in comparison
to the quadratic model. The test F of joint significance of the linear, quadratic and cubic
ln𝑤𝑐 terms, on the other hand, displays the distance the data stand from homotheticity
or unitary income elasticity in which expenditure-share of services would be
independent of total outlay.
Table 3: Regressions on the Expenditure Share of Services (in Total Expenditure) –
2002-2003 and 2008-2009 – Brazil – POF (IBGE).
For the estimation we use OLS. We also selected out the tails of the income
distribution. In particular, we looked at the sample distribution of the logarithm of
Explanatory
VariableQuadratic Cubic
Explanatory
VariableQuadratic Cubic
4.35 71.97 -0.92 34.62
[1.29] [5.82]*** [-0.24] [1.86]*
-1.17 -37.49 1.38 -15.8
[-1.01] [-5.74]*** [1.15] [-1.78]*
0.45 6.77 0.18 2.9
[4.6]*** [6.02]*** [1.98]* [2.08]**
-0.36 -0.14
[-5.63]*** [-1.95]*
Observations 98 98 Observations 98 98
0.915 0.936 0.916 0.920
0.913 0.934 0.914 0.917
F -Statistic 508.6 459.3 F -Statistic 520.7 358.7
Note: t-statistic in brackets. [.]***, [.]** and [.]* denote 1%, 5% and 10% marginal significance level, respectively.
- -
POF 2002-2003 POF 2008-2009
ln 𝑤𝑡
ln 𝑤𝑡2
ln 𝑤𝑡
ln 𝑤𝑡2
2
Adjusted 2 2
Adjusted 2
ln 𝑤𝑡3
ln 𝑤𝑡3
17
income and discarded the observations in the bottom and top 1 percent. This selection
(based on an econometrically exogenous variable) is meant to remove the possibility
that small outliers in the income distribution are responsible for the nonlinearity in the
expenditure-share equation.
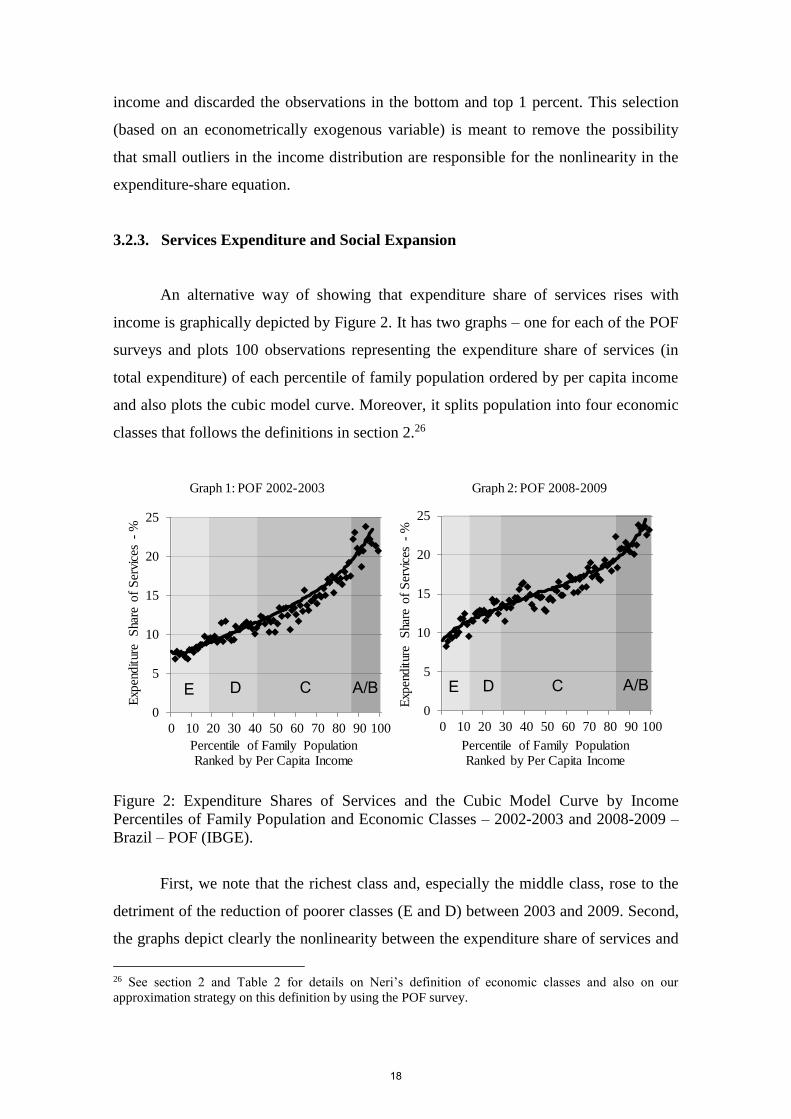
3.2.3. Services Expenditure and Social Expansion
An alternative way of showing that expenditure share of services rises with
income is graphically depicted by Figure 2. It has two graphs – one for each of the POF
surveys and plots 100 observations representing the expenditure share of services (in
total expenditure) of each percentile of family population ordered by per capita income
and also plots the cubic model curve. Moreover, it splits population into four economic
classes that follows the definitions in section 2.26
Figure 2: Expenditure Shares of Services and the Cubic Model Curve by Income
Percentiles of Family Population and Economic Classes – 2002-2003 and 2008-2009 –
Brazil – POF (IBGE).
First, we note that the richest class and, especially the middle class, rose to the
detriment of the reduction of poorer classes (E and D) between 2003 and 2009. Second,
the graphs depict clearly the nonlinearity between the expenditure share of services and
26 See section 2 and Table 2 for details on Neri’s definition of economic classes and also on our
approximation strategy on this definition by using the POF survey.
Graph 2: POF 2008-2009Graph 1: POF 2002-2003
0
5
10
15
20
25
0 10 20 30 40 50 60 70 80 90 100
Exp
end
itur
e S
hare
of
Ser
vice
s -
%
DE C A/B
Percentile of Family Population Ranked by Per Capita Income
0
5
10
15
20
25
0 10 20 30 40 50 60 70 80 90 100
Exp
end
itur
e S
hare
of
Ser
vice
s -
%
DE C A/B
Percentile of Family Population Ranked by Per Capita Income
18
income. Furthermore, it shows that the expenditure share of an average family of class
C rises remarkably if this family ascends to an average family of class A/B, as suggests
the steeper slope of the cubic model curve in class A/B in the graphs.
This stylized fact is central since it frames how services expenditure evolves by
considering the social expansion observed in Brazil. The following arguments illustrate
it. Define total population in class 𝑔 = 𝑔0 at time 𝑡 = {2003,2009} to be:
𝐿𝑡𝑔≡∑ 𝐿𝑡
𝑓
𝑓|𝑔=𝑔0
(4)
It then immediately follows that 𝐿𝑡 ≡ ∑ 𝐿𝑡𝑔
𝑔 is total population. To this respect,
Table 2 shows the size of each economic class in this period. Total population in the
country amounted to around 171 million people in 2003 and approximately 190 million
people in 2009. While both classes E and D declined, the richest class rose by around 9
million people (67%) and the middle class registered a remarkable increase of 42
million people (73%).
Although the population rise of the middle class (in absolute terms) was much
more pronounced in relation to the increase of the richest class, interestingly, the
contribution of the richest class to the growth of total expenditure on services between
2003 and 2009 was greater than the contribution of the middle class. This result can be
made precise by formalizing the definition of this contribution. First, let the weighted
average of expenditure on services at time 𝑡 of class 𝑔 = 𝑔0 to be represented by:
𝐸𝑖,𝑡𝑔≡∑ 𝜇𝑡
𝑓 𝐸𝑖,𝑡
𝑓
𝑓|𝑔=𝑔0
(5)
Hence, it is straightforward that 𝐸𝑡𝑔≡ ∑ 𝐸𝑖,𝑡
𝑔𝑖 is the average of total expenditure
of class 𝑔27. In addition, by definition, it follows that the share of expenditure on
services of class 𝑔 is:
27 Additionally, the average of total expenditure in overall Brazilian society is 𝐸𝑡 ≡ ∑ 𝐸𝑡
𝑔𝑔 and 𝐸𝑖,𝑡 ≡
∑ 𝐸𝑖,𝑡𝑔
𝑔 is the average of expenditure on services in overall Brazilian society.
19
𝑆𝑖,𝑡𝑔≡𝐸𝑖,𝑡𝑔
E𝑡𝑔 (6)
where it is straightaway ensuing that 𝑆𝑖,𝑡 ≡ (𝐸𝑖,𝑡
𝐸𝑡) is the share of expenditure on services
in overall Brazilian society.
Thus, the contribution of class 𝑔 to the growth of total expenditure on services
between 𝑡 and 𝑡 − 1 is simply:
𝑀𝑖,𝑡𝑔= 𝐸𝑖,𝑡
𝑔− 𝐸𝑖,𝑡−1
𝑔
𝐸𝑡𝑔− 𝐸𝑡−1
𝑔 (7)
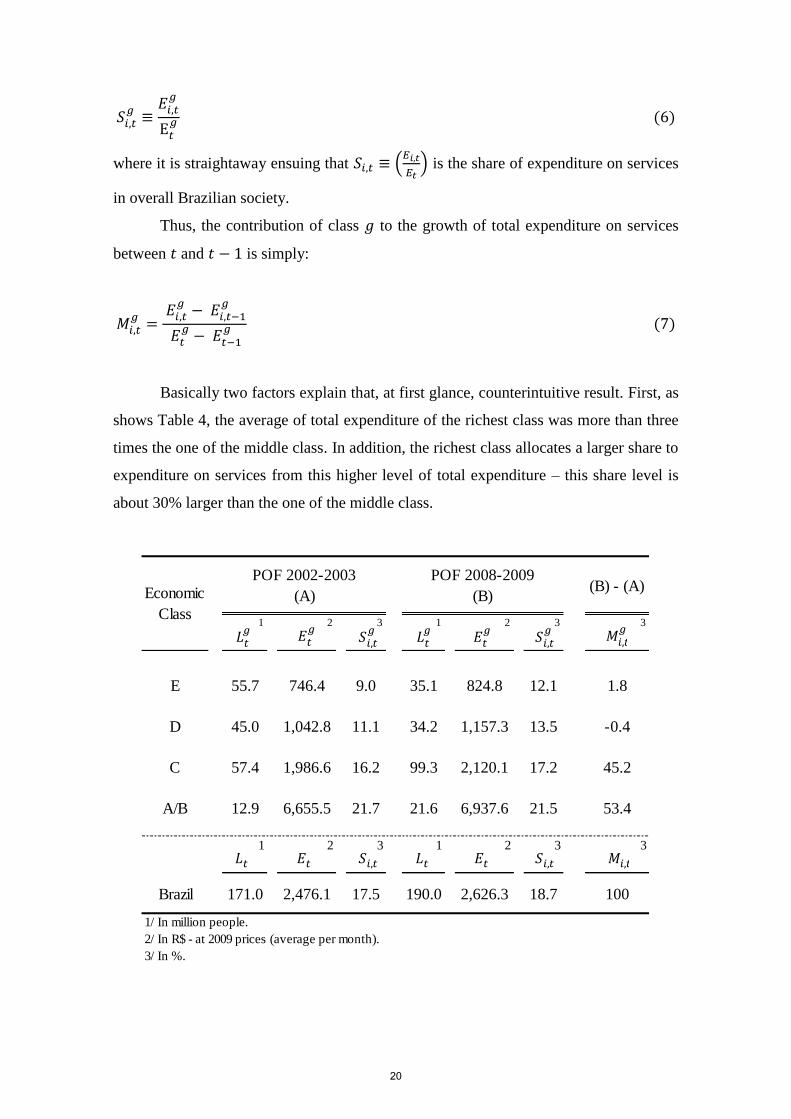
Basically two factors explain that, at first glance, counterintuitive result. First, as
shows Table 4, the average of total expenditure of the richest class was more than three
times the one of the middle class. In addition, the richest class allocates a larger share to
expenditure on services from this higher level of total expenditure – this share level is
about 30% larger than the one of the middle class.
(B) - (A)
1 2 3 1 2 3 3
E 55.7 746.4 9.0 35.1 824.8 12.1 1.8
D 45.0 1,042.8 11.1 34.2 1,157.3 13.5 -0.4
C 57.4 1,986.6 16.2 99.3 2,120.1 17.2 45.2
A/B 12.9 6,655.5 21.7 21.6 6,937.6 21.5 53.4
1 2 3 1 2 3 3
Brazil 171.0 2,476.1 17.5 190.0 2,626.3 18.7 100
1/ In million people.
2/ In R$ - at 2009 prices (average per month).
3/ In %.
Economic
Class
POF 2002-2003
(A)
POF 2008-2009
(B)
𝐿𝑡𝑔 𝐸𝑡
𝑔𝑆𝑖,𝑡𝑔
𝐿𝑡𝑔
𝑆𝑖,𝑡𝑔 𝑀𝑖,𝑡
𝑔𝐸𝑡𝑔
𝐿𝑡 𝐸𝑡 𝑆𝑖,𝑡 𝐿𝑡 𝐸𝑡 𝑆𝑖,𝑡 𝑀𝑖,𝑡
20
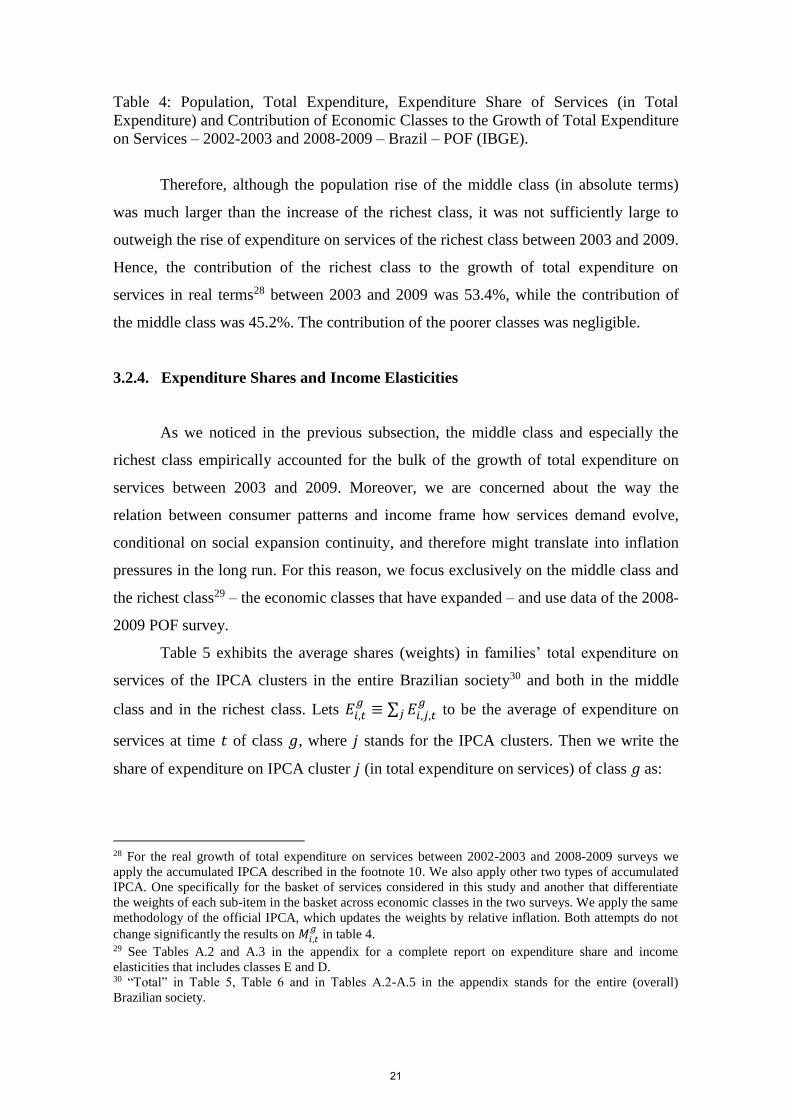
Table 4: Population, Total Expenditure, Expenditure Share of Services (in Total
Expenditure) and Contribution of Economic Classes to the Growth of Total Expenditure
on Services – 2002-2003 and 2008-2009 – Brazil – POF (IBGE).
Therefore, although the population rise of the middle class (in absolute terms)
was much larger than the increase of the richest class, it was not sufficiently large to
outweigh the rise of expenditure on services of the richest class between 2003 and 2009.
Hence, the contribution of the richest class to the growth of total expenditure on
services in real terms28 between 2003 and 2009 was 53.4%, while the contribution of
the middle class was 45.2%. The contribution of the poorer classes was negligible.
3.2.4. Expenditure Shares and Income Elasticities
As we noticed in the previous subsection, the middle class and especially the
richest class empirically accounted for the bulk of the growth of total expenditure on
services between 2003 and 2009. Moreover, we are concerned about the way the
relation between consumer patterns and income frame how services demand evolve,
conditional on social expansion continuity, and therefore might translate into inflation
pressures in the long run. For this reason, we focus exclusively on the middle class and
the richest class29 – the economic classes that have expanded – and use data of the 2008-
2009 POF survey.
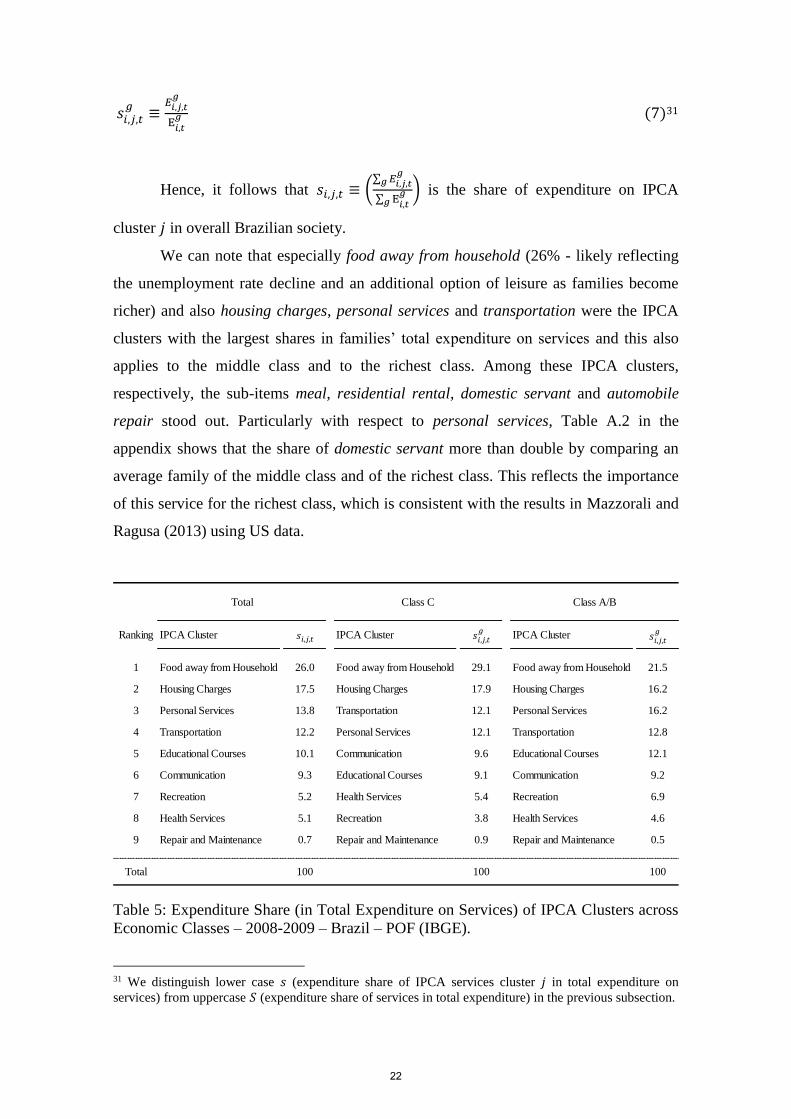
Table 5 exhibits the average shares (weights) in families’ total expenditure on
services of the IPCA clusters in the entire Brazilian society30 and both in the middle
class and in the richest class. Lets 𝐸𝑖,𝑡𝑔≡ ∑ 𝐸𝑖,𝑗,𝑡
𝑔𝑗 to be the average of expenditure on
services at time 𝑡 of class 𝑔, where 𝑗 stands for the IPCA clusters. Then we write the
share of expenditure on IPCA cluster 𝑗 (in total expenditure on services) of class 𝑔 as:
28 For the real growth of total expenditure on services between 2002-2003 and 2008-2009 surveys we
apply the accumulated IPCA described in the footnote 10. We also apply other two types of accumulated
IPCA. One specifically for the basket of services considered in this study and another that differentiate
the weights of each sub-item in the basket across economic classes in the two surveys. We apply the same
methodology of the official IPCA, which updates the weights by relative inflation. Both attempts do not
change significantly the results on 𝑀𝑖,𝑡𝑔
in table 4. 29 See Tables A.2 and A.3 in the appendix for a complete report on expenditure share and income
elasticities that includes classes E and D. 30 “Total” in Table 5, Table 6 and in Tables A.2-A.5 in the appendix stands for the entire (overall)
Brazilian society.
21
𝑠𝑖,𝑗,𝑡𝑔
≡𝐸𝑖,𝑗,𝑡𝑔
E𝑖,𝑡𝑔 (7)31
Hence, it follows that 𝑠𝑖,𝑗,𝑡 ≡ (∑ 𝐸𝑖,𝑗,𝑡
𝑔𝑔
∑ E𝑖,𝑡𝑔
𝑔) is the share of expenditure on IPCA
cluster 𝑗 in overall Brazilian society.
We can note that especially food away from household (26% - likely reflecting
the unemployment rate decline and an additional option of leisure as families become
richer) and also housing charges, personal services and transportation were the IPCA
clusters with the largest shares in families’ total expenditure on services and this also
applies to the middle class and to the richest class. Among these IPCA clusters,
respectively, the sub-items meal, residential rental, domestic servant and automobile
repair stood out. Particularly with respect to personal services, Table A.2 in the
appendix shows that the share of domestic servant more than double by comparing an
average family of the middle class and of the richest class. This reflects the importance
of this service for the richest class, which is consistent with the results in Mazzorali and
Ragusa (2013) using US data.
Table 5: Expenditure Share (in Total Expenditure on Services) of IPCA Clusters across
Economic Classes – 2008-2009 – Brazil – POF (IBGE).
31 We distinguish lower case 𝑠 (expenditure share of IPCA services cluster 𝑗 in total expenditure on
services) from uppercase 𝑆 (expenditure share of services in total expenditure) in the previous subsection.
Ranking IPCA Cluster IPCA Cluster IPCA Cluster
1 Food away from Household 26.0 Food away from Household 29.1 Food away from Household 21.5
2 Housing Charges 17.5 Housing Charges 17.9 Housing Charges 16.2
3 Personal Services 13.8 Transportation 12.1 Personal Services 16.2
4 Transportation 12.2 Personal Services 12.1 Transportation 12.8
5 Educational Courses 10.1 Communication 9.6 Educational Courses 12.1
6 Communication 9.3 Educational Courses 9.1 Communication 9.2
7 Recreation 5.2 Health Services 5.4 Recreation 6.9
8 Health Services 5.1 Recreation 3.8 Health Services 4.6
9 Repair and Maintenance 0.7 Repair and Maintenance 0.9 Repair and Maintenance 0.5
Class A/BTotal Class C
Total 100 100 100
𝑠𝑖,𝑗,𝑡𝑔
𝑠𝑖,𝑗,𝑡 𝑠𝑖,𝑗,𝑡𝑔
22
Table 5 also shows, as expected, that especially the expenditure-share on food
away from household, but also expenditure-shares on repair and maintenance, housing
charges and health services decrease with income (across economic classes), which is
consistent with the income elasticity report that follows.
To this respect, we document income elasticities computed at the average share
of services (in total expenditure) in Brazil as a whole and in the middle and the richest
classes. Thus, the income elasticity of services at time 𝑡 of class 𝑔 follows in the context
of the cubic model estimated in equation 3. However, Θ𝑘,𝑡 are evaluated at the weighted
average of per capita household income from all sources by class 𝑔32:
Η𝑖,𝑡𝑔=
1
𝑆𝑖,𝑡𝑔 (∑Θ𝑘,𝑡
3
𝑘=1
𝑘(ln 𝑤𝑡𝑔)𝑘−1
) + 1 (8)33
Furthermore, in subsection 3.2.2 we assume that utility is weakly separable
across services and goods. In particular, the category of services consumed by families
is weakly separable from the other goods. That is, the definition of the share of each
IPCA cluster and also of each sub-item is related to total expenditure on services, as we
also point out in the beginning of this subsection. Thus, similarly to the Engel curve
estimated in equation 3, we regress the share of each IPCA cluster on the weighted
average of per capita household income from all sources by percentile 𝑐.
𝑠𝑖,𝑗,𝑡𝑐 =∑θ𝑗,𝑘,𝑡(ln 𝑤𝑡
𝑐)𝑘 + 𝜀𝑡
3
𝑘=0
(9)
where θ𝑗,𝑘>0,𝑡 are the coefficients on the polynomial logarithmic terms in 𝑤𝑡𝑐 in the
estimation of each IPCA cluster 𝑗.
Thus, in the context of the model estimated in equation 9, we define the income
elasticities of the IPCA cluster 𝑗 computed at the average shares of class 𝑔 as follows:
32 Instead of being evaluated at percentile 𝑐. 33 It immediately follows that Η𝑖,𝑡 ≡
1
S𝑖,𝑡(∑ Θ𝑘,𝑡𝑘(ln 𝑤𝑡
𝑐)𝑘−13𝑘=1 ) + 1 is the income elasticity of services
in the entire Brazilian society.
23
𝜂𝑖,𝑗,𝑡𝑔
=1
𝑠𝑖,𝑗,𝑡𝑔 (∑𝜃𝑗,𝑘,𝑡
3
𝑘=1
𝑘(ln 𝑤𝑡𝑔)𝑘−1
) + 1 (10)34
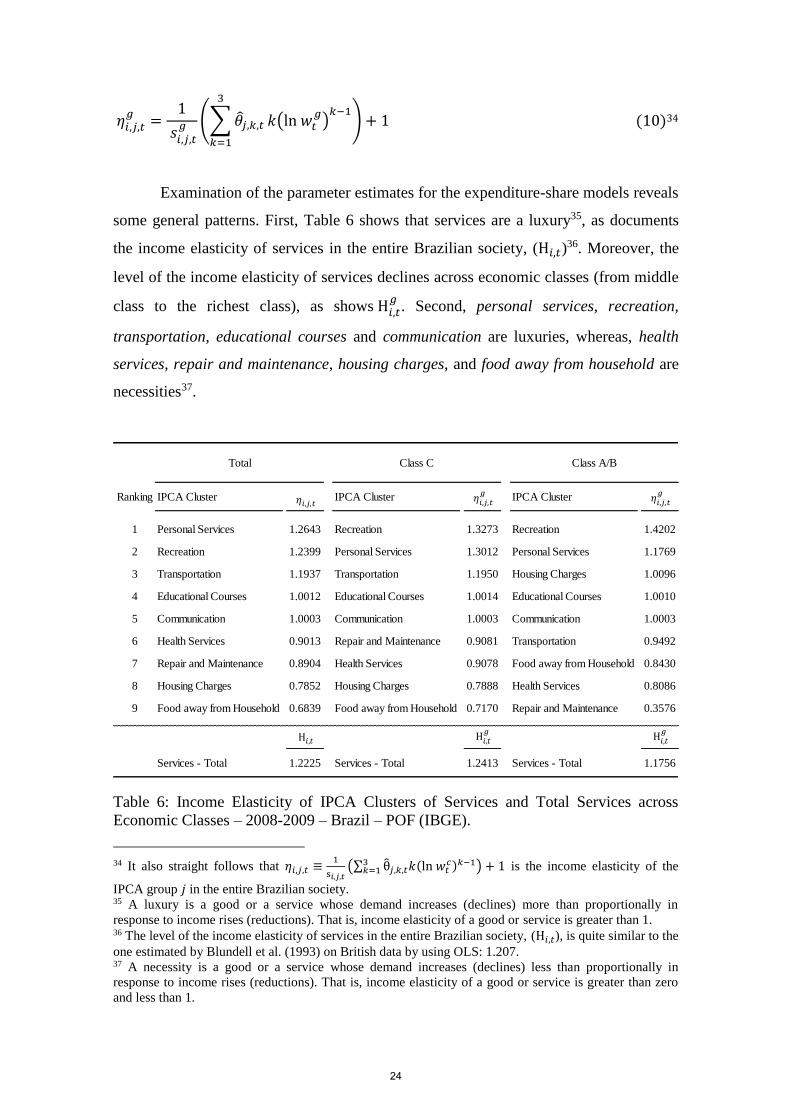
Examination of the parameter estimates for the expenditure-share models reveals
some general patterns. First, Table 6 shows that services are a luxury35, as documents
the income elasticity of services in the entire Brazilian society, (Η𝑖,𝑡)36. Moreover, the
level of the income elasticity of services declines across economic classes (from middle
class to the richest class), as shows Η𝑖,𝑡𝑔
. Second, personal services, recreation,
transportation, educational courses and communication are luxuries, whereas, health
services, repair and maintenance, housing charges, and food away from household are
necessities37.
Table 6: Income Elasticity of IPCA Clusters of Services and Total Services across
Economic Classes – 2008-2009 – Brazil – POF (IBGE).
34 It also straight follows that 𝜂𝑖,𝑗,𝑡 ≡
1
s𝑖,𝑗,𝑡(∑ θ𝑗,𝑘,𝑡𝑘(ln 𝑤𝑡
𝑐)𝑘−13𝑘=1 ) + 1 is the income elasticity of the
IPCA group 𝑗 in the entire Brazilian society. 35 A luxury is a good or a service whose demand increases (declines) more than proportionally in
response to income rises (reductions). That is, income elasticity of a good or service is greater than 1. 36 The level of the income elasticity of services in the entire Brazilian society, (Η𝑖,𝑡), is quite similar to the
one estimated by Blundell et al. (1993) on British data by using OLS: 1.207. 37 A necessity is a good or a service whose demand increases (declines) less than proportionally in
response to income rises (reductions). That is, income elasticity of a good or service is greater than zero
and less than 1.
Ranking IPCA Cluster IPCA Cluster IPCA Cluster
1 Personal Services 1.2643 Recreation 1.3273 Recreation 1.4202
2 Recreation 1.2399 Personal Services 1.3012 Personal Services 1.1769
3 Transportation 1.1937 Transportation 1.1950 Housing Charges 1.0096
4 Educational Courses 1.0012 Educational Courses 1.0014 Educational Courses 1.0010
5 Communication 1.0003 Communication 1.0003 Communication 1.0003
6 Health Services 0.9013 Repair and Maintenance 0.9081 Transportation 0.9492
7 Repair and Maintenance 0.8904 Health Services 0.9078 Food away from Household 0.8430
8 Housing Charges 0.7852 Housing Charges 0.7888 Health Services 0.8086
9 Food away from Household 0.6839 Food away from Household 0.7170 Repair and Maintenance 0.3576
Services - Total 1.2225 Services - Total 1.2413 Services - Total 1.1756
Class A/BTotal Class C
Η𝑖,𝑡 Η𝑖,𝑡𝑔
Η𝑖,𝑡𝑔
𝜂𝑖,𝑗,𝑡𝑔
𝜂𝑖,𝑗,𝑡𝑔
𝜂𝑖,𝑗,𝑡
24
Therefore, personal services and transportation not only stood out as shares in
households’ total expenditure on services, but they were also one of the most income
elastic IPCA clusters that were computed at the average share of services in the overall
Brazilian society. Particularly in the case of transportation, an interesting result is the
income elasticity reversal that reflects changes in the perception of need at different
income levels. That is, transportation is perceived to be a luxury for the middle class
and a necessity for the richest class. As Table A.3 in the appendix reports, while all sub-
items that comprise transportation are luxuries for the middle class, many of them are
necessities for the richest class38.
With respect to personal services, it is the most income elastic IPCA cluster in
the overall Brazilian society and the second largest among both the middle class and the
richest class. However, aggregate analysis might obliterate genuine changes in the
perception of need at the sub-item level. Table A.3 also shows that, for example,
whereas the sub-item banking services, which is one of the components of personal
services, is perceived to be a necessity for the richest class, it is a luxury for the middle
class.
4. Conclusion
This paper investigates the structural relation between patterns of services
consumption and income. We focus on how patterns of services consumption adjust to
different levels of income by using the perspective of social expansion as a narrative
approach for the Brazilian case in the last decade.
We present evidence of nonlinearity in the relation between services
consumption and income by using data of the last two versions (2002-2003 and 2008-
2009) of the POF-IBGE.
The social expansion has been generally spread as primarily a middle class
expansion. However, in the specific case of consumption of services, this argument is
not accurate. We argue that, on the one hand, the middle class has a larger extensive
margin of consumption as this class grew by about 42 million and reached almost 100
38 However, note that for example, airfare is the sub-item that exhibits the largest income elasticity
among all 66 sub-items in the richest class.
25
million people – approximately five fold the growth and the level of the richest class (in
absolute terms). One the other hand, the richest class has the largest intensive margin of
consumption since this class has the greatest share of expenditure on services (in total
expenditure).
Interestingly, although the population rise of the middle class was remarkably
larger than the increase of the richest class, total expenditure and its share on services of
the richest class was sufficiently large for this class to outweigh the middle class in
accounting for the rise of families’ total expenditure on services in this period.
Thus, a policy implication arises from this conclusion. First, consider Baumol
(1967), which argues that in most of the services rendered to families there are only
sporadic increases in productivity due to its technologically lagging structure that imply
cumulative increases in the real costs incurred in supplying them. Second, conceive a
hypothesis that Brazil is able to keep in a developing path that combines economic
growth and social expansion. That is, both the middle class and the richest class – the
economic classes that have expanded and whose expenditure shares on services are
relatively larger – are able to expand further. Thus, unless there are systematic increases
in productivity especially in activities that are allowed by its technologically progressive
structure (usually in the tradable sector) so that it can offset this secular trend of cost
increases in non-tradable activities; demand for services rendered to families is likely to
be a source of persistent consumer inflation pressures.
Note that this is not to be mistaken as an unconditional prediction. Instead, we
first consider the technologically lagging structure of the services sector and the relation
between patterns of services consumption and income. Then, conditional on a similar
pattern of social expansion that Brazil experienced in the past decade, which combines
not only expansion of the middle class but also expansion of the richest class, we argue
that demand for services is likely to be a source of persistent pressures on consumer
inflation. This suggest that, if Brazil becomes largely a middle class country, the
sources of services demand pressures will not be completely solved while there are
families ascending to the richest class. Therefore, systematic increases in productivity
especially from the tradable sector are indeed necessary in order to offset the secular
trend of cost increases in the services sector.
The results additionally suggest that, other things being equal, the continuity of
social expansion will imply demand pressures stemming especially from personal
26
services and transportation since consumption of these IPCA clusters has the particular
feature of combining both a high share of total services consumption and a high
sensitivity to income rises of households in overall Brazilian society in the period.
Although the results are consistent with the literature, it is worth mentioning that
they should be considered with caution due to data limitation and its initial approach to
household’s demand in the country. We have left as an extension an exhaustive
exploration of the way that household characteristics interact with income and demand
patterns. The only characteristic we consider is the size of the family. Household
characteristics may enter in popular forms of Engel Curves and demand systems in a
variety of different ways. The exact specification of which is primarily an empirical
issue. For example, consumption of a specific sub-item can be better identified whether
the head of family works in the formal job market or whether there are children in the
family.
Another issue relates to the occurrence of zero expenditures in the POF records.
For the commodity groups we consider, these will most likely correspond to purchase
infrequency. The problem of infrequent expenditures has its major effect on some sub-
item in the poorest economic classes. It means that the theoretical concept of
“consumption” differs from its measured counterpart “expenditure”. As this discrepancy
affects both the dependent variable and the income variable, ordinary least-squares
(OLS) estimates of the share equations are biased and then we decide not to report
income elasticities of some sub-items in Table A.5 in the appendix when this applies.
However, instrumental-variable (IV) estimation (or more generally generalized method
of moments [GMM] once heteroscedasticity is allowed for) permitting all terms in
income to be endogenous removes this measurement error problem.
27
References
AUTOR, D.; DORN, D. 2013. “The Growth of Low-Skill Service Jobs and the
Polarization of the US Labor Market”. American Economic Review, 103(5), pp. 1553-
1597.
BANCO CENTRAL DO BRASIL. 2011a. “A Dinâmica dos Preços de Serviços: Uma
Análise da Experiência Recente”. Quarterly Inflation Report, Banco Central do Brasil,
March. (in Portuguese)
BANCO CENTRAL DO BRASIL. 2011b. “Pressões de Demanda e de Custos sobre os
Preços de Serviços no IPCA”. Quarterly Inflation Report, Banco Central do Brasil,
June. (in Portuguese)
BANCO CENTRAL DO BRASIL. 2011c. “Atualizações das Estruturas de Ponderação
do IPCA e do INPC e das Classificações do IPCA”. Quarterly Inflation Report, Banco
Central do Brasil, December. (in Portuguese)
BANCO CENTRAL DO BRASIL. 2013. “Segmentação da Inflação de Serviços”.
Quarterly Inflation Report, Banco Central do Brasil, Deccember. (in Portuguese)
BARBOSA FILHO, F. H.; PESSOA, S. A. 2011. “Uma Analise da Reducao da Taxa de
Desemprego”. Anais do Encontro Nacional de Economia da Anpec. (in Portuguese)
BAUMOL, W. J. 1967. “Macroeconomics of Unbalanced Growth: The Anatomy of
Urban Crisis”. American Economic Review, 57(3), pp. 415-426.
BLUNDELL, R.; WALKER, I. 1986. “A LifeCycle Consistent Empirical Model of
Family Labour Supply Using Cross-Section Data,”. Review of Economic Studies, 53,
pp. 539-58.
BLUNDELL, R.; PASHARDES, P.; WEBER, G. 1993. “What do we learn about
consumer demand patterns from micro data?”. American Economic Review, 83(3), pp.
570-597.
BONELLI, R. 2010. “Strengthening long-term growth in Brazil”. Texto para discussão
N. 8. Rio de Janeiro: IBRE.
BRUNELLI, A. Q. 2014. “Two Decades of Structural Shifts in the Brazilian Labor
Market: Assessing the Unemployment Rate Changes Through Stylized Facts on Labor
Supply and Labor Demand”. Working paper N. 348. Brasília: Banco Central do Brasil.
CLARK, C. 1951. “The Conditions of Economic Progress”. London: Macmillan.
DEATON, A. S.; MUELLBAUER, J. 1980. “An Almost Ideal Demand System”.
American Economic Review, 70, pp. 312-26.
EGGLESTON, K.; FUCHS, V.R. 2012. “The New Demographic Transition: Most
Gains in LifeExpectancy Now Realized Late in Life”. Asia Health Policy Program,
Working paper 29,Walter H. Shorenstein Asia-Pacific Research Center.
LEE, R.; MASON, A. 2010. “Fertility, Human Capital, and Economic Growth over the
Demographic Transition”. Eur J Population, 26, pp. 159-182.
LUSTING, N.; LOPEZ-CALVA, L. F.; ORTIZ-JUAREZ, E. 2013. “Declining
inequality in Latin America in the 2000s: the cases of Argentina, Brazil, and Mexico”.
World Development, n. 44, pp. 129-141.
28
MAZZOLARI, F.; GIUSEPPE, R. 2013. “Spillovers from High-Skill Consumption to
Low-Skill Labor Markets”. Review of Economics and Statistics, 95(1), pp. 74-86.
NERI, M.C. “The Middle Class in Brazil: the Bright Side of the Poor”. FGV, 2010.
PAES DE BARROS, R.; CURY, S.; ULYSSEA, G. 2007. “A Desigualdade de Renda
Encontra-se Subestimada? Uma análise Comparativa com Base na PNAD, na POF e nas
Contas Nacionais”. IPEA, Texto para Discussão N. 1263. (in Portuguese)
PAULI, R.C; NAKABASHI, L.; SAMPAIO, A.V. 2012. “Mudanca estrutural e
mercado de trabalho no Brasil”. Revista de Economia Política 32(3), pp. 459-478. (in
Portuguese)
SANTOS, C. H. M. 2014. “Uma Nota sobre a Natureza da Inflacao de Servicos no
Brasil (1999-2014)”. Nota Técnica. Carta de Conjuntura N. 24. Rio de Janeiro: IPEA.
(in Portuguese)
29
Appendix
Appendix A: Distribution of POF Services within IPCA Sub-items
Figure A.1: Distribution of POF Services within IPCA Sub-items in the Basket of
Services Inflation that Follows BCB Classification in 2012 – IBGE
Sub-item
code
(IPCA)
Sub-item (IPCA) Service Code (POF 2002-2003) Service Code (POF 2008-2009)
1201001 Meal24001, 24041, 24042, 24055, 24051, 24052, 41006,
48044, 49026
24001, 24035, 24036, 24038, 24040, 24054, 24055,
24056, 24057, 24058, 24113, 41006, 48033, 49026
1201003 Snack24037, 24053, 24004, 24007, 24015, 24018, 24050,
24022, 24047, 24048, 24028, 24029, 24049
24041, 24059, 24004, 24007, 24015, 24018, 24019,
24020, 24022, 24026, 24027, 24028, 24029, 24030
1201005 Breakfast 24056, 24003, 24002 24042, 24003, 24016, 24034
1201007 Soda and Mineral Water 24006, 24059, 24044, 24046, 24045, 24060
24006, 24017, 24023, 24025, 24050, 24051, 24052,
24053, 24089, 24090, 24091, 24092, 24129, 24130,
24131, 24132, 24133, 24134, 24135, 24139
1201009 Coffee 24005 24005, 24064
1201048 Beer 24010, 24012 24010, 24012, 24136, 24137
1201051 Other Alcoholic Beverages 24009, 24011 24009, 24011, 24046,24047, 24048, 24049, 24067,
1201061 Candies 24008 24008, 24043,24044, 24045
2101001 Residential Rental 10005, 10010, 10016, 10018 10001, 10003, 10006, 10008
2101002 Condo Fee 10012, 10019 10004, 10009
2101012 Services of Domicile Change 12004, 47013 12004, 47023
2103042 Workmanship 8013 08013
3301002 Refrigerator Repair 09022 09030, 09033
3301006 T.V Repair 09025 09036, 09039
3301009 Stereo Repair 09028 09042, 09045
3301015 Washer Machine Repair 09034 09054
3301022 Upholster Reform 9001 09001
5101010 Airfare 23031, 41003 23022, 41003
5101026 School Transportation 49009 49009
5102005 Voluntary Vehicule Insurance 50006 50006
5102011 Automobile Repair23019, 43002, 43003, 43004, 43007, 43011, 43013,
43019, 43027, 43029, 43035, 43012, 43006
23019, 43002, 43003, 43004, 43007, 43011, 43012,
43013, 43019, 43027, 43029, 43035, 43040, 43042
5102013 Parking Fee 23008, 41009, 50007 23008, 41009, 47027, 50007
5102019 Grasing and Washing 43001 43001
5102037 Vehicule Paint 43005, 43008, 43017 43005, 43008, 43017
5102051 Car Rental 41010, 50008 41010, 50008
6201002 Medical Treatment42038, 42039, 42040, 42041,42042, 42043,42044,
42045,42046, 42047, 42048, 42049, 42050, 4203042009, 42010, 42011, 42012
6201003 Dentist 42003, 42004 42023, 42024
6201007 Physiotherapist 42052 42031
6201010 Psychologist 42051 42030
6202003 Laboratory Examination 42008 42013
6202004 Hospitalization and Surgery 42005, 42006 42005, 42006
6202006 Imaging Examination 42007, 42009, 42021 42014, 42015, 42016, 42018, 42019, 42017, 42043,
7101001 Seamstress 31017 31017
7101005 Manicure 31003 31003
7101009 Hairdresser 31001, 31002, 31043, 31044, 31048 31001, 31002, 31042, 31043, 31047
7101010 Domestic Servant 19001, 19002, 19003 19001, 19002, 19003
7101014 Hair Removal 31008 31008
7101036 Dispatcher 44003 44003
7101076 Banking Service44051, 44052, 44053, 44054, 44055, 44056, 44057,
44058, 44059, 44060, 44062
44022, 44023, 44024,44025, 44026, 44027, 44028,
44029, 44030, 44031, 44032, 44036, 44033, 44038,
44042, 44047
7101090 Class Council 48001 48001
7201001 Cinema 28001, 28018, 28036 28001, 41026
7201003 Match Tickets 28003, 28004 28003, 28004, 41033
7201006 Club 28005 28005
7201018 Pet Treatment 16040, 19027 16018, 16019, 16024, 16025, 16026, 16027
7201052 Movie (DVD) Rental 13017, 28026 13017, 28026
7201054 Nightclub and Disco 28020 28020
7201068 Motel 28025 28025
7201090 Hotel 28050, 41007 28050, 41007
7201095 Tour 41008, 41017, 49016 41008, 41017, 41040, 41041, 41042, 49016
7203003 Printing and Copy 28008 28008
8101001 Child Care Center 49011 49011
8101002 Nursery Education 49001 49001
8101003 Basic Education 49031 49031
8101004 High School 49032 49032
8101005 Higher Education 49033 49033
8101006 Postgraduate 49059, 49022, 49041 49015, 49022, 49041
8103002 Photocopy 32006 32006
8104001 Preparatory Course 49040 49076, 49088, 49089
8104002 Technical Course 49052 49075
8104003 Language Course 49044 49044
8104004 Computer Course 49039 49039
8104006 Physical Activities 49034, 49035, 49036, 49037, 4905849034, 49040, 49035, 49036, 49037, 49058, 49059,
49060, 49061, 49062, 49063, 49064
9101008 Cell Phone Charges 28055 28023, 28024
9101018 Internet Access 07016 06005
9101021 Cell Phone with Internet - Package - 06008, 06009
9101022 Pay TV with Internet - 06010
30
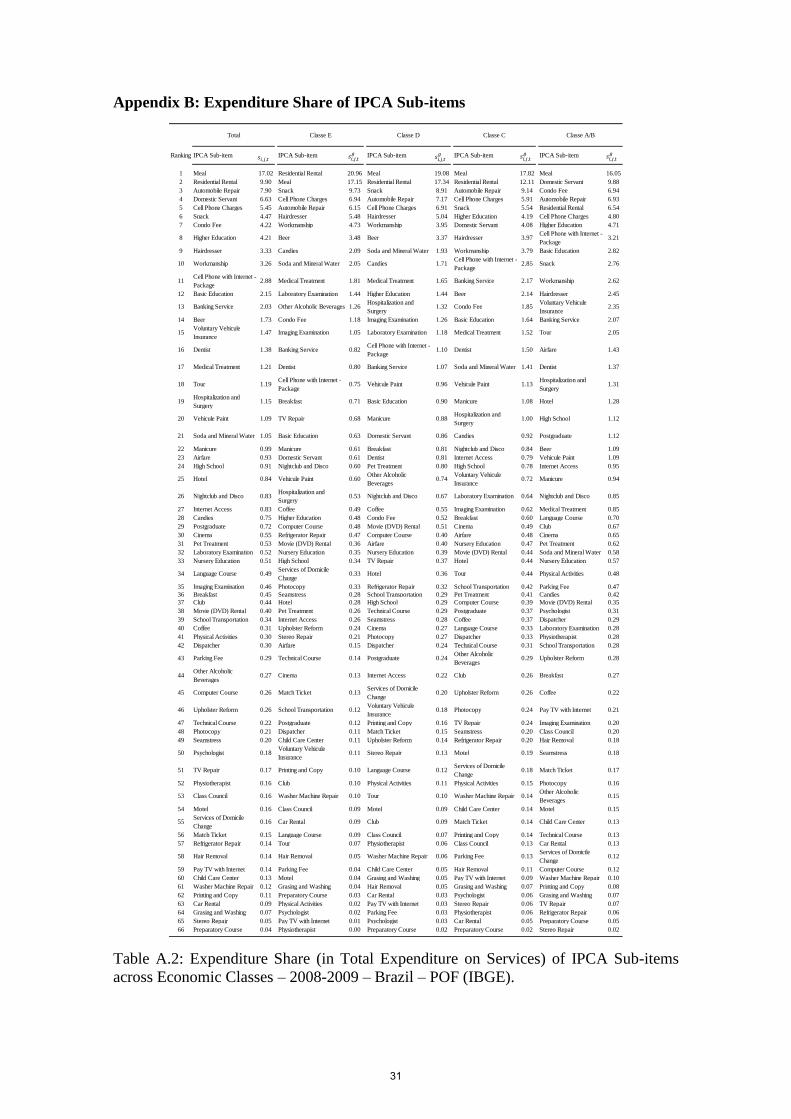
Appendix B: Expenditure Share of IPCA Sub-items
Table A.2: Expenditure Share (in Total Expenditure on Services) of IPCA Sub-items
across Economic Classes – 2008-2009 – Brazil – POF (IBGE).
Ranking IPCA Sub-item IPCA Sub-item IPCA Sub-item IPCA Sub-item IPCA Sub-item
1 Meal 17.02 Residential Rental 20.96 Meal 19.08 Meal 17.82 Meal 16.05
2 Residential Rental 9.90 Meal 17.15 Residential Rental 17.34 Residential Rental 12.11 Domestic Servant 9.88
3 Automobile Repair 7.90 Snack 9.73 Snack 8.91 Automobile Repair 9.14 Condo Fee 6.94
4 Domestic Servant 6.63 Cell Phone Charges 6.94 Automobile Repair 7.17 Cell Phone Charges 5.91 Automobile Repair 6.93
5 Cell Phone Charges 5.45 Automobile Repair 6.15 Cell Phone Charges 6.91 Snack 5.54 Residential Rental 6.54
6 Snack 4.47 Hairdresser 5.48 Hairdresser 5.04 Higher Education 4.19 Cell Phone Charges 4.80
7 Condo Fee 4.22 Workmanship 4.73 Workmanship 3.95 Domestic Servant 4.08 Higher Education 4.71
8 Higher Education 4.21 Beer 3.48 Beer 3.37 Hairdresser 3.97Cell Phone with Internet -
Package3.21
9 Hairdresser 3.33 Candies 2.09 Soda and Mineral Water 1.93 Workmanship 3.79 Basic Education 2.82
10 Workmanship 3.26 Soda and Mineral Water 2.05 Candies 1.71Cell Phone with Internet -
Package2.85 Snack 2.76
11Cell Phone with Internet -
Package2.88 Medical Treatment 1.81 Medical Treatment 1.65 Banking Service 2.17 Workmanship 2.62
12 Basic Education 2.15 Laboratory Examination 1.44 Higher Education 1.44 Beer 2.14 Hairdresser 2.45
13 Banking Service 2.03 Other Alcoholic Beverages 1.26Hospitalization and
Surgery1.32 Condo Fee 1.85
Voluntary Vehicule
Insurance2.35
14 Beer 1.73 Condo Fee 1.18 Imaging Examination 1.26 Basic Education 1.64 Banking Service 2.07
15Voluntary Vehicule
Insurance1.47 Imaging Examination 1.05 Laboratory Examination 1.18 Medical Treatment 1.52 Tour 2.05
16 Dentist 1.38 Banking Service 0.82Cell Phone with Internet -
Package1.10 Dentist 1.50 Airfare 1.43
17 Medical Treatment 1.21 Dentist 0.80 Banking Service 1.07 Soda and Mineral Water 1.41 Dentist 1.37
18 Tour 1.19Cell Phone with Internet -
Package0.75 Vehicule Paint 0.96 Vehicule Paint 1.13
Hospitalization and
Surgery1.31
19Hospitalization and
Surgery1.15 Breakfast 0.71 Basic Education 0.90 Manicure 1.08 Hotel 1.28
20 Vehicule Paint 1.09 TV Repair 0.68 Manicure 0.88Hospitalization and
Surgery1.00 High School 1.12
21 Soda and Mineral Water 1.05 Basic Education 0.63 Domestic Servant 0.86 Candies 0.92 Postgraduate 1.12
22 Manicure 0.99 Manicure 0.61 Breakfast 0.81 Nightclub and Disco 0.84 Beer 1.09
23 Airfare 0.93 Domestic Servant 0.61 Dentist 0.81 Internet Access 0.79 Vehicule Paint 1.09
24 High School 0.91 Nightclub and Disco 0.60 Pet Treatment 0.80 High School 0.78 Internet Access 0.95
25 Hotel 0.84 Vehicule Paint 0.60Other Alcoholic
Beverages0.74
Voluntary Vehicule
Insurance0.72 Manicure 0.94
26 Nightclub and Disco 0.83Hospitalization and
Surgery0.53 Nightclub and Disco 0.67 Laboratory Examination 0.64 Nightclub and Disco 0.85
27 Internet Access 0.83 Coffee 0.49 Coffee 0.55 Imaging Examination 0.62 Medical Treatment 0.85
28 Candies 0.75 Higher Education 0.48 Condo Fee 0.52 Breakfast 0.60 Language Course 0.70
29 Postgraduate 0.72 Computer Course 0.48 Movie (DVD) Rental 0.51 Cinema 0.49 Club 0.67
30 Cinema 0.55 Refrigerator Repair 0.47 Computer Course 0.40 Airfare 0.48 Cinema 0.65
31 Pet Treatment 0.53 Movie (DVD) Rental 0.36 Airfare 0.40 Nursery Education 0.47 Pet Treatment 0.62
32 Laboratory Examination 0.52 Nursery Education 0.35 Nursery Education 0.39 Movie (DVD) Rental 0.44 Soda and Mineral Water 0.58
33 Nursery Education 0.51 High School 0.34 TV Repair 0.37 Hotel 0.44 Nursery Education 0.57
34 Language Course 0.49Services of Domicile
Change0.33 Hotel 0.36 Tour 0.44 Physical Activities 0.48
35 Imaging Examination 0.46 Photocopy 0.33 Refrigerator Repair 0.32 School Transportation 0.42 Parking Fee 0.47
36 Breakfast 0.45 Seamstress 0.28 School Transportation 0.29 Pet Treatment 0.41 Candies 0.42
37 Club 0.44 Hotel 0.28 High School 0.29 Computer Course 0.39 Movie (DVD) Rental 0.35
38 Movie (DVD) Rental 0.40 Pet Treatment 0.26 Technical Course 0.29 Postgraduate 0.37 Psychologist 0.31
39 School Transportation 0.34 Internet Access 0.26 Seamstress 0.28 Coffee 0.37 Dispatcher 0.29
40 Coffee 0.31 Upholster Reform 0.24 Cinema 0.27 Language Course 0.33 Laboratory Examination 0.28
41 Physical Activities 0.30 Stereo Repair 0.21 Photocopy 0.27 Dispatcher 0.33 Physiotherapist 0.28
42 Dispatcher 0.30 Airfare 0.15 Dispatcher 0.24 Technical Course 0.31 School Transportation 0.28
43 Parking Fee 0.29 Technical Course 0.14 Postgraduate 0.24Other Alcoholic
Beverages0.29 Upholster Reform 0.28
44Other Alcoholic
Beverages0.27 Cinema 0.13 Internet Access 0.22 Club 0.26 Breakfast 0.27
45 Computer Course 0.26 Match Ticket 0.13Services of Domicile
Change0.20 Upholster Reform 0.26 Coffee 0.22
46 Upholster Reform 0.26 School Transportation 0.12Voluntary Vehicule
Insurance0.18 Photocopy 0.24 Pay TV with Internet 0.21
47 Technical Course 0.22 Postgraduate 0.12 Printing and Copy 0.16 TV Repair 0.24 Imaging Examination 0.20
48 Photocopy 0.21 Dispatcher 0.11 Match Ticket 0.15 Seamstress 0.20 Class Council 0.20
49 Seamstress 0.20 Child Care Center 0.11 Upholster Reform 0.14 Refrigerator Repair 0.20 Hair Removal 0.18
50 Psychologist 0.18Voluntary Vehicule
Insurance0.11 Stereo Repair 0.13 Motel 0.19 Seamstress 0.18
51 TV Repair 0.17 Printing and Copy 0.10 Language Course 0.12Services of Domicile
Change0.18 Match Ticket 0.17
52 Physiotherapist 0.16 Club 0.10 Physical Activities 0.11 Physical Activities 0.15 Photocopy 0.16
53 Class Council 0.16 Washer Machine Repair 0.10 Tour 0.10 Washer Machine Repair 0.14Other Alcoholic
Beverages0.15
54 Motel 0.16 Class Council 0.09 Motel 0.09 Child Care Center 0.14 Motel 0.15
55Services of Domicile
Change0.16 Car Rental 0.09 Club 0.09 Match Ticket 0.14 Child Care Center 0.13
56 Match Ticket 0.15 Language Course 0.09 Class Council 0.07 Printing and Copy 0.14 Technical Course 0.13
57 Refrigerator Repair 0.14 Tour 0.07 Physiotherapist 0.06 Class Council 0.13 Car Rental 0.13
58 Hair Removal 0.14 Hair Removal 0.05 Washer Machine Repair 0.06 Parking Fee 0.13Services of Domicile
Change0.12
59 Pay TV with Internet 0.14 Parking Fee 0.04 Child Care Center 0.05 Hair Removal 0.11 Computer Course 0.12
60 Child Care Center 0.13 Motel 0.04 Grasing and Washing 0.05 Pay TV with Internet 0.09 Washer Machine Repair 0.10
61 Washer Machine Repair 0.12 Grasing and Washing 0.04 Hair Removal 0.05 Grasing and Washing 0.07 Printing and Copy 0.08
62 Printing and Copy 0.11 Preparatory Course 0.03 Car Rental 0.03 Psychologist 0.06 Grasing and Washing 0.07
63 Car Rental 0.09 Physical Activities 0.02 Pay TV with Internet 0.03 Stereo Repair 0.06 TV Repair 0.07
64 Grasing and Washing 0.07 Psychologist 0.02 Parking Fee 0.03 Physiotherapist 0.06 Refrigerator Repair 0.06
65 Stereo Repair 0.05 Pay TV with Internet 0.01 Psychologist 0.03 Car Rental 0.05 Preparatory Course 0.05
66 Preparatory Course 0.04 Physiotherapist 0.00 Preparatory Course 0.02 Preparatory Course 0.02 Stereo Repair 0.02
Classe A/BTotal Classe E Classe D Classe C
𝑠𝑖,𝑗,𝑡 𝑠𝑖,𝑗,𝑡𝑔
𝑠𝑖,𝑗,𝑡𝑔 𝑠𝑖,𝑗,𝑡
𝑔 𝑠𝑖,𝑗,𝑡𝑔
31
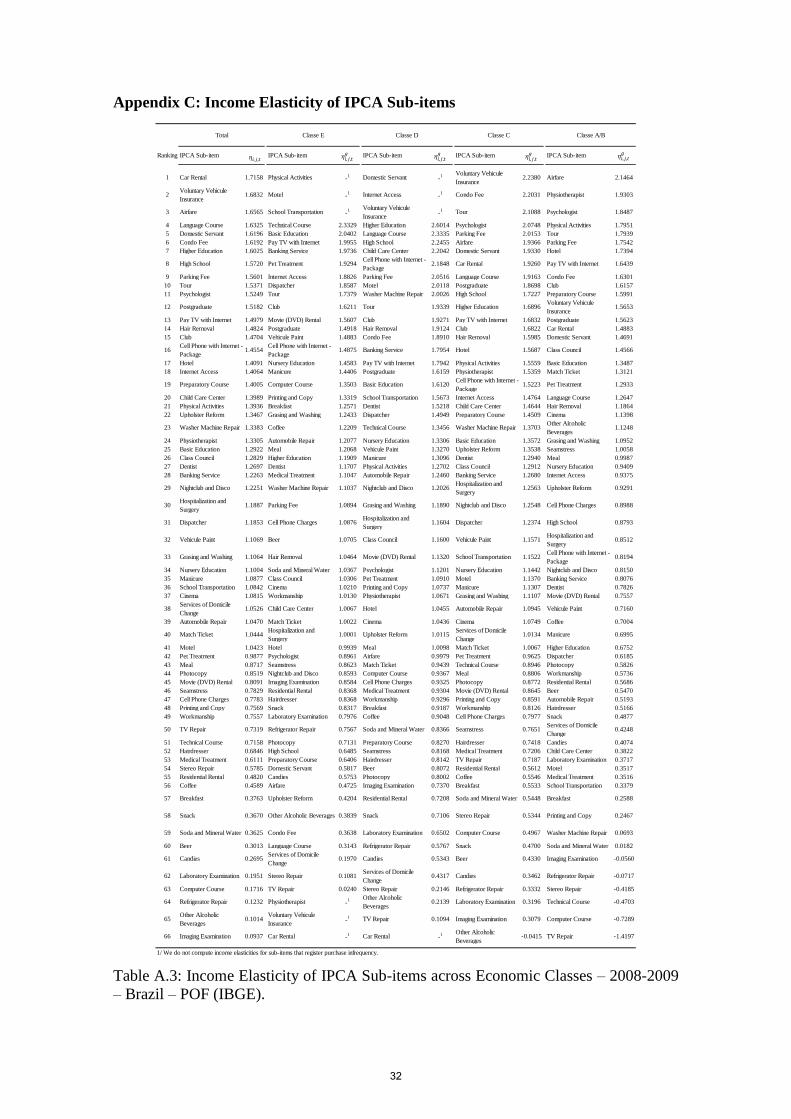
Appendix C: Income Elasticity of IPCA Sub-items
Table A.3: Income Elasticity of IPCA Sub-items across Economic Classes – 2008-2009
– Brazil – POF (IBGE).
Ranking IPCA Sub-item IPCA Sub-item IPCA Sub-item IPCA Sub-item IPCA Sub-item
1 Car Rental 1.7158 Physical Activities -1 Domestic Servant -
1 Voluntary Vehicule
Insurance2.2380 Airfare 2.1464
2Voluntary Vehicule
Insurance1.6832 Motel -
1 Internet Access -1 Condo Fee 2.2031 Physiotherapist 1.9303
3 Airfare 1.6565 School Transportation -1 Voluntary Vehicule
Insurance-
1 Tour 2.1088 Psychologist 1.8487
4 Language Course 1.6325 Technical Course 2.3329 Higher Education 2.6014 Psychologist 2.0748 Physical Activities 1.7951
5 Domestic Servant 1.6196 Basic Education 2.0402 Language Course 2.3335 Parking Fee 2.0153 Tour 1.7939
6 Condo Fee 1.6192 Pay TV with Internet 1.9955 High School 2.2455 Airfare 1.9366 Parking Fee 1.7542
7 Higher Education 1.6025 Banking Service 1.9736 Child Care Center 2.2042 Domestic Servant 1.9330 Hotel 1.7394
8 High School 1.5720 Pet Treatment 1.9294Cell Phone with Internet -
Package2.1848 Car Rental 1.9260 Pay TV with Internet 1.6439
9 Parking Fee 1.5601 Internet Access 1.8826 Parking Fee 2.0516 Language Course 1.9163 Condo Fee 1.6301
10 Tour 1.5371 Dispatcher 1.8587 Motel 2.0118 Postgraduate 1.8698 Club 1.6157
11 Psychologist 1.5249 Tour 1.7379 Washer Machine Repair 2.0026 High School 1.7227 Preparatory Course 1.5991
12 Postgraduate 1.5182 Club 1.6211 Tour 1.9339 Higher Education 1.6896Voluntary Vehicule
Insurance1.5653
13 Pay TV with Internet 1.4979 Movie (DVD) Rental 1.5607 Club 1.9271 Pay TV with Internet 1.6832 Postgraduate 1.5623
14 Hair Removal 1.4824 Postgraduate 1.4918 Hair Removal 1.9124 Club 1.6822 Car Rental 1.4883
15 Club 1.4704 Vehicule Paint 1.4883 Condo Fee 1.8910 Hair Removal 1.5985 Domestic Servant 1.4691
16Cell Phone with Internet -
Package1.4554
Cell Phone with Internet -
Package1.4875 Banking Service 1.7954 Hotel 1.5687 Class Council 1.4566
17 Hotel 1.4091 Nursery Education 1.4583 Pay TV with Internet 1.7942 Physical Activities 1.5559 Basic Education 1.3487
18 Internet Access 1.4064 Manicure 1.4406 Postgraduate 1.6159 Physiotherapist 1.5359 Match Ticket 1.3121
19 Preparatory Course 1.4005 Computer Course 1.3503 Basic Education 1.6120Cell Phone with Internet -
Package1.5223 Pet Treatment 1.2933
20 Child Care Center 1.3989 Printing and Copy 1.3319 School Transportation 1.5673 Internet Access 1.4764 Language Course 1.2647
21 Physical Activities 1.3936 Breakfast 1.2571 Dentist 1.5218 Child Care Center 1.4644 Hair Removal 1.1864
22 Upholster Reform 1.3467 Grasing and Washing 1.2433 Dispatcher 1.4949 Preparatory Course 1.4509 Cinema 1.1398
23 Washer Machine Repair 1.3383 Coffee 1.2209 Technical Course 1.3456 Washer Machine Repair 1.3703Other Alcoholic
Beverages1.1248
24 Physiotherapist 1.3305 Automobile Repair 1.2077 Nursery Education 1.3306 Basic Education 1.3572 Grasing and Washing 1.0952
25 Basic Education 1.2922 Meal 1.2068 Vehicule Paint 1.3270 Upholster Reform 1.3538 Seamstress 1.0058
26 Class Council 1.2829 Higher Education 1.1909 Manicure 1.3096 Dentist 1.2940 Meal 0.9987
27 Dentist 1.2697 Dentist 1.1707 Physical Activities 1.2702 Class Council 1.2912 Nursery Education 0.9409
28 Banking Service 1.2263 Medical Treatment 1.1047 Automobile Repair 1.2460 Banking Service 1.2680 Internet Access 0.9375
29 Nightclub and Disco 1.2251 Washer Machine Repair 1.1037 Nightclub and Disco 1.2026Hospitalization and
Surgery1.2563 Upholster Reform 0.9291
30Hospitalization and
Surgery1.1887 Parking Fee 1.0894 Grasing and Washing 1.1890 Nightclub and Disco 1.2548 Cell Phone Charges 0.8988
31 Dispatcher 1.1853 Cell Phone Charges 1.0876Hospitalization and
Surgery1.1604 Dispatcher 1.2374 High School 0.8793
32 Vehicule Paint 1.1069 Beer 1.0705 Class Council 1.1600 Vehicule Paint 1.1571Hospitalization and
Surgery0.8512
33 Grasing and Washing 1.1064 Hair Removal 1.0464 Movie (DVD) Rental 1.1320 School Transportation 1.1522Cell Phone with Internet -
Package0.8194
34 Nursery Education 1.1004 Soda and Mineral Water 1.0367 Psychologist 1.1201 Nursery Education 1.1442 Nightclub and Disco 0.8150
35 Manicure 1.0877 Class Council 1.0306 Pet Treatment 1.0910 Motel 1.1370 Banking Service 0.8076
36 School Transportation 1.0842 Cinema 1.0210 Printing and Copy 1.0737 Manicure 1.1307 Dentist 0.7826
37 Cinema 1.0815 Workmanship 1.0130 Physiotherapist 1.0671 Grasing and Washing 1.1107 Movie (DVD) Rental 0.7557
38Services of Domicile
Change1.0526 Child Care Center 1.0067 Hotel 1.0455 Automobile Repair 1.0945 Vehicule Paint 0.7160
39 Automobile Repair 1.0470 Match Ticket 1.0022 Cinema 1.0436 Cinema 1.0749 Coffee 0.7004
40 Match Ticket 1.0444Hospitalization and
Surgery1.0001 Upholster Reform 1.0115
Services of Domicile
Change1.0134 Manicure 0.6995
41 Motel 1.0423 Hotel 0.9939 Meal 1.0098 Match Ticket 1.0067 Higher Education 0.6752
42 Pet Treatment 0.9877 Psychologist 0.8961 Airfare 0.9979 Pet Treatment 0.9625 Dispatcher 0.6185
43 Meal 0.8717 Seamstress 0.8623 Match Ticket 0.9439 Technical Course 0.8946 Photocopy 0.5826
44 Photocopy 0.8519 Nightclub and Disco 0.8593 Computer Course 0.9367 Meal 0.8806 Workmanship 0.5736
45 Movie (DVD) Rental 0.8091 Imaging Examination 0.8584 Cell Phone Charges 0.9325 Photocopy 0.8772 Residential Rental 0.5686
46 Seamstress 0.7829 Residential Rental 0.8368 Medical Treatment 0.9304 Movie (DVD) Rental 0.8645 Beer 0.5470
47 Cell Phone Charges 0.7783 Hairdresser 0.8368 Workmanship 0.9296 Printing and Copy 0.8591 Automobile Repair 0.5193
48 Printing and Copy 0.7569 Snack 0.8317 Breakfast 0.9187 Workmanship 0.8126 Hairdresser 0.5166
49 Workmanship 0.7557 Laboratory Examination 0.7976 Coffee 0.9048 Cell Phone Charges 0.7977 Snack 0.4877
50 TV Repair 0.7319 Refrigerator Repair 0.7567 Soda and Mineral Water 0.8366 Seamstress 0.7651Services of Domicile
Change0.4248
51 Technical Course 0.7158 Photocopy 0.7131 Preparatory Course 0.8270 Hairdresser 0.7418 Candies 0.4074
52 Hairdresser 0.6846 High School 0.6485 Seamstress 0.8168 Medical Treatment 0.7206 Child Care Center 0.3822
53 Medical Treatment 0.6111 Preparatory Course 0.6406 Hairdresser 0.8142 TV Repair 0.7187 Laboratory Examination 0.3717
54 Stereo Repair 0.5785 Domestic Servant 0.5817 Beer 0.8072 Residential Rental 0.5612 Motel 0.3517
55 Residential Rental 0.4820 Candies 0.5753 Photocopy 0.8002 Coffee 0.5546 Medical Treatment 0.3516
56 Coffee 0.4589 Airfare 0.4725 Imaging Examination 0.7370 Breakfast 0.5533 School Transportation 0.3379
57 Breakfast 0.3763 Upholster Reform 0.4204 Residential Rental 0.7208 Soda and Mineral Water 0.5448 Breakfast 0.2588
58 Snack 0.3670 Other Alcoholic Beverages 0.3839 Snack 0.7106 Stereo Repair 0.5344 Printing and Copy 0.2467
59 Soda and Mineral Water 0.3625 Condo Fee 0.3638 Laboratory Examination 0.6502 Computer Course 0.4967 Washer Machine Repair 0.0693
60 Beer 0.3013 Language Course 0.3143 Refrigerator Repair 0.5767 Snack 0.4700 Soda and Mineral Water 0.0182
61 Candies 0.2695Services of Domicile
Change0.1970 Candies 0.5343 Beer 0.4330 Imaging Examination -0.0560
62 Laboratory Examination 0.1951 Stereo Repair 0.1081Services of Domicile
Change0.4317 Candies 0.3462 Refrigerator Repair -0.0717
63 Computer Course 0.1716 TV Repair 0.0240 Stereo Repair 0.2146 Refrigerator Repair 0.3332 Stereo Repair -0.4185
64 Refrigerator Repair 0.1232 Physiotherapist -1 Other Alcoholic
Beverages0.2139 Laboratory Examination 0.3196 Technical Course -0.4703
65Other Alcoholic
Beverages0.1014
Voluntary Vehicule
Insurance-
1 TV Repair 0.1094 Imaging Examination 0.3079 Computer Course -0.7289
66 Imaging Examination 0.0937 Car Rental -1 Car Rental -
1 Other Alcoholic
Beverages-0.0415 TV Repair -1.4197
1/ We do not compute income elasticities for sub-items that register purchase infrequency.
Classe A/BTotal Classe E Classe D Classe C
𝜂𝑖,𝑗,𝑡 𝜂𝑖,𝑗,𝑡𝑔
𝜂𝑖,𝑗,𝑡𝑔
𝜂𝑖,𝑗,𝑡𝑔 𝜂𝑖,𝑗,𝑡
𝑔
32
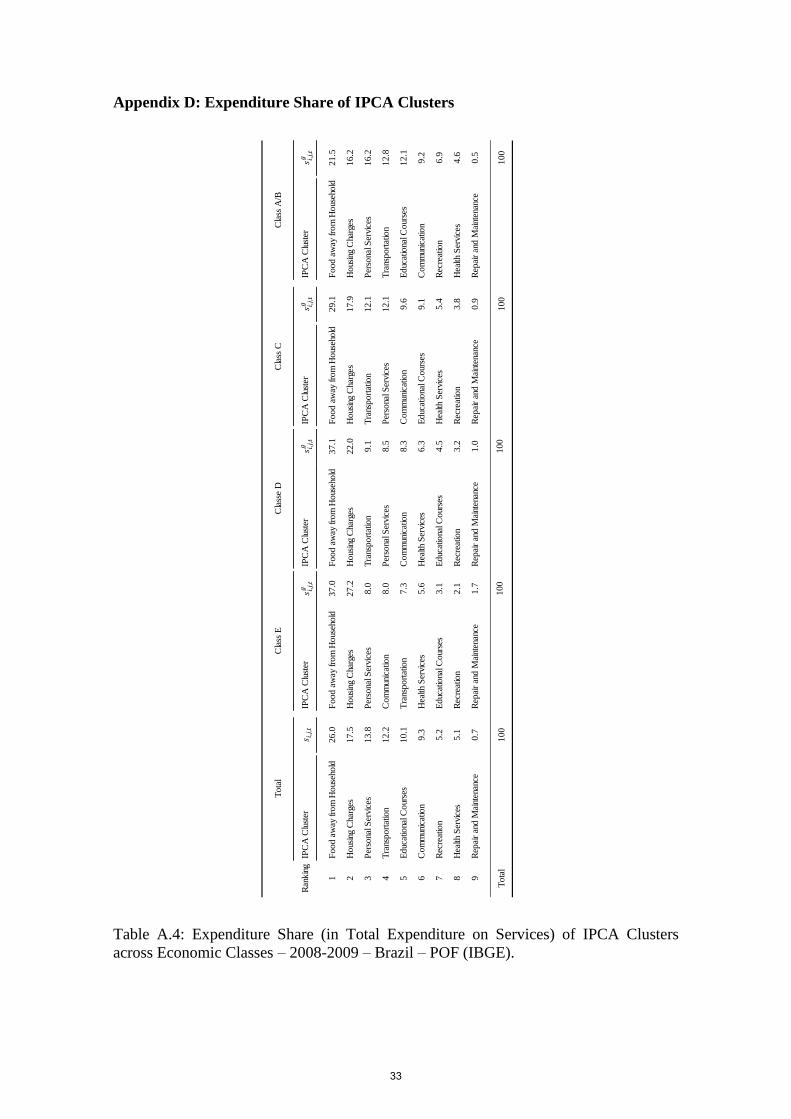
Appendix D: Expenditure Share of IPCA Clusters
Table A.4: Expenditure Share (in Total Expenditure on Services) of IPCA Clusters
across Economic Classes – 2008-2009 – Brazil – POF (IBGE).
Ran
kin
gIP
CA
Clu
ster
IPC
A C
lust
erIP
CA
Clu
ster
IPC
A C
lust
erIP
CA
Clu
ster
1F
oo
d a
way
fro
m H
ous
eho
ld26.0
Fo
od a
way
fro
m H
ous
eho
ld37.0
Fo
od a
way
fro
m H
ous
eho
ld37.1
Fo
od a
way
fro
m H
ous
eho
ld29.1
Fo
od a
way
fro
m H
ous
eho
ld21.5
2H
ous
ing
Cha
rges
17.5
Ho
usin
g C
harg
es27.2
Ho
usin
g C
harg
es22.0
Ho
usin
g C
harg
es17.9
Ho
usin
g C
harg
es16.2
3P
erso
nal S
ervi
ces
13.8
Per
sona
l Ser
vice
s8.0
Tra
nsp
ort
atio
n9.1
Tra
nsp
ort
atio
n12.1
Per
sona
l Ser
vice
s16.2
4T
rans
po
rtat
ion
12.2
Co
mm
unic
atio
n8.0
Per
sona
l Ser
vice
s8.5
Per
sona
l Ser
vice
s12.1
Tra
nsp
ort
atio
n12.8
5E
duc
atio
nal C
our
ses
10.1
Tra
nsp
ort
atio
n7.3
Co
mm
unic
atio
n8.3
Co
mm
unic
atio
n9.6
Ed
ucat
iona
l Co
urse
s12.1
6C
om
mun
icat
ion
9.3
Hea
lth S
ervi
ces
5.6
Hea
lth S
ervi
ces
6.3
Ed
ucat
iona
l Co
urse
s9.1
Co
mm
unic
atio
n9.2
7R
ecre
atio
n5.2
Ed
ucat
iona
l Co
urse
s3.1
Ed
ucat
iona
l Co
urse
s4.5
Hea
lth S
ervi
ces
5.4
Rec
reat
ion
6.9
8H
ealth
Ser
vice
s5.1
Rec
reat
ion
2.1
Rec
reat
ion
3.2
Rec
reat
ion
3.8
Hea
lth S
ervi
ces
4.6
9R
epai
r an
d M
aint
enan
ce0.7
Rep
air
and
Mai
nten
ance
1.7
Rep
air
and
Mai
nten
ance
1.0
Rep
air
and
Mai
nten
ance
0.9
Rep
air
and
Mai
nten
ance
0.5
100
100
Cla
ss A
/BT
ota
lC
lass
EC
lass
e D
Cla
ss C
To
tal
100
100
100
𝑠𝑖,𝑗,𝑡
𝑔 𝑠𝑖,𝑗,𝑡
𝑠𝑖,𝑗,𝑡
𝑔 𝑠𝑖,𝑗,𝑡
𝑔 𝑠𝑖,𝑗,𝑡
𝑔
33
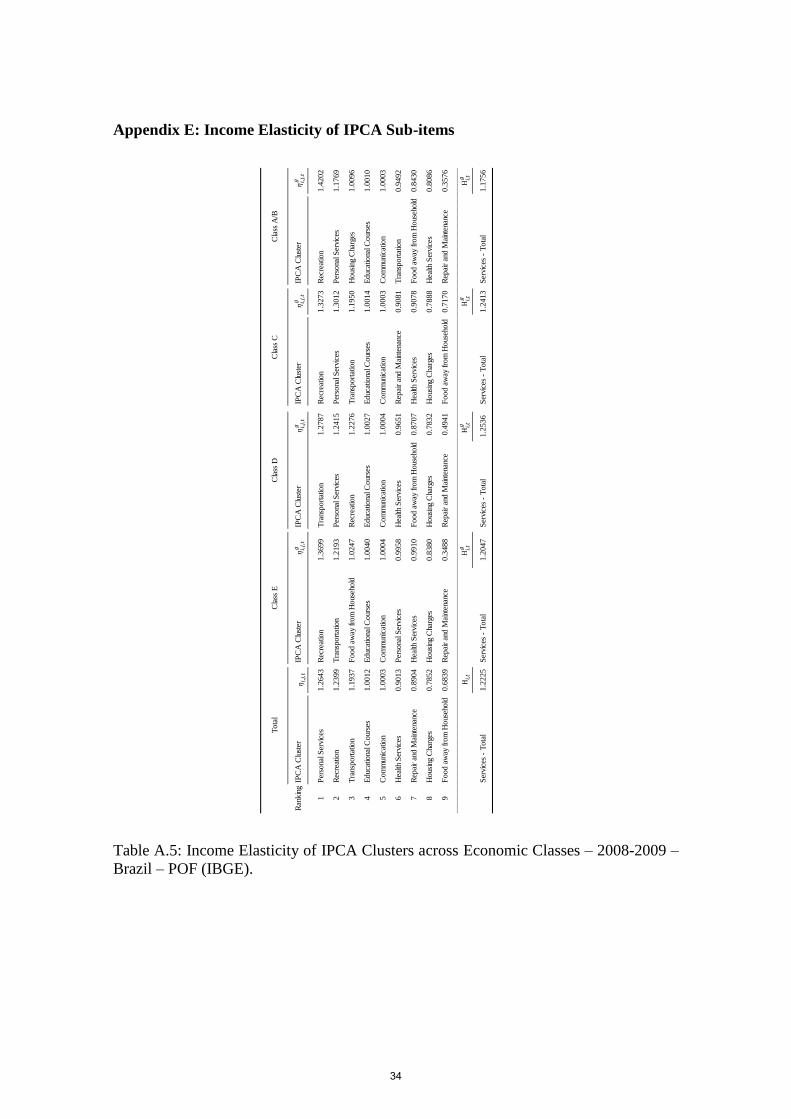
Appendix E: Income Elasticity of IPCA Sub-items
Table A.5: Income Elasticity of IPCA Clusters across Economic Classes – 2008-2009 –
Brazil – POF (IBGE).
Ran
kin
gIP
CA
Clu
ster
IPC
A C
lust
erIP
CA
Clu
ster
IPC
A C
lust
erIP
CA
Clu
ster
1P
erso
nal S
ervi
ces
1.2
643
Rec
reat
ion
1.3
699
Tra
nsport
atio
n1.2
787
Rec
reat
ion
1.3
273
Rec
reat
ion
1.4
202
2R
ecre
atio
n1.2
399
Tra
nsport
atio
n1.2
193
Per
sona
l Ser
vice
s1.2
415
Per
sona
l Ser
vice
s1.3
012
Per
sona
l Ser
vice
s1.1
769
3T
rans
port
atio
n1.1
937
Food a
way
fro
m H
ous
ehold
1.0
247
Rec
reat
ion
1.2
276
Tra
nsport
atio
n1.1
950
Hous
ing
Cha
rges
1.0
096
4E
duc
atio
nal C
our
ses
1.0
012
Educ
atio
nal C
our
ses
1.0
040
Educ
atio
nal C
our
ses
1.0
027
Educ
atio
nal C
our
ses
1.0
014
Educ
atio
nal C
our
ses
1.0
010
5C
om
mun
icat
ion
1.0
003
Com
mun
icat
ion
1.0
004
Com
mun
icat
ion
1.0
004
Com
mun
icat
ion
1.0
003
Com
mun
icat
ion
1.0
003
6H
ealth
Ser
vice
s0.9
013
Per
sona
l Ser
vice
s0.9
958
Hea
lth S
ervi
ces
0.9
651
Rep
air
and M
aint
enan
ce0.9
081
Tra
nsport
atio
n0.9
492
7R
epai
r an
d M
aint
enan
ce0.8
904
Hea
lth S
ervi
ces
0.9
910
Food a
way
fro
m H
ous
ehold
0.8
707
Hea
lth S
ervi
ces
0.9
078
Food a
way
fro
m H
ous
ehold
0.8
430
8H
ous
ing
Cha
rges
0.7
852
Hous
ing
Cha
rges
0.8
380
Hous
ing
Cha
rges
0.7
832
Hous
ing
Cha
rges
0.7
888
Hea
lth S
ervi
ces
0.8
086
9F
ood a
way
fro
m H
ous
ehold
0.6
839
Rep
air
and M
aint
enan
ce0.3
488
Rep
air
and M
aint
enan
ce0.4
941
Food a
way
fro
m H
ous
ehold
0.7
170
Rep
air
and M
aint
enan
ce0.3
576
Ser
vice
s -
Tota
l1.2
225
Ser
vice
s -
Tota
l1.2
047
Ser
vice
s -
Tota
l1.2
536
Ser
vice
s -
Tota
l1.2
413
Ser
vice
s -
Tota
l1.1
756
Cla
ss A
/BT
ota
lC
lass
EC
lass
DC
lass
C
Η𝑖,𝑡
Η𝑖,𝑡𝑔
Η𝑖,𝑡𝑔
𝜂𝑖,𝑗,𝑡
𝑔 𝜂𝑖,𝑗,𝑡
𝑔 𝜂𝑖,𝑗,𝑡
Η𝑖,𝑡𝑔
Η𝑖,𝑡𝑔
𝜂𝑖,𝑗,𝑡
𝑔 𝜂𝑖,𝑗,𝑡
𝑔
34


![services[.] ' rendered[.] 2 - Louisiana](https://img.pdfslide.net/doc/110x75/619ca06f89aa0a236c37a0c9/services-rendered-2-louisiana.jpg)