Embed Size (px)
Citation preview
Metabolic Exogenous Contrast Agents for use in Breast Cancer Detection and Therapy
Monitoring
by
Stacy Renee Chiles Millon
Department of Biomedical Engineering
Duke University
Date:_______________________
Approved:
___________________________
Nirmala Ramanujam, Supervisor
___________________________
Mark W. Dewhirst
___________________________
Victoria L. Seewaldt
___________________________
Gregg Trahey
___________________________
Tuan voDinh
Dissertation submitted in partial fulfillment of
the requirements for the degree of Doctor of Philosophy in the Department of
Biomedical Engineering in the Graduate School
of Duke University
2010
ABSTRACT
Metabolic Exogenous Contrast Agents for use in Breast Cancer Detection and Therapy
Monitoring
by
Stacy Renee Chiles Millon
Department of Biomedical University
Duke University
Date:_______________________
Approved:
___________________________
Nirmala Ramanujam, Supervisor
___________________________
Mark W. Dewhirst
___________________________
Victoria L. Seewaldt
___________________________
Gregg Trahey
___________________________
Tuan voDinh
An abstract of a dissertation submitted in partial
fulfillment of the requirements for the degree
of Doctor of Philosophy in the Department of
Biomedical Engineering in the Graduate School
of Duke University
2010

Copyright by
Stacy Renee Chiles Millon
2010
iv
Abstract
Functional imaging gives clinicians the ability to monitor breast cancer
progression and response to therapy. Modern techniques such as Positron Emission
Tomography (PET) has allowed for clinicians to visualize the metabolic need of breast
cancer and track it longitudinally. However, these techniques are expensive,
technologically complex and not easily implemented in rural areas. To add to the
difficulty, breast cancer is a highly heterogeneous disease. The heterogeneity means that
a single therapy is not always applicable to all patients and every patient requires an
individual treatment plan. Being able to first diagnose breast cancer, and then monitor
its response to therapy in a cost-effective manner is imperative to improve the survival
of patients with this disease.
Optical techniques such as fluorescence are ideal for these applications since they
can be fast and implemented with portable technology. These techniques use
differences in light interaction with tissue to allow for abnormality detection. This
dissertation tests the hypothesis that the fluorescent molecularly specific agents,
protoporphyrin IX (PpIX) and 2-NBDG, which utilize metabolic alterations caused by
cancer, can be used for ubiquitous breast cancer differentiation and therapy monitoring.
Confocal microscopy is used to demonstrate the applicability of both agents in vitro to
breast cancer cells regardless of phenotype.
v
First, 5-aminolevulinic acid (ALA) was incubated with cells causing an increased
cellular production of the heme prequel, protoporphyrin IX (PpIX). In cancer cells, the
production of PpIX is higher and allows for detection from normal after a 2 hour
incubation period. The PpIX was then detected via confocal microscopy and the change
in fluorescence intensity between ALA-induced PpIX and controls was measured. A
spectroscopy measurement is also completed on a second experimental set of cells to
demonstrate that collection of single spectra, post-ALA administration, can discriminate
breast cancer cells from normal mammary epithelium.
2-NBDG is a fluorescent glucose analogue that is follows the metabolic pathway
of glycolysis, similarly to D-glucose and fluorodeoxyglucose (FDG). Greater
accumulation of 2-NBDG can occur in as little as 20 minutes in cells with higher
glycolytic demand, which is commonly associated with cancer and hypoxic cells. The
shorter incubation period required for 2-NBDG makes it ideal for clinical use, and 2-
NBDG was therefore tested further.
2-NBDG uptake was used to detect changes in cellular glycolysis after anti-
cancer and endocrine therapy. The anti-cancer therapies, lonidamine and α-cyano-
hydroxycinnamate (α-Cinn), which increased and decreased glycolysis, respectively
were tested on a subset of breast cancer cells. Lonidamine directly inhibits the
metabolism of 2-NBDG and inhibited its uptake. α-Cinn stimulates glycolysis by
inhibiting the monocarboxylate transporter 1 preventing lactate from entering as a
vi
source for oxidative phosphorylation. 2-NBDG was concurrently increased after α-Cinn
treatment. Observation of changes in downstream glycolysis has been determined after
the estrogen receptor therapy, tamoxifen, in breast cancer cells. Sixty percent of all
breast cancers are estrogen receptor positive (ER+) and have the potential to respond.
Known ER+ cells, MCF7, and ER- cells, MDA-MB-435, were treated with tam. 2-NBDG
was used to determine therapeutic responders from non-responders by measureable
differences in fluorescence uptake.
Finally, the effect of hypoxia, low oxygenation, on 2-NBDG uptake is discussed.
The cellular response to hypoxia, known as the Pasteur Effect, causes an increase in
glycolysis. Hypoxia is shown in vitro to increase 2-NBDG uptake. Simulated, chronic
and cycling hypoxia were completed in vitro with subsequent increases in 2-NBDG as
well. Cycling hypoxia has been previously shown to have a greater impact on tumor
environment and was implemented in an in vivo murine dorsal window chamber
mammary carcinoma model. The uptake of 2-NBDG in tumor and normal tumor-free
tissue was tested and 2-NBDG discriminated normal from tumor in a normal oxygen
environment. An increase in 2-NBDG was demonstrated after cycling hypoxia in tumor
and normal tissue. However, by including hemoglobin saturation data, cycling hypoxic
tumor tissue can be discriminated from cycling hypoxic normal tissue and normoxic
tumor tissue. From these experiments, the applicability of 2-NBDG as a method to
monitor changes in glycolysis and its increased potential by including hemoglobin

vii
saturation measurements is demonstrated.

viii
Dedication
This work is dedicated to Bradley James Millon and my parents Ottis and Judy
Chiles.
ix
Contents
Abstract .........................................................................................................................................iv
List of Tables.............................................................................................................................. xiii
List of Figures .............................................................................................................................xiv
Acknowledgements ................................................................................................................. xvii
1. Introduction ............................................................................................................................... 1
1.1 Cost-effective pre-clinical functional imaging.............................................................. 1
1.2 Optical imaging of contrast agents ................................................................................ 2
1.3 Protoporphyrin IX ............................................................................................................ 6
1.4 Glycolysis and Breast Cancer.......................................................................................... 8
1.5 2-NBDG............................................................................................................................ 10
1.6 Good diagnostic tests ..................................................................................................... 12
1.7 Research Aims................................................................................................................. 13
2. Preferential accumulation of 5-aminolevulinic acid-induced protoporphyrin IX in
breast cancer: A comprehensive study on six breast cell lines with varying phenotypes 16
2.1 Introduction..................................................................................................................... 16
2.2 Materials and Methods .................................................................................................. 18
2.2.1 Cell Culture ................................................................................................................ 18
2.2.2 Confocal Microscope and Imaging Parameters ................................................... 19
2.2.3 Cell Imaging.............................................................................................................. 21
2.2.4 Analysis of integrated fluorescence intensity images ......................................... 22
2.2.5 Analysis of spectrally resolved fluorescence images .......................................... 23
x
2.2.6 Statistics ..................................................................................................................... 24
2.3 Results ............................................................................................................................. 24
2.3.1 Integrated fluorescence intensity images.............................................................. 24
2.3.2 Cellular Fluorescence Spectra.............................................................................. 26
2.3.3 Quantitative integrated fluorescence intensity measurements ......................... 28
2.3.4 Quantitative analysis of the fluorescence spectral data...................................... 29
2.4 Discussion........................................................................................................................ 31
3. Uptake of 2-NBDG as a method to monitor therapy response in breast cancer cell lines
....................................................................................................................................................... 36
3.1 Introduction..................................................................................................................... 36
3.2 Materials and Methods ................................................................................................. 38
3.2.1 Cell Culture ............................................................................................................... 38
3.2.2 Confocal microscopy parameters........................................................................... 38
3.2.3 Cell imaging studies................................................................................................. 39
3.2.4 2-NBDG uptake ........................................................................................................ 40
3.2.5 Anti-cancer and endocrine treatments .................................................................. 41
3.2.6 Data processing......................................................................................................... 42
3.2.7 Western blots............................................................................................................. 42
3.2.8 Statistics ..................................................................................................................... 43
3.3 Results ............................................................................................................................. 43
3.3.1 Western blot results .............................................................................................. 44
3.3.2 2-NBDG uptake in cells ........................................................................................... 45
xi
3.3.3 2-NBDG uptake after anti-cancer and endocrine treatments.............................. 48
3.4 DISCUSSION ................................................................................................................. 52
4. 2-NBDG uptake can be used to discriminate hypoxia in vivo in combination with
hemoglobin saturation ............................................................................................................... 57
4.1 Introduction..................................................................................................................... 57
4.2 Methods ........................................................................................................................... 61
4.2.1 In vitro chronic hypoxia experiment ....................................................................... 61
4.2.2 In vivo studies............................................................................................................. 63
4.2.3 Image analysis............................................................................................................ 67
4.2.4 Western blot ............................................................................................................... 68
4.2.5 Statistics ...................................................................................................................... 69
4.3 Results .............................................................................................................................. 70
4.3.1 2-NBDG uptake in vitro after simulated hypoxia ................................................. 70
4.3.2 Uptake of 2-NBDG in vivo .......................................................................................... 74
4.3.3 Application of 2-NBDG uptake in combination with local vascular
oxygenation......................................................................................................................... 80
4.4 Discussion........................................................................................................................ 83
5. Conclusions and Future Directions ...................................................................................... 89
5.1 Conclusions ..................................................................................................................... 89
5.2 Future Directions............................................................................................................ 93
5.2.1 2-NBDG cellular characterization ........................................................................... 94
5.2.2 2-NBDG for use in determining glycolytic kinetics.............................................. 95
5.2.3 Pre-clinical models of therapy................................................................................. 96
xii
5.2.4 Fiber based probe 2-NBDG detection..................................................................... 97
5.2.5 2-NBDG for use in pre-clinical margin assessment models ................................ 98
5.2.6 Ex vivo clinical samples............................................................................................ 99
Appendix A: Diagram of Steps in Glycolysis ....................................................................... 102
Appendix B: Preliminary results for ALA protocol development.................................... 103
B.1 Cellular expression of PpIX at differing ALA Concentrations.............................. 103
B.2 ALA kinetics in a subset of cells ................................................................................ 104
Appendix C: Preliminary results for 2-NBDG in vitro protocol ........................................ 106
C.1 Fluorescence intensity of 2-NBDG at different wavelengths ................................ 106
C.2 Comparison of different incubation times for 2-NBDG......................................... 107
C.3 Comparison of differing 2-NBDG concentrations in vitro .................................... 108
Appendix D: Evaluation of 2-NBDG for murine mammary cell line in vitro and in vivo
..................................................................................................................................................... 110
D.1 2-NBDG cellular decay in 4T1-RFP cells after 2-NBDG labeling.......................... 110
D.2 In vivo uptake of 2-NBDG at a concentration of 100 µg/mL in vivo.................... 111
References .................................................................................................................................. 113
Biography................................................................................................................................... 123

xiii
List of Tables
Table 1: Pros and cons of example molecular contrast agents [2]......................................... 6
Table 2: ALA Sample Size Definitions .................................................................................... 22
Table 3: Sample size definitions used in 2-NBDG cell treatment......................................... 40
Table 4: Summary of cell lines tested and ER, HER2 and PR receptor status ................... 44
xiv
List of Figures
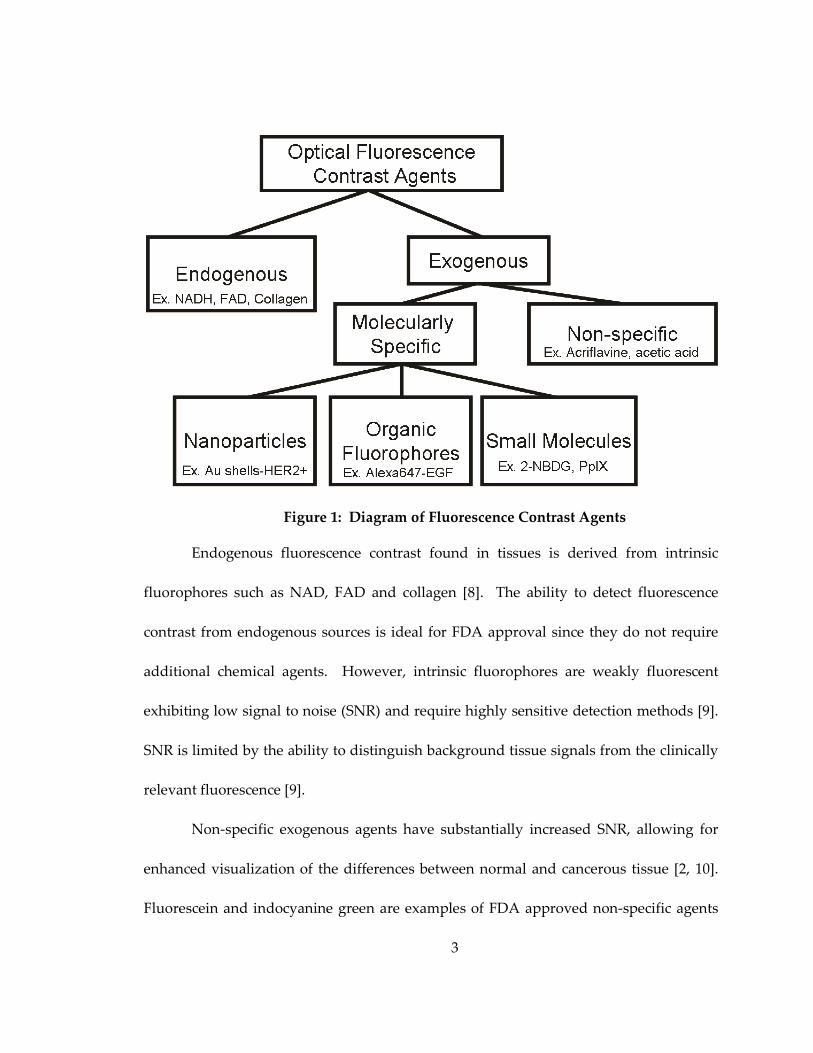
Figure 1: Diagram of Fluorescence Contrast Agents .............................................................. 3
Figure 2: Diagram of normal heme formation within the cell............................................... 7
Figure 3: General schematic of metabolic uptake and retention of NBDG........................ 11
Figure 4: Representative confocal integrated fluorescence intensity images (uncalibrated)
of normal mammary epithelial (Normal) and breast cancer (Cancer) cells treated with
ALA for 2 hours. Excitation was at 405 nm and emission was collected between 610-700
nm.................................................................................................................................................. 24
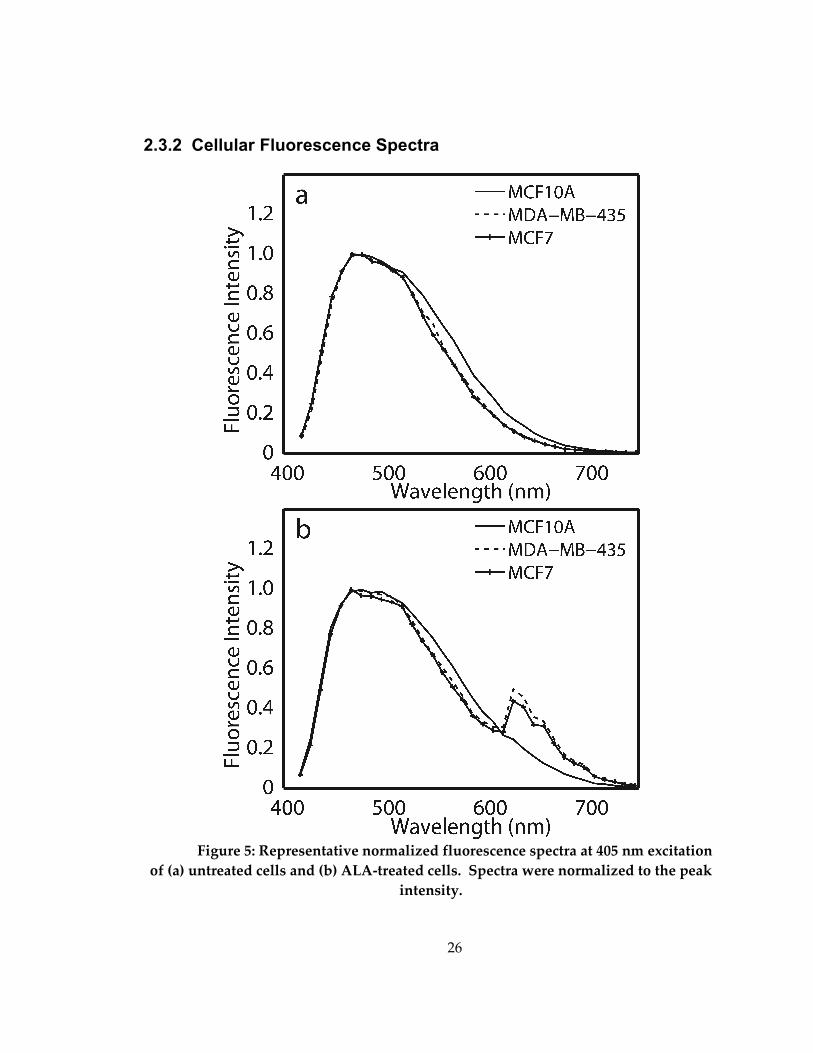
Figure 5: Representative normalized fluorescence spectra at 405 nm excitation of (a)
untreated cells and (b) ALA-treated cells. Spectra were normalized to the peak intensity.
....................................................................................................................................................... 26
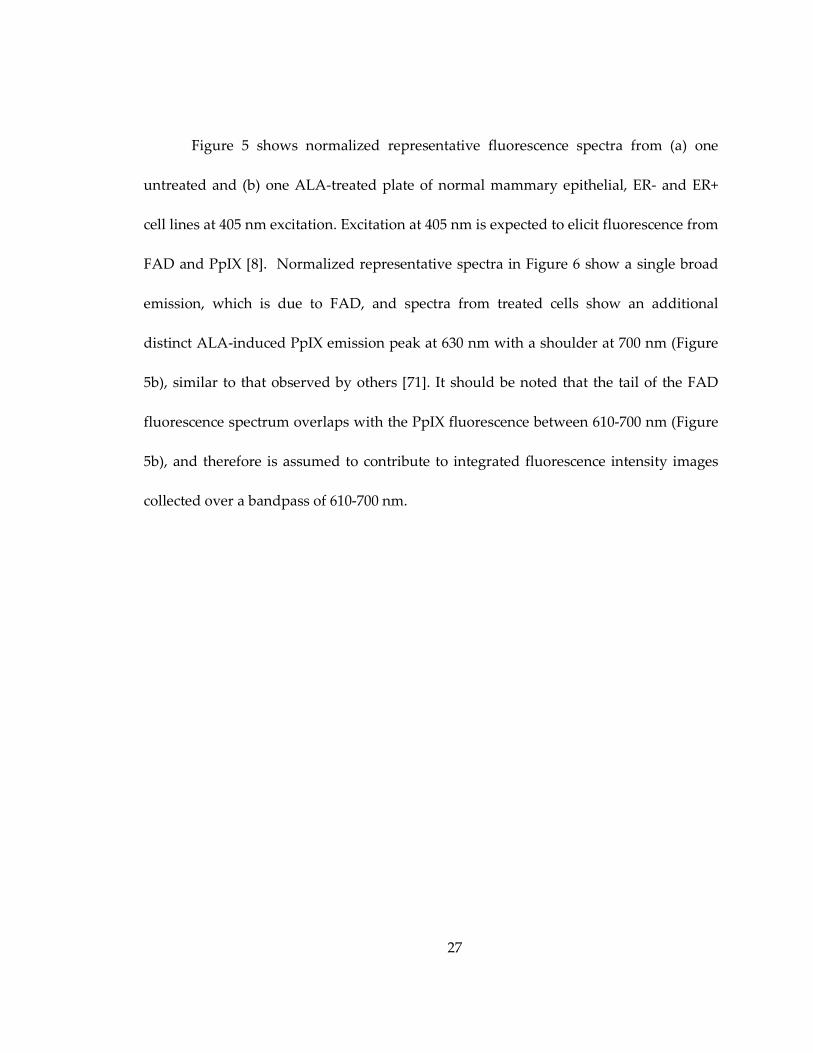
Figure 6: Average and standard error of the (a) calibrated integrated fluorescence
intensity (c.u.) per cell line (n=12) and (b) percentage change in integrated fluorescence
intensity of treated compared to the untreated controls (n=12). Asterisks denote that
each ALA-treated breast cancer cell line has a statistically higher percentage change in
integrated fluorescence compared to ALA-treated normal mammary epithelial cell lines
(Normal) (p<0.05). ....................................................................................................................... 28
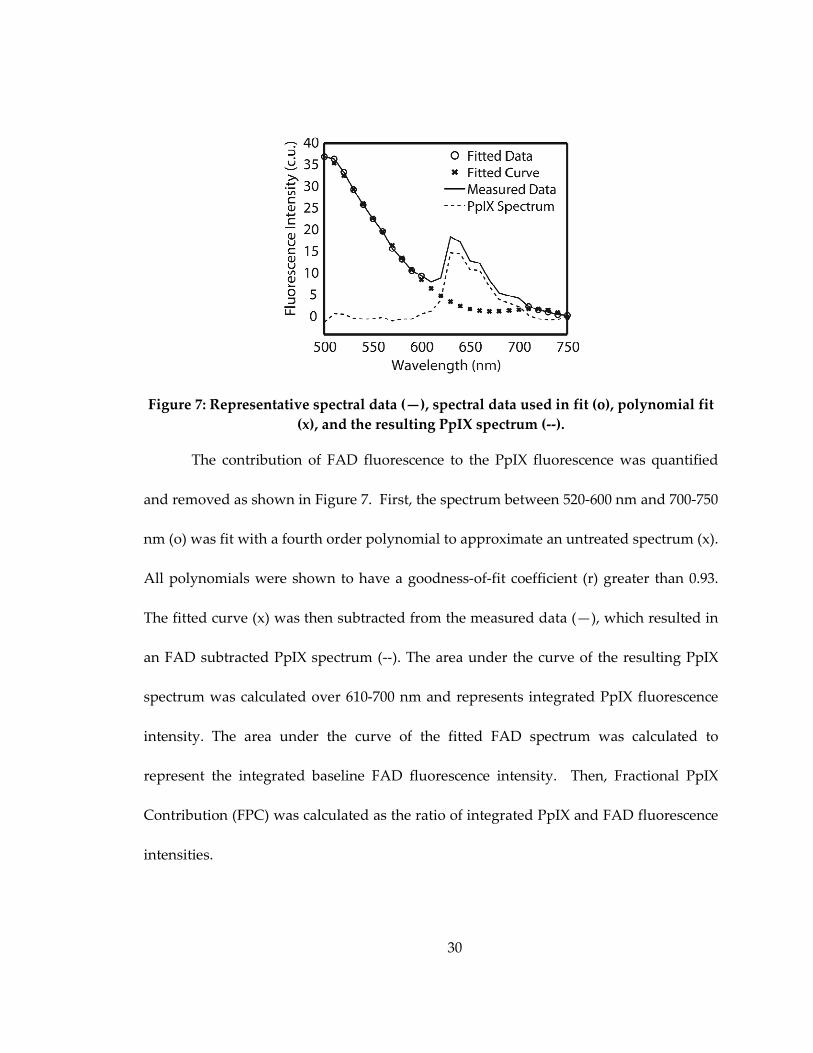
Figure 7: Representative spectral data (—), spectral data used in fit (o), polynomial fit
(x), and the resulting PpIX spectrum (--). ................................................................................ 30
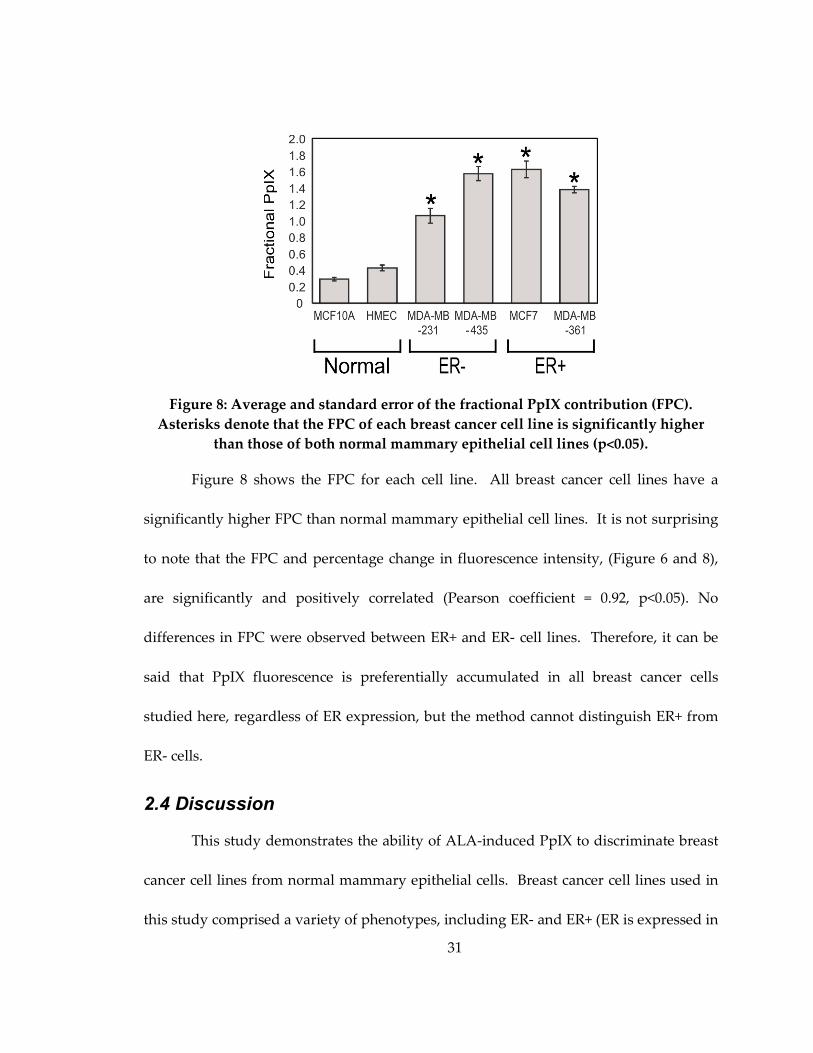
Figure 8: Average and standard error of the fractional PpIX contribution (FPC).
Asterisks denote that the FPC of each breast cancer cell line is significantly higher than
those of both normal mammary epithelial cell lines (p<0.05)............................................... 31
Figure 9: Western blot analysis of GLUT 1 and HK I levels in 10 breast cancer cells. ...... 44
Figure 10: Representative confocal fluorescence images of normal mammary epithelial
and breast cancer cells 2-NBDG labeled and unlabeled. Excitation was at 488 nm and
emission was collected between 515-585 nm. ......................................................................... 45
Figure 11: (a) Mean calibrated fluorescence intensity values and standard deviation of all
ten tested cell lines. (b) Mean ∆ change and standard deviation in fluorescence intensity.
Note that both cell lines to the left of the dashed line in (a) and (b) are normal mammary
xv
epithelial cell lines, and cell lines to the right of the dashed line are breast cancer cell
lines. .............................................................................................................................................. 47
Figure 12: (a) Calibrated mean fluorescence intensity values and standard deviation after
treatment with LND in MDA-MB-468 and MDA-MB-435 cell lines. (b) Calibrated mean
fluorescence intensity values and standard deviation after treatment with α-Cinn in
MDA-MB-468 and MDA-MB-435 cell lines (* denotes p<0.05)............................................. 49
Figure 13: (a) Western blot of GLUT 1 expression in treated and control MCF7 and
MDA-MB-435 cell lines with corresponding actin controls below. (b) Calibrated mean
fluorescence intensity values and standard deviation after treatment with tam in MCF7
and MDA-MB-435 cell lines (* denotes p<0.05). ..................................................................... 51
Figure 14: Illustration of the timeline used for all hypoxic and normoxic in vitro imaging.
....................................................................................................................................................... 62
Figure 15: Timeline of the normoxic and cycling hypoxia in vivo experiments................ 65
Figure 16: (a) Western blot analysis of control 4T1-RFP cells and cells treated with DFO
and CoCl2 (b) Mean and standard deviation of changes in fluorescence intensity in
control cells and cells after 48 hours of treatment.................................................................. 70
Figure 17: Representative images of normoxic (a) chronic hypoxia (b) and cycling
hypoxia (c) as well as mean fluorescence intensity and standard deviation after 2-NBDG
labeling of normoxia versus chronic hypoxia (d) and normoxia versus cycling hypoxia
(e)................................................................................................................................................... 72
Figure 18: Representative images of fluorescence intensity for tumor and control
normoxic and cycling hypoxic animals. The first 3 columns show hb sat, RFP and 2-
NBDG at baseline prior to administration of 2-NBDG. The last 3 columns show the 2-
NBDG signal after 20, 40 and 60 minuts. Scale bars are shown in the far right corner and
represent 0.5 mm. 2-NBDG and Hb sat calibration bars are located on the right,
respectively. ................................................................................................................................. 76
Figure 19: ∆ Fluorescence intensity and standard error measured longitudinally in vivo
in normoxic normal and tumor (a), normoxic normal and C.H. normal (b) and normoxic
tumor and C.H. tumor (c) .......................................................................................................... 80
Figure 20: Scatterplots of tumor oxygenation versus 2-NBDG uptake in normals (a) and
tumors (b)..................................................................................................................................... 82
xvi
Figure 21: Glycolytic Pathway [110]....................................................................................... 102
Figure 22: Mean fluorescence intensity and standard deviation of varying ALA
concentrations (n=4).................................................................................................................. 104
Figure 23: Kinetics of ALA-induced PpIX fluorescence expression in MCF10A, MCF7
and MDA-MB-435 cells ............................................................................................................ 105
Figure 24: Mean fluorescence intensity and standard deviation of MCF7 cells treated
with 2-NBDG and excited at varying wavelengths ............................................................. 107
Figure 25: Mean fluorescence intensity and standard deviation of 2-NBDG labeled MCF7
cells at 3 time points in comparison to the control............................................................... 108
Figure 26: Mean calibrated fluorescence intensity and standard deviation of cells treated
with 2-NBDG for 20 minutes at varying concentrations..................................................... 109
Figure 27: Degradation of 2-NBDG in the 4T1-RFP cells .................................................... 111
Figure 28: Representative images of tumor and normal tissue after administration of 100
ug/mL the corresponding mean fluorescence intensities and standard error (a) as well as
a comparison of the mean fluorescence intensities and standard error of 100 ug/mL
treated tumor and 200 ug/mL treated tumor. ....................................................................... 112

xvii
Acknowledgements
I would like to acknowledge the help of everyone. I could not have done this
without my village of labs who took me in and trained me on all animal, cell work,
MatLab, microscopy, how to drink copious amounts of coffee and those pesky Western
blots. Without the help and guidance of others I could not have finished or learned
nearly as much and I want everyone to know I appreciate and truly thank them for it.
1
1. Introduction
1.1 Cost-effective pre-clinical functional imaging
Technology advancements in cancer detection and treatment over past decades
have grown in leaps and bounds, especially with advances in functional imaging [1].
Functional imaging has the ability to detect and elucidate changes in biomarker
production and behavior or delineate an abnormal metabolic increase caused by
irregular tissue function, such as cancer. Functional imaging is further enhanced by the
use of contrast agents [1, 2]. Contrast agents magnify signal produced from the
abnormal tissue and permit conventional medical techniques to assess the tissue [2].
The work presented in this dissertation examines two clinically applicable
candidates for use as optical contrast agents in pre-clinical research. Two agents with
the potential for dual purposes were chosen to explore breast cancer. 5-aminolevulinic
acid (ALA) and 2-(N-(7-nitrobenz-2-oxa-1,3- diazol-4-yl)amino)-2-deoxyglucose (2-
NBDG). A hexylester of ALA (Hexvix) is currently used in humans as an agent to
induce the upconversion of ALA to the biomarker protoporphyrin IX [3]. ALA-induced
PpIX can also be used as a method for photodynamic therapy where the abnormal tissue
can be identified and treated simultaneously [3, 4]. 2-NBDG is a fluorescent analog to
the contrast agent Fluorodeoxyglucose (FDG) [5]. FDG is one of the most commonly
used agents to discriminate abnormal increases in glycolysis [1]. Changes in glycolysis
have also been used for prognosis and therapy monitoring with FDG [1]. Both agents
2
are molecularly specific and can be used to identify well-established differences
commonly associated with cancerous phenotypes.
Both agents were used to discriminate abnormal in vitro cellular function in
breast cancer cells from normal mammary epithelial cells. Evaluation of the two agents
showed similar ubiquitous uptake that was not influenced by the heterogeneity of breast
cancer cell receptors [6, 7]. 2-NBDG, the agent with a shorter incubation period was
chosen for further experimentation to determine if it could be used for pre-clinical
therapy monitoring in vitro, detection of in vivo changes caused by cancer, and when
used in combination with oxygenation measurements, post-hoc in vivo examination of
direct metabolic perturbations. These agents are low-cost alternatives and when applied
to a pre-clinical model have the potential greatly progress clinical therapy development.
1.2 Optical imaging of contrast agents
Fluorescence optical imaging of contrast allows for low cost, non-invasive
interrogation of both endogenous and exogenous contrast agents [2]. Figure 1 shows a
schematic of different types of commonly used fluorescence optical imaging agents.
These agents elucidate both endogenous and exogenous fluorophores [2]. Exogenenous
fluorophores can be further classified into non-specific contrast agents, molecularly
specific contrast agents, nanoparticles, “smart” agents and small molecules.
3
Figure 1: Diagram of Fluorescence Contrast Agents
Endogenous fluorescence contrast found in tissues is derived from intrinsic
fluorophores such as NAD, FAD and collagen [8]. The ability to detect fluorescence
contrast from endogenous sources is ideal for FDA approval since they do not require
additional chemical agents. However, intrinsic fluorophores are weakly fluorescent
exhibiting low signal to noise (SNR) and require highly sensitive detection methods [9].
SNR is limited by the ability to distinguish background tissue signals from the clinically
relevant fluorescence [9].
Non-specific exogenous agents have substantially increased SNR, allowing for
enhanced visualization of the differences between normal and cancerous tissue [2, 10].
Fluorescein and indocyanine green are examples of FDA approved non-specific agents
4
that are commonly used to augment tissue contrast in regions such as lymphatic nodules
[2]. These techniques are especially important for detecting sentinel lymph nodes in
breast cancer, which can identify metastatic potential of the cancer. Acriflavine allows
for visualization of increased nuclei-to-cytoplasm ratios, a pathologically relevant value
in abnormal tissue [11, 12]. However, these agents are highly non-specific and can easily
be taken up by surrounding normal tissue. This can significantly influence the
background fluorescence and limits the technique sensitivity [2].
Molecularly specific contrast agents consist of a group of agents that follow
specific molecular pathways to their targets such as glycolysis or the heme cycle [2].
These molecules are comprised of a high affinity ligand that targets a specific biomarker
such as a protein, cell surface receptor or enzyme. Molecularly specific contrast agents
can be broken down into several categories: organic fluorophores, “smart” agents,
nanoparticles or small molecules [2]. Organic fluorophores are conjugated to anti-
bodies, anti-body fragments or peptides. Examples can include epidermal growth factor
conjugated to Alexa647 or any number of monoclonal antibodies that are conjugated to a
fluorophore [2]. Nanoparticles have the capacity to greatly improve SNR and can be
modified to fluoresce at a chosen wavelength over a wide range of excitation frequencies
[13]. This allows for longer wavelengths to be used increasing penetration depth of the
agents. However, nanoparticles have implicit toxicity issues that have not been
resolved. Nanoparticle size may also prevent them from crossing the cell membrane.
5
The last type of agents, small molecules, may be transported by cells along a specific
metabolic pathway, but are much smaller than nanoparticles, have correct polarization
and are permitted through the cell membrane [2]. Aminolevulinic acid and 2-NBDG are
both examples of optical contrast agents that emit light in the visible range, but the
metabolic mechanisms are different.
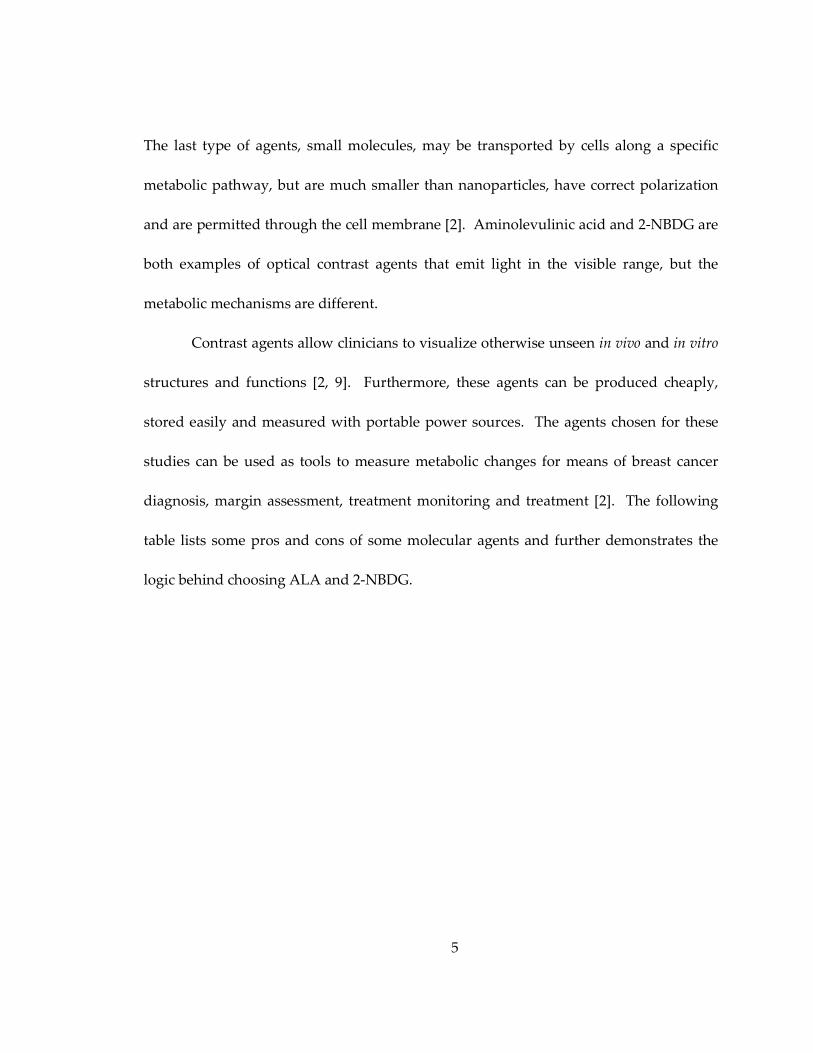
Contrast agents allow clinicians to visualize otherwise unseen in vivo and in vitro
structures and functions [2, 9]. Furthermore, these agents can be produced cheaply,
stored easily and measured with portable power sources. The agents chosen for these
studies can be used as tools to measure metabolic changes for means of breast cancer
diagnosis, margin assessment, treatment monitoring and treatment [2]. The following
table lists some pros and cons of some molecular agents and further demonstrates the
logic behind choosing ALA and 2-NBDG.
6
Table 1: Pros and cons of example molecular contrast agents [2]
1.3 Protoporphyrin IX
5-aminolevulinic acid (ALA) is an ideal potential candidate for breast cancer
detection and potentially margin assessment. ALA has been extensively tested in cells,
animal models and humans [3, 4, 14-38] and is widely used today for detection and
treatment of malignancy. Addition of exogenous ALA causes a preferential
accumulation of protoporphyrin IX (PpIX) in cancerous cells when compared to normal
cells [4, 14-29, 31-34, 36, 37]. PpIX is naturally produced by all nucleated cells during the
heme cycle and meticulously controlled to prevent its natural accumulation [33]. The
production of heme is necessary for all human cells. Two heme molecules are used to
7
form cytochrome c. Cytochrome c is located on the mitochondrial membrane and is
used as the final proton pumping assembly that catalyzes the transfer of electrons from
ferrocytochrome c to molecular oxygen during oxidative phosphorylation. For this
reason, the negative feedback system to control heme production is tightly regulated,
but is thought to be modified in cancerous tissues due to (1) enzymatic defects that lead
to an increase in protoporphyrinogen IX oxidase and/or (2) reduced activity of
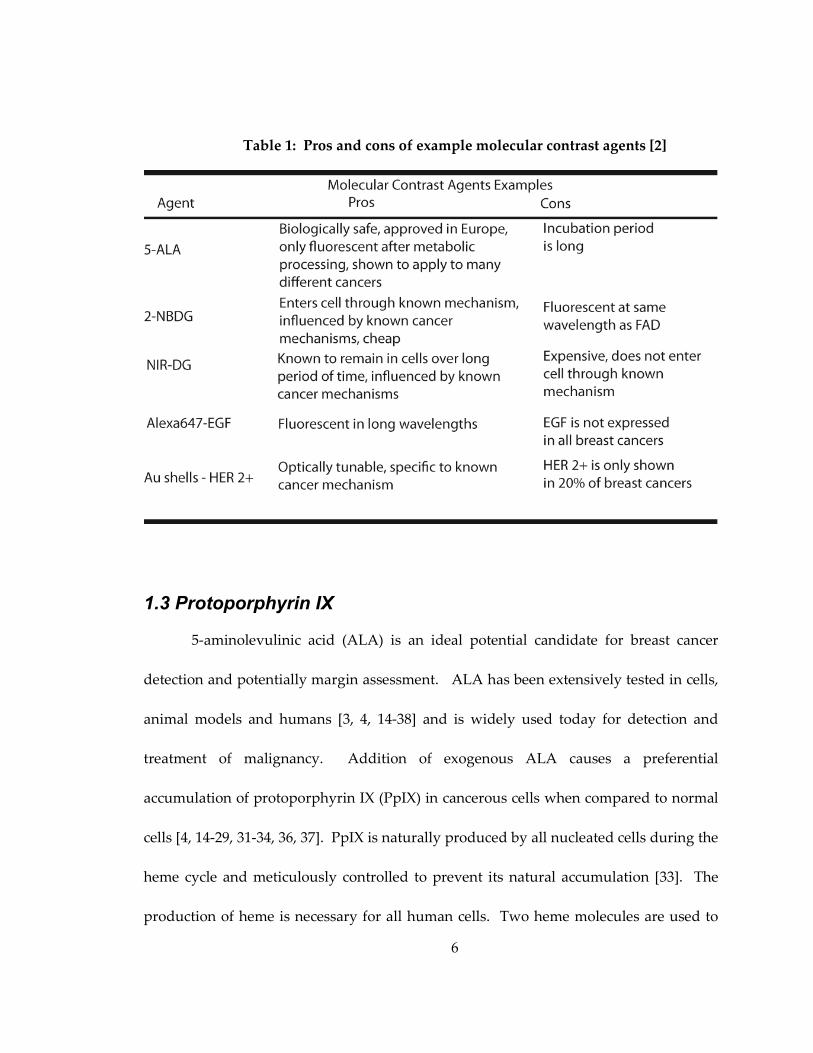
ferrochelatase [33]. Figure 2 shows the steps of normal formation of heme molecules.
The addition of exogenous ALA to the system circumvents the egress of ALA out of the
mitochondria and introduces it directly into the cellular cytoplasm.
Figure 2: Diagram of normal heme formation within the cell
ALA and its derivatives have shown great potential to photodynamically detect
and treat cancer in a wide variety of organs and applications. Clinical approval of ALA-
8
derivatives has been granted in the European Union for photodynamic diagnosis of
cancer of the bladder, brain, and skin, but has only been approved for use on skin by the
Food and Drug Administration in the United States [20]. Preferential accumulation of
PpIX in tumor cells, specifically residual glioma cells within the excision cavity [3, 39],
followed by photodynamic therapy of those cells, demonstrates the potential of ALA for
use in a “see and treat” paradigm in breast cancer [3, 20, 40] ALA-induced PpIX has
been shown to have a higher accumulation in cancerous breast cells as compared to
prostate, ovarian and brain cancer cell lines, which implies higher contrast and effective
visualization of cancerous cells [17, 28]. ALA-induced phototherapy in breast cancer
cells (MDA-MB-435) has demonstrated high photo-efficiency further demonstrating the
potential for the “see and treat” paradigm within breast tissue [40].
1.4 Glycolysis and Breast Cancer
In normal cells, energy is produced in three steps: glycolysis, Krebs cycle (Citric
Acid Cycle) and finally, oxidative phosphorylation [41, 42]. The first step in the process
in all cells is glycolysis, glucose is taken up and converted to 2 ATP molecules and 2
molecules of pyruvate. In the absence of oxygen, the pyruvate molecules ferment into
lactate and exit the cell via monocarboxylate transporter 4 (MCT-4). The presence of
oxygen allows pyruvate to cross the mitochondrial membrane and be oxidized via two
more metabolic cycles: the Citric Acid cycle and oxidative phosphorylation. The main
source of ATP is from the third cycle, oxidative phosphorylation, where 36 ATP
9
molecules, water and carbon dioxide are produced. ATP is then utilized for cellular
energy.
The first step, glycolysis, is the initial breakdown of glucose, also commonly
referred to as sugar, and is isolated to the cellular cytosol [41]. It is a reversible step and
its end product, pyruvate, can regenerate glucose, when necessary. In normal tissue,
oxygen inhibits the glycolytic fermentation (Pasteur Effect) allowing pyruvate to enter
the mitochondria, but glycolysis is increased in the absence of oxygen [41, 43]. Using
only glycolysis to produce ATP is much less efficient and requires a large increase in
glucose uptake than if the cell further processes the pyruvate in oxidative
phosphorylation. In cancerous tissue, conversion of glucose in the presence of oxygen
may occur. This is called aerobic glycolysis (also known as the Warburg effect) [44, 45].
The Warburg effect causes a corresponding increase in lactate production alters the
tissue pH microenvironment and can increase the proliferative rates and aggressiveness
of cells. The cause of the Warburg effect could be a combination of many factors [45].
Appendix A contains a flow diagram of the 10 steps involved in the glycolytic pathway
for reference [41].
Most primary and metastatic cancers exhibit aerobic glycolysis, breast cancer
included [43]. As previously stated, breast cancer is highly heterogeneous and the rate
of glucose consumption has been shown to be different between cancerous cell lines [43].
The rate of aerobic glycolysis is most likely similarly varying in breast cancer. Highly
10
aggressive cell lines, such as MDA-MB-231 have shown high glucose consumption, but
non-invasive phenotypes such as MCF7 cells have lower glucose consumption [43, 46].
Glucose consumption in humans has historically been measured using FDG [43]. The
measurement of FDG uptake has been shown to be higher in more aggressive breast
phenotypes [47, 48]. The interplay of proteins expressed by the patients such as glucose
transporter had a direct effect on glucose uptake and caused large variations in FDG
uptake [47, 48]. Changes in glucose consumption with FDG have also been used to
assess in vivo and in vitro therapy [46, 49]. Being able to image the upregulated aerobic
glycolysis has been shown to have significant cancer impact with the technological
advances from FDG.
1.5 2-NBDG
2-NBDG is an optical contrast agent that follows a similar metabolic pathway to
the cellular energy source, D-glucose and FDG [50]. The increase in cellular glycolysis
allows the optical contrast agent 2-NBDG to delineate cancer from normal tissue. 2-
NBDG is facilitated through the cell membrane via the polar molecule glucose
transporters (GLUT) 1 and 4, and is phosphorylated at the C-6 position by hexokinases I-
II (HK), which are located on the outer mitochondrial membrane [50]. The
phosphorylated fluorescent metabolite 2-NBDG-6-phosphate remains in the cell until
further decomposition occurs into a non-fluorescent form [51]. 2-NBDG can be
maximally excited at 488 nm and emits at 540 nm. Cellular glycolysis and the proteins
11
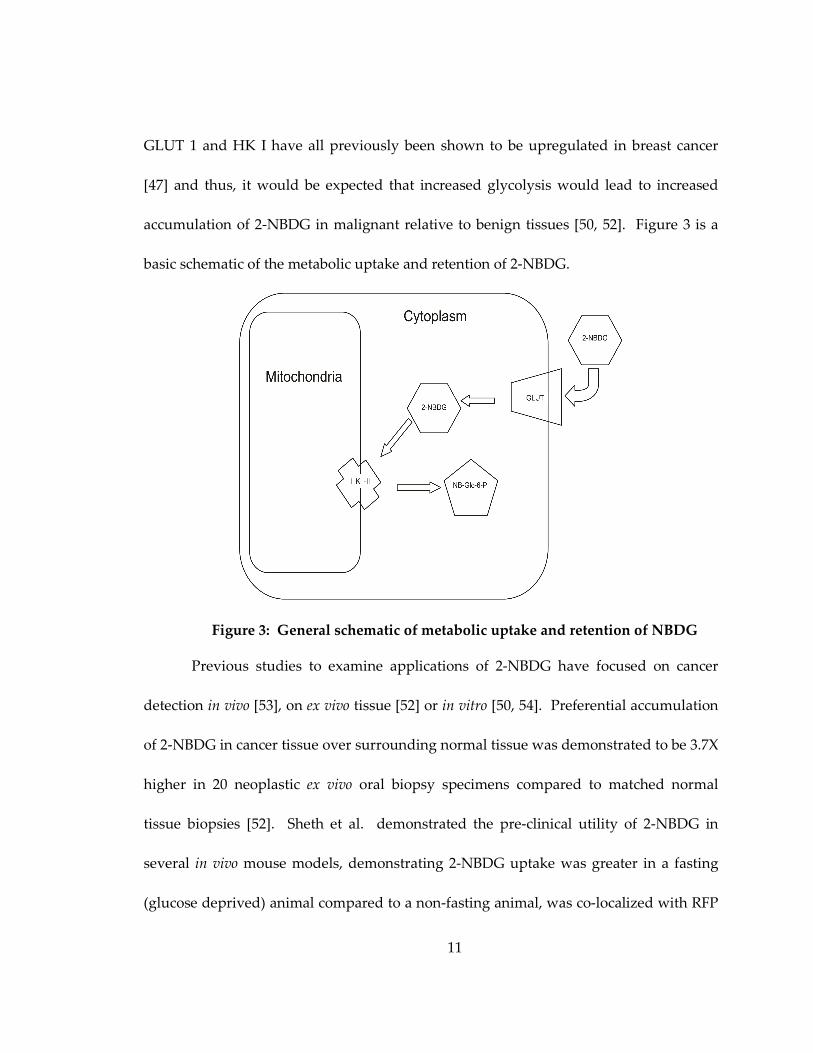
GLUT 1 and HK I have all previously been shown to be upregulated in breast cancer
[47] and thus, it would be expected that increased glycolysis would lead to increased
accumulation of 2-NBDG in malignant relative to benign tissues [50, 52]. Figure 3 is a
basic schematic of the metabolic uptake and retention of 2-NBDG.
Figure 3: General schematic of metabolic uptake and retention of NBDG
Previous studies to examine applications of 2-NBDG have focused on cancer
detection in vivo [53], on ex vivo tissue [52] or in vitro [50, 54]. Preferential accumulation
of 2-NBDG in cancer tissue over surrounding normal tissue was demonstrated to be 3.7X
higher in 20 neoplastic ex vivo oral biopsy specimens compared to matched normal
tissue biopsies [52]. Sheth et al. demonstrated the pre-clinical utility of 2-NBDG in
several in vivo mouse models, demonstrating 2-NBDG uptake was greater in a fasting
(glucose deprived) animal compared to a non-fasting animal, was co-localized with RFP
12
in a gliosarcoma tumor within a period of 60 minutes and demonstrated preferential
uptake in a stimulated seizure model of the brain as compared to one that was free of
seizures [53].
1.6 Good diagnostic tests
The ability to translate the use of metabolic contrast agents to clinical diagnostic
tests is important. Clinical diagnostic tests are the basis of clinician decisions of
diagnosis and/or prognosis. The most difficult aspect of developing any new diagnostic
test is to prove equivalence to the current clinical standard. Good clinical diagnostic
tests must meet three criteria prior to being adopted into routine clinical use [55]. First
the test must be repeatable and robust [55]. The test should be able to repeatedly give
the correct result even if the sample is not perfect. If the test does not obtain results that
are true or that can be repeated with the same sample it will not be further examined for
clinical purposes. The test should be able to account for disease occurrences. If the
disease is rare, the test should have few positives. Determining the specificity (the
proportion of negatives correctly identified) and sensitivity (the proportion of positives
correctly identified) is imperative. Second, the results of the test should be of clinical
value [55]. The test should incline clinicians towards a diagnosis and treatment plan
that results in a benefit to the patient. The results of the test and treatment decision
should increase the patient’s quality of life. Finally, the clinical community must be
convinced of the need for the new diagnostic test and the benefits it provides over
13
current clinical standards [55]. Insurance companies are particularly important for this
point. The diagnostic test cost must be justified as an improvement over the standard of
care financially or the adoption of the new diagnostic tests will be prevented. Before
molecular contrast agents can be translated to the clinic all of these steps must be
completed and the research presented here tries to examine a small part of step one for
ALA and 2-NBDG.
1.7 Research Aims
Optical contrast agents are particularly attractive for the visualization of cancer,
changes in biomarker distribution, metabolism, and cellular reaction to therapy. These
agents are cost-effective, simple to produce and store and can be imaged on both highly
technical optical systems with high resolution systems such as confocal, multiphoton or
hyperspectral imaging and may also be detected through simple filtering on light
microscopes. Furthermore, the contrast agents tested in this dissertation can be applied
pre-clinically in vivo, which means that it is possible to evaluate longitudinal effects.
Within this thesis I demonstrate the following:
1. ALA-induced PpIX can be ubiquitously detected in breast cancer independent of
receptor status, and cancerous cells can be discriminated from normal mammary
epithelial cells with single spectroscopic measurements post ALA administration
(Chapter 2).
14
2. 2-NBDG uptake in cells is ubiquitous in breast cancer cells and can be taken up in all
cells that contain glucose transporters, specifically GLUT 1. Furthermore, the amount of
uptake of 2-NBDG is directed by cellular glycolytic need (Chapter 3).
3. 2-NBDG can be used as a method to monitor therapeutic response to drugs that
directly affect glycolysis. (Chapter 3).
4. Simulated HIF 1α upregulation, chronic hypoxia and cycling hypoxia in vitro all
result in an increased 2-NBDG uptake (Chapter 4).
5. Changes in 2-NBDG uptake demonstrate ability to detect increased glycolytic need
caused by tumor tissue over normal tissue in vivo (Chapter 4).
6. Measuring changes in 2-NBDG uptake in combination with in vivo tissue oxygenation
allows for demarcation of Warburgian and Pasteur dominated tissue in vivo (Chapter 4).
This work will provide a clear foundation for further mechanistic and
applications based cancer research with 2-NBDG. The ability to detect 2-NBDG after
changes in glycolysis was demonstrated here, but research still needs to determine the
exact proteins that are upregulated. The ability to increase uptake in 2-NBDG is most
likely multi-faceted and is caused by combinations of chemical equilibrium and
upregulation of genes, and both of these mechanisms should be further explored. Also,
the kinetics of 2-NBDG uptake after gene upregulation and changes in oxygen
equilibrium need to be determined. By further exploring the ability of 2-NBDG to show
early responses to glycolytic stresses, 2-NBDG may in the future have the potential for ex

15
vivo clinical sample cancer detection. The research presented here can potentially be
continued on direct applications of 2-NBDG both pre-clinically and with ex vivo clinical
samples, simultaneously.
16
2. Preferential accumulation of 5-aminolevulinic acid-induced protoporphyrin IX in breast cancer: A comprehensive study on six breast cell lines with varying phenotypes
2.1 Introduction
Women with early stage breast cancer are eligible for breast conserving surgery
(BCS). The goal of BCS is to remove the entire tumor while minimizing removal of
surrounding normal tissue. The commonly accepted pathologic criterion for a negative
margin is a 2-mm rim of malignancy free tissue [56]. There are no widely adopted intra-
operative tools to assess tumor margins and all decisions are made post-operatively by a
pathologist. If the margin is positive, a secondary surgical procedure is performed to
excise additional tissue and prevent local recurrence of cancer. On average, four out of
ten women undergoing BCS return for a re-excision surgery [57-65]. Thus, a critical need
exists for new tools that can be used intra-operatively to determine if a tumor margin is
positive or negative at the time of the first surgery.
Previous studies illustrate that ALA-induced PpIX has the capability to
differentially detect breast cancer in multiple biological model systems [4, 17, 27, 28, 35,
36]. Fluorescence quantification of PpIX in breast cancer cell lysates treated with ALA
was higher as compared to patient-matched normal cell lysates treated with ALA in
explanted cell cultures from five breast cancer patients [66]. Studies on an in vivo animal
model have shown that ALA-induced fluorescence can be used to enhance early
17
detection of neoplastic and metastatic tissue from normal tissue [34]. Transgenic mice
with induced ductal carcinoma in situ (DCIS), the earliest form of breast cancer, were
shown to have an increase in 635 nm fluorescence (attributed to PpIX) in cancerous
tissues over the surrounding normal tissues, after tail-vein injection of ALA 60-75
minutes prior to imaging [34]. In a clinical study, ALA-induced PpIX fluorescence was
significantly greater in thirteen ex vivo primary breast tumors relative to surrounding
normal tissue [22]. Metastatic axillary and sentinel lymph node tissues imaged ex vivo
also showed an increase in mean PpIX fluorescence as compared to non-metastatic
lymph nodes in seven breast cancer patients [14].
The clinical applicability of ALA-induced PpIX has been demonstrated by the
early clinical work of Ladner et al. [22], but before diagnosis of breast cancer with ALA
is widely accepted more fundamental cellular, animal and clinical studies will be
required to characterize the effects of breast cancer subtype on uptake and contrast.
Breast cancer is highly heterogeneous and has been shown to exhibit large variations in
characteristics that may potentially affect metabolism of contrast agents, such as ALA-
induced PpIX.
The goal of the study in this chapter was to evaluate ALA-induced PpIX
fluorescence of a variety of breast cancer cell lines of varying phenotypes that are most
commonly seen clinically [67] and compare their ALA-induced PpIX fluorescence to
those of normal mammary epithelial cells [21]. Specifically, confocal microscopy at 405
18
nm excitation was utilized to image ALA-induced PpIX fluorescence in a panel of six
different breast cell lines – two normal, two estrogen receptor negative (ER-), and two
ER positive (ER+) - before and after treatment with ALA. This was the first study to
establish the sources of contrast in different breast cancer and normal epithelial cells
after application of PpIX. Confocal microscopy is an ideal modality for cell studies due
to its high resolution capabilities. To clinically implement imaging of ALA-induced
PpIX fluorescence for intra-operative margin assessment, full-field imaging techniques,
with a larger field of view and higher speed than confocal fluorescence imaging will be
required.
2.2 Materials and Methods
2.2.1 Cell Culture
Six breast cell lines were used in this study; two were normal mammary
epithelial cells (MCF10A and human mammary epithelial cells (HMEC)) and four were
breast cancer (MDA-MB-231, MDA-MB-361, MDA-MB-435, and MCF7). All cell lines,
except for HMEC, were obtained from the American Type Culture collection (Manassas,
VA, USA). HMEC primary cells were obtained from Lonza (Basel, Switzerland) and
infected with a retrovirus encoding human telomerase reverse transcriptase (hTERT) for
immortalization. All cells remained free of contaminants and were propagated by
adherent culture according to established protocols [68]. All breast cancer cell lines were
cultured in α-MEM (Gibco, Carlsbad, CA, USA) supplemented with 6% fetal bovine
19
serum, 1% hepes, 1% non-essential amino acids, 1% of 100 mM sodium pyruvate, 10
µg/mL insulin, 10 µg/mL hydrocortisone and 5 µg/mL epidermal grown factor (EGF).
All normal mammary epithelial cell lines were cultured in MEBM media (Lonza, Basel,
Switzerland) with 0.4% bovine pituitary extract, 0.01% hydrocortisone, insulin, and
human EGF. Plated cells were incubated at 5% CO2 and cultured every 3-4 days. Cells
were double washed in 3 mL of phosphate buffer saline (PBS) and detached from flasks
with 0.25% trypsin before centrifugation.
After three minutes of centrifugation at 120 rcf, a standard hemocytometer was
used to count the number of cells per milliliter. Approximately 200,000 cells were plated
on a 35 mm coverslip dish (Mat-Tek, Ashland, MA, USA) to be tested.
2.2.2 Confocal Microscope and Imaging Parameters
All confocal images were collected at Duke University Light Microscopy Core
Facility on a Leica SP5 laser scanning confocal microscope (Wetzlar, Germany). All cells
were imaged in a temperature controlled (37 ºC) live cell chamber. A 405 nm diode laser
source with a mean power of 2.4 mW at the sample plane and scanning rate of 400 Hz
was coupled to an inverted Leica DM16000CS microscope with a 40X oil-immersion
objective (Leica Plan NeoFluor, NA = 1.25). The imaging field of view was 242 µm x 242
µm with 512 x 512 pixels per image. An acousto-optic beam splitter (AOBS) served as a
dichroic mirror to allow the 405 nm excitation light to reach the sample and to allow
selection of emission wavelengths. Cooled photomultiplier tubes (PMT) were used to
20
measure fluorescence through a 121 µm pinhole in a confocal arrangement with a
theoretical axial resolution of 2 µm.
The emission bandpass for integrated fluorescence intensity measurements was
set to 610-700 nm, which was chosen from preliminary spectroscopy data on cells that
showed a fluorescence peak at 630 nm, corresponding to PpIX, as published in the
literature [8]. Images were taken at two separate fields of view and line averaged (16X
per line) for improved image quality. Each fluorescence intensity image was acquired in
approximately 20 seconds per image (1/400 sec*16 averages per line*512 lines per
image). Spectrally resolved fluorescence images at 405 nm excitation were collected at
each of 34 emission wavelengths between 420-750 nm with a line average of 1. The
AOBS had a collection bandwidth of 20 nm. A prism with a sliding mirror placed in the
optical path prior to the PMT was scanned every 10 nm to ensure Nyquist sampling was
fulfilled across all wavelengths. Total acquisition time was 43.5 seconds for all
wavelengths in each spectral image (1/400 sec*1 average per line *512 lines *34
wavelengths per spectral image). Leica LAS AF 1.8.2 software (Wetzlar, Germany) was
used for data acquisition. All images (intensity and spectral) were acquired with a gain
of 1200V, offset 0.7% and zoom of 1.6.
Prior to imaging, a calibration intensity image of standard fluorescent beads was
obtained (FocalCheck Fluorescence Microscope Test Slide #2, Invitrogen, Carlsbad, CA,
USA) to correct for daily variations in microscope throughput. The mean fluorescence
21
intensity over all experiments was 208 ± 5 units. Integrated fluorescence intensity
images were normalized by dividing the measured intensity by the intensity of the
calibration standard measured on the same day.
2.2.3 Cell Imaging
Twenty-four hours after plating, the original cell media was removed from the
culture dish, and cell lines were treated either with 500 µg/mL of ALA in standard cell
media or standard media alone and incubated for 2 hours prior to imaging. Since ALA
is not fluorescent, it was not removed before imaging. The concentration of ALA was
chosen experimentally (See Appendix B). At 500 µg/mL of ALA, no phototoxic effects
were seen in any cell line tested in this manuscript. Cell viability was verified by a
trypan blue exclusion assay as determined by a previously tested protocol [69]. Viable
cell concentration was then determined by counting the ratio of cells that were still
viable (unstained) to all cells. 89% ± 6% of ALA-treated and 85% ± 8% of untreated cells
were found to be viable. Finally, 500 µg/mL of ALA was found to be within the range of
concentrations used in previous PpIX cell culture studies [17, 70].
To determine the optimal time to measure the fluorescence of PpIX (See
Appendix B), a subset of cells (normal mammary epithelial MCF10A, MDA-MB-435
(ER-) and MCF7 (ER+)) was tested. The fluorescence intensity increased linearly from 0
to 6 hours post-ALA treatment, as seen in previous studies [37], and therefore, the peak
intensity window was assumed to be greater than 6 hours post-ALA treatment for all
22
cell lines. The two hour time point was chosen as it showed distinct differences between
normal mammary epithelial and breast cancer cell lines.
Sample size for each cell line included twelve treated and seven untreated plates.
Fluorescence intensity images were obtained from six of the treated and six of the
untreated plates. Confocal spectral imaging was completed on six additional treated
plates and a single untreated plate for each cell line. Sample size calculations for imaging
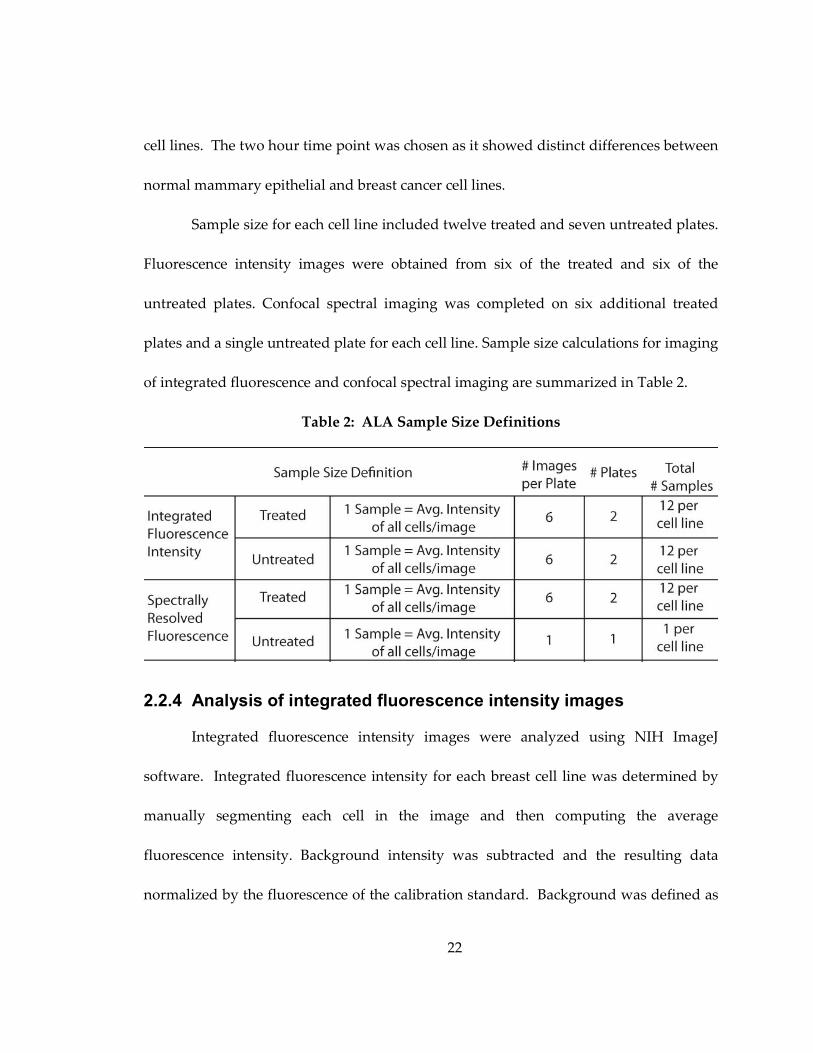
of integrated fluorescence and confocal spectral imaging are summarized in Table 2.
Table 2: ALA Sample Size Definitions
2.2.4 Analysis of integrated fluorescence intensity images
Integrated fluorescence intensity images were analyzed using NIH ImageJ
software. Integrated fluorescence intensity for each breast cell line was determined by
manually segmenting each cell in the image and then computing the average
fluorescence intensity. Background intensity was subtracted and the resulting data
normalized by the fluorescence of the calibration standard. Background was defined as
23
an area without cells that was approximately equivalent to the size of an entire cell
(2000-5000 pixels, depending on the cell line). Fluorescence intensity values for all cells
within each image were then averaged to represent one sample (each image had
approximately 10-50 cells within a field of view, depending on the cell line). A total of
n=12 fields of view (two images per sample) were imaged, from which the average
integrated fluorescence intensity per cell line was derived for both treated and untreated
cells.
2.2.5 Analysis of spectrally resolved fluorescence images
For spectrally resolved fluorescence images, a spectrum was calculated by the
Leica software from an area of 3-5 adjacent cells (6000-15000 pixels, depending on the
cell line). Three groups of adjacent cells were manually segmented and all spectra were
averaged to obtain a single spectrum (3 per image). A background spectrum was
obtained from a cell-free region in each image (2000-90000 pixels, depending on the cell
line growth pattern) and subtracted from each of the three spectra. These three spectra
were imported into MATLAB (Mathworks, Inc., Natick, MA,USA) to calculate Fractional
PpIX Contribution (FPC) (See Chapter 3 Results for further discussion of this
calculation). The three FPC values from each image were averaged to obtain a single
FPC per image. A total of n=12 FPCs (two images per sample) was calculated for all six
treated cell plates, from which the average FPC for the cell line was calculated.
24
2.2.6 Statistics
All statistics were computed with JMP (SAS, Cary, NC, USA) software.
ANOVAs and t-tests were completed with a Tukey-Kramer correction for multiple
comparisons to determine statistical significance. Exact two-sided p-values were
computed, and all p<0.05 were considered significant. All calculated correlations are
reported with a Pearson coefficient.
2.3 Results
2.3.1 Integrated fluorescence intensity images
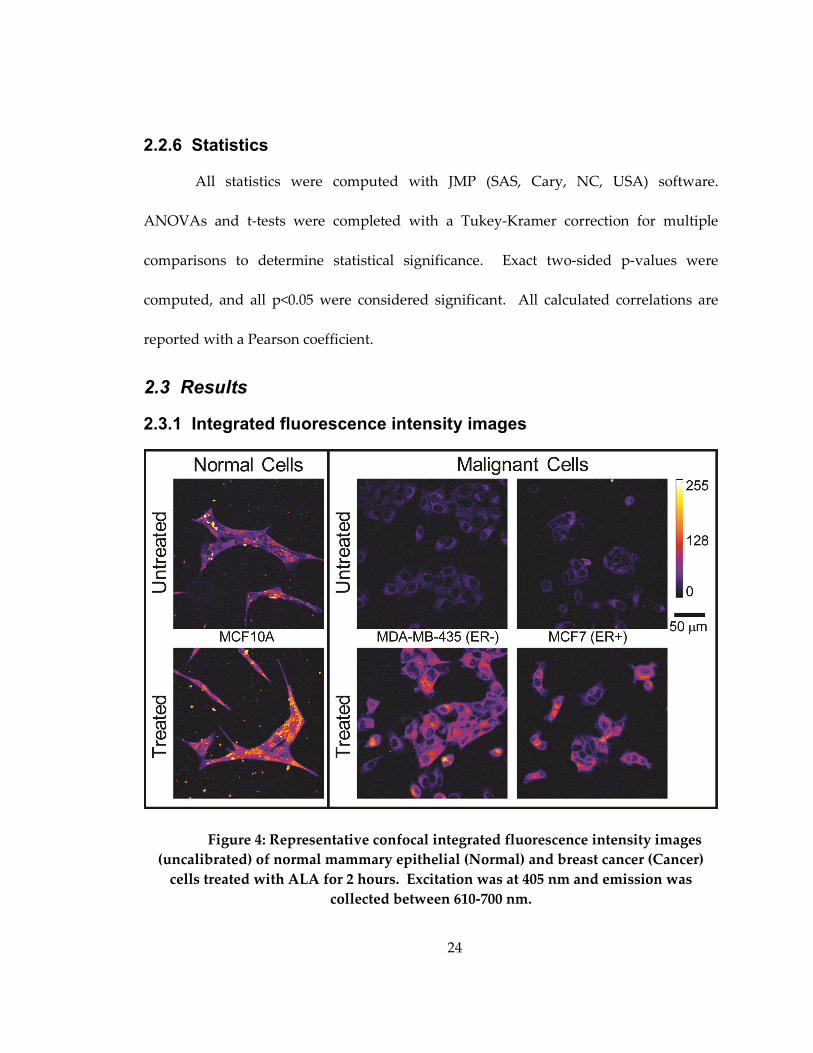
Figure 4: Representative confocal integrated fluorescence intensity images
(uncalibrated) of normal mammary epithelial (Normal) and breast cancer (Cancer)
cells treated with ALA for 2 hours. Excitation was at 405 nm and emission was
collected between 610-700 nm.
25
Figure 4 shows representative integrated fluorescence intensity images of
untreated and treated cell lines with different ER phenotypes. The untreated normal
mammary epithelial cell line image has much higher pre-treatment endogenous
fluorescence than either breast cancer cell line, which is likely due to the endogenous
fluorophore, FAD. Bright specks outside of the cells in the normal column are cellular
debris caused by plating on untreated glass and were not included in subsequent
analyses. Untreated ER- and ER+ breast cancer cell lines qualitatively show similar
distributions of endogenous fluorescence, which is diffusely distributed throughout the
breast cancer cells prior to treatment and a few areas of high intensity around the
nucleus. All cells showed an increase in PpIX fluorescence after two hours of ALA
treatment, as seen in the bottom row. The normal mammary epithelial cell line shows
bright points of PpIX fluorescence within an even distribution of cellular fluorescence.
Breast cancer cell lines show brighter fluorescence in the perinuclear cytoplasm, and
although the edges of the cells are clearly visible in the post-treatment images, the edges
are not as intense. PpIX fluorescence is only in the cellular cytoplasm (as opposed to the
nucleus) in all cell lines.
26
2.3.2 Cellular Fluorescence Spectra
Figure 5: Representative normalized fluorescence spectra at 405 nm excitation
of (a) untreated cells and (b) ALA-treated cells. Spectra were normalized to the peak
intensity.
27
Figure 5 shows normalized representative fluorescence spectra from (a) one
untreated and (b) one ALA-treated plate of normal mammary epithelial, ER- and ER+
cell lines at 405 nm excitation. Excitation at 405 nm is expected to elicit fluorescence from
FAD and PpIX [8]. Normalized representative spectra in Figure 6 show a single broad
emission, which is due to FAD, and spectra from treated cells show an additional
distinct ALA-induced PpIX emission peak at 630 nm with a shoulder at 700 nm (Figure
5b), similar to that observed by others [71]. It should be noted that the tail of the FAD
fluorescence spectrum overlaps with the PpIX fluorescence between 610-700 nm (Figure
5b), and therefore is assumed to contribute to integrated fluorescence intensity images
collected over a bandpass of 610-700 nm.
28
2.3.3 Quantitative integrated fluorescence intensity measurements
Figure 6: Average and standard error of the (a) calibrated integrated fluorescence
intensity (c.u.) per cell line (n=12) and (b) percentage change in integrated
fluorescence intensity of treated compared to the untreated controls (n=12). Asterisks
denote that each ALA-treated breast cancer cell line has a statistically higher
percentage change in integrated fluorescence compared to ALA-treated normal
mammary epithelial cell lines (Normal) (p<0.05).
In Figure 6, the six cell lines were grouped in pairs by ER expression (normal
mammary epithelial, malignant ER- and malignant ER+). All cell lines exhibited
significantly greater fluorescence intensity following treatment (p<0.05). The normal
mammary epithelial cell lines (MCF10A and HMEC) untreated fluorescence intensity
was significantly greater than all untreated breast cancer (MDA-MB-231, MDA-MB-435,
MCF7 and MDA-MB-361) cell lines (Figure 6a, p<0.01). Calibrated fluorescence intensity
29
of the ALA-treated HMEC cell line was significantly greater than the treated MDA-MB-
231 breast cancer cell line, but not significantly different compared to the other ALA-
treated breast cancer cell lines. Figure 6b shows that the percentage change in PpIX
fluorescence intensity following treatment was significantly greater in all breast cancer
cell lines as compared to both normal mammary epithelial cell lines by at least 150%
(Figure 6b, p<0.05). No significant differences in the percent change of fluorescence
intensity were observed between or within the ER- and ER+ breast cancer cell lines.
2.3.4 Quantitative analysis of the fluorescence spectral data
Although the breast cancer cells demonstrated a significant percentage increase
in fluorescence following ALA treatment, it may be clinically impractical to obtain a pre-
treatment measurement. Post-treatment intensity measurements alone were not useful
in discriminating normal mammary epithelial cell lines from breast cancer due to cell-to-
cell variability in endogenous FAD fluorescence. A method for differentiating between
normal mammary epithelial and breast cancer cells using only post-treatment
measurements would be desirable. Fluorescence spectral images that capture both FAD
and PpIX fluorescence have the potential to directly address this problem as presented
below.
30
Figure 7: Representative spectral data (—), spectral data used in fit (o), polynomial fit
(x), and the resulting PpIX spectrum (--).
The contribution of FAD fluorescence to the PpIX fluorescence was quantified
and removed as shown in Figure 7. First, the spectrum between 520-600 nm and 700-750
nm (o) was fit with a fourth order polynomial to approximate an untreated spectrum (x).
All polynomials were shown to have a goodness-of-fit coefficient (r) greater than 0.93.
The fitted curve (x) was then subtracted from the measured data (—), which resulted in
an FAD subtracted PpIX spectrum (--). The area under the curve of the resulting PpIX
spectrum was calculated over 610-700 nm and represents integrated PpIX fluorescence
intensity. The area under the curve of the fitted FAD spectrum was calculated to
represent the integrated baseline FAD fluorescence intensity. Then, Fractional PpIX
Contribution (FPC) was calculated as the ratio of integrated PpIX and FAD fluorescence
intensities.
31
Figure 8: Average and standard error of the fractional PpIX contribution (FPC).
Asterisks denote that the FPC of each breast cancer cell line is significantly higher
than those of both normal mammary epithelial cell lines (p<0.05).
Figure 8 shows the FPC for each cell line. All breast cancer cell lines have a
significantly higher FPC than normal mammary epithelial cell lines. It is not surprising
to note that the FPC and percentage change in fluorescence intensity, (Figure 6 and 8),
are significantly and positively correlated (Pearson coefficient = 0.92, p<0.05). No
differences in FPC were observed between ER+ and ER- cell lines. Therefore, it can be
said that PpIX fluorescence is preferentially accumulated in all breast cancer cells
studied here, regardless of ER expression, but the method cannot distinguish ER+ from
ER- cells.
2.4 Discussion
This study demonstrates the ability of ALA-induced PpIX to discriminate breast
cancer cell lines from normal mammary epithelial cells. Breast cancer cell lines used in
this study comprised a variety of phenotypes, including ER- and ER+ (ER is expressed in
32
approximately 60% of all breast cancers) [68]. The research in this chapter showed that
fluorescence of ALA treated cells (two normal mammary epithelial and four breast
cancer cell lines) was significantly greater than the equivalent untreated cell lines. Also,
breast cancer cell lines could be easily discriminated from normal mammary epithelial
cell lines by determining the percentage change in fluorescence intensity after PpIX
treatment. However, the high endogenous FAD fluorescence present in untreated
normal mammary epithelial cells resulted in overall greater post-treatment fluorescence
in normal mammary epithelial cells compared to breast cancer cells and demonstrated
the need for a method to account for the cell-to-cell variability in FAD fluorescence in
the absence of pre-treatment images. Spectroscopy provided a means of separating
endogenous fluorescence contribution from ALA-induced PpIX fluorescence and
enabled discrimination of normal mammary epithelial and breast cancer cells based on a
single post-treatment measurement.
Ratiometric methods have been used previously for ALA studies in oral, bladder
and head and neck tissues [29, 72, 73] to account for the contribution of endogenous
fluorescence. Fluorometric ratios of red fluorescence to green or blue fluorescence were
able to detect malignancies in these various organ sites [29, 72, 73]. However,
implementing these methods to account for endogenous fluorescence in the present
study did not produce statistically significant differences in the breast cancer cell lines
compared to the normal mammary epithelial lines. The probable reason for the lack of
33
significant differences in this study was that the high endogenous fluorescence in the
green or blue wavelength range overwhelms the red PpIX contribution. Instead of
calculating the ratio in the blue or green, decoupling PpIX fluorescence from the overall
remitted fluorescence to compute fractional PpIX fluorescence contribution was required
for discrimination of normal mammary epithelium from all breast cancer cell lines and
could be completed with a single post-treatment spectroscopic measurement.
Spectroscopic approaches similar to that presented here for separating PpIX
fluorescence from endogenous tissue fluorescence has been previously reported by
Klinteberg et al [19]. Klinteberg et al. [19] used a technique to separate PpIX
fluorescence from tissue autofluorescence in photodynamic therapy of basal cell
carcinoma. The endogenous fluorescence was removed by exponentially fitting the FAD
fluorescence and then subtracting the FAD signal out to determine the photoproducts
after photodynamic therapy. Also, spectroscopic deconvolution of the endogenous
signal from PpIX spectra has been previously shown by Gibbs-Strauss et al [74].
Comparison of the detected signals to a liquid tissue phantom containing PpIX allowed
for delineation of the PpIX signal from non-specific fluorescence transmitted through
normal and cancerous tissue in a mouse brain [74]. The results from the study by Gibbs-
Strauss [74] provided evidence of high endogenous fluorescence background when
measuring PpIX fluorescence from ALA-treated cancer.
34
The breast cancer cell lines in this study exhibited a significant increase in
fluorescence intensity compared to normal mammary epithelial cells after
administration of ALA, as seen previously in vitro [15, 21, 27]. Only one other in vitro
study has compared PpIX production in a breast cancer and corresponding normal cell
line. Specifically, Rodriguez et al. [27] showed that HB4-A R-ras breast cancer cell lines
had higher PpIX fluorescence compared to immortalized cells not transfected with the
Ras oncogene.
The cellular origin of the MDA-MB-435 cell line has recently been questioned. It
has previously been shown that the MDA-MB-435 has a gene expression profile
consistent with M14 melanoma cells [75]. However, more recently it has been argued
that the MDA-MB-435 cell line is indeed of breast cancer origin [76]. The MDA-MB-435
originated from a female and the original M14 melanoma line was reported to be
derived from a male patient [76]. The current M14 melanoma line stock does not contain
a Y chromosome, which indicates that the M14 was most likely compromised [76]. In
spite of the controversy surrounding the origin of the MDA-MB-435 cell line, the results
from this study demonstrate concordance between MDA-MB-435 and the other breast
cancer cell lines studied in terms of its uptake of ALA.
This chapter presents an examination of the diagnostic potential of PpIX with a
panel of normal mammary epithelial and breast cancer cell lines. It was found that the
relative change in PpIX fluorescence intensity could discriminate breast cancer from
35
normal mammary epithelial cell lines and was not affected by varying estrogen receptor
expression in cell lines. The ability to discriminate cells post-ALA treatment shows the
potential for the use of spectroscopic methods in margin assessment of breast cancer
with PpIX fluorescence, regardless of ER status. The MDA-MB-361 cell line tested here
also expressed the HER2+/NEU phenotype model, but did not have a significantly
different PpIX fluorescence intensity as compared to all other cancer cells tested.
Therefore, HER2+/NEU cell lines were not further explored by our group, and we
believe PpIX would have similar results in other phenotypes as shown by the lack of
difference in the HER2+/NEU phenotype MDA-MB-361 cells.
Studying breast cancer cellular ALA-induced PpIX fluorescence is an important
initial step in characterizing PpIX use within different biological subtypes of breast
cancer cell lines and comparing them to normal mammary epithelial cell lines. Because
of the limitations of an in vitro study, it was not possible to evaluate the possible effects
of vascular transport of ALA to the target tissues and the corresponding effect on uptake
of ALA and conversion to PpIX. Thus, further work is required to address this issue,
and the work presented here is a first step towards realizing the utility of ALA for breast
cancer delineation. In future studies, ALA-induced PpIX fluorescence should be
examined in xenograft breast cancer models, including ER and HER2+/NEU phenotypes.
36
3. Uptake of 2-NBDG as a method to monitor therapy response in breast cancer cell lines
3.1 Introduction
Functional imaging of glucose uptake has been shown to be invaluable in breast
cancer diagnosis, prognosis and therapy monitoring [46]. Many cancers demonstrate
aerobic glycolysis, glucose metabolism in the presence of oxygen [46, 50, 52]. Current
methods to measure glycolysis include measurement of dielectric response [77], protein
quantification [78], nuclear resonance and imaging [46, 79, 80], microarray quantification
[81] and pH responsive dyes [82]. Monitoring glycolysis is most commonly measured
with fluorodeoxyglucose (FDG), a radioactive glucose analog, and is detected with
Positron Emission Tomography (PET) [46]. All of these techniques, however, can be
prohibitively expensive, manually intensive and/or technologically complex rendering
them impractical for high-throughput drug development even with demonstration of
clinical success [46].
Preferential uptake of 2-NBDG in breast cancer has been carried out previously
on in vitro cell studies, but not in pre-clinical models of breast cancers or human breast
cancers. O’Neil et al. demonstrated a 3.5X greater uptake of 2-NBDG in MCF7 cells as
compared to non-malignant M-1 epithelial cells following 10 minutes of incubation in
0.3 mM concentration of the contrast agent [50]. Levi et al. used MCF7, MDA-MB-435
and MDA-MB-231 cell lines to compare 2-NBDG uptake at 10 µM to 10 µM of NIR-
fructose uptake after 15 minutes of incubation and found them to be equivalent [54].
37
2-NBDG could play an important role in in vitro cell line studies. 2-NBDG allows
for the evaluation of the efficacy of drugs on a large number of different cell lines, which
is particularly important given the heterogeneity of breast disease. The goal in this
chapter was to demonstrate the utility of 2-NBDG as a molecular contrast agent to
quantitatively measure changes in glycolysis and to demonstrate a method to measure
the response of breast cancer cell lines to therapy. Confocal microscopy was used to
image the fluorescence signal from 2-NBDG in a panel of 10 different breast cell lines – 2
normal mammary epithelial and 8 cancer that included estrogen receptor positive (ER+)
and negative (ER-) cell lines. The expression of GLUT 1 and HK I proteins were
quantified following Western blot analysis and compared to fluorescence results
obtained from these cells. A subset of 2 breast cancer cell lines was then treated with
anticancer therapies that directly affect glycolysis: lonidamine (LND), a HK inhibitor,
and α-cyano-hydroxycinnamate (α-Cinn), a glycolytic stimulator, to demonstrate the
ability to measure opposing perturbations on 2-NBDG uptake. LND directly inactivates
HK [83], preventing the 2-NBDG molecule from being phosphorylated and retained
within the cell. α-Cinn directly inhibits the monocarboxylate transporter 1 (MCT1)
which transports lactate into the cell to be used as a secondary source of energy during
oxidative phosphorylation [84]. Finally, a subset of 1 ER+ and 1 ER- breast cancer cell
lines was treated with a therapeutic dose of tamoxifen (tam), a widely used endocrine
38
therapy for treatment of patients with ER+ breast cancer, to determine if the changes in
2-NBDG uptake are consistent with the expected effects of tam, a reduction in glycolysis.
3.2 Materials and Methods
3.2.1 Cell Culture
Two cell lines were derived from the normal mammary epithelium (MCF12 and
human mammary epithelial cells (HMEC)) and eight were derived from patients with
breast cancer (BT-20, BT-474, MDA-MB-231, MDA-MB-361, MDA-MB-435, MDA-MB-
468, MCF7, and T47D). Breast cancer cell lines and the MCF12 cell line were obtained
from the American Type Culture collection, ATCC (Manassas, VA, USA). Primary
HMECs were obtained from Lonza (Basel, Switzerland) and infected with a retrovirus
encoding human telomerase reverse transcriptase (hTERT) for immortalization as in
Chapter 2. All cells remained free of contaminants and were propagated by adherent
culture, trypsinized and plated according to established protocols stated in Chapter 2 [7,
68]. Cells were plated at 100,000 cells/mL in 10 mL for Western blot analysis and 2 mL
for all confocal imaging studies.
3.2.2 Confocal microscopy parameters
All confocal images were collected on a Leica SP5 laser scanning confocal
microscope (Wetzlar, Germany) using a protocol similar to that discussed in Chapter 2
[7]. Briefly, a 488 nm argon laser source (power at sample was 3.5 mW) was coupled to
an inverted Leica DM16000CS microscope with a 40X oil-immersion objective (Leica

39
Plan NeoFluor, NA = 1.25). Emission was collected between 515-585 nm, chosen from
preliminary spectroscopy data completed on MCF7 cells to incorporate the full-width
half-maximum of 2-NBDG. Images were acquired with a PMT gain of 950V, offset 0.7%
and zoom of 1.6 to measure the unlabeled and labeled 2-NBDG cells. This gain was
chosen for quantification of weakly fluorescent unlabeled cells to allow comparison to 2-
NBDG labeled cells. Images of anti-cancer and endocrine therapy treated and vehicle
control cells (all 2-NBDG labeled) were acquired with a gain of 750V, offset 0.7% and
zoom of 1.6. The gain was lowered since some 2-NBDG labeled cell lines had saturated
pixels in the first set of experiments, specifically MDA-MB-435.
3.2.3 Cell imaging studies
Overall uptake of 2-NBDG (2-NBDG labeled versus unlabeled) was quantified
for all ten breast cell lines and then a new set of experiments was conducted for each
anti-cancer or endocrine treatment (treated versus vehicle control). Each sample was
defined as the average intensity of all cells within a single confocal image. The imaging
field of view was 242 µm x 242 µm with 512 x 512 pixels per image. Two samples were
acquired per plate. Sample sizes for each cell line included four, 2-NBDG labeled and
four unlabeled plates. All ten cell lines were tested in the unlabeled versus labeled
experiments, and MDA-MB-435 and MDA-MB-468 cells were tested with anticancer
agents (LND and α-Cinn) and MCF7 (ER+) and MDA-MB-435 (ER-) with endocrine
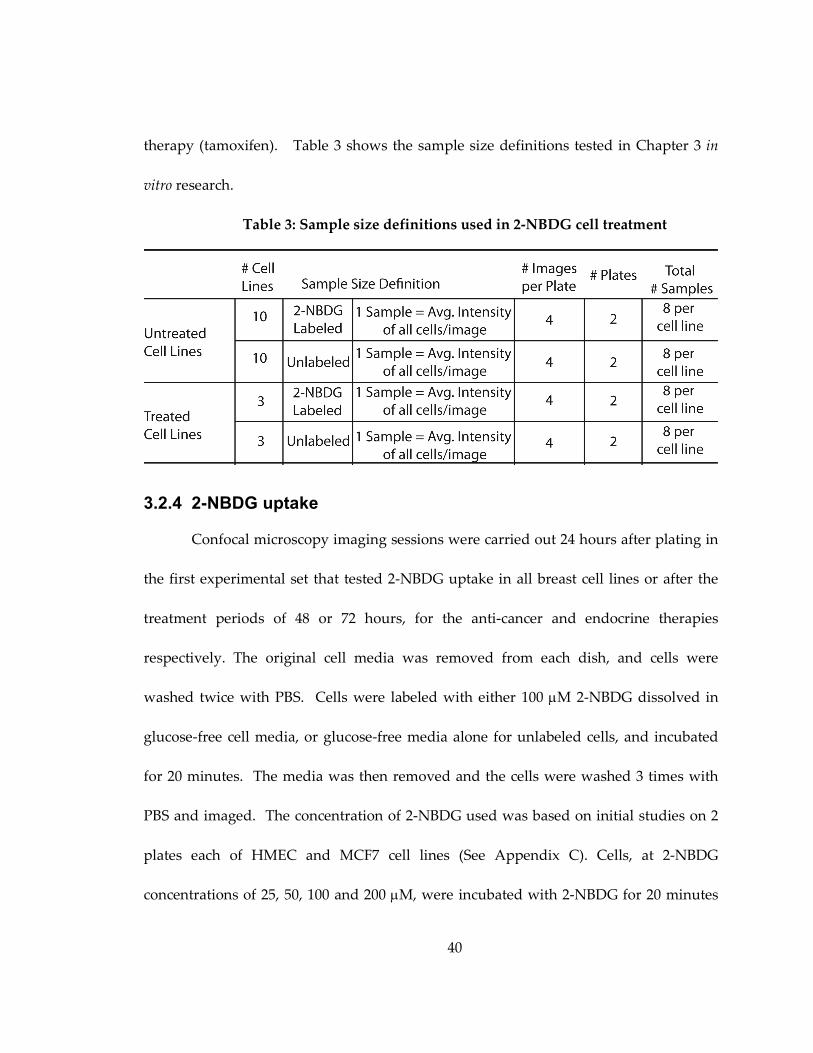
40
therapy (tamoxifen). Table 3 shows the sample size definitions tested in Chapter 3 in
vitro research.
Table 3: Sample size definitions used in 2-NBDG cell treatment
3.2.4 2-NBDG uptake
Confocal microscopy imaging sessions were carried out 24 hours after plating in
the first experimental set that tested 2-NBDG uptake in all breast cell lines or after the
treatment periods of 48 or 72 hours, for the anti-cancer and endocrine therapies
respectively. The original cell media was removed from each dish, and cells were
washed twice with PBS. Cells were labeled with either 100 µM 2-NBDG dissolved in
glucose-free cell media, or glucose-free media alone for unlabeled cells, and incubated
for 20 minutes. The media was then removed and the cells were washed 3 times with
PBS and imaged. The concentration of 2-NBDG used was based on initial studies on 2
plates each of HMEC and MCF7 cell lines (See Appendix C). Cells, at 2-NBDG
concentrations of 25, 50, 100 and 200 µM, were incubated with 2-NBDG for 20 minutes
41
and were compared to equivalent unlabeled cells. Intracellular 2-NBDG fluorescence
increased approximately linearly with concentration. However, at a concentration of
200 µM the fluorescence of most cells saturated the microscope detector. Therefore, a
concentration in the middle of the tested range and equivalent to that used in previous
cell studies [50], 100 µM, was chosen for subsequent studies. To determine the optimal
time to measure 2-NBDG fluorescence (See Appendix C), 2 plates each of MCF7 and
HMEC cells were tested at 10, 20 and 45 minutes. Fluorescence intensity was found to
be significantly different after 20 minutes (p<0.05) between 2-NBDG labeled and
unlabeled cells and results matched previous studies at this time point [50].
3.2.5 Anti-cancer and endocrine treatments
A subset of cells (MDA-MB-435 and MDA-MB-468) was treated with the anti-
cancer agents, lonidamine (LND) and α-cyano-hydroxycinnamate (α-Cinn). These cell
lines were chosen since they both expressed HK I protein on a Western blot (Results)
and each cell line possesses un-methylated MCT 1, which is the transporter that is
blocked by α-Cinn [85]. Twenty-four hours after plating, cells were treated with 600 µM
LND or 840 µM α-Cinn dissolved in dimethyl sulfoxide (DMSO) for 48 hours [86]. The
corresponding vehicle control was treated with DMSO only. Tam treatment was carried
out at a concentration of 2 µM for 72 hours and the corresponding vehicle control was
ethanol. G1 cell cycle arrest was determined via cell cycle analysis to occur in MCF7
42
cells after treatment with tam. After treatment, the cells were then labeled with 2-NBDG
according to the protocol discussed and imaged at the settings described.
3.2.6 Data processing
Fluorescence intensity images were analyzed using NIH ImageJ software and
analyzed with methods discussed in Chapter 2 [7]. Briefly, fluorescence intensity for
each breast cell line was determined by manually segmenting each cell in the image and
then computing the average fluorescence intensity for all cells in the image. Background
intensity was subtracted and the resulting data normalized by a fluorescence calibration
standard, which consisted of a fluorescent bead (FocalCheck Fluorescence Microscope
Test Slide #2, Invitrogen, Carlsbad, CA, USA) measured daily to account for small
changes in laser power. A total of n=8 fields of view per cell line (two per sample per
experimental arm) were imaged from which the average integrated fluorescence
intensity per cell line was derived.
3.2.7 Western blots
Western blots were carried out according to standard procedures [87]. After
lysing the cells, resultant protein samples were heated to 95°C for 5 min and subjected to
sodium dodecyl sulfate–polyacrylamide gel electrophoresis on 4-12% gradient 1 mm
acrylamide gels, followed by transfer to polyvinylidene difluoride membranes for 1.5 h
at 150 V with a NOVEX semi transfer unit. Membranes were blocked for 1.5 h in Tris-
buffered saline with 0.01% Tween 20, and incubated overnight with primary antibody:
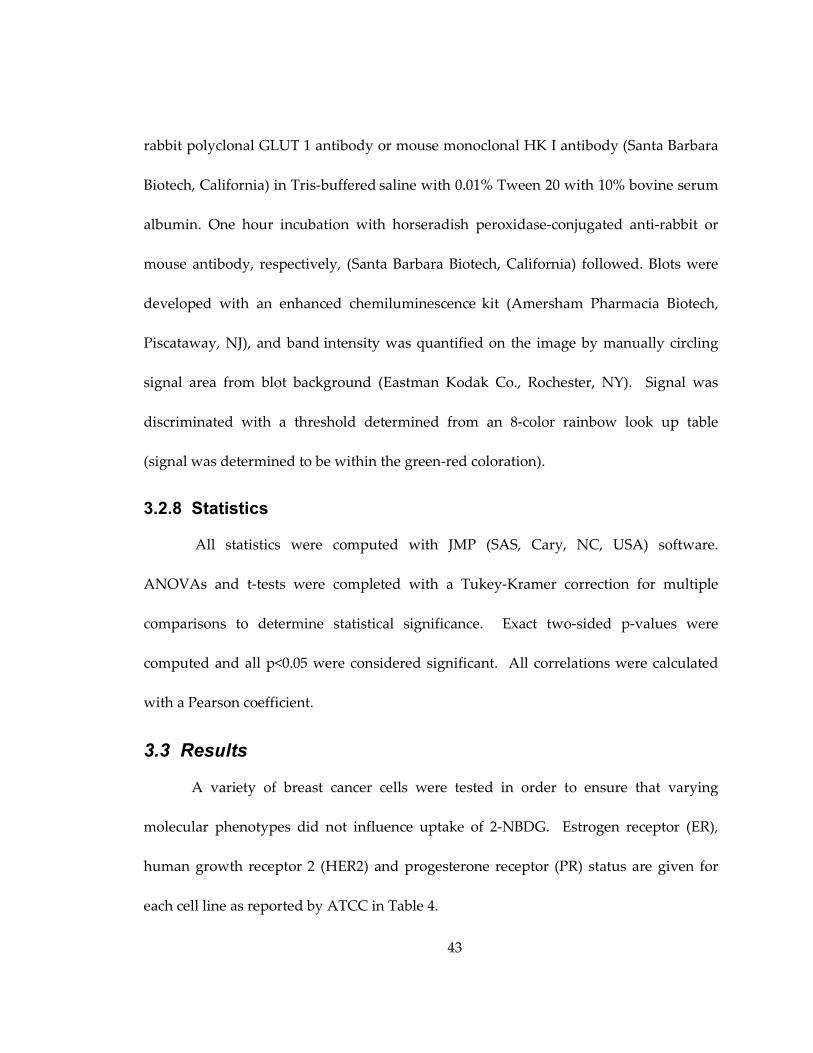
43
rabbit polyclonal GLUT 1 antibody or mouse monoclonal HK I antibody (Santa Barbara
Biotech, California) in Tris-buffered saline with 0.01% Tween 20 with 10% bovine serum
albumin. One hour incubation with horseradish peroxidase-conjugated anti-rabbit or
mouse antibody, respectively, (Santa Barbara Biotech, California) followed. Blots were
developed with an enhanced chemiluminescence kit (Amersham Pharmacia Biotech,
Piscataway, NJ), and band intensity was quantified on the image by manually circling
signal area from blot background (Eastman Kodak Co., Rochester, NY). Signal was
discriminated with a threshold determined from an 8-color rainbow look up table
(signal was determined to be within the green-red coloration).
3.2.8 Statistics
All statistics were computed with JMP (SAS, Cary, NC, USA) software.
ANOVAs and t-tests were completed with a Tukey-Kramer correction for multiple
comparisons to determine statistical significance. Exact two-sided p-values were
computed and all p<0.05 were considered significant. All correlations were calculated
with a Pearson coefficient.
3.3 Results
A variety of breast cancer cells were tested in order to ensure that varying
molecular phenotypes did not influence uptake of 2-NBDG. Estrogen receptor (ER),
human growth receptor 2 (HER2) and progesterone receptor (PR) status are given for
each cell line as reported by ATCC in Table 4.
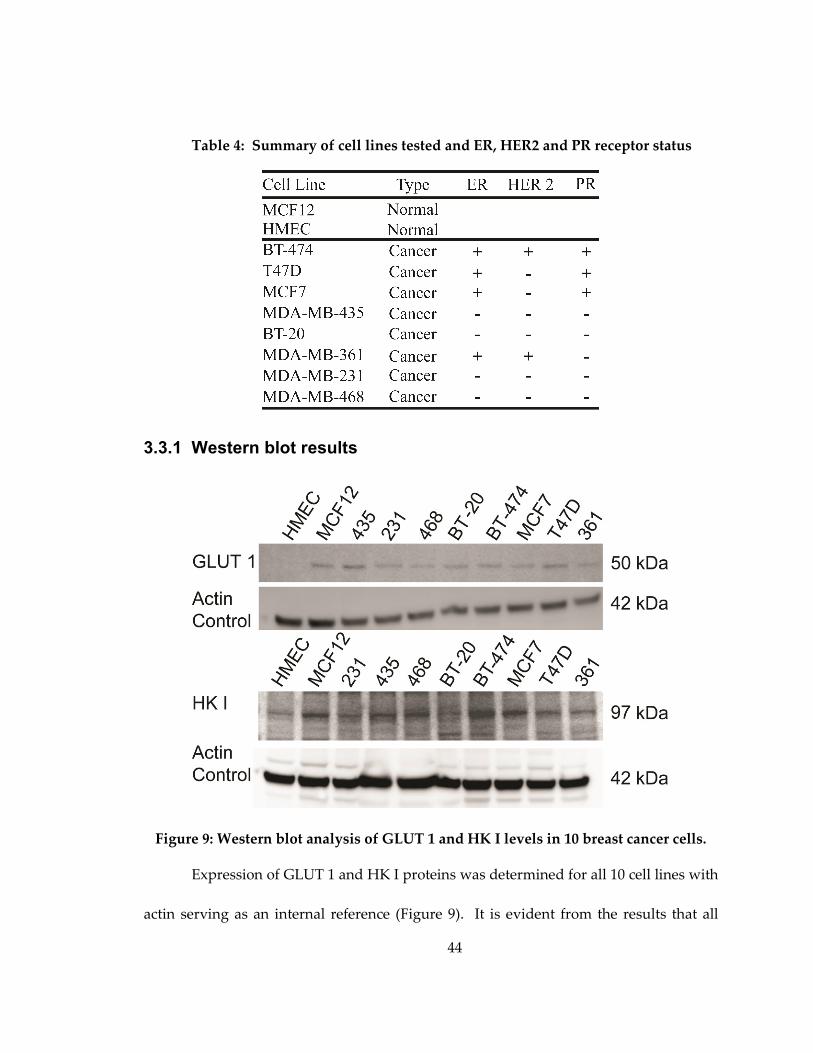
44
Table 4: Summary of cell lines tested and ER, HER2 and PR receptor status
3.3.1 Western blot results
Figure 9: Western blot analysis of GLUT 1 and HK I levels in 10 breast cancer cells.
Expression of GLUT 1 and HK I proteins was determined for all 10 cell lines with
actin serving as an internal reference (Figure 9). It is evident from the results that all
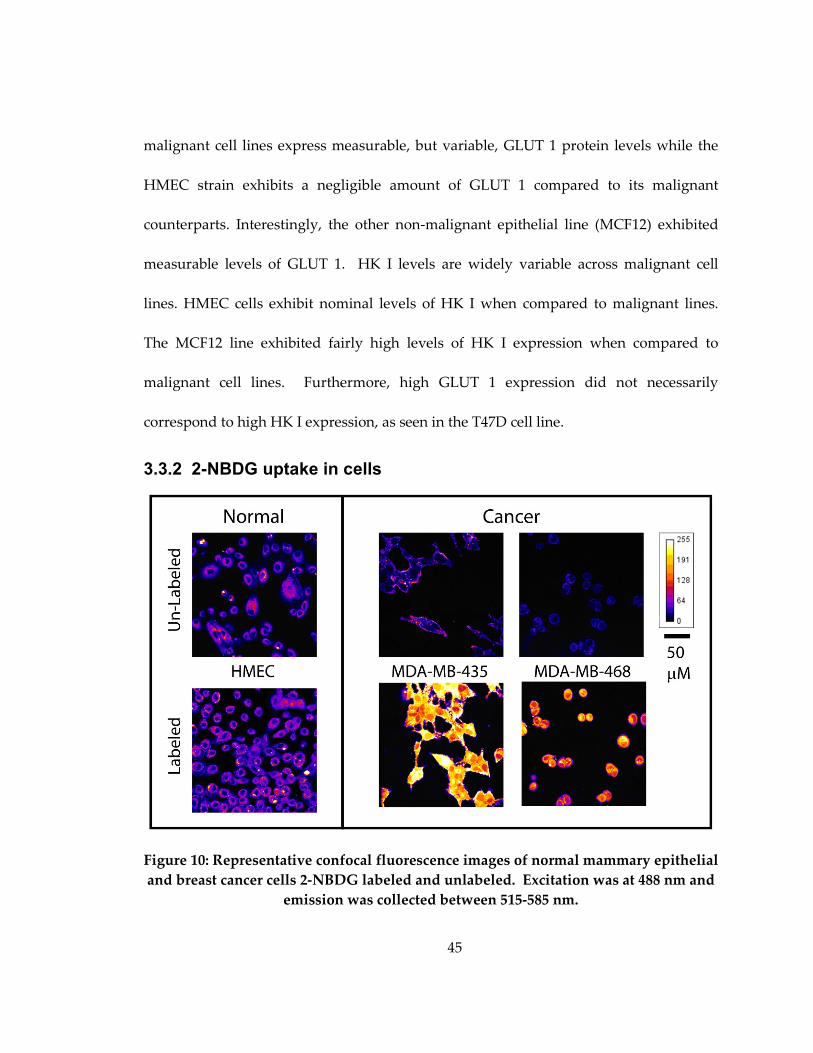
45
malignant cell lines express measurable, but variable, GLUT 1 protein levels while the
HMEC strain exhibits a negligible amount of GLUT 1 compared to its malignant
counterparts. Interestingly, the other non-malignant epithelial line (MCF12) exhibited
measurable levels of GLUT 1. HK I levels are widely variable across malignant cell
lines. HMEC cells exhibit nominal levels of HK I when compared to malignant lines.
The MCF12 line exhibited fairly high levels of HK I expression when compared to
malignant cell lines. Furthermore, high GLUT 1 expression did not necessarily
correspond to high HK I expression, as seen in the T47D cell line.
3.3.2 2-NBDG uptake in cells
Figure 10: Representative confocal fluorescence images of normal mammary epithelial
and breast cancer cells 2-NBDG labeled and unlabeled. Excitation was at 488 nm and
emission was collected between 515-585 nm.
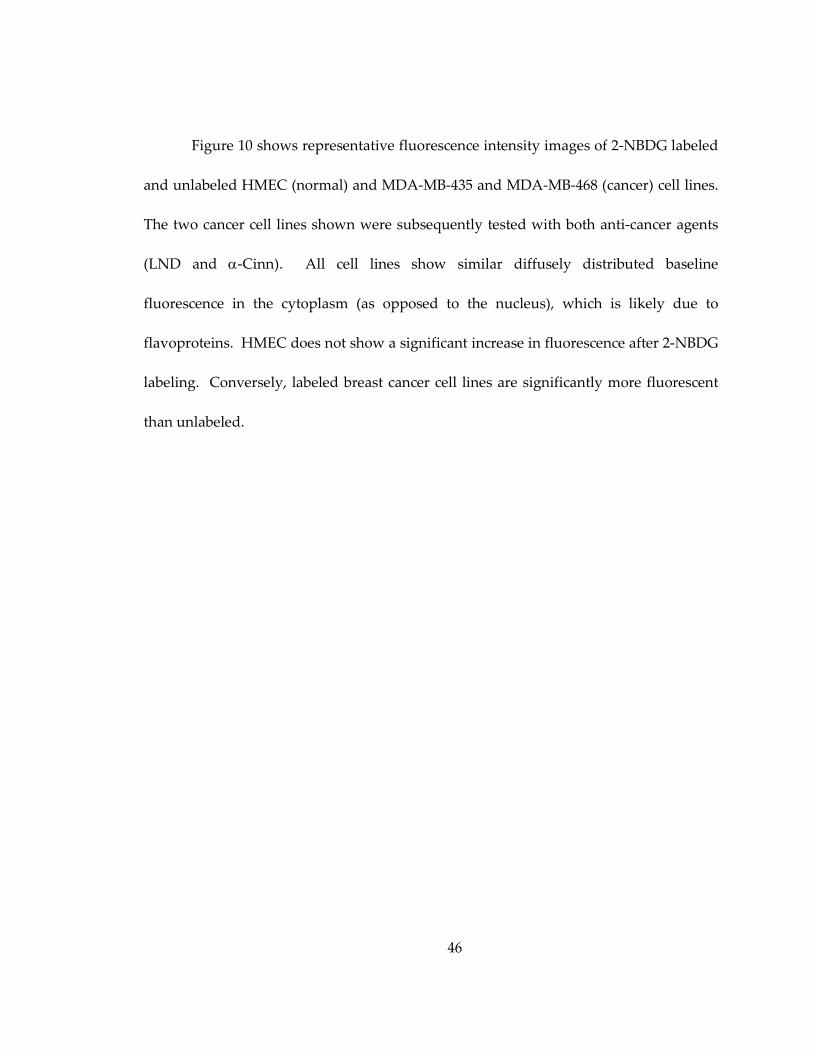
46
Figure 10 shows representative fluorescence intensity images of 2-NBDG labeled
and unlabeled HMEC (normal) and MDA-MB-435 and MDA-MB-468 (cancer) cell lines.
The two cancer cell lines shown were subsequently tested with both anti-cancer agents
(LND and α-Cinn). All cell lines show similar diffusely distributed baseline
fluorescence in the cytoplasm (as opposed to the nucleus), which is likely due to
flavoproteins. HMEC does not show a significant increase in fluorescence after 2-NBDG
labeling. Conversely, labeled breast cancer cell lines are significantly more fluorescent
than unlabeled.
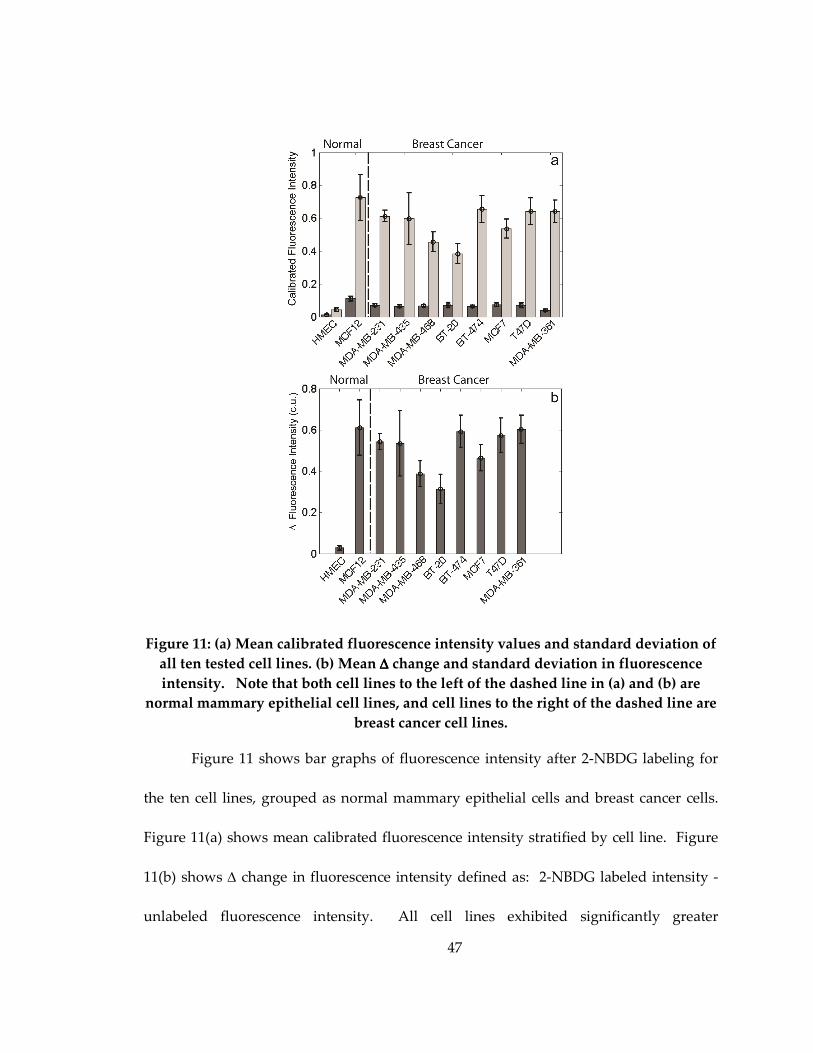
47
Figure 11: (a) Mean calibrated fluorescence intensity values and standard deviation of
all ten tested cell lines. (b) Mean ∆∆∆∆ change and standard deviation in fluorescence
intensity. Note that both cell lines to the left of the dashed line in (a) and (b) are
normal mammary epithelial cell lines, and cell lines to the right of the dashed line are
breast cancer cell lines.
Figure 11 shows bar graphs of fluorescence intensity after 2-NBDG labeling for
the ten cell lines, grouped as normal mammary epithelial cells and breast cancer cells.
Figure 11(a) shows mean calibrated fluorescence intensity stratified by cell line. Figure
11(b) shows ∆ change in fluorescence intensity defined as: 2-NBDG labeled intensity -
unlabeled fluorescence intensity. All cell lines exhibited significantly greater
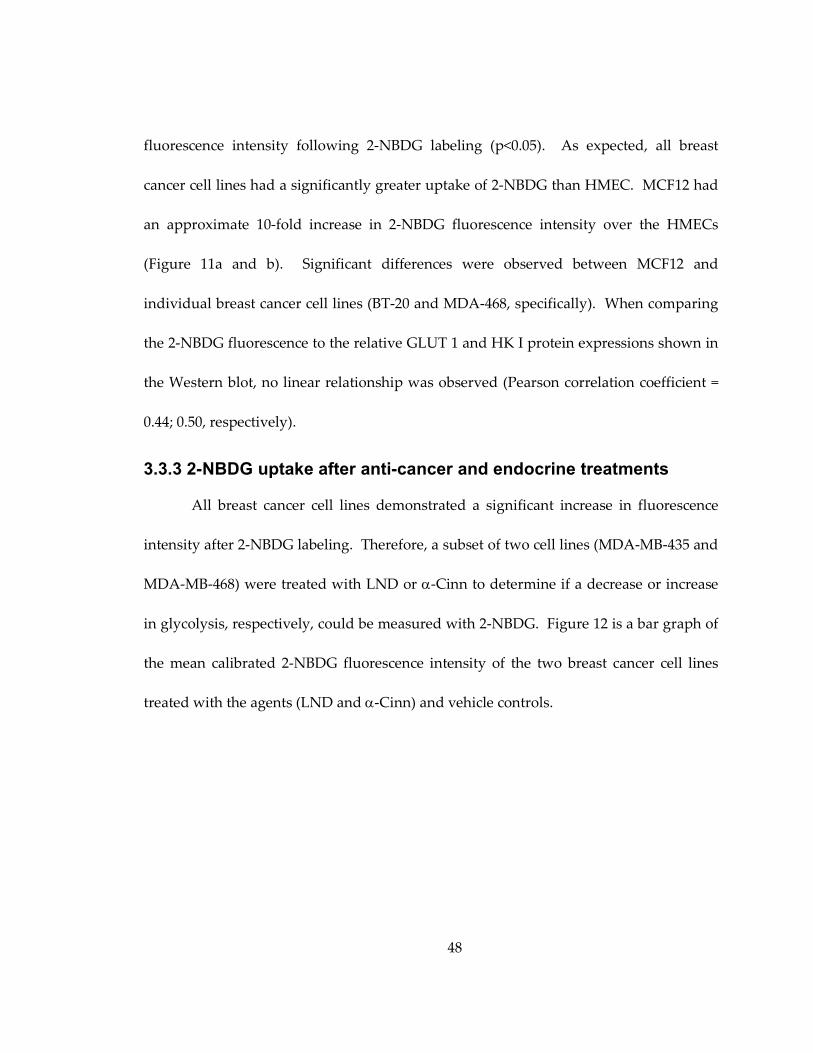
48
fluorescence intensity following 2-NBDG labeling (p<0.05). As expected, all breast
cancer cell lines had a significantly greater uptake of 2-NBDG than HMEC. MCF12 had
an approximate 10-fold increase in 2-NBDG fluorescence intensity over the HMECs
(Figure 11a and b). Significant differences were observed between MCF12 and
individual breast cancer cell lines (BT-20 and MDA-468, specifically). When comparing
the 2-NBDG fluorescence to the relative GLUT 1 and HK I protein expressions shown in
the Western blot, no linear relationship was observed (Pearson correlation coefficient =
0.44; 0.50, respectively).
3.3.3 2-NBDG uptake after anti-cancer and endocrine treatments
All breast cancer cell lines demonstrated a significant increase in fluorescence
intensity after 2-NBDG labeling. Therefore, a subset of two cell lines (MDA-MB-435 and
MDA-MB-468) were treated with LND or α-Cinn to determine if a decrease or increase
in glycolysis, respectively, could be measured with 2-NBDG. Figure 12 is a bar graph of
the mean calibrated 2-NBDG fluorescence intensity of the two breast cancer cell lines
treated with the agents (LND and α-Cinn) and vehicle controls.
49
Figure 12: (a) Calibrated mean fluorescence intensity values and standard deviation
after treatment with LND in MDA-MB-468 and MDA-MB-435 cell lines. (b)
Calibrated mean fluorescence intensity values and standard deviation after treatment
with αααα-Cinn in MDA-MB-468 and MDA-MB-435 cell lines (* denotes p<0.05)
Inhibition of HK I by LND demonstrated a significant inhibition of glucose
uptake, as indicated by the decreased 2-NBDG fluorescence (p<0.05). MDA-MB-468
demonstrated an approximate 50% decrease in 2-NBDG fluorescence intensity, whereas
MDA-MB-435 fluorescence intensity only decreased by 15%. The opposite trend was
demonstrated with α-Cinn since it directly inhibits MCT 1 preventing lactate-fueled
respiration and subsequently increases glycolysis. A significant increase in 2-NBDG
uptake, as reflected by increased 2-NBDG fluorescence, was observed. MDA-MB-468
demonstrated a greater inhibition of 2-NBDG uptake after LND than MDA-MB-435, but
increase in 2-NBDG fluorescence after α-Cinn treatment was similar (p>0.05) between
both cell lines. The increase in 2-NBDG fluorescence intensity was 20% and 25% for
MDA-MB-468 and MDA-MB-435, respectively. It should be noted that the fluorescence
50
intensity values shown in Figure 12 cannot be directly compared with the results shown
in Figure 11 since the gain on the microscope was decreased to prevent 2-NBDG labeled
cell intensity from saturating the detector in the case of data collected for Figure 12.
To ensure that 2-NBDG uptake could be influenced by indirect changes in
cellular glycolysis and not only by direct inhibition or stimulation of glycolysis, tam
sensitive (MCF7 which are ER+) and insensitive cells (MDA-MB-435 which are ER-) were
treated with 2 µM tam. Rivenzon-Segal et al. had previously demonstrated GLUT 1
inhibition after 48 and 72 hours of 2 µM of tam treatment in vitro [88]. GLUT 1
expression was measured following Western blot analysis in tam treated and vehicle
control treated MCF7 and MDA-MB-435 cell lines (Figure 13(a)).
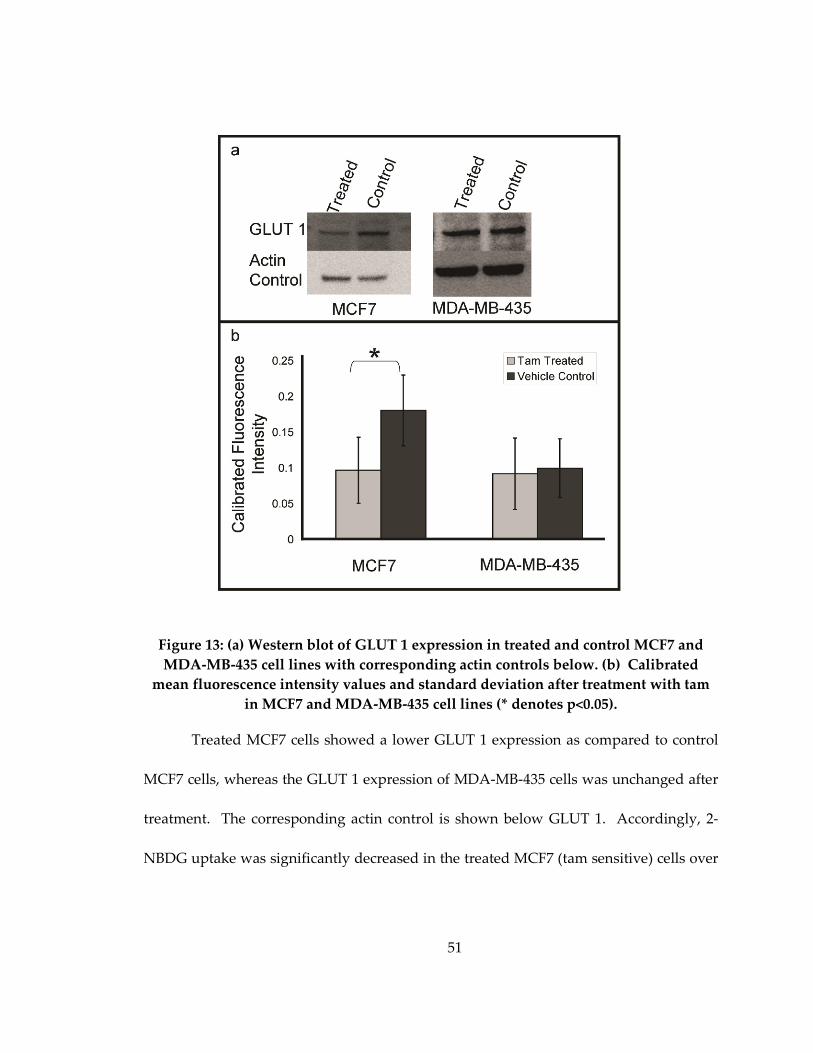
51
Figure 13: (a) Western blot of GLUT 1 expression in treated and control MCF7 and
MDA-MB-435 cell lines with corresponding actin controls below. (b) Calibrated
mean fluorescence intensity values and standard deviation after treatment with tam
in MCF7 and MDA-MB-435 cell lines (* denotes p<0.05).
Treated MCF7 cells showed a lower GLUT 1 expression as compared to control
MCF7 cells, whereas the GLUT 1 expression of MDA-MB-435 cells was unchanged after
treatment. The corresponding actin control is shown below GLUT 1. Accordingly, 2-
NBDG uptake was significantly decreased in the treated MCF7 (tam sensitive) cells over
52
control MCF7 cells Figure 13(b). 2-NBDG uptake in MDA-MB-435 (tam insensitive) cells
did not change after treatment in Figure 13(b).
3.4 DISCUSSION
This study demonstrates the ability to measure changes in glycolysis with the
uptake of 2-NBDG via confocal fluorescence microscopy after anti-cancer and endocrine
therapies. Our results showed that 2-NBDG accumulation in breast cell lines occurs in
cells that express GLUT 1 regardless of receptor status. HMEC showed relatively little
2-NBDG uptake, likely due to the very low levels of GLUT 1 expression. Previous in
vitro studies carried out with 2-NBDG have shown that GLUT 1 influences competitive
uptake using media with D-glucose, a GLUT 1 transporter specific glucose [54]. Our
study quantified protein expression of GLUT 1 and HK I and demonstrated that HMEC
expressed negligible GLUT 1 and had a significantly lower fluorescence intensity after 2-
NBDG labeling. The normal MCF12 cell line, which expressed GLUT 1, took up a
significant amount of 2-NBDG, as did all breast cancer cells. GLUT 1 is not typically
over-expressed in normal mammary epithelium [47], and we hypothesize GLUT 1
expression likely occurred during the spontaneous immortalization of MCF12 [89],
which could potentially be considered atypia since MCF12 cells have an increased
doubling time over primary normal mammary epithelium [89].
A large panel of breast cancer cells was investigated to ensure that 2-NBDG
could be used ubiquitously; all breast cancer cells demonstrated the ability to uptake 2-
53
NBDG. However, variations in overall uptake could be seen between cell lines. It is
believed to be due to differences in GLUT 1 and HK I expression and kinetics of 2-
NBDG uptake in each cell line, which was not tested in this study. Only two cell lines
were used to determine the optimal time point to examine 2-NBDG uptake. The uptake
time of 20 minutes was chosen in order to be able to image the significant contrast
between 2-NBDG labeled and unlabeled cells reasonably immediately.
Increasingly, drugs are being developed to target glycolysis [90]. To demonstrate
2-NBDG applicability to monitor breast cancer response to therapy, agents that directly
inhibit and stimulate glycolysis were used on a subset of breast cancer cell lines. HK I
protein, which is critical for glucose metabolism, was expressed in all cell lines. HK I
has previously been demonstrated to be influential in the uptake of FDG [47]. GLUT 1
was expressed in all cells lines except in the HMECs. GLUT 1 has been previously
shown to be over expressed in breast cancer [48]. GLUT 1 and HK I did not directly
correlate with the uptake of 2-NBDG in the breast cancer cell lines tested here. This
could potentially be due to the fact that Western blots are a measure of protein
expression and not the activity level. Also, several glucose transporters exist within the
cell membranes that transport glucose, such as GLUT 2.
The importance of HK I was demonstrated by directly inhibiting it with the anti-
cancer agent, LND [91]. LND decreased 2-NBDG uptake by inhibiting HK 1. The greater
inhibition in the uptake of 2-NBDG after LND treatment in MDA-MB-468 is believed to
54
be due to the higher expression of HK I. However, from these studies it is difficult to
explain specifically the basis for the differences in 2-NBDG uptake between the two cell
lines. Possible sources for these differences could include overall kinetics of the
pathways, protein activity within the cells or dosage. Further experiments are needed to
fully elucidate these differences. Nonetheless, a change in 2-NBDG uptake due to
inhibition of HK has not been previously demonstrated. To ensure that inhibition of 2-
NBDG uptake was not caused by the presence of the LND molecule, α-Cinn was also
tested. α-Cinn has been previously shown in 2-NBDG studies to increase 2-NBDG
uptake in neurons [85] and increase glucose use in SiHa cells [84], and therefore, α-Cinn
should be able to demonstrate the stimulation of 2-NBDG uptake in breast cancer.
Alternatively, examination of a single cell line with HK knockdown and MCT1
knockdown could provide further incite into the effects of LND and α-Cinn. The
opposing trends in 2-NBDG uptake seen with treatment using α-Cinn also confirm that
inhibition of LND is not caused by just the presence of the molecule and that 2-NBDG
can be used to monitor stimulation or inhibition of glycolysis.
Vehicle controls shown in Figure 12 have 200 µM DMSO and 160 µM DMSO
added to media for the LND and α-Cinn treatments, respectively. 2-NBDG labeled
controls without DMSO were tested simultaneously and compared to DMSO treated
controls (not shown) and DMSO was shown to increase overall 2-NBDG fluorescence
which reflects an increase in cell membrane permeability. Therefore the vehicle controls
55
treated with DMSO are shown in the Results (Figure 12) to control for the effect of
DMSO on 2-NBDG uptake in the LND and α-Cinn experiments.
Finally, MCF7, an ER+, and MDA-MB-435, an ER-, cell lines were treated with
tam. Tam is a commonly used endocrine therapy that specifically targets ER [68] and is
therefore a good candidate to demonstrate the applicability of 2-NBDG to breast cancer.
Tam has been shown to decrease glycolysis [88, 92, 93] and inhibit GLUT 1 in vitro in
tam sensitive cells [88]. Previous studies have also shown a decrease in glycolysis after
tam treatment by imaging FDG uptake [49, 94]. Uptake of 2-NBDG significantly
decreased after treatment in MCF7 cells, but did not change in the MDA-MB-435 cell
line. No response in the MDA-MB-435 cells showed the ability of 2-NBDG to monitor
therapy response. An independent Western blot analysis showed that GLUT 1 is
important in the uptake of 2-NBDG in breast cancer.
Our group has previously reported similar uptake of aminolevulinic acid in
MDA-MB-435, implying the cell line is similar to breast [7]. In spite of the controversy
surrounding the origin of the MDA-MB-435 cell line, the results from this study
demonstrate concordance between MDA-MB-435 and the other breast cancer cell lines
studied in terms of its uptake of 2-NBDG.
2-NBDG uptake is a simple method to monitor changes in glycolysis and
effectiveness of therapy. 2-NBDG can be further implemented in animal models to
monitor the effects of drugs that affect glycolysis over time in vivo. Sheth et al. has
56
successfully used a RFP murine dorsal window chamber model to show the overlap in
2-NBDG uptake and RFP-labeled cancer cells [53]. Dorsal window chambers with 2-
NBDG imaging would allow for longitudinal studies to examine effectiveness of
therapies that perturb glycolysis. Other possibilities for pre-clinical monitoring of in vivo
therapy could be to use spectroscopy or spectral imaging to monitor changes in 2-NBDG
uptake in solid tumors. By utilizing the 2-NBDG molecule in conjunction with confocal,
wide-field or spectroscopy systems glucose monitoring cost can be greatly reduced over
other options such as microPET.
57
4. 2-NBDG uptake can be used to discriminate hypoxia in vivo in combination with hemoglobin saturation
4.1 Introduction
Glycolysis is the first step in metabolism for all living cells. In normal tissue,
glycolysis produces 2 pyruvic acids and 2 adenosine triphosphates (ATP) [95]. These
molecules donate their electrons to produce the chemical energy that drives cellular
function. When oxygen is present pyruvic acid molecules are transferred across the
mitochondrial membrane, where the Krebs cycle and oxidative phosphorylation form 36
additional ATP molecules, which is a very efficient method of energy production [39].
However, the absence of oxygen, also known as hypoxia, prevents oxidative
phosphorylation and causes pyruvic acid to ferment into lactate resulting in a net of 2
ATP. The inefficiencies of the pathway switch caused by hypoxia increase the cellular
need for glucose, or glycolytic demand. The increase in glycolysis in the absence of
oxygen is referred to as the “Pasteur effect” [39].
Oxidative phosporylation is downregulated in cancer, but may occur with
simultaneous measureable upregulation of glycolysis even in the presence of oxygen
(aerobic glycolysis), which is commonly referred to as the “Warburg effect” [39]. The
cause of the Warburg effect has not been pinpointed and it is believed that many things
influence metabolic switch [44]. Tumors may demonstrate the Warburg effect after
oncogenic disregulation or loss of tumor suppressors. Deviation from oxidative
phosphorylation is negative to the tissue with loss of efficient energy production as with
58
the Pasteur dominated tissue (anaerobic glycolysis), but could be increasingly
detrimental if the tissue is dominated by the Warburg effect (aerobic glycolysis). In
Pasteur dominated tissue proteins to slow the rate of growth are upregulated, growth of
new vasculature is stimulated and apoptosis is inhibited [96]. Tumors that exhibit
Warburgian metabolism tend to be more likely to metastasize, cause a rapid
proliferation and radio- and chemoresistant [45, 97]. Warburgian tissue will show
increased glucose uptake while maintaining oxygenation and Pasteur tissue will have
low oxygen levels and increased glucose uptake. The differences in the tissue response
require different therapeutic strategies. For example, increased vascularization in
Pasteur tissue provides vascular epithelial growth factor (VEGF) as a therapeutic target
and anti-proliferative treatments are effective in Warburgian tissue. In reality, both
processes often occur simultaneously within a tumor and neither are positive, but
knowing the dominant metabolic processes within a tumor could increase treatment
success rates [98].
Current methods to measure glycolysis include measurement of dielectric
response [77], protein quantification [78], nuclear resonance and imaging [46, 79, 80],
microarray quantification [81] and pH responsive dyes [82]. Monitoring glycolysis
clinically uses fluoro-deoxyglucose (FDG), a radioactive glucose analog, and is detected
with Positron Emission Tomography (PET) [46]. Although these techniques have been
demonstrated to be successful in detecting increased glycolysis, the measurement of
59
glucose alone cannot distinguish between Warburgian or Pasteurian metabolic activity.
Glycolysis and simultaneous oxygenation measurements have been implemented in
multitracer whole body PET studies with FDG and fluoromisonidazole (FMISO) or
fluoroazomycin arabinoside (FAZA) [97, 99]. FMISO and FAZA are markers of hypoxia
within tissue [97, 99]. Warburgian tissue is exceedingly aggressive and would be
defined by high FDG (high glycolysis) and low FMISO (little hypoxia) [100]. An
alternative method used by Busk et al. [97] determined Warburgian versus Pasteurian
cells first in vitro by measuring lactate amounts to determine a calibration glycolysis
curve and then in tissue by combining in vivo FDG PET measurements with
immunohistochemistry quantification of hypoxia stain in both examples [97]. The
techniques using PET do not allow for high resolution imaging and
immunohistochemistry is not completed in vivo.
Utilizing optical techniques has two large advantages 1) the ability to
simultaneously measure glycolysis and oxygenation in vivo and 2) microregion analysis
of tissue to discriminate Warburgian dominated from Pasteur dominated tissue. 2-(N-
(7-nitrobenz-2-oxa-1,3- diazol-4-yl)amino)-2-deoxyglucose (2-NBDG) is an optical
contrast agent that can be used as a measure of glycolysis [50]. 2-NBDG enters the cell
via glucose transporters (GLUT), and is phosphorylated at the C-6 position by
hexokinases I-II (HK) [50]. The phosphorylated fluorescent metabolite 2-NBDG-6-
phosphate remains in the cell until further decomposition occurs into a non-fluorescent
60
form [51]. 2-NBDG can be maximally excited at 488 nm and emits at 540 nm.
Hyperspectral imaging microscopy of hemoglobin oxygen saturation (sO2) has been
previously identified to be equivalent to direct oxygenation probes [101, 102] and can be
easily combined with fluorescence imaging to characterize hypoxic tumors on a
microscopic level.
We demonstrate: (1) a novel methodology to image glycolytic demand and
tumor oxygenation in pre-clinical tumor models in vivo, (2) the ability to measure
increased glycolysis in hypoxic cells in vitro, and (3) selective uptake of 2-NBDG in vivo
in 4T1-RFP tumor compared to normal control tissue. The method developed in this
study provides the ability to characterize intra-tumoral metabolic differences and
responses to treatments. Hypoxia is used as a direct metabolic perturbation since it is a
clinical prognostic marker, and 2-NBDG uptake is used to measure the glycolytic
changes induced by simulated, chronic and cycling hypoxia. Hypoxia induced factor 1α
(HIF 1α) is simultaneously quantified with Western blot. HIF 1α and HIF 1β yield HIF
1. HIF 1 is one of the first steps towards oncogenic disregulation and is one factor that
causes increased glycolysis. It may occur in Pasteur and Warburg metabolically
mediated tissue. The cycling hypoxia model is then translated in vivo and 2-NBDG in
combination with oxygenation measurements is used to determine Warburgian
dominated tissue from Pasteurian dominated tissue demonstrating for the first time a
method to determine individual tumor therapy response.
61
4.2 Methods
4.2.1 In vitro chronic hypoxia experiment
4T1-RFP and 4T1-RFP-GFP cell lines were derived from a murine mammary
carcinoma as previously described [103]. These 4T1 cells are stably transfected to
constitutively express RFP (red fluorescent protein) or RFP and GFP (green fluorescent
protein in the presence of HIF 1α) [103], and were chosen to enable precise location of
tumor tissue in later in vivo microscopy experiments. All cells remained free of
contaminants and were propagated by adherent culture, trypsinized and plated
according to established protocols [6, 7]. 4T1-RFP cells were plated at 100,000 cells/mL
in 2 mL for all in vitro studies. Control 4T1-RFP cells were developed in an incubator
with a normoxic oxygen environment (21%) for 24 hours for all in vitro experiments.
Low oxygen levels (0.5%) in the cells were achieved in a sealed hypoxia chamber.
Simulated hypoxia was induced by treating cells with 100 µM deferoxamine (DFO) and
cobalt chloride (CoCl2) for 48 hours. Both agents prevent HIF 1α from being degraded
by oxygen dependent degradation and are good models to validate the effect of hypoxia
on cells. Chronic and cycling hypoxia were both tested to ensure equivalent cellular
responses. In vitro studies: Confocal microscopy was carried out after plating: 24 hours
for cells to attach and 48 hours after simulated hypoxia, 24 hours for cells in the chronic
hypoxia experiments and 6 hours after cycling hypoxia. Imaging sessions were
completed using previously established protocols [6, 7]. Briefly, the original cell media
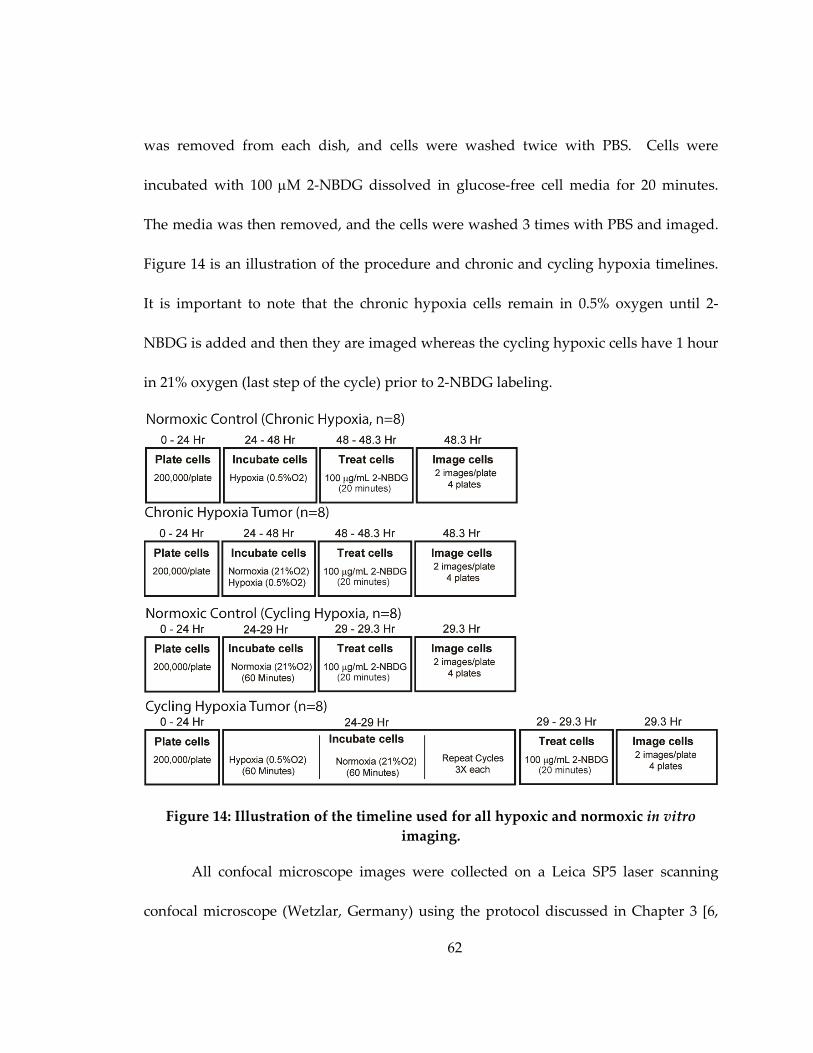
62
was removed from each dish, and cells were washed twice with PBS. Cells were
incubated with 100 µM 2-NBDG dissolved in glucose-free cell media for 20 minutes.
The media was then removed, and the cells were washed 3 times with PBS and imaged.
Figure 14 is an illustration of the procedure and chronic and cycling hypoxia timelines.
It is important to note that the chronic hypoxia cells remain in 0.5% oxygen until 2-
NBDG is added and then they are imaged whereas the cycling hypoxic cells have 1 hour
in 21% oxygen (last step of the cycle) prior to 2-NBDG labeling.
Figure 14: Illustration of the timeline used for all hypoxic and normoxic in vitro
imaging.
All confocal microscope images were collected on a Leica SP5 laser scanning
confocal microscope (Wetzlar, Germany) using the protocol discussed in Chapter 3 [6,
63
7]. Briefly, a 488 nm argon laser source (power at sample was 3.5 mW) was coupled to
an inverted Leica DM16000CS microscope with a 40X oil-immersion objective (Leica
Plan NeoFluor, NA = 1.25). Emission was collected between 515-565 nm (chosen from
preliminary spectroscopy data on 4T1-RFP cells) to prevent RFP signal from being
detected during the 2-NBDG imaging. Images were acquired with a PMT gain of 700V,
offset 0.7% and zoom of 1.6. The imaging field of view was 242 µm x 242 µm with 512 x
512 pixels per image. Two images from two distinct areas each were acquired per plate.
Sample sizes for each cell line included 2 images each for 4 hypoxic and 4 normoxic 2-
NBDG labeled plates (2 images x 4 plates = 8 samples for each type of hypoxia and 8
samples for the corresponding controls).
4.2.2 In vivo studies
All in vivo experiments were conducted according to a protocol approved by
Duke University Institutional Animal Care and Use Committee. Titanium window
chambers were surgically implanted on the back of female athymic nude mice (nu/nu,
NCI, Frederic, Maryland) under anesthesia (ketamine 100 mg/kg and xylazine 10 mg/kg
IP). A cell suspension (2.5x10⁵ cells) of 25 µL of 4T1-RFP in all experiments with 2-NBDG
or 4T1-RFP-GFP in HIF 1α measurements was injected into the dorsal skin fold prior to
placing a 12 mm diameter number 2 round glass coverslip (Erie Scientific, Portsmouth,
New Hampshire) over the exposed tissue. Conversely, normal control animals had 25
µL of saline injected. Animals were housed in an on-site housing facility with ad libitum
64
access to food and water and standard 12 hour light/dark cycles. In the baseline
experiments for each sample group, tumor and normal control, n=3 at each
concentration. In the cycling hypoxia experiments for each sample group, tumor and
normal control, n=3. A total of 18 animals are used for comparison of 2-NBDG uptake.
Experiments to determine HIF 1α expression after cycling hypoxia used n=6 animals
with 4T1-RFP-GFP implanted, half of the animals experienced cycling hypoxia (n=3) and
the others experienced normoxia (n=3).
2-NBDG was injected via tail-vein at varying concentrations (100 or 200 µg/mL
dissolved in sterile saline) at volumes of 100 µL and imaged for approximately one hour
immediately after administration of the agent. The two concentrations were evaluated
to optimize differences in 2-NBDG uptake between tumor and normal controls
(Appendix D). A concentration of 200 µg/mL demonstrated a greater difference between
tumor and normal controls and was used for all subsequent experiments to ensure
detectable changes could be measured. Cycling hypoxia experiments were then
conducted on tumor and normal animals at 200 µg/mL. Figure 15 is a timeline of the
normoxic and cycling hypoxic animal experiments.
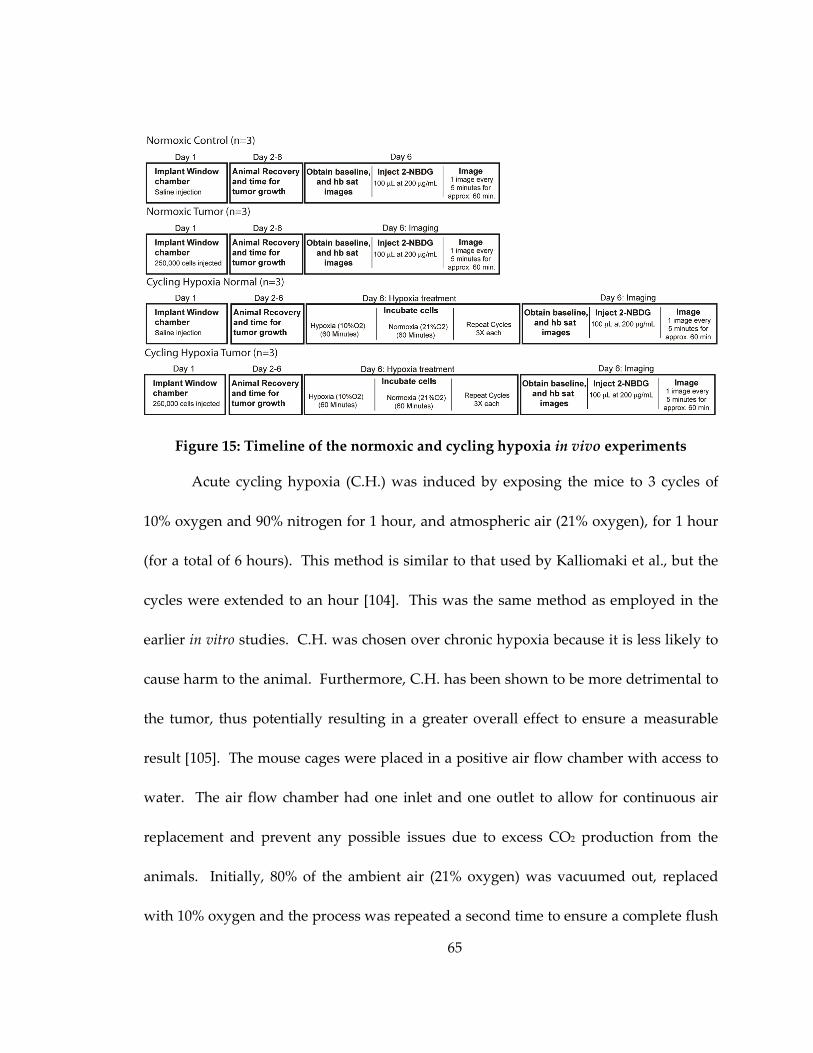
65
Figure 15: Timeline of the normoxic and cycling hypoxia in vivo experiments
Acute cycling hypoxia (C.H.) was induced by exposing the mice to 3 cycles of
10% oxygen and 90% nitrogen for 1 hour, and atmospheric air (21% oxygen), for 1 hour
(for a total of 6 hours). This method is similar to that used by Kalliomaki et al., but the
cycles were extended to an hour [104]. This was the same method as employed in the
earlier in vitro studies. C.H. was chosen over chronic hypoxia because it is less likely to
cause harm to the animal. Furthermore, C.H. has been shown to be more detrimental to
the tumor, thus potentially resulting in a greater overall effect to ensure a measurable
result [105]. The mouse cages were placed in a positive air flow chamber with access to
water. The air flow chamber had one inlet and one outlet to allow for continuous air
replacement and prevent any possible issues due to excess CO2 production from the
animals. Initially, 80% of the ambient air (21% oxygen) was vacuumed out, replaced
with 10% oxygen and the process was repeated a second time to ensure a complete flush
66
of the atmospheric air. After 3 cycles, the animal was removed and imaged according to
the methods previously discussed.
Fluorescence images of RFP and of 2-NBDG and hyperspectral images of
hemoglobin saturation were obtained for each animal in a single imaging session on an
inverted microscope (Carl Zeiss Axiovert 200) using an imaging system that was
previously characterized [106]. This allowed for localization of tumor tissue via RFP
fluorescence, and non-invasive monitoring of initial vascular sO2 and subsequent 2-
NBDG uptake over time. All images were collected with a 2.5X objective (NA = 0.075
and field of view = 10 mm).
Tumor oxygenation measurements: Two-dimensional hyperspectral images to
obtain hemoglobin saturation (as an indicator of tumor oxygenation) were collected with
a 100 W halogen lamp for transillumination, and detected with a 10 nm bandwidth
liquid crystal tunable filter (LCTF) (CRI Inc.) before a DVC 1412 CCD camera (DVC
Company) [102]. Custom software for tuning the filter and acquisition of images at 10
nm increments between 500 and 620 nm was used. Dark offset and transmission
measurements at each wavelength were made prior to each imaging session for daily
calibration. sO2 was calculated by applying an extension of the Beer-Lambert law to the
wavelength-dependent attenuation at each pixel (assuming oxygenated and
deoxygenated hemoglobin as the primary absorbers, along with a tissue scattering
parameter), and solving for sO2 with linear least-squares regression model [102]. The
67
system, software and analysis techniques have previously been validated on liquid
phantoms with an accuracy of approximately 1% [102, 106].
Fluorescence imaging: Two-dimensional fluorescence imaging was conducted in
the epi-illumination geometry with a 100 W Mercury lamp. 2-NBDG images were
collected with a 470 nm bandpass excitation filter (40 nm bandwidth) and a 510 nm
longpass dichroic beamsplitter. RFP was excited at 560 nm (40 nm bandwidth) and a
600 nm longpass dichroic beamsplitter used to prevent excitation light detection.
Fluorescence emission was collected with the same LCTF and CCD described above.
The LCTF was set to 540 nm emission for 2-NBDG imaging. For calibration all
fluorescence imaging was background corrected.
4.2.3 Image analysis
Confocal in vitro fluorescence intensity images were analyzed using NIH ImageJ
software and analyzed with methods used in Chapters 2 and 3 [6, 7]. Briefly,
fluorescence intensity for the murine mammary carcinoma cell line was determined by
manually segmenting each cell in the image and then computing the average
fluorescence intensity for all cells in the image. Background intensity was subtracted and
the resulting data normalized by a fluorescence calibration standard, which consisted of
a fluorescent bead (FocalCheck Fluorescence Microscope Test Slide #2, Invitrogen,
Carlsbad, CA, USA) measured daily to account for small changes in laser power. A total
68
of n=8 fields of view per cell line (two per sample per experimental arm) were imaged
from which the average integrated fluorescence intensity per cell line was derived.
In vivo image analysis was carried out using MATLAB (Mathworks, MA). All
images were analyzed using pre-existing MATLAB functions. For time course analysis,
the green fluorescence signal (endogenous NADH or 2-NBDG) was calculated as the
mean signal intensity within the tumor area, as defined by the red fluorescence signal
(RFP from 4T1-RFP tumor), for all concentrations of 2-NBDG. Normal control images
were analyzed using an area equivalent to approximate tumor area for all
concentrations. sO2 calculations were implemented as previously discussed by Sorg et
al. [102]. Correlations of 2-NBDG and sO2 microregions were carried out on smaller
areas of a radius of 25 pixels. The areas were chosen to ensure that the range of the
tumor or normal control hemoglobin saturation of vasculature with similar diameter
(approximately 1 square mm) and only contained 1 vessel was fully covered.
4.2.4 Western blot
Western blots were carried out according to standard procedures [87]. Briefly,
after lysing the cells, resultant protein samples were heated to 95°C for 5 min and
subjected to sodium dodecyl sulfate–polyacrylamide gel electrophoresis on 4-12%
gradient 1 mm acrylamide gels, followed by transfer to polyvinylidene difluoride
membranes for 1.5 h at 150 V with a NOVEX semi transfer unit. Membranes were
blocked for 1.5 h in Tris-buffered saline with 0.01% Tween 20, and incubated overnight
69
with primary antibody: rabbit polyclonal HIF 1α (Novus Biologicals, Colorado) in Tris-
buffered saline with 0.01% Tween 20 with 10% bovine serum albumin. One hour
incubation with horseradish peroxidase-conjugated anti-rabbit antibody, respectively,
(Santa Barbara Biotech, California) followed. Blots were developed with an enhanced
chemiluminescence kit (Amersham Pharmacia Biotech, Piscataway, NJ), and band
intensity was quantified on the image by manually circling signal area from blot
background (Eastman Kodak Co., Rochester, NY). Signal was discriminated with a
threshold determined from an 8-color rainbow look up table (signal was determined to
be within the green-red coloration).
4.2.5 Statistics
All statistics were computed with JMP (SAS, Cary, NC, USA) software. Exact
two-sided p-values were computed for differences in 2-NBDG fluorescence uptake in
vitro and at varying concentrations in tumor and normal control. All p<0.05 were
considered significant. All correlations were calculated using Pearson’s coefficient (r).
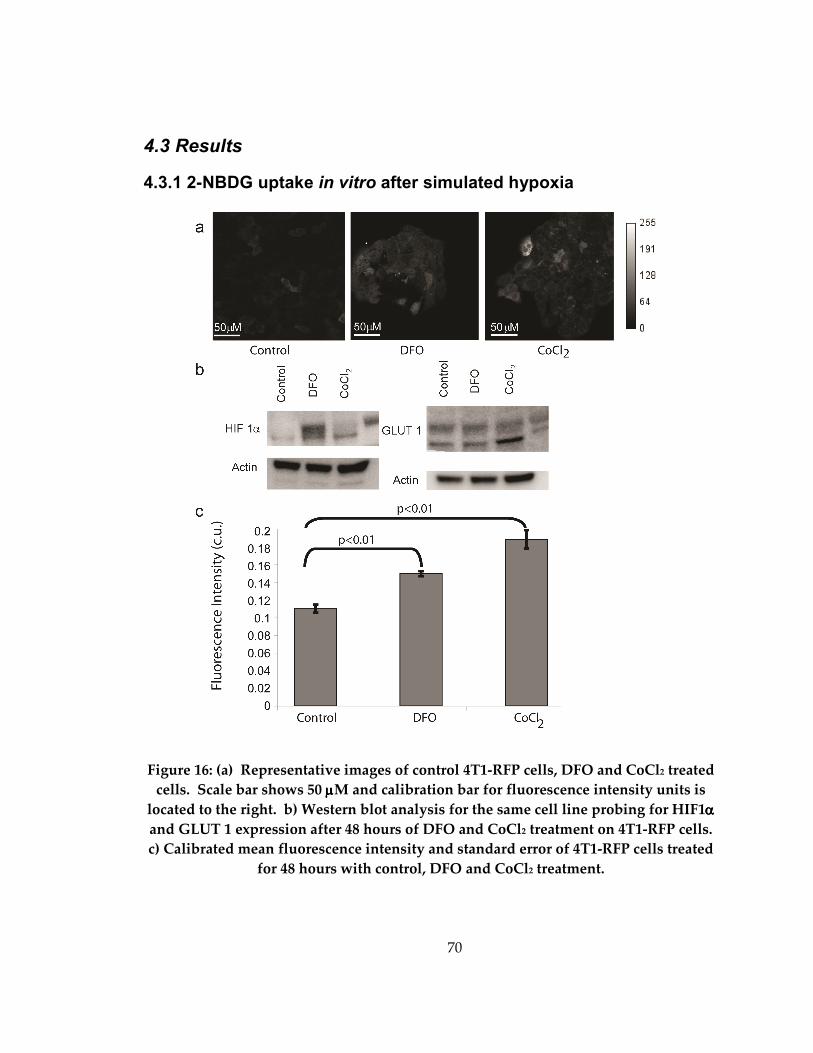
70
4.3 Results
4.3.1 2-NBDG uptake in vitro after simulated hypoxia
Figure 16: (a) Representative images of control 4T1-RFP cells, DFO and CoCl2 treated
cells. Scale bar shows 50 µµµµM and calibration bar for fluorescence intensity units is
located to the right. b) Western blot analysis for the same cell line probing for HIF1αααα
and GLUT 1 expression after 48 hours of DFO and CoCl2 treatment on 4T1-RFP cells.
c) Calibrated mean fluorescence intensity and standard error of 4T1-RFP cells treated
for 48 hours with control, DFO and CoCl2 treatment.
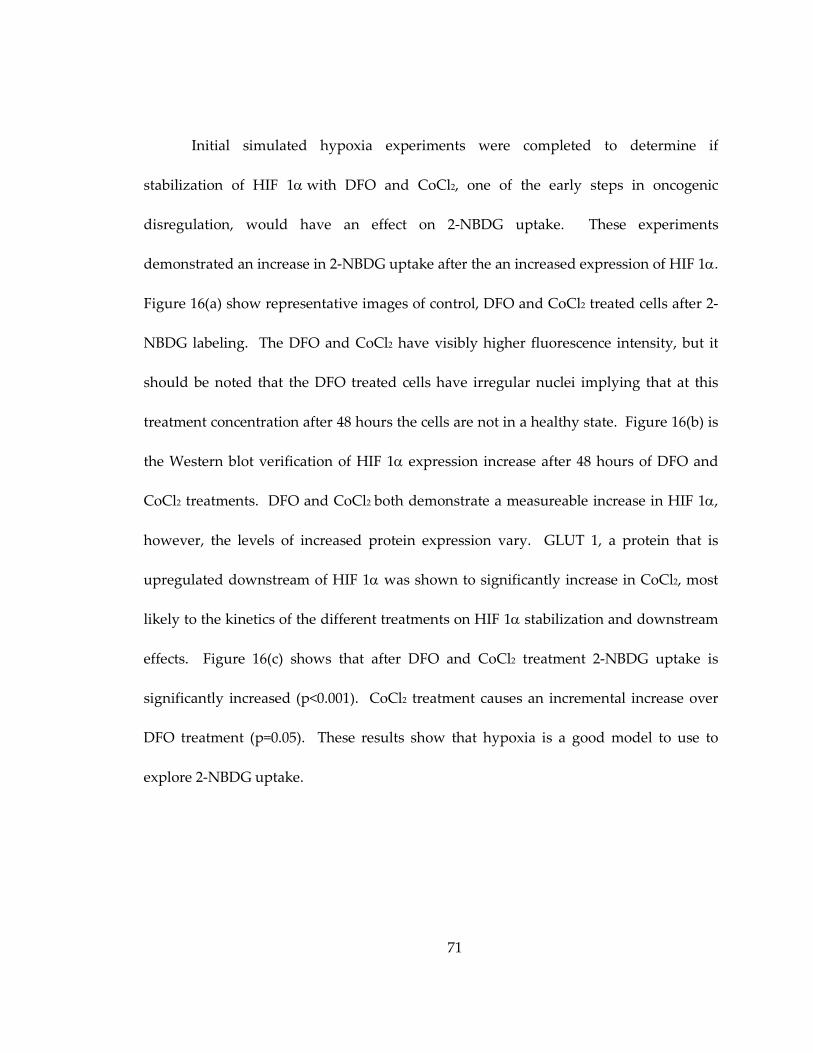
71
Initial simulated hypoxia experiments were completed to determine if
stabilization of HIF 1α with DFO and CoCl2, one of the early steps in oncogenic
disregulation, would have an effect on 2-NBDG uptake. These experiments
demonstrated an increase in 2-NBDG uptake after the an increased expression of HIF 1α.
Figure 16(a) show representative images of control, DFO and CoCl2 treated cells after 2-
NBDG labeling. The DFO and CoCl2 have visibly higher fluorescence intensity, but it
should be noted that the DFO treated cells have irregular nuclei implying that at this
treatment concentration after 48 hours the cells are not in a healthy state. Figure 16(b) is
the Western blot verification of HIF 1α expression increase after 48 hours of DFO and
CoCl2 treatments. DFO and CoCl2 both demonstrate a measureable increase in HIF 1α,
however, the levels of increased protein expression vary. GLUT 1, a protein that is
upregulated downstream of HIF 1α was shown to significantly increase in CoCl2, most
likely to the kinetics of the different treatments on HIF 1α stabilization and downstream
effects. Figure 16(c) shows that after DFO and CoCl2 treatment 2-NBDG uptake is
significantly increased (p<0.001). CoCl2 treatment causes an incremental increase over
DFO treatment (p=0.05). These results show that hypoxia is a good model to use to
explore 2-NBDG uptake.
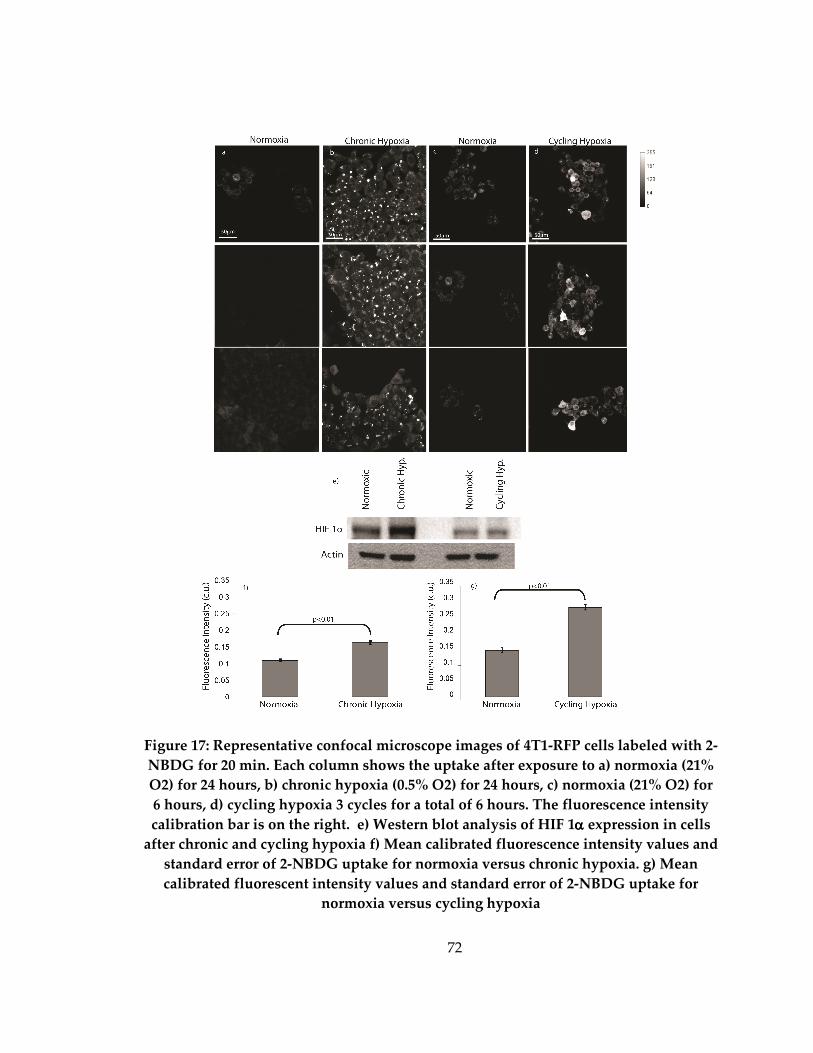
72
Figure 17: Representative confocal microscope images of 4T1-RFP cells labeled with 2-
NBDG for 20 min. Each column shows the uptake after exposure to a) normoxia (21%
O2) for 24 hours, b) chronic hypoxia (0.5% O2) for 24 hours, c) normoxia (21% O2) for
6 hours, d) cycling hypoxia 3 cycles for a total of 6 hours. The fluorescence intensity
calibration bar is on the right. e) Western blot analysis of HIF 1αααα expression in cells
after chronic and cycling hypoxia f) Mean calibrated fluorescence intensity values and
standard error of 2-NBDG uptake for normoxia versus chronic hypoxia. g) Mean
calibrated fluorescent intensity values and standard error of 2-NBDG uptake for
normoxia versus cycling hypoxia
73
Figure 17 columns (a-d) show representative fluorescence intensity images of 2-
NBDG labeled 4T1-RFP cells in normoxia for 24 hours (a), chronic hypoxia for 24 hours
(b) normoxia for 6 hours (c) and cycling hypoxia for 3 cycles for a total of 6 hours (d).
The normoxic cells have diffusely distributed fluorescence in the cytoplasm with a much
lower overall intensity than either hypoxic treatment. Small regions of fluorescence are
observed within the cellular cytoplasm (as opposed to the nucleus) in the chronic
hypoxia cells. Figure 17 (d) shows a heterogeneous uptake of 2-NBDG throughout the
images. The discrepancy between the distributions between chronic and cycling
hypoxia is most likely due to cellular health. The chronically hypoxic cells were imaged
directly after the cells were removed from 24 hours of 0.5% oxygen, while the cycling
hypoxic cells only experienced 3 hours total of 0.5% oxygen after which they would be
placed in normoxia. The cycling hypoxia cells were imaged after the third normoxic
stage. Figure 17(e) shows the HIF 1α expression after chronic and cycling hypoxia as
compared to the normoxic for each experiment. After 24 hours of chronic hypoxia a
measureable increase of HIF 1α is shown as compared to a normoxic control. Cycling
hypoxia after 3 cycles of 1 hour in hypoxia and 1 hour in normoxia (6 hours total) did
not show a measureable increase in the HIF 1α expression. GLUT 1 expression was also
probed following Western blot analysis, but no significant change was seen after chronic
or cycling hypoxia (Data not shown). Figure 17 (f) shows the mean calibrated
fluorescence intensity and standard error after 2-NBDG labeling of the chronic hypoxia
74
or normoxic 4T1-RFP cells. The chronic hypoxia cells exhibited approximately double
the 2-NBDG uptake compared to normoxic cells (p<0.01). Figure 17(g) shows the mean
calibrated fluorescence intensity and standard error after 2-NBDG labeling of the cycling
hypoxia or normoxic 4T1-RFP cells. The cycling hypoxia cells exhibited a greater
variation in 2-NBDG uptake compared to the chronic hypoxia cells. The cycling hypoxia
cells also took up a significantly increased amount of 2-NBDG over normoxic cells
(p<0.01).
4.3.2 Uptake of 2-NBDG in vivo
Animals with surgically implanted window chambers containing no tumor
(normal) and those seeded with 4T1-RFP tumor cells (tumor) were imaged for a
duration of least 50 minutes after 2-NBDG injection (n=3 tumor, n=3 normal control).
Cycling hypoxia (C.H.) was used as a direct perturbation of glycolytic need and uptake
of 2-NBDG was measured in tumor and normal. C.H. causes a direct increase in
Pasteur-dominated glycolysis [107]; thus a decrease in hemoglobin saturation and an
increase in 2-NBDG uptake should occur for all animals, tumor and normal. The
animals were subjected to 3 cycles in the hypoxia chamber (1 hour) and alternating it
with room air (1 hour) for a total of six hours. To determine the HIF 1α protein
expression after cycling hypoxia a small experimental cohort (n=3 normoxia, n=3 C.H.)
of 4T1-RFP-GFP cells were implanted used that label the HIF 1α with GFP. The GFP
signal was imaged prior to cycling hypoxia or normoxia control and again directly after
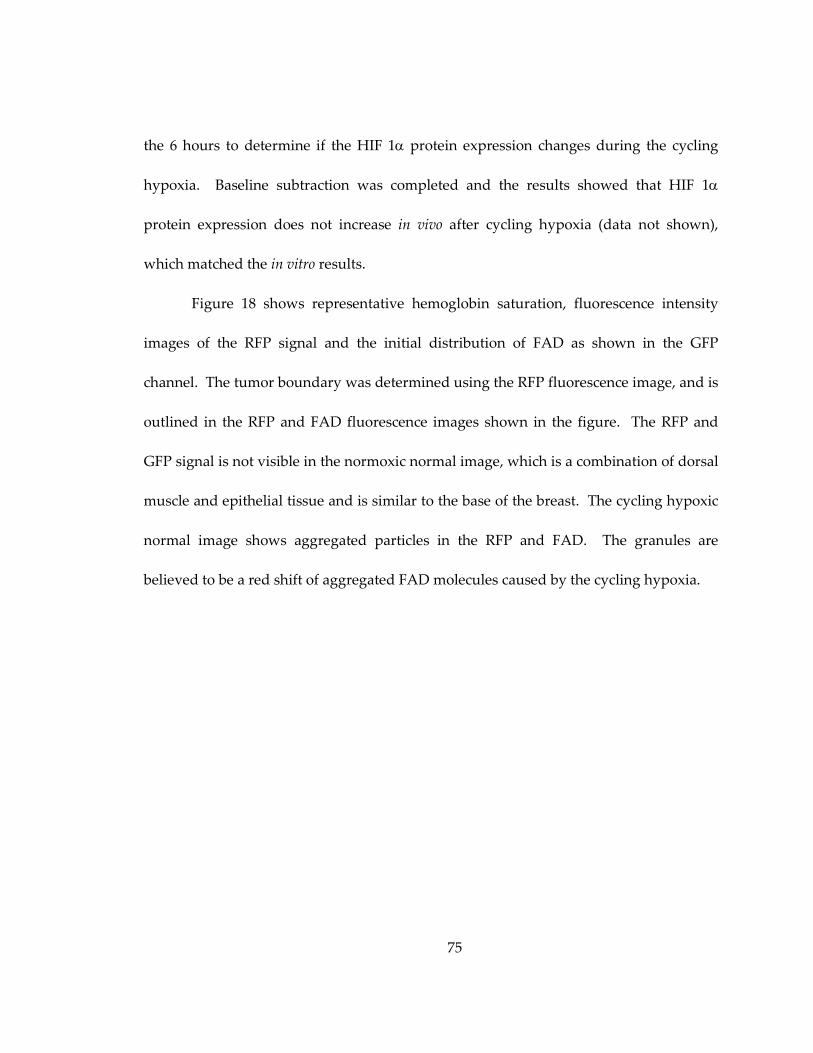
75
the 6 hours to determine if the HIF 1α protein expression changes during the cycling
hypoxia. Baseline subtraction was completed and the results showed that HIF 1α
protein expression does not increase in vivo after cycling hypoxia (data not shown),
which matched the in vitro results.
Figure 18 shows representative hemoglobin saturation, fluorescence intensity
images of the RFP signal and the initial distribution of FAD as shown in the GFP
channel. The tumor boundary was determined using the RFP fluorescence image, and is
outlined in the RFP and FAD fluorescence images shown in the figure. The RFP and
GFP signal is not visible in the normoxic normal image, which is a combination of dorsal
muscle and epithelial tissue and is similar to the base of the breast. The cycling hypoxic
normal image shows aggregated particles in the RFP and FAD. The granules are
believed to be a red shift of aggregated FAD molecules caused by the cycling hypoxia.
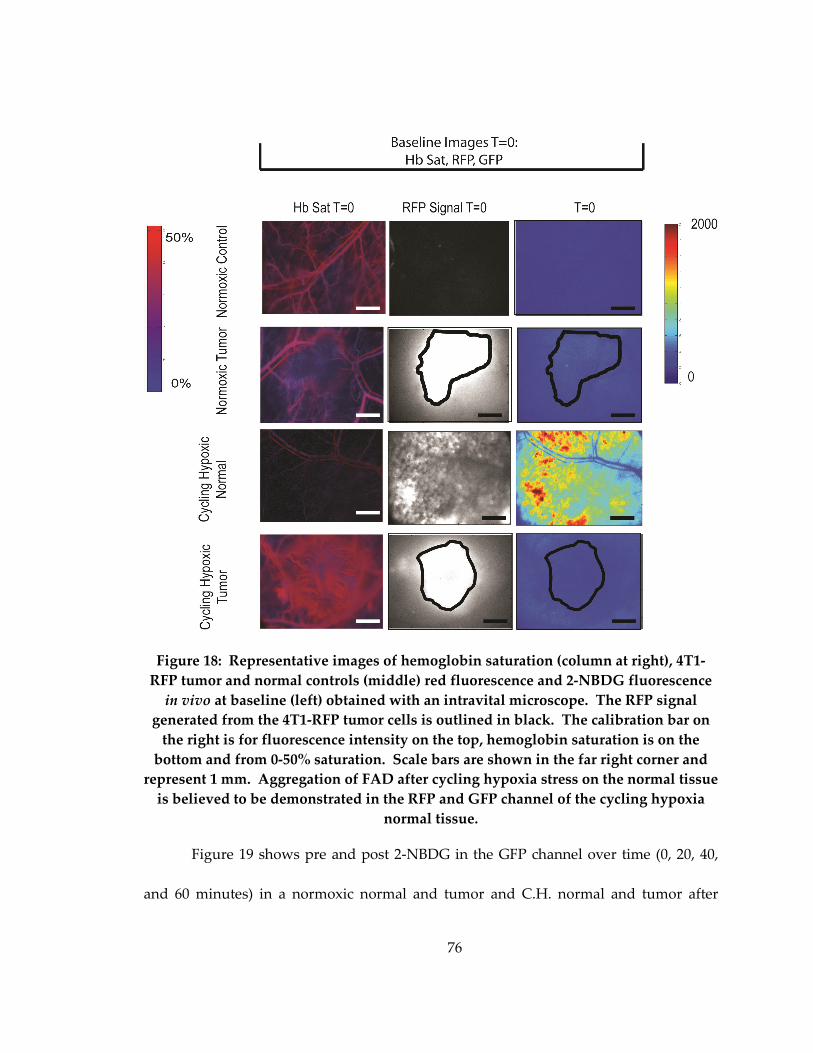
76
Figure 18: Representative images of hemoglobin saturation (column at right), 4T1-
RFP tumor and normal controls (middle) red fluorescence and 2-NBDG fluorescence
in vivo at baseline (left) obtained with an intravital microscope. The RFP signal
generated from the 4T1-RFP tumor cells is outlined in black. The calibration bar on
the right is for fluorescence intensity on the top, hemoglobin saturation is on the
bottom and from 0-50% saturation. Scale bars are shown in the far right corner and
represent 1 mm. Aggregation of FAD after cycling hypoxia stress on the normal tissue
is believed to be demonstrated in the RFP and GFP channel of the cycling hypoxia
normal tissue.
Figure 19 shows pre and post 2-NBDG in the GFP channel over time (0, 20, 40,
and 60 minutes) in a normoxic normal and tumor and C.H. normal and tumor after
77
injection of 200 µg/mL of 2-NBDG. 2-NBDG fluorescence intensity is visually brighter in
animals that have 4T1-RFP tumors than in the normal animals. The 2-NBDG
fluorescence intensity is the greatest in the 20 minute column in Figure 19 compared to
all other columns. The 2-NBDG fluorescence signal is not limited to only the tumor area
and appears to spread outward from the blood vessels located closest to the tumor. 2-
NBDG uptake is not uniform across the tumor area. Normal animals show non-uniform
2-NBDG uptake within normal tissue with at least 50% lower intensity than the 4T1-RFP
tumors.
78
Figure 19. Representative images of 4T1-RFP tumor and normal controls and
2-NBDG fluorescence in vivo over time (0, 20, 40, and 60 min) obtained with an
intravital microscope. The RFP signal generated from the 4T1-RFP tumor cells is
outlined in black at T= 0, 20, 40, 60 min after 200 mg/mL 2-NBDG tail-vein injection.
The calibration bar on the right is for fluorescence intensity. Scale bars are shown in
the far right corner and represent 1 mm
Figure 20 shows the mean change in fluorescence intensity and standard error in
fluorescence intensity in both (a) normoxic tumor and normal at 200 µg/mL (n=3 tumor;
n=3 normal) and C.H. compared to (b) normal, (c) tumor (n=3 C.H. normal; n=3 C.H.
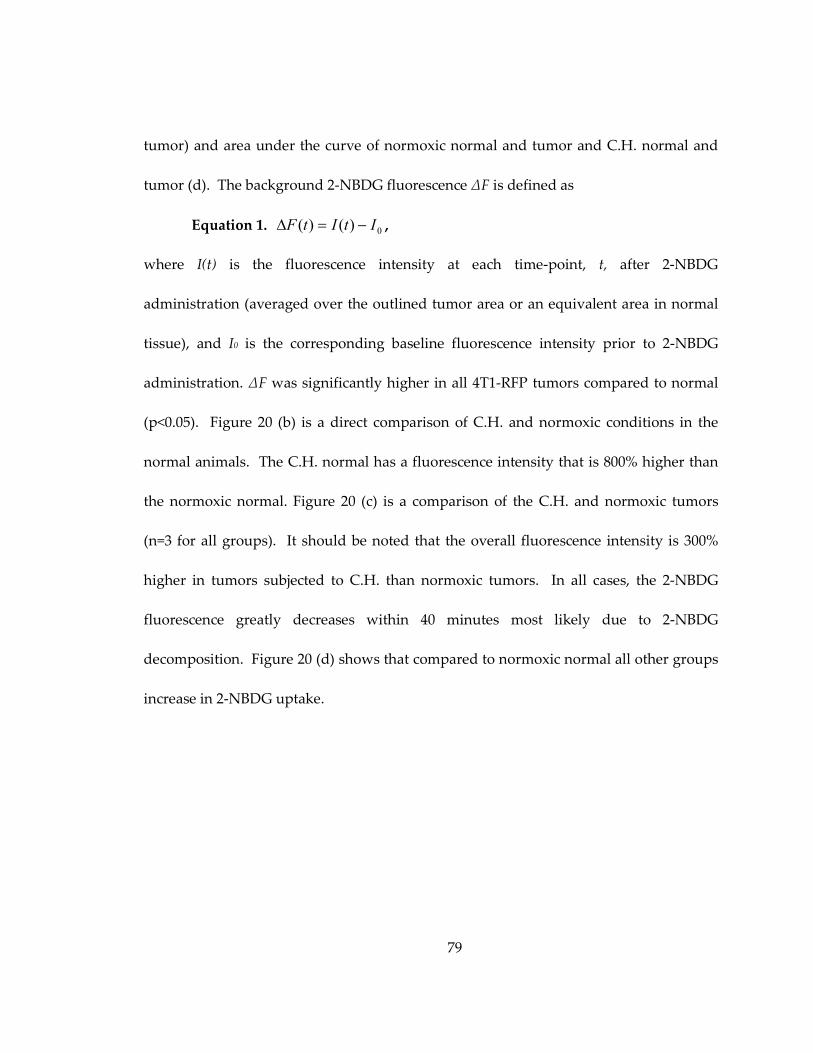
79
tumor) and area under the curve of normoxic normal and tumor and C.H. normal and
tumor (d). The background 2-NBDG fluorescence ΔF is defined as
Equation 1. 0)()( ItItF −=∆ ,
where I(t) is the fluorescence intensity at each time-point, t, after 2-NBDG
administration (averaged over the outlined tumor area or an equivalent area in normal
tissue), and I0 is the corresponding baseline fluorescence intensity prior to 2-NBDG
administration. ΔF was significantly higher in all 4T1-RFP tumors compared to normal
(p<0.05). Figure 20 (b) is a direct comparison of C.H. and normoxic conditions in the
normal animals. The C.H. normal has a fluorescence intensity that is 800% higher than
the normoxic normal. Figure 20 (c) is a comparison of the C.H. and normoxic tumors
(n=3 for all groups). It should be noted that the overall fluorescence intensity is 300%
higher in tumors subjected to C.H. than normoxic tumors. In all cases, the 2-NBDG
fluorescence greatly decreases within 40 minutes most likely due to 2-NBDG
decomposition. Figure 20 (d) shows that compared to normoxic normal all other groups
increase in 2-NBDG uptake.
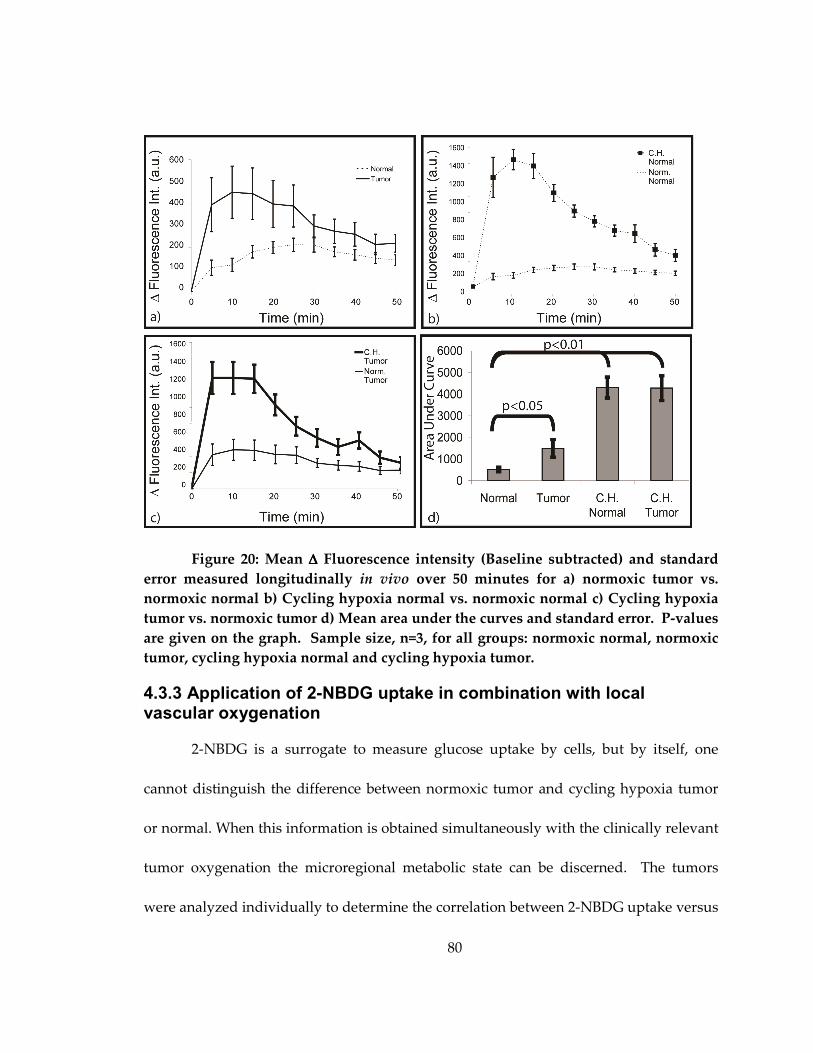
80
Figure 20: Mean ∆∆∆∆ Fluorescence intensity (Baseline subtracted) and standard
error measured longitudinally in vivo over 50 minutes for a) normoxic tumor vs.
normoxic normal b) Cycling hypoxia normal vs. normoxic normal c) Cycling hypoxia
tumor vs. normoxic tumor d) Mean area under the curves and standard error. P-values
are given on the graph. Sample size, n=3, for all groups: normoxic normal, normoxic
tumor, cycling hypoxia normal and cycling hypoxia tumor.
4.3.3 Application of 2-NBDG uptake in combination with local vascular oxygenation
2-NBDG is a surrogate to measure glucose uptake by cells, but by itself, one
cannot distinguish the difference between normoxic tumor and cycling hypoxia tumor
or normal. When this information is obtained simultaneously with the clinically relevant
tumor oxygenation the microregional metabolic state can be discerned. The tumors
were analyzed individually to determine the correlation between 2-NBDG uptake versus
81
hemoglobin saturation within microscopic regions in normoxic and C.H. tumors and
normoxic and C.H. normals. This allowed determination of tissue metabolic state
(Pasteur or Warburg). Warburg dominated tissue has been shown to be highly
aggressive and Pasteur dominated tissue is unresponsive to treatments that require
oxygen [45]; by applying these methods to monitor tumor microenvironments we could
use the information to determine pre-clinical treatment plans, as well as to monitor
therapy response. Circular microregions of approximately 400 pixels in size were
evaluated (25 pixel radius). The criteria for regions of interest were (1) a single vessel
within a region (2) approximately 1 square mm in area of vessel and approximately 3
square mm areas were chosen within the tumor or normal and compared across all
samples.
Figure 21 shows mean and standard error of sO2 (a) and 2-NBDG fluorescence
intensity (b) individually and then a scatterplot of microregional values of sO2 versus
and 2-NBDG fluorescence of normals (c) and tumors (d) between all animals tested. The
mean sO2 allows for discrimination of C.H. tumor from normal, but all other
experimental groups have similar sO2. The 2-NBDG uptake is able to discriminate
between normoxic normals and all other experimental groups. It is important to note
that the C.H. tumor and normal have similar 2-NBDG uptake which could be
concentration limited and a higher concentration of 2-NBDG may allow for
discrimination between the 2 groups. The scatterplots of the single measurements allow
82
for a much better discrimination between the experimental groups. The sO2 in the
normal tissues (normoxic and C.H.) are highly heterogeneous, whereas the normoxic
tumor tissue has a relatively low sO2 and the C.H. has abnormally high sO2. The
addition of the 2-NBDG data to the oxygenation data, a clinically measured value,
allows for the delineation of the C.H. tumor from the normoxic tumor. Without the 2-
NBDG, the C.H. data is not different in normals and tumors.
Figure 21: a) Mean and standard error of the hemoglobin saturation measurement
alone b) Mean and standard error of the ∆∆∆∆ fluorescence intensity. Hemoglobin
Saturation versus ∆∆∆∆ Fluorescence intensity c) differences in normal tissue d)
differences in tumor tissue. Each experimental group has its own symbol. Significant
differences from the normoxic normal are shown (p<0.05).
83
4.4 Discussion
This study demonstrates the use of 2-NBDG to monitor glycolytic demand in vivo
in a murine mammary window chamber model. To our knowledge, our work is the first
to establish the utility of 2-NBDG as a method to observe glycolytic demand
dynamically. This suggests a larger functional role for this contrast agent in preclinical
tumor biology than in simple tumor localization. In vitro experiments were completed
using hypoxia as a means to directly affect 2-NBDG uptake using simulated, chronic and
cycling hypoxia. 2-NBDG uptake changes in response to the same glycolytic
perturbation was validated in vivo by subjecting animals to C.H. and observing
increased uptake in both tumor and normal tissue. C.H. subjected all samples to
transient periods of low oxygenation causing an overall increased glycolytic need.
Finally, a methodology for monitoring glycolytic demand and oxygenation
simultaneously was demonstrated by measuring 2-NBDG uptake in combination with
vascular oxygenation to determine metabolic mechanisms. Most of the previous work
employing 2-NBDG in cancer [5, 50, 54] has focused on the selective uptake of 2-NBDG
in tumors as a method to detect tumor (similar to the use of FDG in clinical PET
imaging). Knowing the metabolic status of a tumor is of vital importance, for example
hypoxia present in a tumor has been shown to be determinant in treatment failure [108].
In the last chapter, changes in 2-NBDG uptake observed in breast cancer cells in
vitro were due to changes in glycolytic demand rather than overall GLUT receptor
84
expression [6]. In this chapter, simulated, chronic and cycling hypoxia in vitro caused an
increase in 2-NBDG uptake and HIF 1α was measured to determine if an equivalent
increase in protein expression was seen. Although hypoxia is known to upregulate HIF
1α [109], on the timescales used in this experiment HIF 1α expression was not increased
above baseline in the C.H. experiments in vitro or in vivo. It is more likely that the
increase in 2-NBDG uptake observed was due to multiple changes in metabolism and
not HIF 1α alone. The protein expression of HIF 1α was increased in the DFO, CoCl2
and chronic hypoxia situations implying that potentially after prolonged C.H. HIF 1α
expression may increase, but several existing metabolic proteins such as AKT, etc can
increase glycolysis and measureable increases in 2-NBDG uptake were seen prior to HIF
1α upregulation.
Having established in vitro that 2-NBDG uptake is correlated directly with
changes in glycolytic demand caused by hypoxia, we sought to prove this in vivo using
window chamber tumor models and intravital imaging. Previous cancer studies
established tumor from normal [5, 52]. A high baseline glycolytic demand was shown to
cause preferential uptake of 2-NBDG in tumor. We expanded on these studies by
directly quantifying this in vivo over time and directly comparing the results to normal
(tumor-free). The increased 2-NBDG uptake in the tumor over normal is likely due to a
combination of increased GLUT 1/HK I activity and expression in the tumors compared
to normal tissue, as well as the increased energy demand of these tumors. This is
85
consistent with the current body of knowledge regarding metabolic protein expression
in tumors [47], and has been the basis FDG work in this area [47, 97, 98]. It should be
noted that in the work presented here, the 2-NBDG uptake was in an area larger than
the only the RFP denoted tumor. Possible causes are environmental changes or
increased metabolic demand within the normal tissue caused by adjacent tumor [43].
Accumulation of metabolically active immune cells, such as macrophages or fibroblasts,
which suggests a possible interaction between the implanted tumor and host tissue,
could also be the cause. The larger generalized distribution is similar to that seen in
studies with FDG and increased uptake correlated to increasing energy usage [1].
In order to demonstrate unequivocally that 2-NBDG is useful for measuring
dynamic changes in glycolytic demand, it was necessary to perturb the system (i.e., elicit
a change in glycolytic demand) and observe the resultant effects on 2-NBDG uptake.
We chose to use a model of C.H. to create increased Pasteur-dominated glycolytic
demand in vivo [107]. C.H. was chosen because it is less detrimental to the animal than
chronic hypoxia in 10% oxygen environment. Due to the Pasteur Effect, we expect that
all tissues (tumor and normal) will exhibit increased glycolysis under low oxygen
conditions, since metabolism is shifted from oxidative phosphorylation to glycolysis
from lack of oxygen. This was in fact observed in the data. Similar results have been
demonstrated in tumor as well as normal tissue [44, 97, 110, 111]. The normal tissue that
experienced C.H. had an 800% increase in 2-NBDG uptake as well as an aggregation of
86
fluorescence in the red and green channels. This increase in 2-NBDG uptake further
elucidates that 2-NBDG uptake is caused by functional necessity and not by changes
caused by tumor anatomy such as leaky vasculature. 2-NBDG uptake by tumor tissue
was increased by 300% after C.H. The significantly greater increase in normal over
tumor is due to the higher baseline glucose usage in tumors in normoxic conditions.
This data further confirms our understanding that 2-NBDG uptake is not limited by
basal protein expression alone [6].
Finally, we present a novel application for 2-NBDG here to examine
microregions within a tumor in combination with oxygenation imaging. Although, PET
has been previously used to measure oxygenation and glycolysis [99], optical imaging
allows for resolution of microscopic tumor regions that is beyond PET capabilities. By
knowing the differences in metabolic activity between the normoxic and C.H. tumors,
the two tumors could be delineated. The added 2-NBDG data and oxygenation
elucidated the tumors that were under oxidative stress. Utilizing this information is the
next step for exploring pre-clinical models for individualized treatment plans.
Similar results to those presented here have been shown when quantifying
glycolytic demand and oxygenation using nuclear imaging techniques, namely
employing FDG for imaging glycolytic demand and fluoromisonidazole (FMISO) for
imaging tumor hypoxia [98, 99]. In a clinical study, Rajendran et al. [99] obtained FDG
and FMISO data from 49 patients with varying tumor type and determined that the
87
correlation between FDG uptake and FMISO was small r=0.24, but depended on the
tumor type [99]. Busk et al. quantified the amount of cells utilizing Warburg versus
Pasteur glycolysis pathways in vitro by measuring lactate values to create a standardized
calibration curve [98]. In vivo implementation was carried out using the FDG to quantify
glycolytic demand and the immunohistochemistry stain, pimo, to determine hypoxic
regions for Warburg or Pasteur classification [98]. Fundamentally, knowing exact
oxygenation and not only hypoxic regions as presented here gives the physician more
specific information. Also, the lower resolution capabilities of PET in these studies
prevent microregion analysis and can only determine overall tumor metabolism.
Our novel method to evaluate metabolism is able to give a direct snapshot of the
current state, but when the examining treatments and perturbations, longitudinal
studies would better evaluate the kinetic effects on metabolic mechanism in case tissue
returns to its previous metabolic state after a treatment.
This chapter successfully demonstrates the ability to cause an increase in 2-
NBDG uptake in vitro with simulated, chronic and cycling hypoxia, that 2-NBDG is a
good measure of glycolytic demand in vivo and presents a novel method to determine
Pasteur and Warburg metabolism. The applications of this method are limitless and
could help monitor treatment effectiveness. The implementation of 2-NBDG and sO2 for
glycolysis and oxygenation monitoring would be especially important for pre-clinical
studies of re-oxygenation after radiation, angiogenesis studies and chemotherapy. To
88
enhance this technique, addition of Doppler OCT and blood flow dynamics would
provide fluid distribution information throughout the tissue. Other possibilities for pre-
clinical monitoring of in vivo therapy with 2-NBDG could be probe-based spectroscopy
or spectral imaging in solid tumors. In vivo multi-modal optical measurements of
metabolic and oxygenation monitoring is a low cost alternative to nuclear methods.
89
5. Conclusions and Future Directions
5.1 Conclusions
This dissertation has explored the use of two fluorescence optical contrast agents
for functional imaging of tissue for cancer discrimination (Chapter 2, 3, 4), and therapy
monitoring (Chapters 3 and 4). Molecular optical contrast agents will be an important
tool for both cancer discrimination and therapy monitoring, especially in low resource
communities. Optical contrast agents can be easily produced, stored and applied as well
as imaged in a low-cost and efficient manner. The future of these techniques relies on
research capabilities to demonstrate their effectiveness in comparison to current
functional imaging that may not be widely available in developing regions. Two
separate optical molecular contrast agents were evaluated in this thesis to be universally
applicable to breast cancer cell lines of varying receptor status as well as discriminating
normal mammary epithelium in vitro. 2-NBDG was further explored and shown to be
able to dynamically measure glycolytic need in vitro and in vivo (Chapter 3, 4). The
combination of techniques to measure glycolytic need with oxygenation in this
dissertation demonstrated a novel method to analyze tumor metabolic activity. The
work shown here was all completed in breast cancer models, but the ability to monitor
glycolytic need is applicable to many types of cancer and by combining glycolytic need
with oxygenation information could be used to begin testing individualized treatment
planning in pre-clinical models.
90
First, ALA-induced PpIX was determined to be a method to discriminate breast
cancer cells from normal mammary epithelial cells that was insensitive to receptor
status. Breast cancer heterogeneity causes issues in breast cancer detection. Although
mammograms are excellent for determining breast density and breast structure,
differences in density and overall breast composition between women can create
misdiagnoses. By using techniques that depend on tissue function and added
fluorescence contrast, sensitivity and specificity can be increased in cancer diagnosis. ER
positive cells account for 60% of diagnosed breast cancers and HER 2+ only 20%. If ALA
was sensitive to receptor status, the patient population that this procedure of detection
could be applied would be vastly reduced. By examining a large number of cell lines,
the applicability of ALA-induced PpIX for breast cancer was determined.
To remove the large influence of FAD on the measured tissue a method of post-
administration spectroscopic analysis was determined. FAD is much brighter in normal
tissues and when the tissue is excited at 405 nm, bleed through of the FAD signal may
occur. This was not an issue in the in vitro intensity measurements because the initial
baseline fluorescence was removed. In surgery, images before and after ALA
administrations are not an option and only post-administration measurements could be
made. Therefore, the method of spectroscopic analysis demonstrated here greatly
improved the clinical applicability of this molecular contrast agent. Even so, the
incubation period required for ALA to form PpIX in the mitochondria (several hours)
91
was clinically impractical. 2-NBDG was pursued as an alternative functional contrast
agent in further studies because it had been shown to have a short incubation period
[54], ability to be taken up in tissues ex vivo [52] and was determined to be similar to the
widely used clinical agent, FDG [5].
2-NBDG is dependent on cellular glucose uptake and this dissertation explored
the ability to dynamically monitor glucose need in vitro and then in vivo. Multiple breast
cancer cell lines were used in the first portion of the 2-NBDG study. The results show
that 2-NBDG intensity is not affected by the receptor status of the breast cancer, similar
to the ALA study, and therefore could be applied as a ubiquitous technique to breast
cancer. Immortalized normal mammary epithelial cell lines were also examined in this
study to determine cancer specificity. The MCF12 had a 2-NBDG uptake similar to all
breast cancer cell lines, while HMEC did not. The presence of GLUT 1 in the MCF12 and
its corresponding absence in HMEC demonstrated that the uptake of 2-NBDG is
dependent on glucose transporters, which are not typically expressed in normal tissue
[48]. The expression of GLUT 1 and the phosphorylating enzyme HK I did not show
any linear correlation with 2-NBDG uptake. For this reason, it was hypothesized that
the 2-NBDG uptake required GLUT 1 expression. However, the uptake of 2-NBDG was
not necessarily dependent on GLUT 1 expression, but was dependent on GLUT 1
activity. Anti-cancer therapies that caused a direct increase and decrease in glycolytic
need were explored. One therapy, LND, directly inhibited mitochondrial bound HK
92
and 2-NBDG phosphorylation, decreasing the ability for cellular 2-NBDG uptake. The
second agent, α-Cinn binds to MCT1 preventing lactate from entering the cell and being
used as a fuel source for oxidative phosphorylation causing a direct increase in
glycolytic need. 2-NBDG uptake was found to increase accordingly. Interestingly, the
LND was a direct inhibition of the cell’s ability to take in and metabolize 2-NBDG and
demonstrated that the HK enzyme was vital for 2-NBDG uptake. α-Cinn implied that 2-
NBDG could be used to measure functional information such as cellular reactions to
therapy. The next step was to directly test the responsiveness of cellular 2-NBDG
uptake with glycolytic need. The endocrine therapy, tamoxifen, was used to treat ER+
(responders) and ER- (non-responders) cells, and it has also been shown to directly
decrease GLUT 1 expression in responsive cells. The results showed 2-NBDG uptake
did not change when hormonal therapy was applied to non-responsive cells, while it did
decrease in the responder cells. The ability to monitor glycolytic changes is crucial in
therapy monitoring. These findings further justified the significance of 2-NBDG and the
impact it could make in non-invasive therapy monitoring.
Finally, 2-NBDG was translated to an in vivo murine window chamber model. In
this chapter, a novel method of using 2-NBDG in concert with oxygenation
measurements was demonstrated and showed that the combination of parameters
allowed for post-hoc discrimination of normoxic tumors from cycling hypoxic tumors.
The use of only hemoglobin saturation, a conventional measurement, would not have
93
allowed for tumor discrimination and addition of 2-NBDG uptake measurements was
proven invaluable. Hypoxia has been previously shown to increase glycolysis, but the
effect of hypoxia on cellular 2-NBDG uptake was validated on a cellular model by using
DFO and CoCl2 to stabilize and cause HIF 1α upregulation. Secondly, this effect was
demonstrated in a cellular chronic hypoxia model. However, to apply a forced hypoxic
technique in vivo, cycling hypoxia was used and it showed an increased cellular
glycolytic need in vitro and in vivo with an increased uptake of 2-NBDG, but this effect
preceded the upregulation of the metabolic protein, HIF 1α. The increases demonstrated
here are most likely the result of Pasteur mediated metabolism causing a direct switch
from oxidative phosphorylation to glycolysis due to lack of oxygen before protein
upregulation. These results show the importance and ease of applying 2-NBDG to pre-
clinical models. 2-NBDG gives the researcher the ability to determine the glycolytic
need of the tissue in vivo and in combination with hyperspectral oxygenation imaging
allows tumor microenvironment exploration which potentially could be used for
preclinical therapy monitoring.
5.2 Future Directions
The ability to measure increased or decreased glycolytic need speaks directly to
clinical applicability and current clinical problems. Ideally, 2-NBDG would be
applicable for an ex vivo diagnostic test. The functionality of 2-NBDG is not unique and
2-NBDG uptake and behavior in tissue is very similar to FDG, which is a standard in
94
current medical practice. FDG has shown itself to be invaluable in cancer patient
prognosis, diagnosis and therapy monitoring [1]. 2-NBDG has the potential to make the
same impact, especially in areas such as developing countries and rural communities
that do not have access to facilities with PET-FDG or ability to pay the cost for FDG.
However, 2-NBDG toxicity and drug approval is needed prior to use in vivo in humans.
2-NBDG is an optical molecular contrast agent that could be used for basic science to
determine glycolytic kinetics without therapeutically effecting the cancer, a tool for
probe based fluorescence measurements, pre-clinical treatment analysis and in ex vivo
clinical specimens.
5.2.1 2-NBDG cellular characterization
Basic science research on 2-NBDG uptake and cellular location should further be
explored. The chronic and cycling hypoxia studies shown in Chapter 4 demonstrated
large variations in 2-NBDG uptake and cellular retention. In the chronic hypoxia, the 2-
NBDG distribution was very pointed whereas the cycling hypoxia had 2-NBDG
diffusely spread throughout the cells. The variations in the distribution were explained
by the differences in experimental timeline. However, further study in to the exact
locations and higher resolution cellular studies should be conducted. This could be
easily implemented by utilizing stains to co-localize known cellular components such as
Hoechst staining for cellular membranes and DAPI for cell nuclei. I hypothesize that in
95
healthy cells the 2-NBDG will be more diffusely spread out throughout the cytosol,
similar to that seen in the cells in Chapter 3.
Alternatively, basic studies using chemoresistance will be important using 2-
NBDG techniques. Cell lines such as chemoresistant and non-resitstant MCF7 should be
tested to determine if the change in 2-NBDG denotes responders from non-responders.
Hypothetically resistant will not change their 2-NBDG uptake after therapy whereas
non-resistant cells will show a change similar to that exhibited in Chapter 3 in the
tamoxifen ER+/- studies. This is a singular step forward toward further verification of
the use of 2-NBDG in applications towards therapy monitoring, but more than this
would be required of a whole study.
5.2.2 2-NBDG for use in determining glycolytic kinetics
A specific in vitro study of interest is to determine the changes in glycolysis over
time and their effect on 2-NBDG uptake. Hypoxia was stimulated using deferoxamine
(DFO) and cobalt chloride (CoCl2) chemical upregulation of HIF 1α on 4T1-RFP cells in
Chapter 4. Both of these chemicals stabilizes HIF 1α by preventing oxygen
dependendent degradation [112]. In these preliminary tests, cells were treated at 100 µM
of DFO and CoCl2 for 48 hours and then imaged. In the 4T1-RFP cellular model in vitro
it was found that both DFO and CoCl2 caused a significant increase in 2-NBDG uptake
after this incubation period, p<0.01 (Chapter 4). The CoCl2 treated cells had a marginally
greater increase of 2-NBDG uptake (p=0.05). When the cellular environment was
96
analyzed with Western blot techniques, the upregulation of HIF 1α was present mainly
in the DFO treated cell line, and the downstream upregulation of GLUT 1 had occurred
only in the CoCl2 treated cells, as shown in Chapter 4. Increased GLUT 1 expression has
been shown be a downstream effect of HIF 1α. The results of the simulated hypoxia
experiment suggest that 2-NBDG uptake increases incrementally as proteins become
upregulated. This model could be used to see if 2-NBDG uptake increases after HIF 1α
stabilization, and then again after downstream GLUT 1 and HK, which was not tested,
increase. I hypothesize that within a single cell line 2-NBDG uptake can be increased
incrementally by changing protein expression that directly effects glycolysis over time
such as HIF 1α expression first and the downstream protein expression (GLUT 1 and
HK, specifically). If so, 2-NBDG could be used longitudinally to monitor tissue to
determine increased metabolic behavior associated with cancer.
5.2.3 Pre-clinical models of therapy
Longitudinal studies with 2-NBDG and oxygenation are more useful in
measuring tissue changes after therapy. By using the combined capabilities, tissue
reaction to radiation treatment could be studied. By examining the different reactions of
tumors and determining the glycolytic tissue demand, individualized treatment plans
could be developed. Example hypotheses that could be tested are the following, but not
limited to: 1) radiation is only useful in the presence of oxygen and therefore, if the
cancerous tissue is de-oxygenated radiation may not show any changes in 2-NBDG after
97
treatment 2) a tumor that is extremely glycolytic, takes up a lot of 2-NBDG and is
oxygenated, the tumor will most likely be more aggressive, have higher proliferation
rates and increase in size at a greater pace than a tumor with low 2-NBDG uptake.
Correlating responder predictions could be developed non-invasively by using 2-NBDG.
5.2.4 Fiber based probe 2-NBDG detection
Our group has developed a Monte Carlo technique that allows for fluorescence
intensities to be separated from tissue at depths up to 2 mm. Previous work in this area
has been used to determine the redox ratio of tissue [113]. However, probe based
fluorescence measurement could be directly applied to measure 2-NBDG accumulation.
2-NBDG accumulation would correlate directly with glucose uptake within the tissue,
delineating tumors. Clinically, the use of probes could improve patient quality of life by
greatly reducing the invasiveness of the surgery. Furthermore with development of
different probes that explore different depths and areas around the tissue with the
corresponding fluorescence mathematical models, a map of the tissue could be
completed from a single biopsy needle insertion. Simultaneously, by measuring diffuse
scattering from the tissue, oxygenation could be measured to make a single probe
placement. I hypothesize that probe-based measurements will demonstrate 1) 2-NBDG
fluorescence can be easily measured and quantified with probe-based technology and 2)
similar results to those demonstrated in this thesis will be obtained where increases in
glycolysis will correspond with increases in 2-NBDG uptake.
98
Early pre-clinical work validation would be required. Possibly completed by
injecting 2-NBDG via tail-vein injection into a mouse flank tumor model and
demonstrating an increased uptake of 2-NBDG in the tumor flank area and
perturbations, such as cycling hypoxia, to understand the limitations of the probe based
method of measuring 2-NBDG.
A second pre-clinical model that is well developed by our group [113] would be
the squamous cell epithelial model in the hamster cheek pouch. Our group has
previously shown that with intrinsic fluorophores a switch from oxidative
phosphorylation to glycolysis could be measured. It would be similarly interesting to
see if 2-NBDG can be used to validate this measurement and compare it to 2-NBDG
uptake and then determine if 2-NBDG better determines pre-cancer from cancerous or
the varying grades of cancer. I hypothesize the pre-cancerous redox ratio changes seen
in this model will correspond with increases in glycolysis and 2-NBDG uptake. This
could be completed with a probe based system or a microscopy system, but it is
important for the tumor model to match the capabilities of the probe, as in other probe
based studies.
5.2.5 2-NBDG for use in pre-clinical margin assessment models
By implementing different models, 2-NBDG could serve different functions. For
example, by using a spontaneous sarcoma murine model, the ability of 2-NBDG for
margin detection could be assessed. This would provide: 1) the ability to avoid tissue
99
host interaction caused by tumor implantation which is possibly seen in the flank and
window chamber model and 2) a model with infiltrating cancer cells. The tumor
margins and edge of fluorescence should correlate with histology, but may not directly
overlap because acidification or effects of the cancerous tissue to the surrounding tissue
may influence surrounding normal uptake. If the tumor margins did correlate directly
with histology, this could imply that the tissue surrounding the sarcoma has pre-
cancerous changes that are potentially detectable and related to changes in glycolytic
need; similar to the squamous epithelial model previously discussed that could also be
implemented for use in 2-NBDG margin detection for skin cancer. I hypothesize that the
2-NBDG distribution will exceed that of cellular infiltration and early metabolic changes
will be apparent in this model as seen by increased 2-NBDG uptake in normal tissue.
5.2.6 Ex vivo clinical samples
Ideally, in the long-term 2-NBDG could be directly applied to ex vivo clinical
sample biopsies. The uptake of 2-NBDG could be measured and correlate to patient
treatment response, prognosis or prediction of disease, but further development such as
that discussed in early sections would be necessary to develop the kinetics of 2-NBDG to
see if it can be used for pre-clinical diagnosis, how accurate 2-NBDG is in ex vivo samples
and if uptake is representative of disease state, etc. Being able to complete simple
measurement on 2-NBDG uptake with ex vivo tissue could have a large impact in low
100
income areas where hand held fluorescence measuring devices can potentially be
implemented on a simple cell phone platform.
2-NBDG has been shown to be able to distinguish changes in glycolytic
responses in vitro (Chapter 3). Initial studies could be developed by collecting clinical
RPFNA samples and correlating its short-term breast cancer risk, which is clinically
meaningful, to the cellular 2-NBDG uptake. The next step for this technique is to
eliminate the current scientific challenges. One of the main scientific challenges is
sample preparation. Sample preparation is important and issues such as removal of red
blood cells and separation of epithelial tissue from lipids will need to be directly
addressed prior to 2-NBDG protocol development. Another developmental challenge is
the amounts of cells low risk women typically have removed such procedures. I
hypothesize that women at high risk will have increased glycolysis.
Following complete protocol development, several administrative challenges
also exist for this study prior to implementation in the clinic as discussed in the
introduction section about diagnostic test requirements. The cost analysis of this
technique must prove that it provides as much diagnostic information as the current
standard of care as well as cheap to conduct and reproduce. If this technique cannot be
conducted in a more cost-effective manner than current pathologists then it will never be
adopted.
101
The future directions for the applications of 2-NBDG to impact clinically relevant
problems are wide open. 2-NBDG can be currently applied to address many pre-clinical
issues and ex vivo clinical tissue, but some more mechanistic data is required prior to in
vivo human administration. The greatest potential for 2-NBDG lies in its cost-effective,
low technology requirements by which to detect, produce and store it, making the most
impact in developing countries.
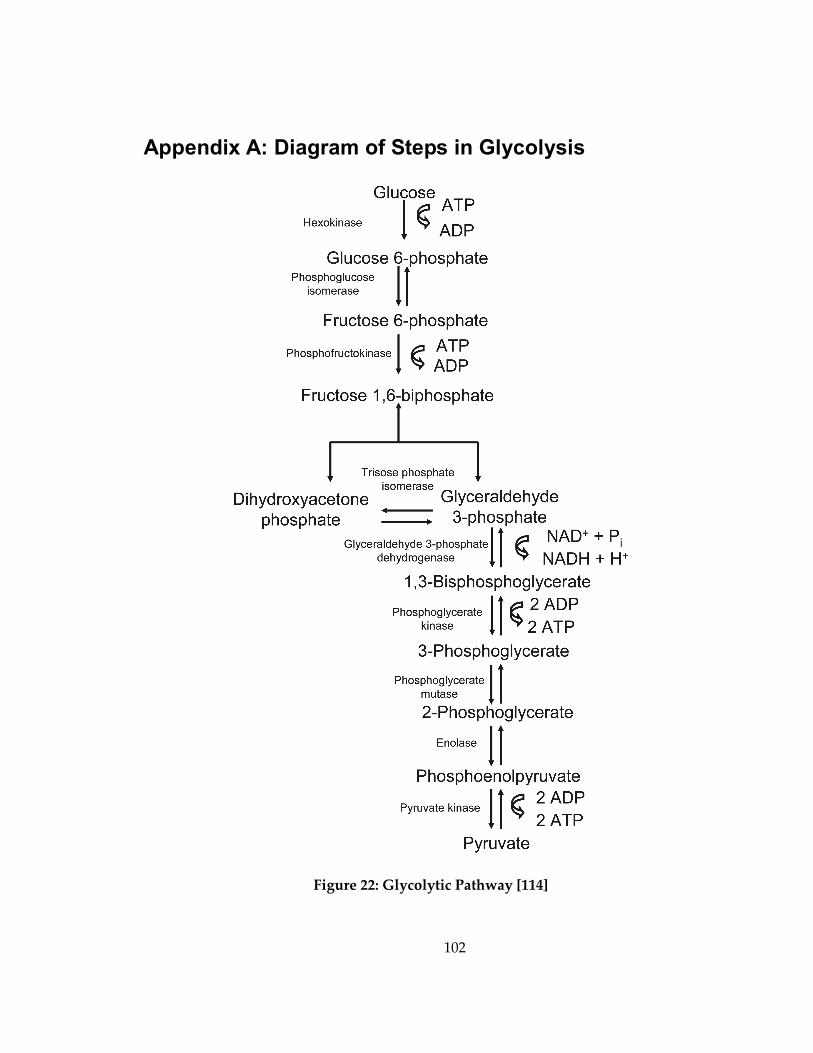
102
Appendix A: Diagram of Steps in Glycolysis
Figure 22: Glycolytic Pathway [114]
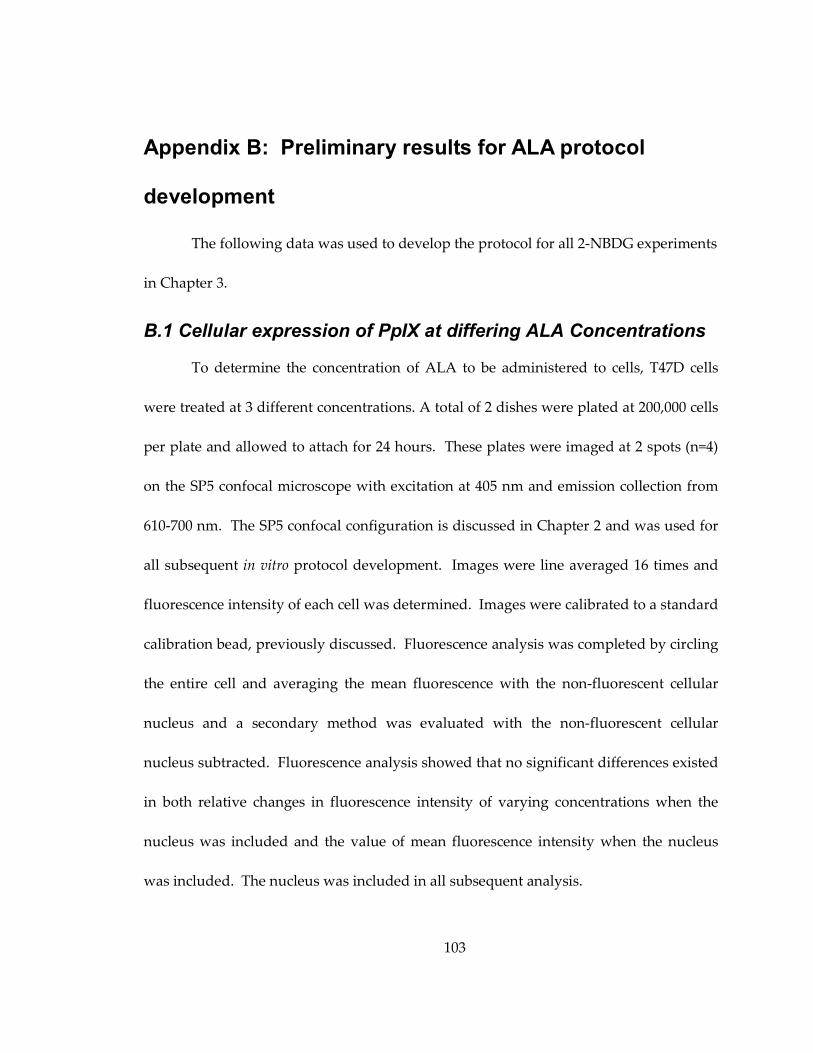
103
Appendix B: Preliminary results for ALA protocol
development
The following data was used to develop the protocol for all 2-NBDG experiments
in Chapter 3.
B.1 Cellular expression of PpIX at differing ALA Concentrations
To determine the concentration of ALA to be administered to cells, T47D cells
were treated at 3 different concentrations. A total of 2 dishes were plated at 200,000 cells
per plate and allowed to attach for 24 hours. These plates were imaged at 2 spots (n=4)
on the SP5 confocal microscope with excitation at 405 nm and emission collection from
610-700 nm. The SP5 confocal configuration is discussed in Chapter 2 and was used for
all subsequent in vitro protocol development. Images were line averaged 16 times and
fluorescence intensity of each cell was determined. Images were calibrated to a standard
calibration bead, previously discussed. Fluorescence analysis was completed by circling
the entire cell and averaging the mean fluorescence with the non-fluorescent cellular
nucleus and a secondary method was evaluated with the non-fluorescent cellular
nucleus subtracted. Fluorescence analysis showed that no significant differences existed
in both relative changes in fluorescence intensity of varying concentrations when the
nucleus was included and the value of mean fluorescence intensity when the nucleus
was included. The nucleus was included in all subsequent analysis.
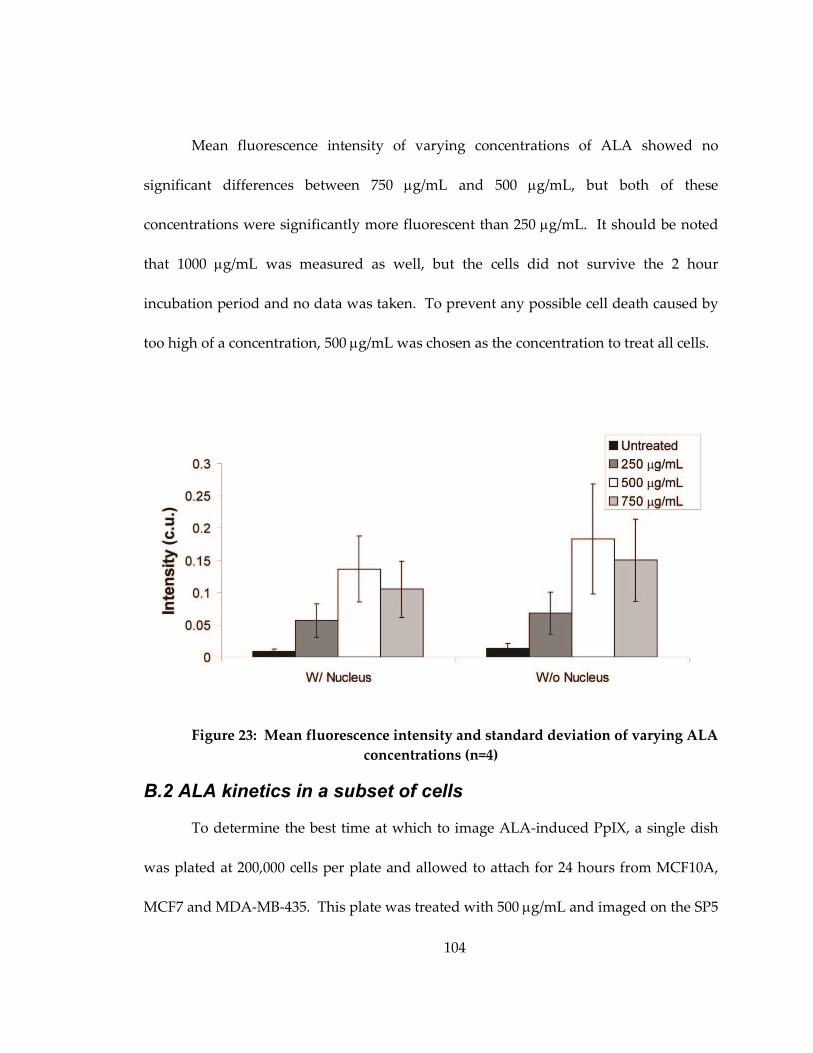
104
Mean fluorescence intensity of varying concentrations of ALA showed no
significant differences between 750 µg/mL and 500 µg/mL, but both of these
concentrations were significantly more fluorescent than 250 µg/mL. It should be noted
that 1000 µg/mL was measured as well, but the cells did not survive the 2 hour
incubation period and no data was taken. To prevent any possible cell death caused by
too high of a concentration, 500 µg/mL was chosen as the concentration to treat all cells.
Figure 23: Mean fluorescence intensity and standard deviation of varying ALA
concentrations (n=4)
B.2 ALA kinetics in a subset of cells
To determine the best time at which to image ALA-induced PpIX, a single dish
was plated at 200,000 cells per plate and allowed to attach for 24 hours from MCF10A,
MCF7 and MDA-MB-435. This plate was treated with 500 µg/mL and imaged on the SP5
105
confocal microscope with excitation at 405 nm and emission collection from 610-700 nm
every 15 minutes for 2 hours. Figure 23 shows the fluorescence increase over time in
three cell lines representing the different estrogen receptor expressions. As expected,
the percent change in fluorescence increased with longer incubation time. The change in
fluorescence for the ER- cell line increased at a higher rate than the ER+ malignant cell
line. However, both show a greater increase over 120 minutes than the normal cell line.
Four and six hour incubation times were tested with separate dishes (data not shown),
but they did not show a large enough increase over the two hour incubation time to
warrant the longer incubation time. Two hours was determined to be the optimal time
to measure PpIX fluorescence since the change in ER- and ER+ malignant cells were
300% and 50% greater than normal, respectively.
Figure 24: Kinetics of ALA-induced PpIX fluorescence expression in MCF10A, MCF7
and MDA-MB-435 cells
106
Appendix C: Preliminary results for 2-NBDG in vitro protocol
The following data was used to develop the protocol for all 2-NBDG experiments
in Chapter 3.
C.1 Fluorescence intensity of 2-NBDG at different wavelengths
To determine the optimum excitation wavelength of 2-NBDG, 2 dishes of MCF7
cells were plated at 200,000 cells per plate and allowed to attach for 24 hours. The dishes
were then treated with 100 µM of 2-NBDG for 20 minutes before the cells were washed 3
times with PBS and imaged. These dishes were imaged in 2 spots (n=4) on the SP5
confocal microscope with varying excitation and emission collection from 515-585 nm.
Fluorescence analysis was completed to determine the mean fluorescence intensity at
each excitation wavelength. Fluorescence analysis showed that no significant
differences existed with excitation at 405, 476 nm and 488 nm. However, excitation at
458 nm had lower 2-NBDG fluorescence intensity than all other excitation wavelengths.
The excitation wavelength of 488 nm was chosen for further investigation since it was
the same as a previous study [52].
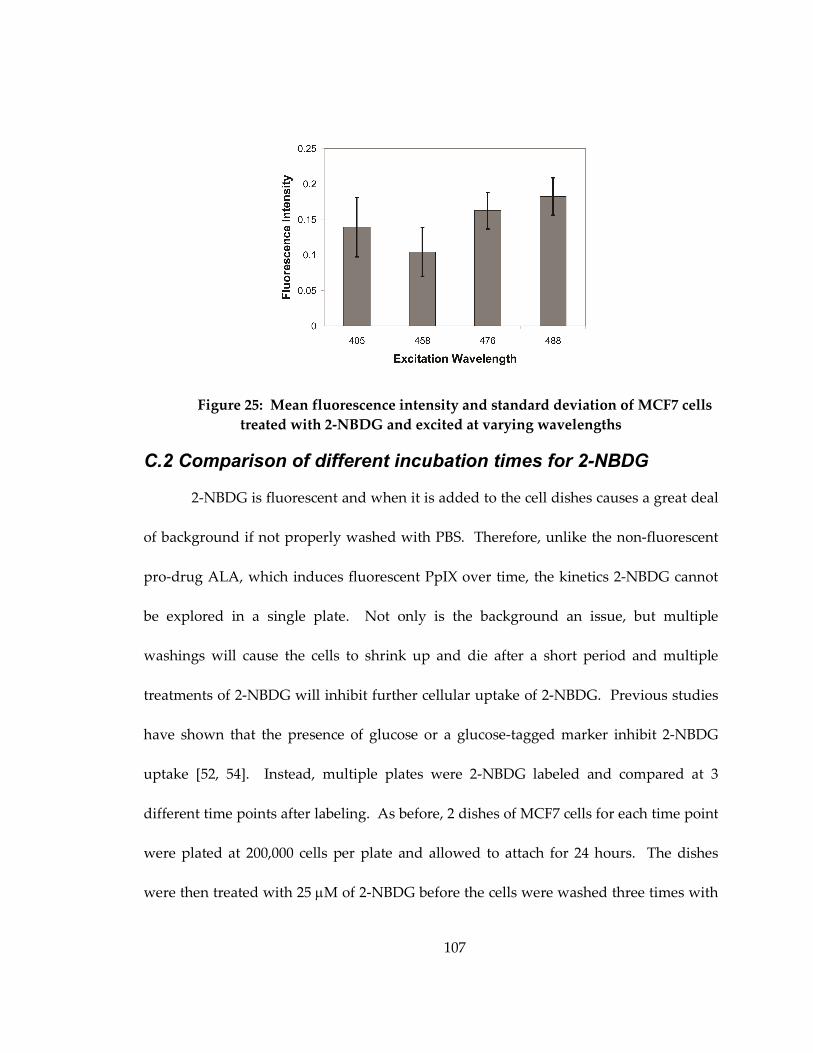
107
Figure 25: Mean fluorescence intensity and standard deviation of MCF7 cells
treated with 2-NBDG and excited at varying wavelengths
C.2 Comparison of different incubation times for 2-NBDG
2-NBDG is fluorescent and when it is added to the cell dishes causes a great deal
of background if not properly washed with PBS. Therefore, unlike the non-fluorescent
pro-drug ALA, which induces fluorescent PpIX over time, the kinetics 2-NBDG cannot
be explored in a single plate. Not only is the background an issue, but multiple
washings will cause the cells to shrink up and die after a short period and multiple
treatments of 2-NBDG will inhibit further cellular uptake of 2-NBDG. Previous studies
have shown that the presence of glucose or a glucose-tagged marker inhibit 2-NBDG
uptake [52, 54]. Instead, multiple plates were 2-NBDG labeled and compared at 3
different time points after labeling. As before, 2 dishes of MCF7 cells for each time point
were plated at 200,000 cells per plate and allowed to attach for 24 hours. The dishes
were then treated with 25 µM of 2-NBDG before the cells were washed three times with
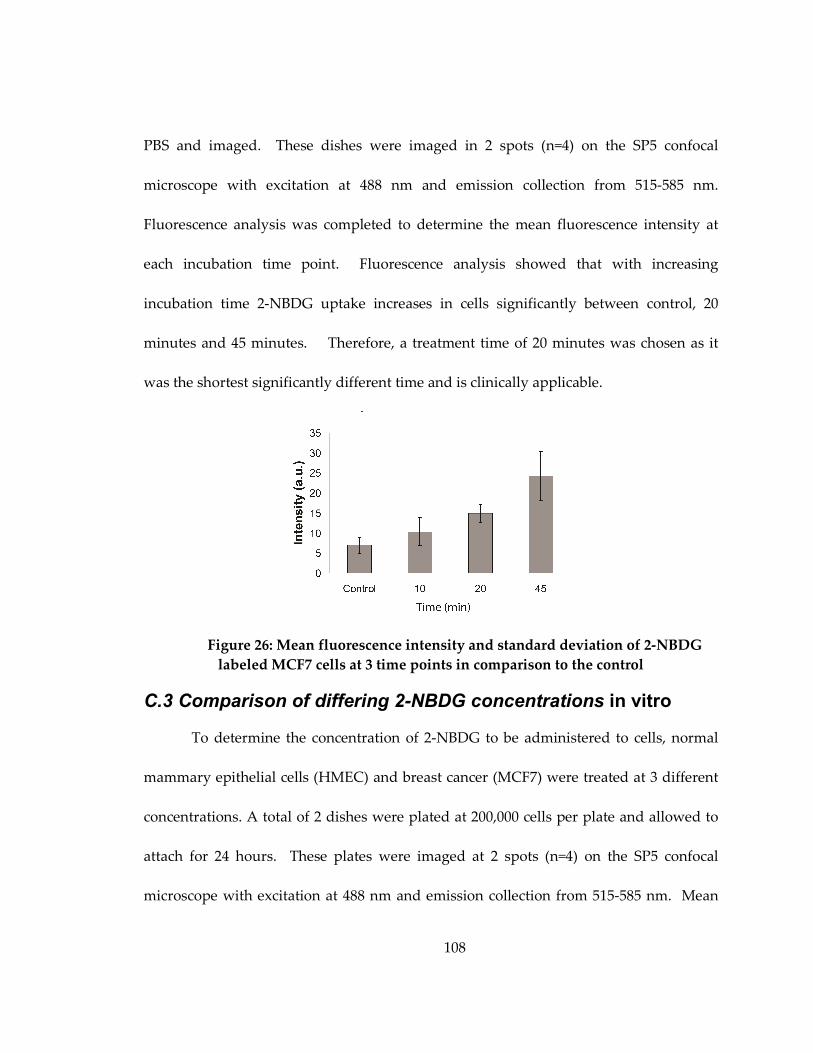
108
PBS and imaged. These dishes were imaged in 2 spots (n=4) on the SP5 confocal
microscope with excitation at 488 nm and emission collection from 515-585 nm.
Fluorescence analysis was completed to determine the mean fluorescence intensity at
each incubation time point. Fluorescence analysis showed that with increasing
incubation time 2-NBDG uptake increases in cells significantly between control, 20
minutes and 45 minutes. Therefore, a treatment time of 20 minutes was chosen as it
was the shortest significantly different time and is clinically applicable.
Figure 26: Mean fluorescence intensity and standard deviation of 2-NBDG
labeled MCF7 cells at 3 time points in comparison to the control
C.3 Comparison of differing 2-NBDG concentrations in vitro
To determine the concentration of 2-NBDG to be administered to cells, normal
mammary epithelial cells (HMEC) and breast cancer (MCF7) were treated at 3 different
concentrations. A total of 2 dishes were plated at 200,000 cells per plate and allowed to
attach for 24 hours. These plates were imaged at 2 spots (n=4) on the SP5 confocal
microscope with excitation at 488 nm and emission collection from 515-585 nm. Mean
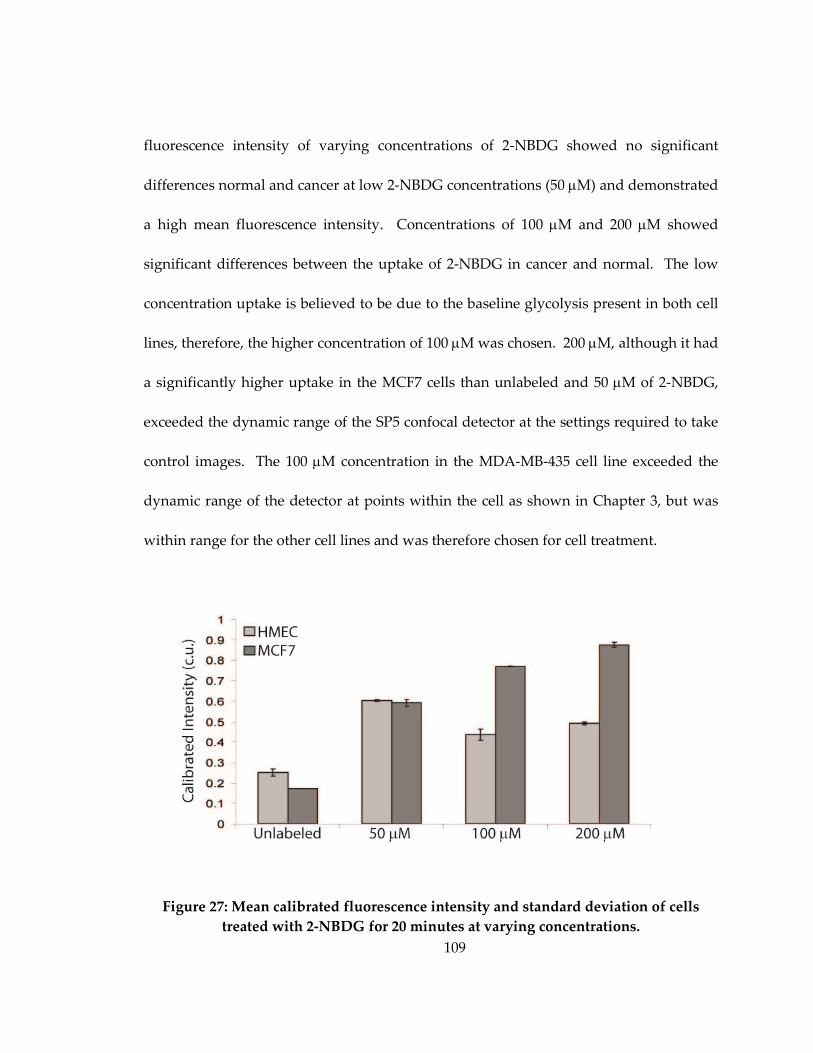
109
fluorescence intensity of varying concentrations of 2-NBDG showed no significant
differences normal and cancer at low 2-NBDG concentrations (50 µM) and demonstrated
a high mean fluorescence intensity. Concentrations of 100 µM and 200 µM showed
significant differences between the uptake of 2-NBDG in cancer and normal. The low
concentration uptake is believed to be due to the baseline glycolysis present in both cell
lines, therefore, the higher concentration of 100 µM was chosen. 200 µM, although it had
a significantly higher uptake in the MCF7 cells than unlabeled and 50 µM of 2-NBDG,
exceeded the dynamic range of the SP5 confocal detector at the settings required to take
control images. The 100 µM concentration in the MDA-MB-435 cell line exceeded the
dynamic range of the detector at points within the cell as shown in Chapter 3, but was
within range for the other cell lines and was therefore chosen for cell treatment.
Figure 27: Mean calibrated fluorescence intensity and standard deviation of cells
treated with 2-NBDG for 20 minutes at varying concentrations.
110
Appendix D: Evaluation of 2-NBDG for murine mammary cell line in vitro and in vivo
The following data was taken during protocol development for the murine
mammary in vitro and in vivo data presented in Chapter 4.
D.1 2-NBDG cellular decay in 4T1-RFP cells after 2-NBDG labeling
The kinetics of 2-NBDG degradation was studied to ensure that a long enough in
vivo incubation time could be imaged. A single plate of 200,000 4T1-RFP cells was
administered 100 µM of 2-NBDG for 20 minutes and then washed with PBS 3 times.
These cells were then placed in the temperature controlled chamber in the SP5 and
imaged every 10 minutes to determine the time required for cells to degrade the 2-
NBDG-6-phosphate trapped in the cell into a non-fluorescent form. The cells were not
imaged prior to treatment and therefore, the data is not background subtracted or
normalized.
After approximately 60 minutes, the cells degraded the 2-NBDG-6-phosphate
into a non-fluorescent form. However, the 60 minute incubation period was not well
received by the cells, which over time began to ball up, die and release from the dish
coverslip. This explains the negative change in fluorescent intensity from baseline.
These results were used to determine that after administration to the animal via tail-vein
injection, the 2-NBDG should be monitored for at least 60 minutes.
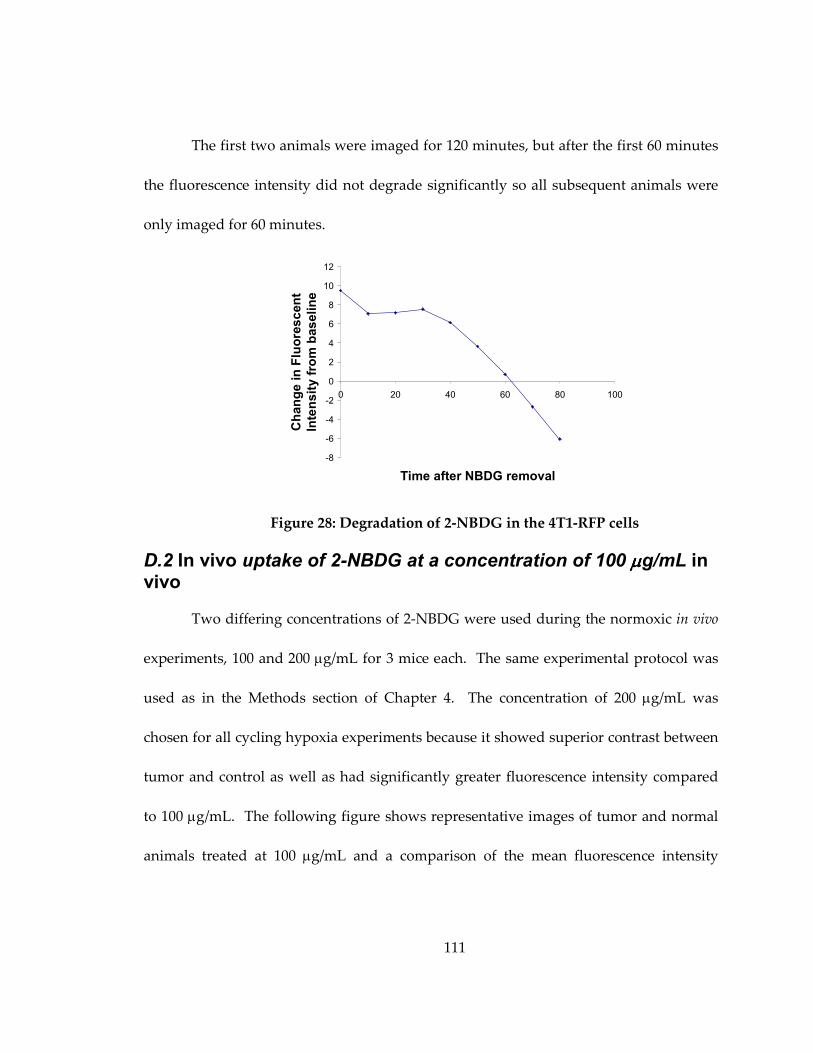
111
The first two animals were imaged for 120 minutes, but after the first 60 minutes
the fluorescence intensity did not degrade significantly so all subsequent animals were
only imaged for 60 minutes.
-8
-6
-4
-2
0
2
4
6
8
10
12
0 20 40 60 80 100
Time after NBDG removal
Change in F
luore
scent
Inte
nsity fro
m b
aseline
Figure 28: Degradation of 2-NBDG in the 4T1-RFP cells
D.2 In vivo uptake of 2-NBDG at a concentration of 100 µµµµg/mL in vivo
Two differing concentrations of 2-NBDG were used during the normoxic in vivo
experiments, 100 and 200 µg/mL for 3 mice each. The same experimental protocol was
used as in the Methods section of Chapter 4. The concentration of 200 µg/mL was
chosen for all cycling hypoxia experiments because it showed superior contrast between
tumor and control as well as had significantly greater fluorescence intensity compared
to 100 µg/mL. The following figure shows representative images of tumor and normal
animals treated at 100 µg/mL and a comparison of the mean fluorescence intensity
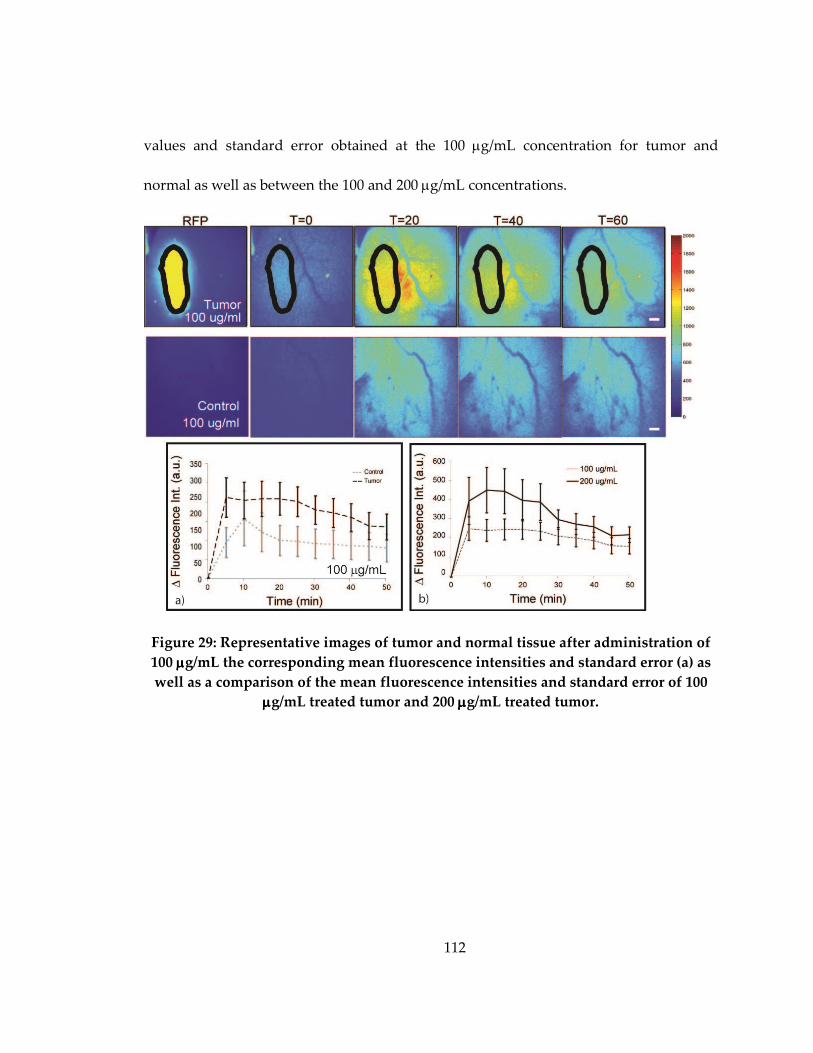
112
values and standard error obtained at the 100 µg/mL concentration for tumor and
normal as well as between the 100 and 200 µg/mL concentrations.
Figure 29: Representative images of tumor and normal tissue after administration of
100 µµµµg/mL the corresponding mean fluorescence intensities and standard error (a) as
well as a comparison of the mean fluorescence intensities and standard error of 100
µµµµg/mL treated tumor and 200 µµµµg/mL treated tumor.
113
References
1. Gambhir, S.S., Molecular imaging of cancer with positron emission tomography. Nat
Rev Cancer, 2002. 2(9): p. 683-93.
2. Sokolov, K., et al., Molecular optical imaging of therapeutic targets of cancer. Adv
Cancer Res, 2007. 96: p. 299-344.
3. Fotinos, N., et al., 5-Aminolevulinic acid derivatives in photomedicine: Characteristics,
application and perspectives. Photochem Photobiol, 2006. 82(4): p. 994-1015.
4. Ji, Z., et al., Subcellular localization pattern of protoporphyrin IX is an important
determinant for its photodynamic efficiency of human carcinoma and normal cell lines. J
Photochem Photobiol B, 2006. 84(3): p. 213-20.
5. Sheth, R.A., L. Josephson, and U. Mahmood, Evaluation and clinically relevant
applications of a fluorescent imaging analog to fluorodeoxyglucose positron emission
tomography. J Biomed Opt, 2009. 14(6): p. 064014.
6. Millon, S.R., et al., Uptake of 2-NBDG as a method to monitor therapy response in
breast cancer cell lines. Breast Cancer Res Treat, 2010.
7. Millon, S.R., et al., Preferential accumulation of 5-aminolevulinic acid-induced
protoporphyrin IX in breast cancer: a comprehensive study on six breast cell lines with
varying phenotypes. J Biomed Opt, 2010. 15(1): p. 018002.
8. DaCosta, R.S., H. Andersson, and B.C. Wilson, Molecular fluorescence excitation-
emission matrices relevant to tissue spectroscopy. Photochem Photobiol, 2003. 78(4):
p. 384-92.
9. Sokolov, K., et al., Optical systems for in vivo molecular imaging of cancer. Technol
Cancer Res Treat, 2003. 2(6): p. 491-504.
10. Pierce, M.C., D.J. Javier, and R. Richards-Kortum, Optical contrast agents and
imaging systems for detection and diagnosis of cancer. Int J Cancer, 2008. 123(9): p.
1979-90.
11. Carlson, A.L., et al., Dual-mode reflectance and fluorescence near-video-rate confocal
microscope for architectural, morphological and molecular imaging of tissue. J Microsc,
2007. 228(Pt 1): p. 11-24.
114
12. Carlson, A.L., et al., Confocal microscopy and molecular-specific optical contrast agents
for the detection of oral neoplasia. Technol Cancer Res Treat, 2007. 6(5): p. 361-74.
13. Bickford, L.R., et al., Silica-gold nanoshells as potential intraoperative molecular probes
for HER2-overexpression in ex vivo breast tissue using near-infrared reflectance confocal
microscopy. Breast Cancer Res Treat, 2010. 120(3): p. 547-55.
14. Frei, K.A., et al., Photodynamic detection of diseased axillary sentinel lymph node after
oral application of aminolevulinic acid in patients with breast cancer. Br J Cancer, 2004.
90(4): p. 805-9.
15. Gallegos, E.R., et al., In vitro study of biosynthesis of protoporphyrin IX induced by
delta-aminolevulinic acid in normal and cancerous cells of the human cervix. Arch Med
Res, 1999. 30(3): p. 163-70.
16. Gamarra, F., et al., Kinetics of 5-aminolevulinic acid-induced fluorescence in organ
cultures of bronchial epithelium and tumor. Respiration, 2002. 69(5): p. 445-50.
17. Gibbs, S.L., et al., Protoporphyrin IX level correlates with number of mitochondria, but
increase in production correlates with tumor cell size. Photochem Photobiol, 2006.
82(5): p. 1334-41.
18. Hirschberg, H., et al., Repetitive photodynamic therapy of malignant brain tumors. J
Environ Pathol Toxicol Oncol, 2006. 25(1-2): p. 261-79.
19. af Klinteberg, C., et al., Kinetic fluorescence studies of 5-aminolaevulinic acid-induced
protoporphyrin IX accumulation in basal cell carcinomas. J Photochem Photobiol B,
1999. 49(2-3): p. 120-8.
20. Krammer, B. and K. Plaetzer, ALA and its clinical impact, from bench to bedside.
Photochem Photobiol Sci, 2008. 7(3): p. 283-9.
21. Krieg, R.C., et al., Metabolic characterization of tumor cell-specific protoporphyrin IX
accumulation after exposure to 5-aminolevulinic acid in human colonic cells.
Photochem Photobiol, 2002. 76(5): p. 518-25.
22. Ladner, D.P., et al., Photodynamic diagnosis of breast tumours after oral application of
aminolevulinic acid. Br J Cancer, 2001. 84(1): p. 33-7.
115
23. Leunig, A., et al., Fluorescence imaging and spectroscopy of 5-aminolevulinic acid
induced protoporphyrin IX for the detection of neoplastic lesions in the oral cavity. Am J
Surg, 1996. 172(6): p. 674-7.
24. Messmann, H., et al., Endoscopic fluorescence detection of dysplasia in patients with
Barrett's esophagus, ulcerative colitis, or adenomatous polyps after 5-aminolevulinic
acid-induced protoporphyrin IX sensitization. Gastrointest Endosc, 1999. 49(1): p. 97-
101.
25. Na, R., I.M. Stender, and H.C. Wulf, Can autofluorescence demarcate basal cell
carcinoma from normal skin? A comparison with protoporphyrin IX fluorescence. Acta
Derm Venereol, 2001. 81(4): p. 246-9.
26. Navone, N.M., et al., Heme biosynthesis in human breast cancer--mimetic "in vitro"
studies and some heme enzymic activity levels. Int J Biochem, 1990. 22(12): p. 1407-11.
27. Rodriguez, L., et al., Response to ALA-based PDT in an immortalised normal breast
cell line and its counterpart transformed with the Ras oncogene. Photochem Photobiol
Sci, 2007. 6(12): p. 1306-10.
28. Sailer, R., et al., Relation between intracellular location and photodynamic efficacy of 5-
aminolevulinic acid-induced protoporphyrin IX in vitro. Comparison between human
glioblastoma cells and other cancer cell lines. Photochem Photobiol Sci, 2007. 6(2): p.
145-51.
29. Sharwani, A., et al., Fluorescence spectroscopy combined with 5-aminolevulinic acid-
induced protoporphyrin IX fluorescence in detecting oral premalignancy. J Photochem
Photobiol B, 2006. 83(1): p. 27-33.
30. Moesta, K.T., et al., Protoporphyrin IX occurs naturally in colorectal cancers and their
metastases. Cancer Res, 2001. 61(3): p. 991-9.
31. Andersson-Engels, S., et al., Preliminary evaluation of two fluorescence imaging
methods for the detection and the delineation of basal cell carcinomas of the skin. Lasers
Surg Med, 2000. 26(1): p. 76-82.
32. Betz, C.S., et al., A comparative study of normal inspection, autofluorescence and 5-
ALA-induced PPIX fluorescence for oral cancer diagnosis. Int J Cancer, 2002. 97(2): p.
245-52.
116
33. Chen, J.Y., et al., Endogenous production of protoporphyrin IX induced by 5-
aminolevulinic acid in leukemia cells. Acta Pharmacol Sin, 2001. 22(2): p. 163-8.
34. Dorward, A.M., et al., Early neoplastic and metastatic mammary tumours of
transgenic mice detected by 5-aminolevulinic acid-stimulated protoporphyrin IX
accumulation. Br J Cancer, 2005. 93(10): p. 1137-43.
35. Berger, Y., et al., Determination of intracellular prolyl/glycyl proteases in intact living
human cells and protoporphyrin IX production as a reporter system. Chem Biol, 2005.
12(8): p. 867-72.
36. Alvarez, M.G., et al., 5-aminolevulinic acid-mediated photodynamic therapy on Hep-2
and MCF-7c3 cells. J Environ Pathol Toxicol Oncol, 2007. 26(2): p. 75-82.
37. Wu, S.M., et al., Photodynamic effects of 5-aminolevulinic acid and its hexylester on
several cell lines. Sheng Wu Hua Xue Yu Sheng Wu Wu Li Xue Bao (Shanghai),
2003. 35(7): p. 655-60.
38. Zaak, D., et al., Quantification of 5-aminolevulinic acid induced fluorescence improves
the specificity of bladder cancer detection. J Urol, 2001. 166(5): p. 1665-8; discussion
1668-9.
39. European Public Assessment Report: Gliolan 2007 [cited
http:\\www.emea.europa.eu/humandocs/PDFs/EPAR/gliolan/H-744-enl.pdf.
40. Tsai, T., et al., ALA-PDT results in phenotypic changes and decreased cellular invasion
in surviving cancer cells. Lasers Surg Med, 2009. 41(4): p. 305-15.
41. Peskin, ed. Biochemistry. 2000.
42. Alberts, B., et al., Molecular Biology of the Cell. Vol. 5. 2008, New York: Garland
Science.
43. Gatenby, R.A. and R.J. Gillies, Why do cancers have high aerobic glycolysis? Nat Rev
Cancer, 2004. 4(11): p. 891-9.
44. Zu, X.L. and M. Guppy, Cancer metabolism: facts, fantasy, and fiction. Biochem
Biophys Res Commun, 2004. 313(3): p. 459-65.
117
45. Chen, Z., et al., The Warburg effect and its cancer therapeutic implications. J Bioenerg
Biomembr, 2007. 39(3): p. 267-74.
46. Biersack, H.J., H. Bender, and H. Palmedo, FDG-PET in monitoring therapy of
breast cancer. Eur J Nucl Med Mol Imaging, 2004. 31 Suppl 1: p. S112-7.
47. Bos, R., et al., Biologic correlates of (18)fluorodeoxyglucose uptake in human breast
cancer measured by positron emission tomography. J Clin Oncol, 2002. 20(2): p. 379-
87.
48. Brown, R.S., et al., Expression of hexokinase II and Glut-1 in untreated human breast
cancer. Nucl Med Biol, 2002. 29(4): p. 443-53.
49. Monazzam, A., et al., Application of the multicellular tumour spheroid model to screen
PET tracers for analysis of early response of chemotherapy in breast cancer. Breast
Cancer Res, 2007. 9(4): p. R45.
50. O'Neil, R.G., L. Wu, and N. Mullani, Uptake of a fluorescent deoxyglucose analog (2-
NBDG) in tumor cells. Mol Imaging Biol, 2005. 7(6): p. 388-92.
51. Yoshioka, K., et al., Intracellular fate of 2-NBDG, a fluorescent probe for glucose uptake
activity, in Escherichia coli cells. Biosci Biotechnol Biochem, 1996. 60(11): p. 1899-
901.
52. Nitin, N., et al., Molecular imaging of glucose uptake in oral neoplasia following topical
application of fluorescently labeled deoxy-glucose. Int J Cancer, 2009. 124(11): p. 2634-
42.
53. Sheth, R.A., L. Josephson, and U. Mahmood, Evaluation and clinically relevant
applications of a fluorescent imaging analog to fluorodeoxyglucose positron emission
tomography. Journal of Biomedical Optics, 2009. 14(6): p. 064014.
54. Levi, J., et al., Fluorescent fructose derivatives for imaging breast cancer cells.
Bioconjug Chem, 2007. 18(3): p. 628-34.
55. Taube, S.E., J.W. Jacobson, and T.G. Lively, Cancer diagnostics: decision criteria for
marker utilization in the clinic. Am J Pharmacogenomics, 2005. 5(6): p. 357-64.
56. Cabioglu, N., et al., Role for intraoperative margin assessment in patients undergoing
breast-conserving surgery. Ann Surg Oncol, 2007. 14: p. 1458-1471.
118
57. Bani, M.R., et al., Factors correlating with reexcision after breast-conserving therapy.
Eur J Surg Oncol, 2009. 35(1): p. 32-7.
58. Dillon, M.F., et al., Factors affecting successful breast conservation for ductal carcinoma
in situ. Ann Surg Oncol, 2007. 14(5): p. 1618-28.
59. Florentine, B.D., et al., Breast-conservation treatment outcomes: a community
hospital's experience. Breast J, 2009. 15(1): p. 76-84.
60. Huston, T.L., et al., The influence of additional surgical margins on the total specimen
volume excised and the reoperative rate after breast-conserving surgery. Am J Surg,
2006. 192(4): p. 509-12.
61. Kurniawan, E.D., et al., Predictors of surgical margin status in breast-conserving
surgery within a breast screening program. Ann Surg Oncol, 2008. 15(9): p. 2542-9.
62. McLaughlin, S.A., et al., Influence of frozen-section analysis of sentinel lymph node
and lumpectomy margin status on reoperation rates in patients undergoing breast-
conservation therapy. J Am Coll Surg, 2008. 206(1): p. 76-82.
63. Mendez, J.E., et al., Influence of breast cancer margin assessment method on the rates of
positive margins and residual carcinoma. Am J Surg, 2006. 192(4): p. 538-40.
64. Menes, T.S., et al., The consequence of multiple re-excisions to obtain clear lumpectomy
margins in breast cancer patients. Ann Surg Oncol, 2005. 12(11): p. 881-5.
65. Waljee, J.F., et al., Predictors of re-excision among women undergoing breast-
conserving surgery for cancer. Ann Surg Oncol, 2008. 15(5): p. 1297-303.
66. Navone, N., et al., Heme biosynthesis in human breast cancer--mimetic "in vitro"
studies and some heme enzymic activity levels. Int. J. Biochem, 1990. 22(12): p. 1407-
11.
67. Anandappa, S., et al., Variant estrogen receptor alpha mRNAs in human breast cancer
specimens. Int J Cancer, 2000. 88: p. 209-216.
68. Dietze, E.C., et al., Tamoxifen and tamoxifen ethyl bromide induce apoptosis in acutely
damaged mammary epithelial cells through modulation of AKT activity. Oncogene,
2004. 23(21): p. 3851-62.
119
69. Wong, S.K., et al., Tumor pathology and long-term survival in emergency colorectal
cancer. Dis Colon Rectum, 2008. 51(2): p. 223-30.
70. Wu, S., et al., Photodynamic effects of 5-aminolevulinic acid and its hexylester on
several cell lines. Sheng Wu Hua Xue Yu Shen Wu Wu Li Xue Bao, 2003. 35(7): p.
655-60.
71. Wang, I., et al., Fluorescence diagnostics and kinetic studies in the head and neck region
utilizing low-dose delta-aminolevulinic acid sensitization. Cancer Lett, 1999. 135(1): p.
11-9.
72. Zaak, D., et al., Quantification of 5-aminolevulinic acid induced fluorescenc improves
the specificity of bladder cancer detection. J Urol, 2001. 166(5): p. 1665-8.
73. Wang, I., et al., Fluorescence diagnostics and kinetics studies in the head and neck
region utilizing low-dose d-aminolevulinic acid sensitization. Cancer Letters, 1999.
135(11-9).
74. Gibbs-Strauss, S.L., et al., Noninvasive measurement of aminolevulinic acid-induced
protoporphyrin IX fluorescence allowing detection of murine glioma in vivo. J Biomed
Opt, 2009. 14(1): p. 014007.
75. Rae, J.M., et al., MDA-MB-435 cells are derived from M14 melanoma cells--a loss for
breast cancer, but a boon for melanoma research. Breast Cancer Res Treat, 2007.
104(1): p. 13-9.
76. Chambers, A.F., MDA-MB-435 and M14 cell lines: identical but not M14 melanoma?
Cancer Res, 2009. 69(13): p. 5292-3.
77. Livshits, L., et al., The role of GLUT1 in the sugar-induced dielectric response of human
erythrocytes. J Phys Chem B, 2009. 113(7): p. 2212-20.
78. Meira, D.D., et al., Clotrimazole decreases human breast cancer cells viability through
alterations in cytoskeleton-associated glycolytic enzymes. Mol Genet Metab, 2005.
84(4): p. 354-62.
79. He, Q., et al., Magnetic resonance spectroscopic imaging of tumor metabolic markers for
cancer diagnosis, metabolic phenotyping, and characterization of tumor
microenvironment. Dis Markers, 2003. 19(2-3): p. 69-94.
120
80. Furman, E., et al., Tamoxifen induced changes in MCF7 human breast cancer: in vitro
and in vivo studies using nuclear magnetic resonance spectroscopy and imaging. J
Steroid Biochem Mol Biol, 1992. 43(1-3): p. 189-95.
81. Mestres, P., et al., A new method to assess drug sensitivity on breast tumor acute slices
preparation. Ann N Y Acad Sci, 2006. 1091: p. 460-9.
82. Ramanujan, V.K. and B.A. Herman, Nonlinear scaling analysis of glucose metabolism
in normal and cancer cells. J Biomed Opt, 2008. 13(3): p. 031219.
83. Brawer, M.K., Lonidamine: basic science and rationale for treatment of prostatic
proliferative disorders. Rev Urol, 2005. 7 Suppl 7: p. S21-6.
84. Sonveaux, P., et al., Targeting lactate-fueled respiration selectively kills hypoxic tumor
cells in mice. J Clin Invest, 2008. 118(12): p. 3930-42.
85. Erlichman, J.S., et al., Inhibition of monocarboxylate transporter 2 in the retrotrapezoid
nucleus in rats: a test of the astrocyte-neuron lactate-shuttle hypothesis. J Neurosci,
2008. 28(19): p. 4888-96.
86. Floridi, A., et al., Effect of lonidamine on the energy metabolism of Ehrlich ascites tumor
cells. Cancer Res, 1981. 41(11 Pt 1): p. 4661-6.
87. Pincheira, R., Q. Chen, and J.T. Zhang, Identification of a 170-kDa protein over-
expressed in lung cancers. Br J Cancer, 2001. 84(11): p. 1520-7.
88. Rivenzon-Segal, D., et al., Glycolysis and glucose transporter 1 as markers of response
to hormonal therapy in breast cancer. Int J Cancer, 2003. 107(2): p. 177-82.
89. Paine, T.M., et al., Characterization of epithelial phenotypes in mortal and immortal
human breast cells. Int J Cancer, 1992. 50(3): p. 463-73.
90. Pelicano, H., et al., Glycolysis inhibition for anticancer treatment. Oncogene, 2006.
25(34): p. 4633-46.
91. Di Cosimo, S., et al., Lonidamine: efficacy and safety in clinical trials for the treatment
of solid tumors. Drugs Today (Barc), 2003. 39(3): p. 157-74.
121
92. Rivenzon-Segal, D., R. Margalit, and H. Degani, Glycolysis as a metabolic marker in
orthotopic breast cancer, monitored by in vivo (13)C MRS. Am J Physiol Endocrinol
Metab, 2002. 283(4): p. E623-30.
93. Perumal, S.S., P. Shanthi, and P. Sachdanandam, Therapeutic effect of tamoxifen and
energy-modulating vitamins on carbohydrate-metabolizing enzymes in breast cancer.
Cancer Chemother Pharmacol, 2005. 56(1): p. 105-14.
94. Monazzam, A., et al., Multicellular tumour spheroid as a model for evaluation of
[18F]FDG as biomarker for breast cancer treatment monitoring. Cancer Cell Int, 2006.
6: p. 6.
95. Stryer, L., Biochemistry. 4 ed. 1997, New York: W. H. Freeman and Co.
96. Krohn, K.A., J.M. Link, and R.P. Mason, Molecular imaging of hypoxia. J Nucl Med,
2008. 49 Suppl 2: p. 129S-48S.
97. Busk, M., et al., Cellular uptake of PET tracers of glucose metabolism and hypoxia and
their linkage. Eur J Nucl Med Mol Imaging, 2008. 35(12): p. 2294-303.
98. Busk, M., et al., Aerobic glycolysis in cancers: implications for the usability of oxygen-
responsive genes and fluorodeoxyglucose-PET as markers of tissue hypoxia. Int J
Cancer, 2008. 122(12): p. 2726-34.
99. Rajendran, J.G., et al., Hypoxia and glucose metabolism in malignant tumors:
evaluation by [18F]fluoromisonidazole and [18F]fluorodeoxyglucose positron emission
tomography imaging. Clin Cancer Res, 2004. 10(7): p. 2245-52.
100. Tatum, J.L., et al., Hypoxia: importance in tumor biology, noninvasive measurement by
imaging, and value of its measurement in the management of cancer therapy. Int J
Radiat Biol, 2006. 82(10): p. 699-757.
101. Palmer, G.M., et al., Quantitative diffuse reflectance and fluorescence spectroscopy: tool
to monitor tumor physiology in vivo. J Biomed Opt, 2009. 14(2): p. 024010.
102. Sorg, B.S., et al., Hyperspectral imaging of hemoglobin saturation in tumor
microvasculature and tumor hypoxia development. J Biomed Opt, 2005. 10(4): p.
44004.
122
103. Cao, Y., et al., Observation of incipient tumor angiogenesis that is independent of
hypoxia and hypoxia inducible factor-1 activation. Cancer Res, 2005. 65(13): p. 5498-
505.
104. Kalliomaki, T.M., et al., Progression and metastasis in a transgenic mouse breast
cancer model: effects of exposure to in vivo hypoxia. Cancer Lett, 2009. 282(1): p. 98-
108.
105. Semenza, G.L., Targeting HIF-1 for cancer therapy. Nat Rev Cancer, 2003. 3(10): p.
721-32.
106. Skala, M.C., et al., Longitudinal optical imaging of tumor metabolism and
hemodynamics. J Biomed Opt, 2010. 15(1): p. 011112.
107. Racker, E., History of the Pasteur effect and its pathobiology. Mol Cell Biochem, 1974.
5(1-2): p. 17-23.
108. Wang, W., et al., Pharmacokinetic analysis of hypoxia (18)F-fluoromisonidazole
dynamic PET in head and neck cancer. J Nucl Med, 2010. 51(1): p. 37-45.
109. Cooper, C., et al., Intermittent hypoxia induces proteasome-dependent down-regulation
of estrogen receptor alpha in human breast carcinoma. Clin Cancer Res, 2004. 10(24):
p. 8720-7.
110. Schroeder, T., et al., Spatial heterogeneity and oxygen dependence of glucose
consumption in R3230Ac and fibrosarcomas of the Fischer 344 rat. Cancer Res, 2005.
65(12): p. 5163-71.
111. Nielsen, F.U., et al., Effect of changing tumor oxygenation on glycolytic metabolism in
a murine C3H mammary carcinoma assessed by in vivo nuclear magnetic resonance
spectroscopy. Cancer Res, 2001. 61(13): p. 5318-25.
112. Dewhirst, M.W., et al., Exploring the role of HIF-1 in early angiogenesis and response
to radiotherapy. Radiother Oncol, 2007. 83(3): p. 249-55.
113. Skala, M.C., et al., Multiphoton microscopy of endogenous fluorescence differentiates
normal, precancerous, and cancerous squamous epithelial tissues. Cancer Res, 2005.
65(4): p. 1180-6.
123
Biography
Stacy Renee Chiles Millon was born in Royal Oak, MI on July 14, 1981. She
graduated summa cum laude in Biomedical Engineering at Michigan Technological
University in Houghton, MI in May 2004. Afterwards, she received the National Science
Foundation Graduate Student Fellowship and moved to Madison Wisconsin where she
attended the University of Wisconsin-Madison to earn her Masters of Science in
Biomedical Engineering in December of 2006. At UW-Madison, she focused on
Biomedical Optics and collaborated with the Laboratory for Optical and Computational
Instrumentation where she examined the changes in tissue optical properties after the
application of optical clearing agents. Following graduation she moved to Durham,
North Carolina, where she attended Duke University and earned her PhD in Biomedical
Engineering in 2010. Her focus at Duke was on the use of exogenous contrast agents for
therapeutic response monitoring and breast cancer detection.
Publications
• Millon SR, Ostrander JH, Brown JQ, Rajeha AM, Seewaldt VL, Ramanujam N.
“Uptake of 2-NBDG as a method to monitor therapy response in breast cancer
cell lines.” Breast Cancer Research and Treatment. (2010). In Print.
• Ostrander JH, McMahon CM, Lem S, Millon SR, Brown JQ, Seewaldt VL,
Ramanujam N. “The optical redox ratio differentiates breast cancer cell lines
based on estrogen receptor status.” Cancer Research (2010). In Print.
• Millon SR, Ostrander JH, Yazdanfar S, Brown JQ, Bender JE, Rajeha AM,
Ramanujam N, “Preferential accumulation of 5-aminolevulinic acid-induced
protoporphyrin IX in breast cancer: a comprehensive study on six breast cell

124
lines with varying phenotypes.” Journal of Biomedical Optics. 15(1): 018002.
(2010).
• Millon SR, Roldan-Perez KM, Riching KM, Palmer GM, Ramanujam N, “Effect
of optical clearing agents on the in vivo optical properties of squamous epithelial
tissue.” Lasers in Surgery and Medicine. 38(10): 920-7. (2006).
• Timberlake GT, Yousef AL, Chiles SR, Moses RA, Givens RS, “Bonding corneal
tissue: Photoactivated diazopyruvoyl crosslinking agent.” Photochemical and
Photobiology. 81(5): 1180-1185. (2005).
Academic Honors
• National Institute of Health Training Grant 2007-2008
• National Science Foundation Graduate Fellowship (2004 – 2007)