Embed Size (px)
Citation preview
DEPARTMENT OF EDUCATION FY 09 Budget Reductions
November 17, 2008
2
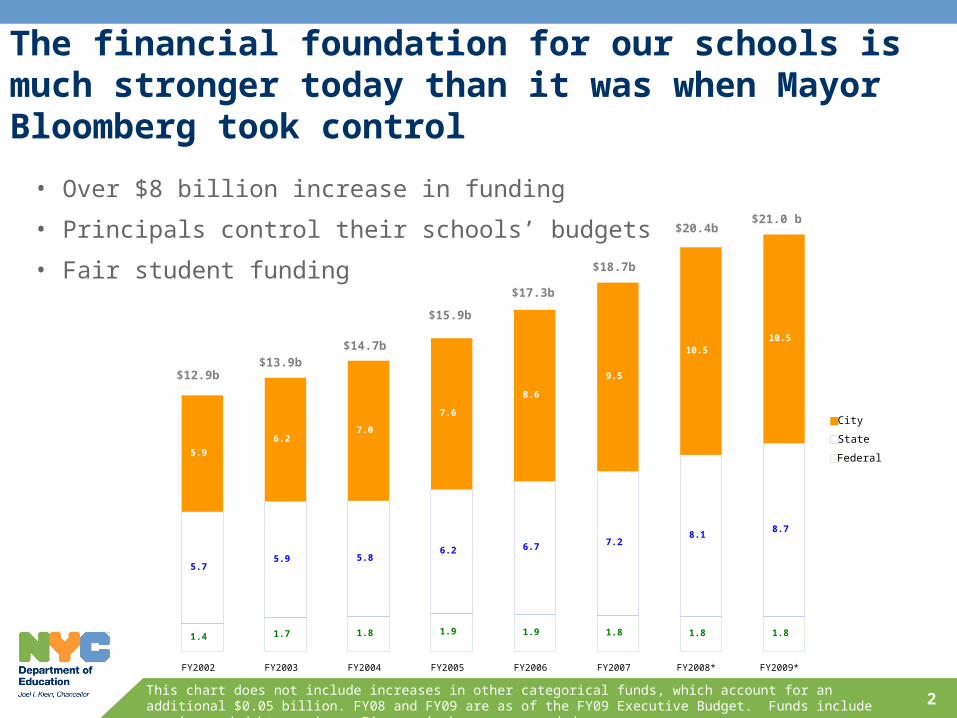
The financial foundation for our schools is much stronger today than it was when Mayor Bloomberg took control
• Over $8 billion increase in funding
• Principals control their schools’ budgets
• Fair student funding
This chart does not include increases in other categorical funds, which account for an additional $0.05 billion. FY08 and FY09 are as of the FY09 Executive Budget. Funds include pension and debt service. Figures in bars are rounded.
1.4 1.7 1.8 1.9 1.9 1.8 1.8 1.8
5.75.9 5.8
6.2 6.7 7.28.1
8.7
5.9
6.27.0
7.6
8.6
9.5
10.510.5
FY2002 FY2003 FY2004 FY2005 FY2006 FY2007 FY2008* FY2009*
City
State
Federal
$12.9b$13.9b
$14.7b
$15.9b
$17.3b
$18.7b
$20.4b$21.0 b
3
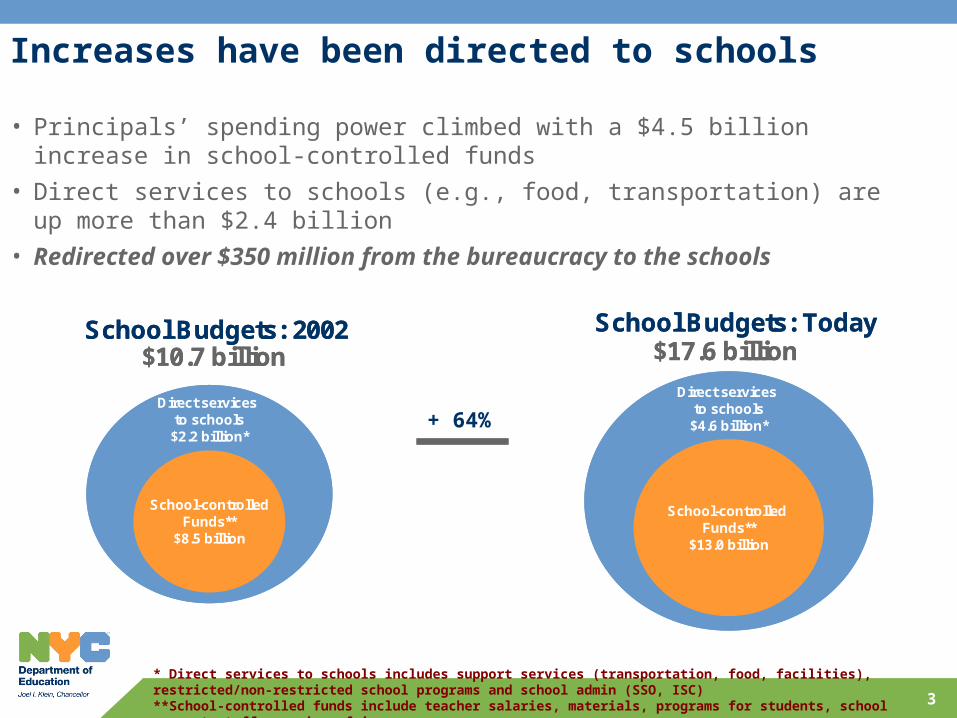
Increases have been directed to schools
* Direct services to schools includes support services (transportation, food, facilities), restricted/non-restricted school programs and school admin (SSO, ISC)**School-controlled funds include teacher salaries, materials, programs for students, school support staff, pension, fringe
• Principals’ spending power climbed with a $4.5 billion increase in school-controlled funds
• Direct services to schools (e.g., food, transportation) are up more than $2.4 billion
• Redirected over $350 million from the bureaucracy to the schools
School Budgets: 2002 School Budgets: Today
School-controlledFunds**
$8.5 billion
Direct services to schools
$2.2 billion*
School-controlled Funds**
$13.0 billion
Direct services to schools$4.6 billion*
$10.7 billion $17.6 billionSchool Budgets: 2002 School Budgets: Today
School-controlledFunds**
$8.5 billion
Direct services to schools
$2.2 billion*
School-controlled Funds**
$13.0 billion
Direct services to schools$4.6 billion*
$10.7 billion $17.6 billion
+ 64%
4
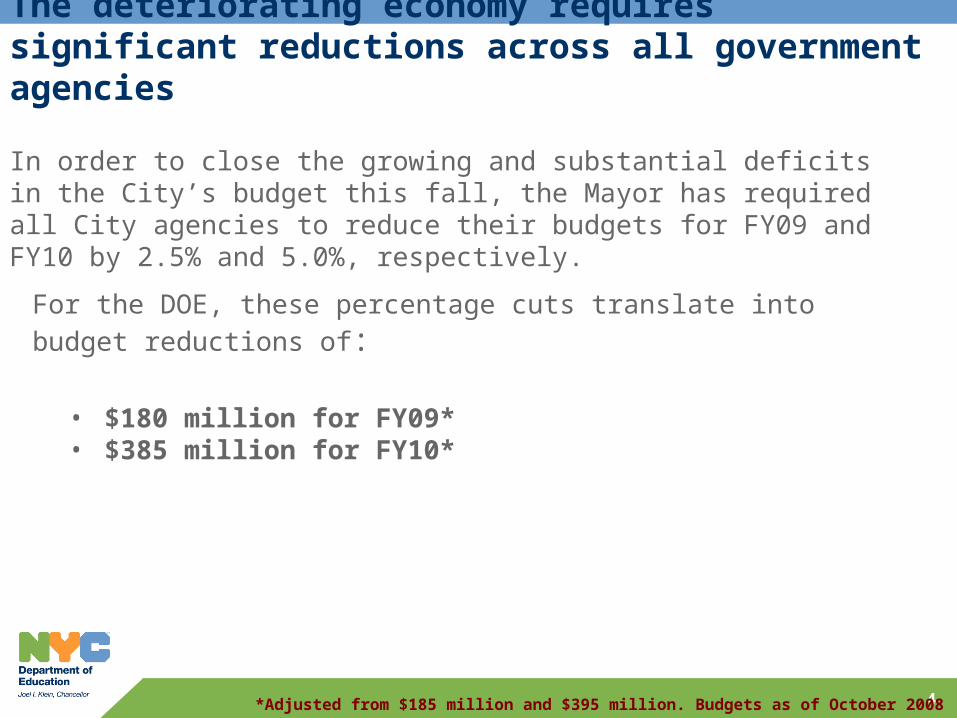
The deteriorating economy requires significant reductions across all government agencies
For the DOE, these percentage cuts translate into budget reductions of:
• $180 million for FY09*• $385 million for FY10*
In order to close the growing and substantial deficits in the City’s budget this fall, the Mayor has required all City agencies to reduce their budgets for FY09 and FY10 by 2.5% and 5.0%, respectively.
*Adjusted from $185 million and $395 million. Budgets as of October 2008
5
We have followed key principles in allocating funding cuts over the last 9 months
• Prioritize those programs and functions that have the highest impact on promoting student achievement aligned with the principles of Children First
• Minimize the dollars taken out of school budgets
• No layoffs at the school level for FY08 and FY09
• Further streamline central departments and field organizations with minimal impact on schools
6
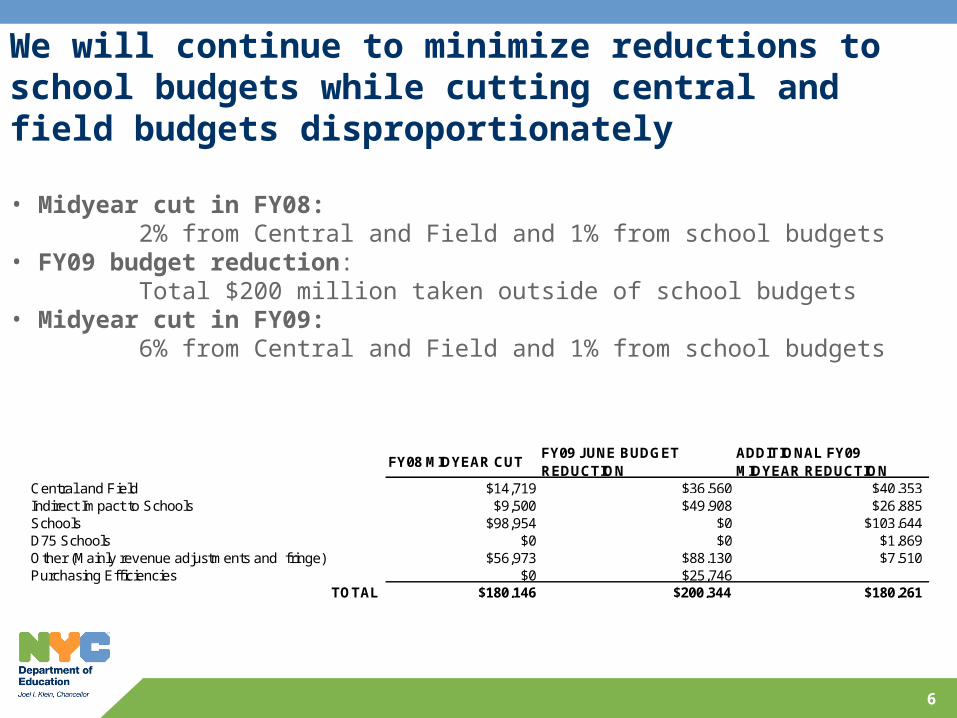
We will continue to minimize reductions to school budgets while cutting central and field budgets disproportionately
• Midyear cut in FY08: 2% from Central and Field and 1% from school budgets• FY09 budget reduction: Total $200 million taken outside of school budgets• Midyear cut in FY09: 6% from Central and Field and 1% from school budgets
FY08 MIDYEAR CUTFY09 JUNE BUDGET REDUCTION
ADDITIONAL FY09 MIDYEAR REDUCTION
Central and Field $14,719 $36,560 $40,353Indirect Impact to Schools $9,500 $49,908 $26,885Schools $98,954 $0 $103,644D75 Schools $0 $0 $1,869Other (Mainly revenue adjustments and fringe) $56,973 $88,130 $7,510Purchasing Efficiencies $0 $25,746
TOTAL $180,146 $200,344 $180,261
7
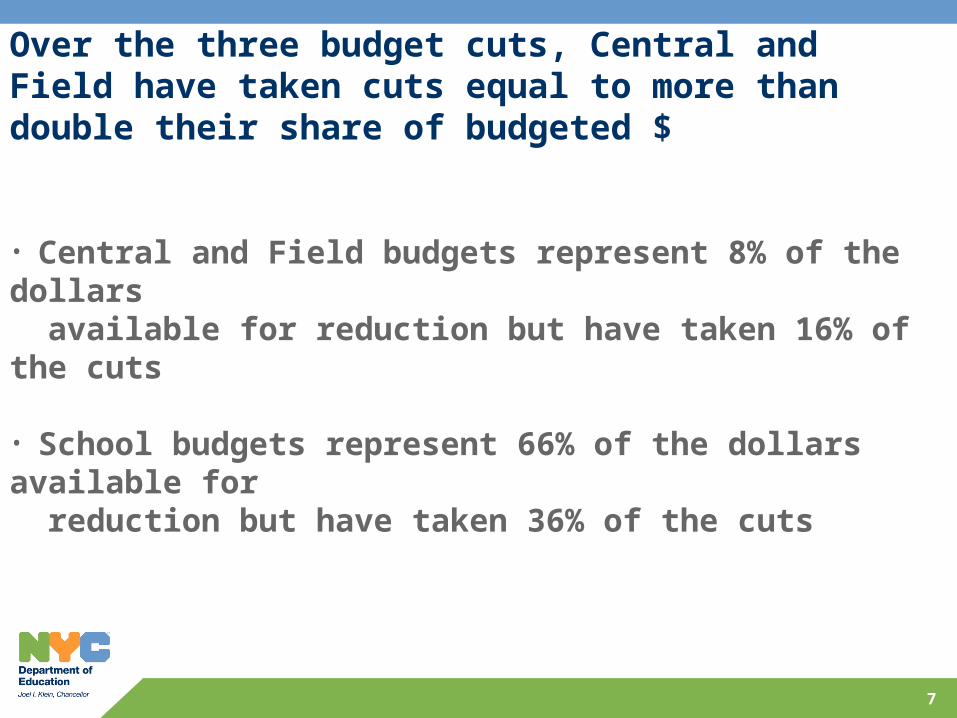
• Central and Field budgets represent 8% of the dollars available for reduction but have taken 16% of the cuts
• School budgets represent 66% of the dollars available for reduction but have taken 36% of the cuts
Over the three budget cuts, Central and Field have taken cuts equal to more than double their share of budgeted $
8
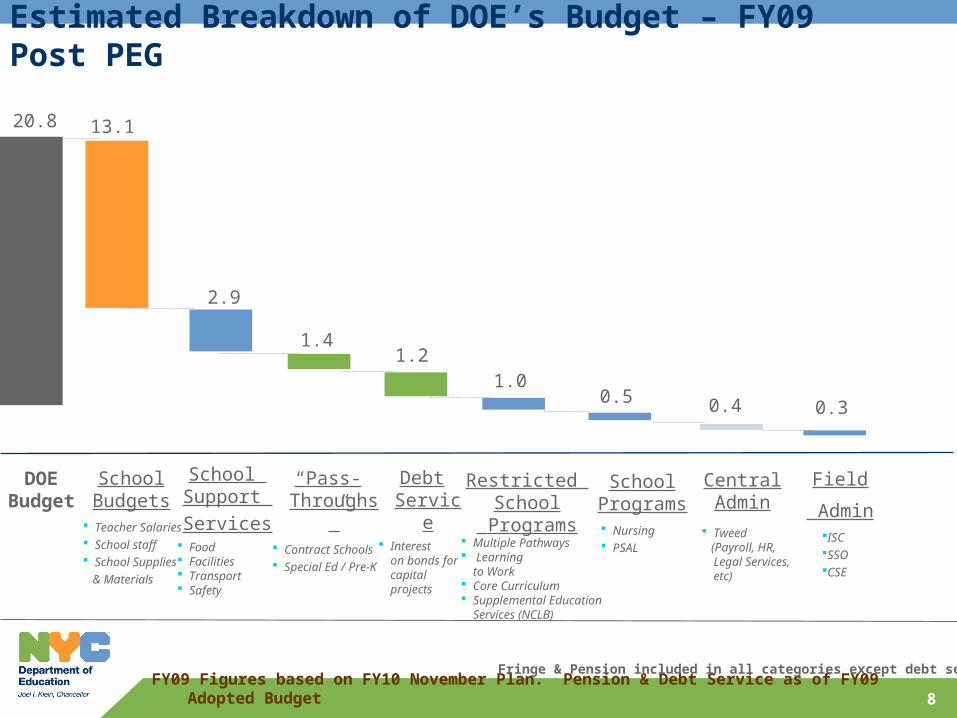
Estimated Breakdown of DOE’s Budget – FY09 Post PEG
FY09 Figures based on FY10 November Plan. Pension & Debt Service as of FY09 Adopted Budget
Fringe & Pension included in all categories except debt service
DOE Budget
School Budgets
Teacher Salaries School staff School Supplies
& Materials
13.120.8
2.9
School Support
Services Food Facilities Transport Safety
1.0
Restricted School
Programs Multiple Pathways Learning
to Work Core Curriculum Supplemental Education
Services (NCLB)
1.2
Debt Service
Interest on bonds for capital projects
0.5
School Programs Nursing PSAL
0.4
1.4
“Pass-Throughs”
Contract Schools Special Ed / Pre-K
Field
AdminISCSSOCSE
0.3
Central Admin
Tweed (Payroll, HR,
Legal Services, etc)
9
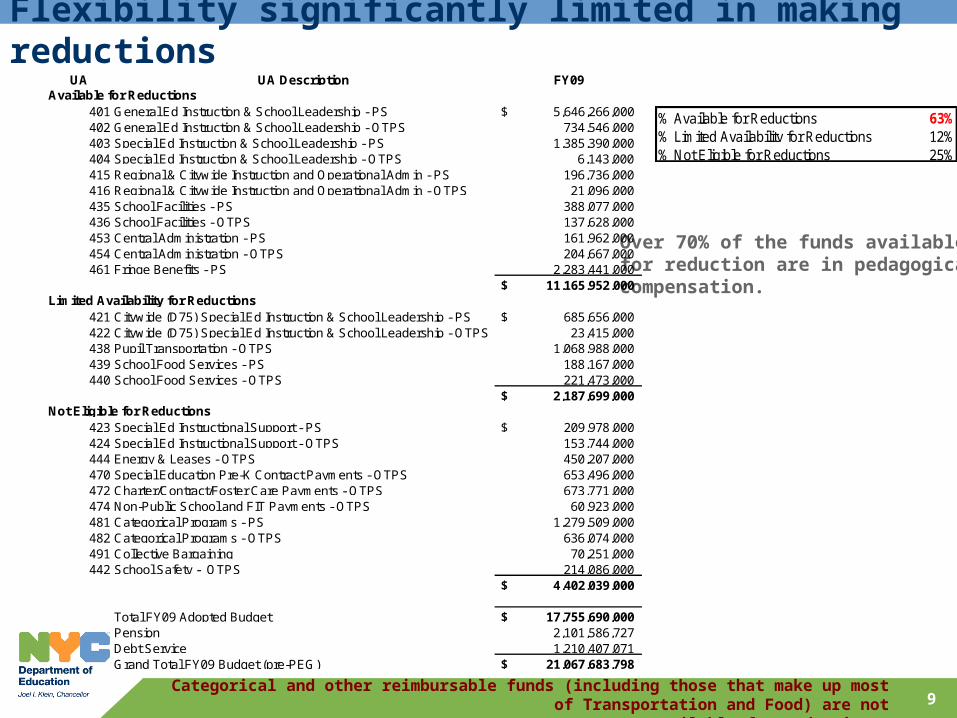
Flexibility significantly limited in making reductions
Categorical and other reimbursable funds (including those that make up most of Transportation and Food) are not available for reductions.
Over 70% of the funds available for reduction are in pedagogical compensation.
UA UA Description FY09
401 General Ed Instruction & School Leadership - PS $ 5,646,266,000 402 General Ed Instruction & School Leadership - OTPS 734,546,000 403 Special Ed Instruction & School Leadership - PS 1,385,390,000 404 Special Ed Instruction & School Leadership - OTPS 6,143,000 415 Regional & Citywide Instruction and Operational Admin - PS 196,736,000 416 Regional & Citywide Instruction and Operational Admin - OTPS 21,096,000 435 School Facilities - PS 388,077,000 436 School Facilities - OTPS 137,628,000 453 Central Administration - PS 161,962,000 454 Central Administration - OTPS 204,667,000 461 Fringe Benefits - PS 2,283,441,000
$ 11,165,952,000
421 Citywide (D75) Special Ed Instruction & School Leadership - PS $ 685,656,000 422 Citywide (D75) Special Ed Instruction & School Leadership - OTPS 23,415,000 438 Pupil Transportation - OTPS 1,068,988,000 439 School Food Services - PS 188,167,000 440 School Food Services - OTPS 221,473,000
$ 2,187,699,000
423 Special Ed Instructional Support - PS $ 209,978,000 424 Special Ed Instructional Support - OTPS 153,744,000 444 Energy & Leases - OTPS 450,207,000 470 Special Education Pre-K Contract Payments - OTPS 653,496,000 472 Charter/Contract/Foster Care Payments - OTPS 673,771,000 474 Non-Public School and FIT Payments - OTPS 60,923,000 481 Categorical Programs - PS 1,279,509,000 482 Categorical Programs - OTPS 636,074,000 491 Collective Bargaining 70,251,000 442 School Safety - OTPS 214,086,000
$ 4,402,039,000
Total FY09 Adopted Budget $ 17,755,690,000 Pension 2,101,586,727 Debt Service 1,210,407,071 Grand Total FY09 Budget (pre-PEG) $ 21,067,683,798
Available for Reductions
Not Eligible for Reductions
Limited Availability for Reductions
% Available for Reductions 63%% Limited Availability for Reductions 12%% Not Eligible for Reductions 25%
10
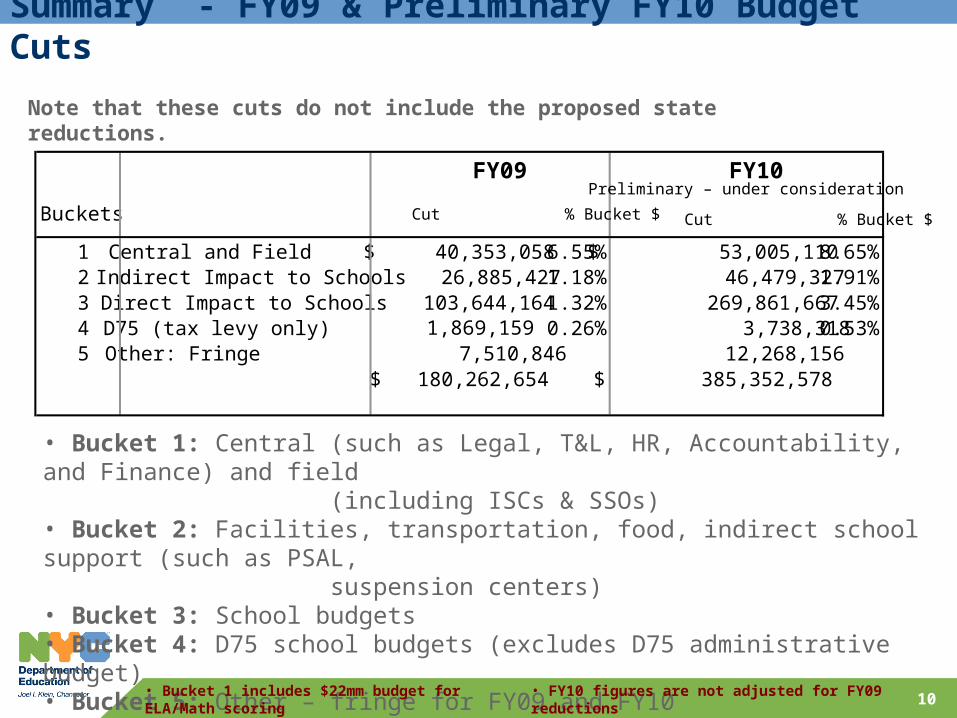
Summary - FY09 & Preliminary FY10 Budget Cuts
Note that these cuts do not include the proposed state reductions.
• Bucket 1: Central (such as Legal, T&L, HR, Accountability, and Finance) and field (including ISCs & SSOs)• Bucket 2: Facilities, transportation, food, indirect school support (such as PSAL, suspension centers)• Bucket 3: School budgets• Bucket 4: D75 school budgets (excludes D75 administrative budget)• Bucket 5: Other – fringe for FY09 and FY10
• FY10 figures are not adjusted for FY09 reductions• FY10 school funding is assumed at FY09 levels
• Bucket 1 includes $22mm budget for ELA/Math scoring
Buckets
1 Central and Field $ 40,353,058 6.55% $ 53,005,110 8.65%2 Indirect Impact to Schools 26,885,427 1.18% 46,479,327 1.91%3 Direct Impact to Schools 103,644,164 1.32% 269,861,667 3.45%4 D75 (tax levy only) 1,869,159 0.26% 3,738,318 0.53%5 Other: Fringe 7,510,846 12,268,156
$ 180,262,654 $ 385,352,578
FY09 FY10
Cut % Bucket $ Cut % Bucket $
Preliminary – under consideration
11
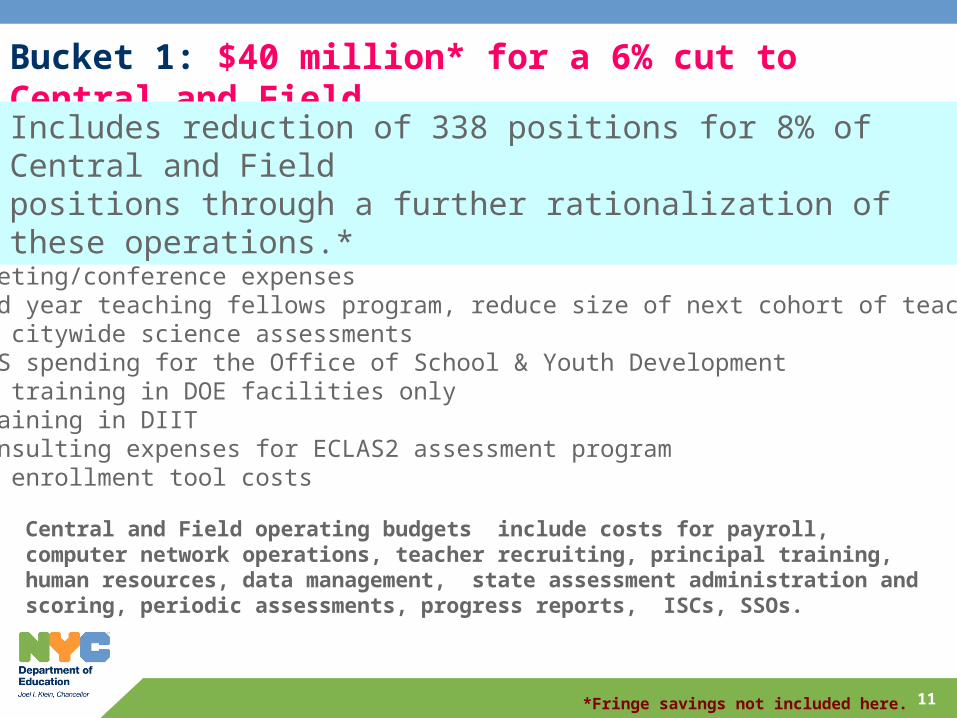
Bucket 1: $40 million* for a 6% cut to Central and Field
• Revise scoring of state assessments in Math and ELA, grades 3-8 • Reduce and/or combine publications in OSEPO• Reduce meeting/conference expenses• Cancel mid year teaching fellows program, reduce size of next cohort of teaching fellows• Eliminate citywide science assessments • Defer OTPS spending for the Office of School & Youth Development • Hold ARIS training in DOE facilities only• Reduce training in DIIT • Reduce consulting expenses for ECLAS2 assessment program• Reduce HS enrollment tool costs
Includes reduction of 338 positions for 8% of Central and Field positions through a further rationalization of these operations.*
Central and Field operating budgets include costs for payroll, computer network operations, teacher recruiting, principal training, human resources, data management, state assessment administration and scoring, periodic assessments, progress reports, ISCs, SSOs.
*Fringe savings not included here.
12
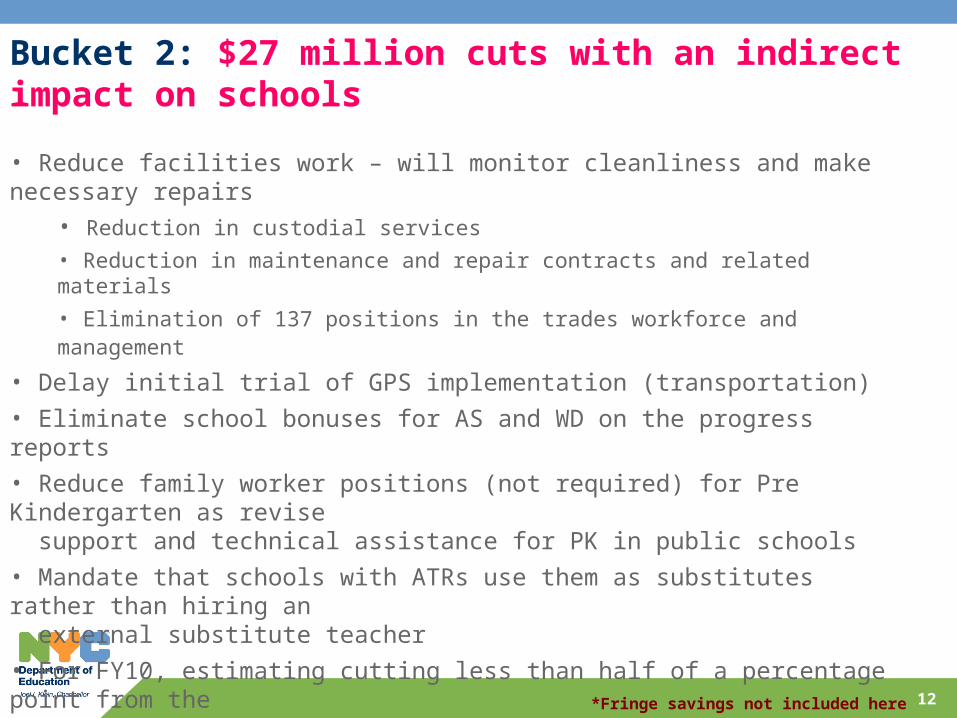
Bucket 2: $27 million cuts with an indirect impact on schools
• Reduce facilities work – will monitor cleanliness and make necessary repairs
• Reduction in custodial services
• Reduction in maintenance and repair contracts and related materials
• Elimination of 137 positions in the trades workforce and management
• Delay initial trial of GPS implementation (transportation)
• Eliminate school bonuses for AS and WD on the progress reports
• Reduce family worker positions (not required) for Pre Kindergarten as revise support and technical assistance for PK in public schools
• Mandate that schools with ATRs use them as substitutes rather than hiring an external substitute teacher
• For FY10, estimating cutting less than half of a percentage point from the transportation budget
*Fringe savings not included here
13
Bucket 3: Reduce school funds by $104 million for a 1.3% reduction in FY09
• Schools were notified of targets on November 10th
• Schools have through Nov 21st to work with ISC/CFN/SSO to identify specific targets
• Guidelines on reductions were provided to schools
• An estimated cut for FY10 was provided to help schools consider impact on and from FY10
• No school layoffs
Bucket includes all funds in schools budgets plus funds for school telephones, copiers, and suspension centers where utilization is controlled by principals but the funds reside outside of school budgets.
14
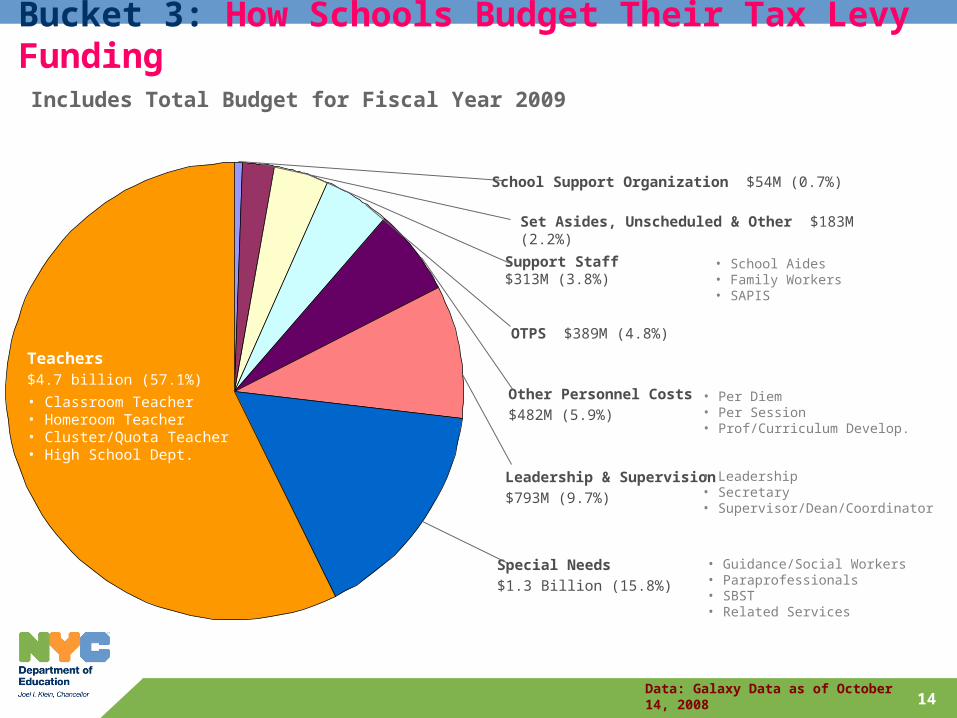
Teachers$4.7 billion (57.1%)
• Classroom Teacher• Homeroom Teacher• Cluster/Quota Teacher• High School Dept.
Special Needs
$1.3 Billion (15.8%)
Leadership & Supervision
$793M (9.7%)
Other Personnel Costs
$482M (5.9%)
OTPS $389M (4.8%)
Support Staff $313M (3.8%)
Set Asides, Unscheduled & Other $183M (2.2%)
• Leadership• Secretary• Supervisor/Dean/Coordinator
• Per Diem• Per Session• Prof/Curriculum Develop.
• School Aides• Family Workers• SAPIS
• Guidance/Social Workers• Paraprofessionals• SBST• Related Services
School Support Organization $54M (0.7%)
Teachers$4.7 billion (57.1%)
• Classroom Teacher• Homeroom Teacher• Cluster/Quota Teacher• High School Dept.
Includes Total Budget for Fiscal Year 2009
Data: Galaxy Data as of October 14, 2008
Bucket 3: How Schools Budget Their Tax Levy Funding
15
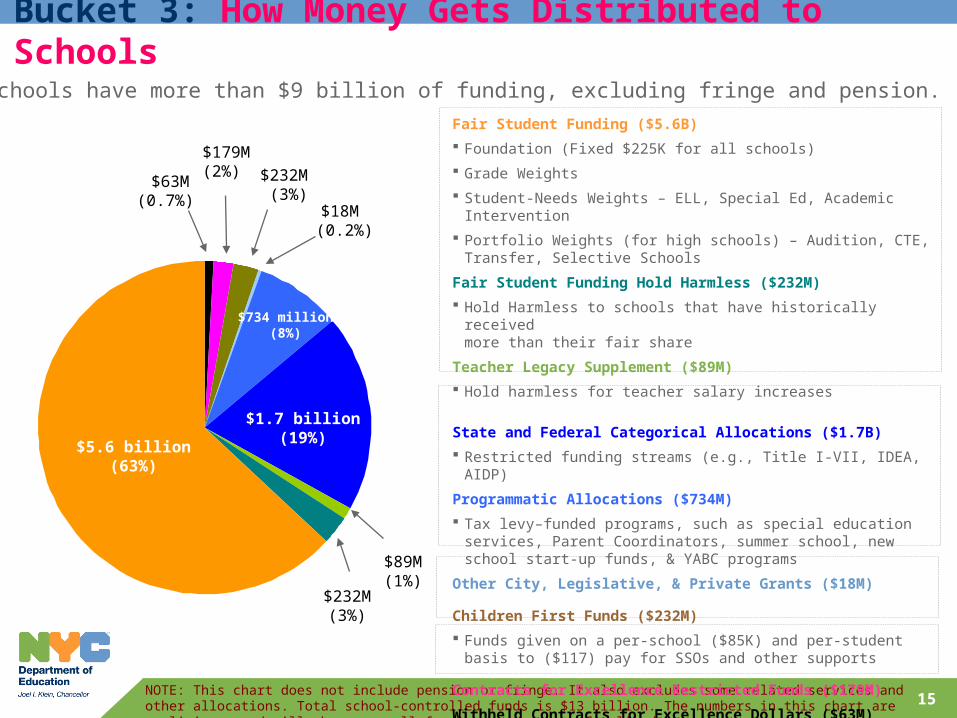
Bucket 3: How Money Gets Distributed to SchoolsIn total, schools have more than $9 billion of funding, excluding fringe and pension.
$179M(2%)
$5.6 billion (63%)
$1.7 billion(19%)
NOTE: This chart does not include pension or fringe. It also excludes some related services and other allocations. Total school-controlled funds is $13 billion. The numbers in this chart are preliminary and will change as all funding streams are finalized.
$89M (1%)
$232M (3%)
$232M (3%)
$63M(0.7%)
Fair Student Funding ($5.6B)
Foundation (Fixed $225K for all schools)
Grade Weights
Student-Needs Weights – ELL, Special Ed, Academic Intervention
Portfolio Weights (for high schools) – Audition, CTE, Transfer, Selective Schools
Fair Student Funding Hold Harmless ($232M)
Hold Harmless to schools that have historically received more than their fair share
Teacher Legacy Supplement ($89M)
Hold harmless for teacher salary increases
State and Federal Categorical Allocations ($1.7B)
Restricted funding streams (e.g., Title I-VII, IDEA, AIDP)
Programmatic Allocations ($734M)
Tax levy–funded programs, such as special education services, Parent Coordinators, summer school, new school start-up funds, & YABC programs
Other City, Legislative, & Private Grants ($18M)
Children First Funds ($232M)
Funds given on a per-school ($85K) and per-student basis to ($117) pay for SSOs and other supports
Contracts for Excellence Restricted Funds ($179M)
Withheld Contracts for Excellence Dollars ($63M)
$18M (0.2%)
$734 million(8%)
16
Bucket 4: District 75
District 75 schools were exempt from the last 2 round of cuts but this year will take under a $2 million cut for 0.26% reduction to their tax levy funding in FY09.
• Tax Levy funds: $727 million
• Reimbursable funds: $104 million
D75 figures represent total allocation as of November 2008
Bucket 5: Other - Fringe
• FY 09 cut: $7.5 million
• FY 10 cut: $12.3 million