Embed Size (px)
Citation preview
DEPARTMENT OF HEALTH AND HUMAN SERVICES
Centers for Medicare & Medicaid Services
42 CFR Parts 405, 412, 413, 414, 416, 486, 488, 489, and 495
[CMS-1677-CN]
RIN-0938-AS98
Medicare Program; Hospital Inpatient Prospective Payment Systems for Acute Care
Hospitals and the Long-Term Care Hospital Prospective Payment System and Policy
Changes and Fiscal Year 2018 Rates; Quality Reporting Requirements for Specific
Providers; Medicare and Medicaid Electronic Health Record (EHR) Incentive Program
Requirements for Eligible Hospitals, Critical Access Hospitals, and Eligible Professionals;
Provider-Based Status of Indian Health Service and Tribal Facilities and Organizations;
Costs Reporting and Provider Requirements; Agreement Termination Notices; Correction
AGENCY: Centers for Medicare & Medicaid Services (CMS), HHS.
ACTION: Final rule; correction.
SUMMARY: This document corrects technical and typographical errors in the final rule that
appeared in the August 14, 2017, issue of the Federal Register, which will amend the Medicare
hospital inpatient prospective payment systems (IPPS) for operating and capital related costs of
acute care hospitals to implement changes arising from our continuing experience with these
systems for FY 2018.
DATES: This correction is effective October 1, 2017.
FOR FURTHER INFORMATION CONTACT: Donald Thompson, (410) 786-4487.
SUPPLEMENTARY INFORMATION:
I. Background
This document is scheduled to be published in theFederal Register on 10/04/2017 and available online at https://federalregister.gov/d/2017-21325, and on FDsys.gov
CMS-1677-CN 2
In FR Doc. 2017-16434 of August 14, 2017 (82 FR 37990) there were a number of
technical and typographical errors that are identified and corrected by the Correction of Errors
section of this correcting document. The provisions in this correcting document are effective as
if they had been included in the document that appeared in the August 14, 2017 Federal
Register. Accordingly, the corrections are effective October 1, 2017.
II. Summary of Errors
A. Summary of Errors in the Preamble
On page 37990, we are making a conforming correction, removal of the reference to part
488, based on the removal of the regulations text for §488.5 described in section II.B. of this
correcting document.
On pages 38067 and 38068, we are correcting technical errors in our discussion and
summary of and response to public comment regarding ICD-10-PCS procedure codes describing
procedures involving percutaneous insertion of intraluminal or monitoring device. Specifically,
we erroneously referred to a count of 28 procedure codes describing procedures involving the
percutaneous insertion of intraluminal and monitoring devices into central nervous system and
other cardiovascular body parts rather than 18 procedure codes. Of the 28 codes listed in
Table 6P.4b associated with the proposed rule, 10 procedure codes were duplicative, and
erroneously included in the table and in the total number of codes referenced in the preamble.
As indicated in the final rule, after consideration of the public comments we received, we
maintained the designation of 15 procedure codes identified by the commenters. For this reason,
we are also correcting Table 6P.4b associated with the final rule (as discussed in section II.E. of
this correcting document) to reflect the 3 distinct procedure codes for which we finalized a
change in designation, including to remove the listings of ICD-10-PCS procedure codes
CMS-1677-CN 3
00H032Z (Insertion of Monitoring Device into Brain, Percutaneous Approach) and 00H632Z
(Insertion of Monitoring Device into Cerebral Ventricle, Percutaneous Approach), which we
finalized to maintain as O.R. procedures for FY 2018, and are making conforming changes to the
corresponding count of codes listed in that table as indicated on page 38068. Consistent with
these corrections, we are also correcting the description of the proposal on page 38067 of the
final rule. As a result of the corrections to Table 6P.4b associated with the final rule and the
conforming corrections on pages 38067 and 38068, we have made conforming changes to the
ICD-10 MS–DRG Definitions Manual Version 35 and ICD-10 MS-DRG Grouper Software
Version 35 for FY 2018 to reflect the O.R. designation of ICD-10-PCS procedure codes
00H032Z (Insertion of Monitoring Device into Brain, Percutaneous Approach) and 00H632Z
(Insertion of Monitoring Device into Cerebral Ventricle, Percutaneous Approach), as finalized
on page 38068 of the final rule for FY 2018.
In addition, after publication of the FY 2018 IPPS/LTCH PPS final rule, we became
aware that the logic for the ICD-10 MS–DRG Definitions Manual Version 35 and the ICD-10
MS-DRG Grouper and Medicare Code Editor (MCE) Version 35 Software erroneously
designated the following ICD-10-PCS procedure code as a non-O.R. procedure rather than as an
O.R. procedure as finalized on page 38072 of the final rule for FY 2018: 0BCC8ZZ (Extirpation
of matter from right upper lung lobe, via natural or artificial opening endoscopic). Therefore, we
also made changes to the ICD-10 MS–DRG Definitions Manual Version 35 and the ICD-10 MS-
DRG Grouper and MCE Version 35 Software to correctly reflect the O.R. designation for this
procedure code for FY 2018.
We recalculated the FY 2018 MS-DRG relative weights (and associated statistics, such as
average length of stay (ALOS)) as a result of the corrections to the logic for the ICD-10 MS-
CMS-1677-CN 4
DRG Grouper Version 35 Software discussed above. In addition, since the MS-LTC-DRGs used
under the LTCH PPS for FY 2018 are the same as the MS DRGs used under the IPPS for
FY 2018 (and as such use the same ICD-10 MS-DRG Grouper Version 35 Software), we also
recalculated the FY 2018 MS-LTC-DRG relative weights (and associated statistics, such as
geometric ALOS) for the same reasons.
On page 38119, we made a technical error in describing which ICD-10-PCS procedure
codes will be used to identify cases involving ZINPLAVA™ that are eligible for new technology
add-on payments in FY 2018. Specifically, cases involving ZINPLAVA™ that are eligible for
new technology add-on payments will be identified by either of the ICD-10-PCS procedure
codes listed in the final rule (XW033A3 or XW043A3) (rather than requiring the combination of
both ICD-10-PCS procedure codes).
On pages 38132 and 38137, in our discussion of the wage indexes, we provided incorrect
values for the FY 2018 national average hourly wage (unadjusted for occupational mix) and the
FY 2018 occupational mix adjusted national average hourly wage due to inadvertent errors
related to the wage data collected from the Medicare cost reports of six hospitals (CMS
Certification Numbers (CCNs) 240010, 420033, 420037, 420038, 420078, and 420102).
On page 38144, we made an inadvertent error in the mailing address for the Medicare
Geographic Review Board (MGCRB).
On page 38195, in our discussion regarding disproportionate share hospitals (DSHs), we
made errors in the June 2017 Office of the Actuary's estimate for FY 2018 Medicare DSH
payments.
On page 38225, we made typographical errors in our description of several Hospital
Readmissions Reduction Program (HRRP) measures.
CMS-1677-CN 5
On page 38249, in our response to a comment, we advertently referenced the MORT-30-
PN measure, instead of the PN Payment measure.
On page 38257 through 38259, in our discussion of the Hospital Value-Based Purchasing
(HVBP) Program, we made several typographical and technical errors to references and dates.
On pages 38309 and 38310, we are correcting the MS-LTC-DRG normalization factor
and the MS-LTC DRG budget neutrality factor based on the recalculation of the MS-LTC-DRG
relative weights due to the corrections to the MS-DRG Grouper Software Version 35 described
previously. (Because the MS-LTC-DRGs used under the LTCH PPS are the same as the
MS-DRGs used under the IPPS, the corrections to the MS-DRG Grouper Software Version 35
described previously affect the MS-LTC-DRGs groupings by extension.).
On pages 38426, 38434, 38440, and 38458, in our discussion of the LTCH Quality
Reporting Program (QRP), we made technical and typographical errors including an error in our
description of a quality measure.
B. Summary of Errors in the Regulations Text
On page 38516, we inadvertently retained regulations language from the proposed rule at
§ 488.5(a)(21), regarding accrediting organizations, after stating in the preamble of the final rule
that we had decided not to adopt such language. In addition, on page 38509, we inadvertently
retained a description of subjects set out in 42 CFR Part 488 in the “List of Subjects.” We are
correcting these errors by removing the description of subjects, amendatory instructions, and
regulations text for part 488.
On page 38516, in the regulations text provisions for §495.4 (definitions for the
Electronic Health Record (EHR) Incentive Program), we inadvertently omitted the definition of
certified electronic health record technology (CEHRT) for 2018.
CMS-1677-CN 6
On page 38517, in the regulations text provisions for §495.24, we inadvertently omitted
an EHR measure change for eligible professionals (EPs) in §495.24(d)(6)(i)(B)(1)(iv).
C. Summary of Errors in the Addendum
As discussed in section II.A. of this correcting document, we are making corrections to
the logic for the ICD-10 MS-DRG Grouper Version 35 Software for three ICD-10-PCS
procedure codes (0BCC8ZZ, 00H032Z and 00H632Z) that had been erroneously designated as
non-O.R. procedures rather than as O.R. procedures as finalized for FY 2018. As a result, we
have recalculated the FY 2018 MS-DRG relative weights after applying the changes in the
Version 35 MS-DRG groupings to the FY 2016 MedPAR data used for the final rule.
The FY 2018 MS-DRG relative weights are used to calculate the MS-DRG
reclassification and recalibration budget neutrality factor when comparing total payments using
FY 2017 MS-DRG relative weights to total payments using the FY 2018 MS-DRG relative
weights. Additionally, the FY 2018 MS-DRG relative weights are used when determining total
payments for purposes of all other budget neutrality factors and the final outlier threshold, which
are discussed in this section II.C. of this correcting document.
As discussed in section II.E. of this correcting document, we made several technical
errors with regard to the calculation of Factor 3 of the uncompensated care payment
methodology. Factor 3 is used to determine the total amount of the uncompensated care payment
a hospital is eligible to receive for a fiscal year. This amount is then used to calculate the amount
of the interim uncompensated care payments a hospital receives per discharge. Per discharge
uncompensated care payments are included when determining total payments for purposes of all
of the budget neutrality factors and the final outlier threshold.
As a result, the revisions made to address these technical errors regarding the calculation of
CMS-1677-CN 7
Factor 3 directly affected the calculation of total payments and required the recalculation of all
the budget neutrality factors and the final outlier threshold.
Because of the errors in the wage data for the six hospitals (CCNs 240010, 420033,
420037, 420038, 420078, and 420102), as discussed in section II.A. of this correcting document,
we recalculated the FY 2018 national average hourly wages unadjusted for occupational mix and
adjusted for occupational mix which resulted in the recalculation of the final FY 2018 IPPS wage
indexes and the geographic adjustment factors (GAFs) (which are computed from the wage
index). The final FY 2018 IPPS wage data are used in the calculation of the wage index budget
neutrality adjustment when comparing total payments using the final FY 2017 IPPS wage index
data to total payments using the final FY 2018 IPPS wage index data. Additionally, the final
FY 2018 IPPS wage index data are used when determining total payments for purposes of the
rest of the budget neutrality factors (except for the MS–DRG reclassification and recalibration
budget neutrality factor) and the final outlier threshold. In addition, the final FY 2018 IPPS
wage index data are used to calculate the FY 2018 LTCH PPS wage index values, certain budget
neutrality factors, and the LTCH PPS standard Federal payment rate in the FY 2018 IPPS/LTCH
PPS final rule.
Due to the correction of the combination of errors listed previously (recalculation of the
MS-DRG relative weights, revisions to Factor 3 of the uncompensated care methodology and
correction to the final FY 2018 IPPS wage index data), we recalculated all IPPS budget
neutrality adjustment factors, the fixed-loss cost threshold, the final wage indexes (and GAFs),
and the national operating standardized amounts and capital Federal rate. Therefore, we made
conforming changes to the following:
● On page 38522 and 38532, the MS–DRG reclassification and recalibration budget
CMS-1677-CN 8
neutrality factor.
● On page 38522, the wage index budget neutrality adjustment.
● On page 38522, the reclassification hospital budget neutrality adjustment.
● On page 38523, the rural and imputed floor budget neutrality adjustment.
● On page 38527, the calculation of the outlier fixed-loss cost threshold, the national
outlier adjustment factors, total operating Federal payments, total operating outlier payments,
and percentage of capital outlier payments.
● On page 38529, the table titled "Changes From FY 2017 Standardized Amounts to the
FY 2018 Standardized Amounts".
On pages 38532 and 38534 through 38535, in our discussion of the determination of the
Federal hospital inpatient capital related prospective payment rate update, due to the
recalculation of the MS-DRG relative weights and GAFs we have made conforming corrections
to the increase in the capital Federal rate, the capital outlier payment adjustment (budget
neutrality) factor, the GAF/DRG budget neutrality adjustment factors, the capital Federal rate,
and the outlier threshold (as discussed previously), along with certain statistical figures (for
example, percent change) in the accompanying discussions.
Also, as a result of these errors, on page 38535, we have made conforming corrections in
the tables showing the comparison of factors and adjustments for the FY 2017 capital Federal
rate and FY 2018 capital Federal rate and the proposed FY 2018 capital Federal rate and final
FY 2018 capital Federal rate.
On pages 38537 and 38539, we are correcting the area wage level budget neutrality factor
and making a conforming change to the FY 2018 LTCH PPS standard Federal payment rate due
to corrections to the wage data discussed previously.
CMS-1677-CN 9
On page 38544, we are making conforming corrections to the fixed-loss amount for
FY 2018 LTCH PPS standard Federal payment rate discharges and the high-cost outlier (HCO)
threshold determined in absence of the required changes under the 21st Century Cures Act due to
corrections in the MS-LTC-DRG data discussed previously.
On page 38545, we are making conforming corrections to the fixed-loss amount for site
neutral discharges due to corrections in the IPPS rates and factors discussed previously.
On pages 38546 and 38547, we are making conforming corrections to the figures used in
the example of computing the adjusted LTCH PPS Federal prospective payment for FY 2018.
On page 38548, we have made conforming corrections to the following:
● National adjusted operating standardized amounts and capital standard Federal
payment rate (which also include the rates payable to hospitals located in Puerto Rico) in Tables
1A, 1B, 1C, and 1D as a result of the conforming corrections to certain budget neutrality factors
and the outlier threshold (as described previously).
● LTCH PPS standard Federal payment rate in Table 1E as a result of the correction to
area wage level budget neutrality factor (as discussed previously).
Also, on page 38548, in Table 1E, we are correcting a technical error in our terminology
by replacing “Standard Federal Rate” with ‘Standard Federal Payment Rate”.
D. Summary of Errors in the Appendices
On pages 38552 through 38560 and 38572 through 38574 in our regulatory impact
analyses, we made conforming corrections to the factors, values, and tables and accompanying
discussion of the changes in operating and capital IPPS payments for FY 2018 and the effects of
certain budget neutrality factors as a result of the technical errors that lead to conforming
changes in our calculation of the operating and capital IPPS budget neutrality factors, outlier
CMS-1677-CN 10
threshold, final wage indexes, operating standardized amounts, and capital Federal rate (as
described in sections II.A. and II.C. of this correcting document).
In particular, we made changes to the following tables.
● On pages 38552 through 38554, the table titled “Table I.--Impact Analysis of Changes
to the IPPS for Operating Costs for FY 2018”.
● On pages 38557 through 38558, the table titled “FY 2018 IPPS Estimated Payments
Due To Rural and Imputed Floor With National Budget Neutrality”.
● On pages 38559 and 38560, the table titled “Table II--Impact Analysis of Changes for
FY 2018 Acute Care Hospital Operating Prospective Payment System [Payments per
Discharge]”.
● On pages 38572 through 38574, the table titled “Table III--Comparison of Total
Payments Per Case [FY 2017 Payments Compared to FY 2018 Payments]”.
On pages 38561 through 38564, we are correcting the discussion of the "Effects of the
Changes to Medicare DSH and Uncompensated Care Payments for FY 2018” for purposes of the
Regulatory Impact Analysis in Appendix A of the FY 2018 IPPS/LTCH PPS final rule in light of
the corrections discussed in sections II.D. and II.E. of this correcting document.
On pages 38576 and 38578 through 38579, we made conforming corrections to the area
wage level budget neutrality factor and the LTCH PPS standard Federal payment rate as
described in section II.C. of this correcting document.
On page 38579, we are making conforming corrections to “Table IV.—Impact of
Payment Rate and Policy Changes to LTCH PPS Payments for Standard Payment Rate Cases for
FY 2018.” We are also correcting technical errors in the terminology used in the title and
column headings of Table IV by ensuring the use of "Standard Federal Payment Rate".
CMS-1677-CN 11
On page 38585, we made conforming corrections to the estimated increase in capital
payments in FY 2018 compared to FY 2017.
E. Summary of Errors in and Corrections to Files and Tables Posted on the CMS Website
We are correcting the errors in the following IPPS tables that are listed on pages 38547
and 38548 of the FY 2018 IPPS/LTCH PPS final rule and are available on the Internet on the
CMS Web site at https://www.cms.gov/Medicare/Medicare-Fee-for-Service-
Payment/AcuteInpatientPPS/FY2018-IPPS-Final-Rule-Home-Page.html. The tables that are
available on the Internet have been updated to reflect the revisions discussed in this correcting
document.
Table 2 – Case-Mix Index and Wage Index Table- FY 2018. The wage data errors
related to the six hospitals required the recalculation of the FY 2018 national average hourly
wages unadjusted for occupational mix and adjusted for occupational mix which resulted in
recalculating the FY 2018 wage indexes. Also, the recalculation of the MS-DRG relative
weights, the revisions to Factor 3 of the uncompensated care payment methodology and
recalculation of the FY 2018 wage index necessitated the recalculation of the rural and imputed
floor budget neutrality factor (as discussed in section II.C. of this correcting document).
Therefore, we are correcting the values in the column titled “FY 2018 Wage Index” for all
hospitals. Additionally, for the six hospitals for which we inadvertently used the incorrect wage
data (as discussed in section II.A. of this correcting document), we are correcting the average
hourly wages in the columns titled “Average Hourly Wage FY 2018” and “3-Year Average
Hourly Wage (2016, 2017, 2018)”.
Table 3. – Wage Index Table by CBSA-FY 2018. The wage data errors related to the six
hospitals required the recalculation of the FY 2018 national average hourly wage adjusted for
CMS-1677-CN 12
occupational mix which resulted in recalculating the FY 2018 wage indexes. Also, the
recalculation of the MS-DRG relative weights, the revisions to Factor 3 of the uncompensated
care payment methodology, and recalculation of the FY 2018 wage index necessitated the
recalculation of the rural and imputed floor budget neutrality factor (as discussed in section II.C.
of this correcting document). Therefore, we are making corresponding changes to the wage
indexes and GAFs of all CBSAs listed in Table 3. Specifically, we are correcting the values and
flags in the columns titled "Wage Index", "Reclassified Wage Index", "GAF", "Reclassified
GAF", "Pre-Frontier and/or Pre-Rural or Imputed Floor Wage Index" and "Eligible for Rural or
Imputed Floor Wage Index". Additionally, for the two CBSAs (24860 and 40340) where the six
hospitals for which we inadvertently used the incorrect wage data are located (as discussed in
section II.A. of this correcting document), we are correcting the average hourly wages in the
columns titled “FY 2018 Average Hourly Wage” and “3-Year Average Hourly Wage (2016,
2017, 2018)”. As we described previously, we inadvertently used the incorrect wage data for the
following hospitals: CCNs 240010, 420033, 420037, 420038, 420078 and 420102.
Table 5.—List of Medicare Severity Diagnosis-Related Groups (MS–DRGs), Relative
Weighting Factors, and Geometric and Arithmetic Mean Length of Stay—FY 2018. We are
correcting this table to reflect the recalculation of the FY 2018 MS-DRG relative weights and
associated statistics as a result of the corrections to the logic for the ICD-10 MS-DRG Grouper
Version 35 Software discussed in section II.A. of this correcting document. Specifically, we are
correcting the values in the columns titled "Weights", "Geometric mean LOS", and "Arithmetic
mean LOS".
Table 6P.—ICD-10-CM and ICD-10-PCS Code Designations, MCE and MS-DRG
Changes—FY 2018. As discussed in section II.A of this correcting document, we are correcting
CMS-1677-CN 13
the list of the ICD-10-PCS procedure codes in Table 6P.4b to reflect the three ICD-10-PCS
procedure codes relating to the percutaneous insertion of intraluminal or monitoring devices that
are finalized as non-O.R. procedures for FY 2018.
Table 7B. -- Medicare Prospective Payment System Selected Percentile Lengths of Stay:
FY 2016 MedPAR Update—March 2017 GROUPER V35.0 MS–DRGs. We are correcting this
table to reflect the recalculation of the FY 2018 MS-DRG relative weights and associated
statistics as a result of the corrections to the logic for the ICD-10 MS-DRG Grouper Version 35
Software discussed in section II.A. of this correcting document.
Table 10 -- New Technology Add-On Payment Thresholds for Applications for FY 2019.
We are correcting the thresholds in this table as a result of the corrections to the operating
standardized amounts discussed in section II.C. of this correcting document.
Table 18.—Final FY 2018 Medicare DSH Uncompensated Care Payment Factor 3. We
are correcting this table to reflect revisions to the Factor 3 calculations for purposes of
determining uncompensated care payments for the FY 2018 IPPS/LTCH PPS final rule for the
following reasons:
• To apply our finalized policy of double weighting the 2013 Factor 3 instead of
developing a 2014 Factor 3 using uncompensated care cost data from Worksheet S-10 for several
all-inclusive rate providers.
• To reflect mergers where data for the merged hospital were not combined with the data
for the surviving hospital for purposes of calculating Factor 3 for the FY 2018 IPPS/LTCH PPS
Final Rule.
• To correct the Factor 3 that was computed for a hospital whose FY 2014 cost report in
the March 2017 extract of Healthcare Cost Report Information System (HCRIS) inadvertently
CMS-1677-CN 14
omitted amended uncompensated care cost data reported on an amended Worksheet S-10 that
had been received timely per CR 9648 issued on July, 15, 2016, and that was inadvertently
omitted from the hospital’s 2014 cost report when it was uploaded into HCRIS.
• To correct the Factor 3 that was computed for a hospital that only had Factor 3 values
for two cost reporting periods, but whose Factor 3 was inadvertently calculated by dividing by
three cost reporting periods when averaging the Factor 3 values.
• To correct the misapplication of our new hospital policy, where hospitals with a CMS
Certification Number (CCN) established after October 1, 2013, but before October 1, 2014, were
inadvertently considered subject to that policy when calculating Factor 3. As stated in the FY
2018 IPPS/LTCH PPS final rule (82 FR 38212), only those hospitals with a CCN established
after October 1, 2014, are considered new and subject to the new hospital policy when
calculating Factor 3 for FY 2018.
We are revising Factor 3 for all hospitals to correct these errors. We are also revising the
amount of the total uncompensated care payment calculated for each DSH-eligible hospital. The
total uncompensated care payment that a hospital receives is used to calculate the amount of the
interim uncompensated care payments the hospital receives per discharge. Per discharge
uncompensated care payments are included when determining total payments for purposes of all
of the budget neutrality factors and the final outlier threshold. As a result, these corrections to
the uncompensated care payments impacted the calculation of all the budget neutrality factors as
well as the outlier fixed-loss cost threshold for outlier payments. These corrections will be
reflected in Table 18 and the Medicare DSH Supplemental Data File. In section II.D. of this
correcting document, we have made corresponding revisions to the discussion of the “Effects of
the Changes to Medicare DSH and Uncompensated Care Payments for FY 2018” for purposes of
CMS-1677-CN 15
the Regulatory Impact Analysis in Appendix A of the FY 2018 IPPS/LTCH PPS final rule to
reflect the corrections discussed previously.
We are also correcting the errors in the following LTCH PPS tables that are listed on
page 38548 of the FY 2018 IPPS/LTCH PPS final rule and are available on the Internet on the
CMS Web site at https://www.cms.gov/Medicare/Medicare-Fee-for-
ServicePayment/LongTermCareHospitalPPS/index.html under the list item for regulation
number CMS-1677-F. The tables that are available on the Internet have been updated to reflect
the revisions discussed in this correcting document.
Table 11. -- MS-LTC-DRGs, Relative Weights, Geometric Average Length of Stay, and
Short-Stay Outlier (SSO) Threshold for LTCH PPS Discharges Occurring from October 1, 2017
through September 30, 2018. We are correcting this table to reflect the recalculation of the
FY 2018 MS-LTC-DRG relative weights and associated statistics as a result of the corrections to
the logic for the Version 35 Grouper Software discussed in section II.A. of this correcting
document.
Table 12A. -- LTCH PPS Wage Index for Urban Areas for Discharges Occurring from
October 1, 2017 through September 30, 2018. We are correcting this table to reflect the
revisions to the LTCH PPS wage index values discussed in section II.C. of this correcting
document.
Table 12B.—LTCH PPS Wage Index for Rural Areas for Discharges Occurring from
October 1, 2017 through September 30, 2018. We are correcting this table to reflect the
revisions to the LTCH PPS wage index values discussed in section II.C. of this correcting
document.
CMS-1677-CN 16
We also note that we have made conforming changes to the ICD-10 MS-DRG
Definitions Manual Version 35 for consistency with the ICD-10 MS-DRG Grouper and
Medicare Code Editor (MCE) Version 35 Software. First, the ICD-10-CM diagnosis code
P05.18 (Newborn small for gestational age, 2000-2499 grams) was displayed in the ICD–10
MS–DRG Definitions Manual Version 35 as grouping to both MS-DRGs 793 (Full Term
Neonate with Major Problems) and 795 (Normal Newborn). The correct MS-DRG assignment
for diagnosis code P05.18 is only MS-DRG 795; therefore, corrections were made to the ICD-10
MS-DRG Definitions Manual Version 35 to reflect the correct MS-DRG assignment. Second,
the following 9 diagnosis codes were not included in the major problem list in the MS-DRG
Definitions Manual: K56.600 (Partial intestinal obstruction, unspecified as to cause); K56.601
(Complete intestinal obstruction, unspecified as to cause); K56.609 (Unspecified intestinal
obstruction, unspecified as to partial versus complete obstruction); K56.690 (Other partial
intestinal obstruction); K56.691(Other complete intestinal obstruction); K56.699 (Other
intestinal obstruction unspecified as to partial versus complete obstruction); K91.30
(Postprocedural intestinal obstruction, unspecified as to partial versus complete); K91.31
(Postprocedural partial intestinal obstruction); and K91.32 (Postprocedural complete intestinal
obstruction). We made corrections to add these 9 diagnosis codes to the major problems list for
MS-DRG 793 under Major Diagnostic Category (MDC) 15 (Newborns & Other Neonates with
Conditions Originating in Perinatal Period) in the ICD-10 MS-DRG Definitions Manual Version
35.
III. Waiver of Proposed Rulemaking and Delay in Effective Date
We ordinarily publish a notice of proposed rulemaking in the Federal Register to
provide a period for public comment before the provisions of a rule take effect in accordance
CMS-1677-CN 17
with section 553(b) of the Administrative Procedure Act (APA) (5 U.S.C. 553(b)). However, we
can waive this notice and comment procedure if the Secretary finds, for good cause, that the
notice and comment process is impracticable, unnecessary, or contrary to the public interest, and
incorporates a statement of the finding and the reasons therefore in the notice.
Section 553(d) of the APA ordinarily requires a 30-day delay in the effective date of final
rules after the date of their publication in the Federal Register. This 30-day delay in effective
date can be waived, however, if an agency finds for good cause that the delay is impracticable,
unnecessary, or contrary to the public interest, and the agency incorporates a statement of the
findings and its reasons in the rule issued.
We believe that this correcting document does not constitute a rule that would be subject
to the APA notice and comment or delayed effective date requirements. This correcting
document corrects technical and typographic errors in the preamble, regulations text, addendum,
payment rates, tables, and appendices included or referenced in the FY 2018 IPPS/LTCH PPS
final rule but does not make substantive changes to the policies or payment methodologies that
were adopted in the final rule. As a result, this correcting document is intended to ensure that the
information in the FY 2018 IPPS/LTCH PPS final rule accurately reflects the policies adopted in
that final rule.
In addition, even if this were a rule to which the notice and comment procedures and
delayed effective date requirements applied, we find that there is good cause to waive such
requirements. Undertaking further notice and comment procedures to incorporate the corrections
in this document into the final rule or delaying the effective date would be contrary to the public
interest because it is in the public’s interest for providers to receive appropriate payments in as
timely a manner as possible, and to ensure that the FY 2018 IPPS/LTCH PPS final rule
CMS-1677-CN 18
accurately reflects our policies. Furthermore, such procedures would be unnecessary, as we are
not altering our payment methodologies or policies, but rather, we are simply implementing
correctly the policies that we previously proposed, received comment on, and subsequently
finalized. This correcting document is intended solely to ensure that the FY 2018 IPPS/LTCH
PPS final rule accurately reflects these payment methodologies and policies. Therefore, we
believe we have good cause to waive the notice and comment and effective date requirements.
Correction of Errors
In FR Doc. 2017-16434 of August 14, 2017 (82 FR 37990), we are making the following
corrections:
A. Corrections of Errors in the Preamble
1. On page 37990, first column, line 8 (Part headings), the figures "486, 488, 489, and
495" are corrected to read "486, 489, and 495".
2. On page 38067 --
a. Second column, last partial paragraph, line 1, the figure “28” is corrected to read “18”.
b. Third column--
(1) First partial paragraph--
(a) Line 7, the phrase "28 ICD-10-PCS” is corrected to read "28 (18 discrete)
ICD-10-PCS".
(b) Line 15, the phrase "O.R. procedures. We invite public" is corrected to read "O.R.
procedures. (We note that Table 6P.4b. associated with the proposed rule listed 28 rather than 18
ICD-10-PCS codes because we inadvertently included 10 duplicate codes. However only 18
discrete ICD-10-PCS codes were listed in that table.) We invite public".
(2) First full paragraph--
CMS-1677-CN 19
(a) Line 3, the figure “28” is corrected to read “18”.
(b) Line 9, the figure “28” is corrected to read “18”.
3. On page 38068, top half of the page (between the untitled tables) first column--
a. First paragraph, line 5, the figure "28" is corrected to read “18”.
b. Second paragraph, line 4, the figure “13” is corrected to read “3”.
4. On page 38119, third column, first partial paragraph, lines 25 and 26, the phrase
"XW033A3 and XW043A3." is corrected to read "XW033A3 or XW043A3."
5. On page 38132 --
a. Second column, first paragraph, last line, the figure "$42.1027" is corrected to read
"$42.0795".
b. Third column, first partial paragraph, line 4, the figure $42.1027" is corrected to read
"$42.0795".
6. On page 38137, third column –
a. First full paragraph, last line, the figure $42.0564" is corrected to read "$42.0332".
b. Last full paragraph, last line, the figure $42.0564" is corrected to read "$42.0332".
7. On page 38144, first column, first partial paragraph, lines 8 through 10, the phrase
“2520 Lord Baltimore Drive, Suite L, Baltimore, MD 21244– 2670.” is corrected to read “1508
Woodlawn Drive, Suite 100, Baltimore, MD 21207.”.
8. On page 38195--
a. Top of the page, third column, first full paragraph, line 19, the figure "$15.533" is
corrected to read "$15.553".
b. Bottom of the page in the table titled "FACTORS APPLIED FOR FY 2015
THROUGH FY 2018 TO ESTIMATE MEDICARE DSH EXPENDITURES USING 2014
CMS-1677-CN 20
BASELINE" last row (FY 2018), last column (Estimated DSH payment), the entry "15.533" is
corrected to read "15.553".
9. On page 38225--
a. First column, last bulleted paragraph, lines 3 through 5, the phrase "(AMI-Version 8.0,
HF-Version 8.0, Pneumonia-Version 8.0, COPD-Version 4.0, and Stroke-Version 4.0: 2016" is
corrected to read "(AMI-Version 9.0, HF-Version 9.0, Pneumonia-Version 9.0, COPD-Version
5.0, and Stroke-Version 5.0: 2016".
b. Second column; first bulleted paragraph, lines 2 through 4, the phrase "(THA and/or
TKA-Version 4.0, CABG-Version 2.0: 2016" is corrected to read "(THA and/or TKA-Version
5.0, CABG-Version 3.0: 2016)".
10. On page 38249, second column, last paragraph, lines 23 and 24, the parenthetical
phrase "(for example, the MORT–30–PN measure)" is corrected to read "(for example, PN
Payment measure)".
11. On page 38257, third column, footnote paragraph (footnote 69), last line, the date
"Mar 1997" is corrected to read "Mar 1977".
12. On page 38258, first column, third paragraph--
a. Lines 8 and 9, the reference "(78 FR 50074;" is corrected to read "(79 FR 50074;".
b. Line 9, the reference "80 FR 49588)." is corrected to read "80 FR 49558).".
13. On page 38259, first column, first partial paragraph, line 14, the date "June 0" is
corrected to read "June 30".
14. On page 38309, third column, first full paragraph, line 29 the figure “1.28590” is
corrected to read “1.28593”.
15. On page 38310, first column –
CMS-1677-CN 21
a. First full paragraph, line 29, the figure “0.9907845” is corrected to read “0.9907437”.
b. Second full paragraph--
(1) Line 5, the figure “1.28590” is corrected to read “1.28593”.
(2) Line 6, the figure “0.9907845” is corrected to read “0.9907437”.
16. On page 38426--
a. First column, second full paragraph, line 21, the phrase "an Application of Percent" is
corrected to read "Application of Percent".
b. Third column, third full paragraph, line 10, the phrase "criteria; however should" is
corrected to read "criteria. However, the measure should".
17. On page 38434, in the first column, second paragraph--
a. Line 29, the phrase "Stage 3 or 4 ulcers." is corrected to read "Stage 3 or 4 pressure
ulcers.".
b. Line 31, the phrase "Stage 1 and 2 ulcers decreased" is corrected to read "Stage 1 and
2 pressure ulcers decreased".
c. Line 32, the phrase " of Stage 3 and 4 ulcers" is corrected to read "of Stage 3 and 4
pressure ulcers".
18. On page 38440, third column, last paragraph--
a. Lines 10 and 11, the phrase "That nearly one third" is corrected to read "The fact that
nearly one third".
b. Lines 16 and 17, the phrase "LTCH, and also indicates" is corrected to read "LTCH.
It also indicates".
19. On page 38458, third column, second full paragraph---
CMS-1677-CN 22
a. Lines 21 through 23, the phrase (measure name) "Functional Outcome Measure:
Change in Mobility Among Patients Requiring Ventilator Support (NQF #2632)." is corrected to
read "Functional Outcome Measure: Change in Mobility Among Long-Term Care Hospital
(LTCH) Patients Requiring Ventilator Support (NQF #2632).".
b. Lines 31 through 34, the phrase (measure name) "Functional Outcome Measure:
Change in Mobility Among Patients Requiring Ventilator Support (NQF #2632)" is corrected to
read "Functional Outcome Measure: Change in Mobility Among Long-Term Care Hospital
(LTCH) Patients Requiring Ventilator Support (NQF #2632)."
20. On page 38509, second column, eighth full paragraph (List of subjects 42 CFR 488),
the paragraph is corrected by removing the paragraph.
B. Correction of Errors in the Regulations Text
1. On page 38516, in the first column, remove the part heading for part 488 and remove
amendatory instructions 34 and 35 in their entirety.
§ 495.4 [Corrected]
2. On page 38516, in the second column, after amendatory instruction 39a, add
amendatory instruction a2 to read--
"a2. In the definition of "Certified electronic health record technology (CEHRT)":
i. In paragraph (1)(iii), removing the phrase "for 2018 subsequent years" and adding in
its place the phrase "for 2019 and subsequent years"; and
ii. In the introductory text of paragraph (2), removing the phrase "For 2018 and
subsequent years," and adding in its place the phrase "For 2019 and subsequent years,"."
§ 495.24 [Corrected]
3. On page 38517, second column, sixth full paragraph, amendatory instruction 41d is
CMS-1677-CN 23
corrected and amendatory instructions 41e and f are correctly added to read as follows:
"d. Revising the paragraph (d) heading.
e. In paragraph (d)(6)(i)(B)(1)(iv) by removing the phrase "For an EHR reporting period
in 2017 only, an EP" and adding in its place the phrase "For an EHR reporting period in 2017
and 2018, an EP".
f. Revising paragraphs (d)(6)(i)(B)(2)(i) and (ii), (d)(6)(ii)(B)(1)(iv), and
(d)(6)(ii)(B)(2)(i) and (ii)."
C. Correction of Errors in the Addendum
1. On page 38522 --
a. Second column, first full paragraph--
(1) Line 3, the figure “0.997432” is corrected to read “0.997439”.
(2) Line 8, the figure “0.997432” is corrected to read “0.997439”.
b. Third column--
(1) First full paragraph, line 9, the figure “1.001148” is corrected to read “1.000882”.
(2) Last paragraph, line 11 the figure “0.988008” is corrected to read “0.987985”.
2. On page 38523, second column, first partial paragraph, line 2, the figure “0.993348” is
corrected to read “0.993324”.
3. On page 38527, lower two-thirds of the page (after the first untitled table), third
column--
a. First partial paragraph--
(1) Line 4, the figure “$26,601” is corrected to read “$26,537”.
(2) Line 5, the figure “85,942,484,975” is corrected to read “$90,203,348,168”.
(3) Line 6, the figure “$4,618,707,285” is corrected to read “$4,600,554,656”.
CMS-1677-CN 24
(4) Line 17, the figure “$26,601” is corrected to read “$26,537”.
b. First full paragraph, line 13, the figure “5.16” is corrected to read “5.17”.
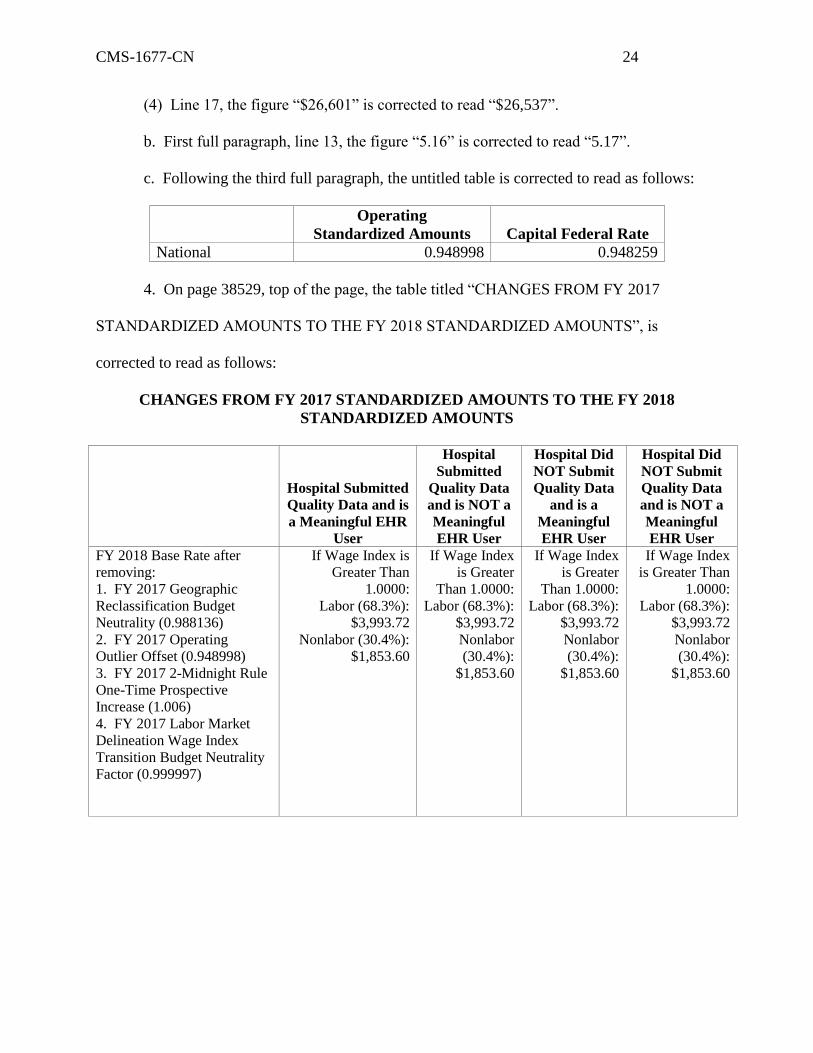
c. Following the third full paragraph, the untitled table is corrected to read as follows:
Operating
Standardized Amounts Capital Federal Rate
National 0.948998 0.948259
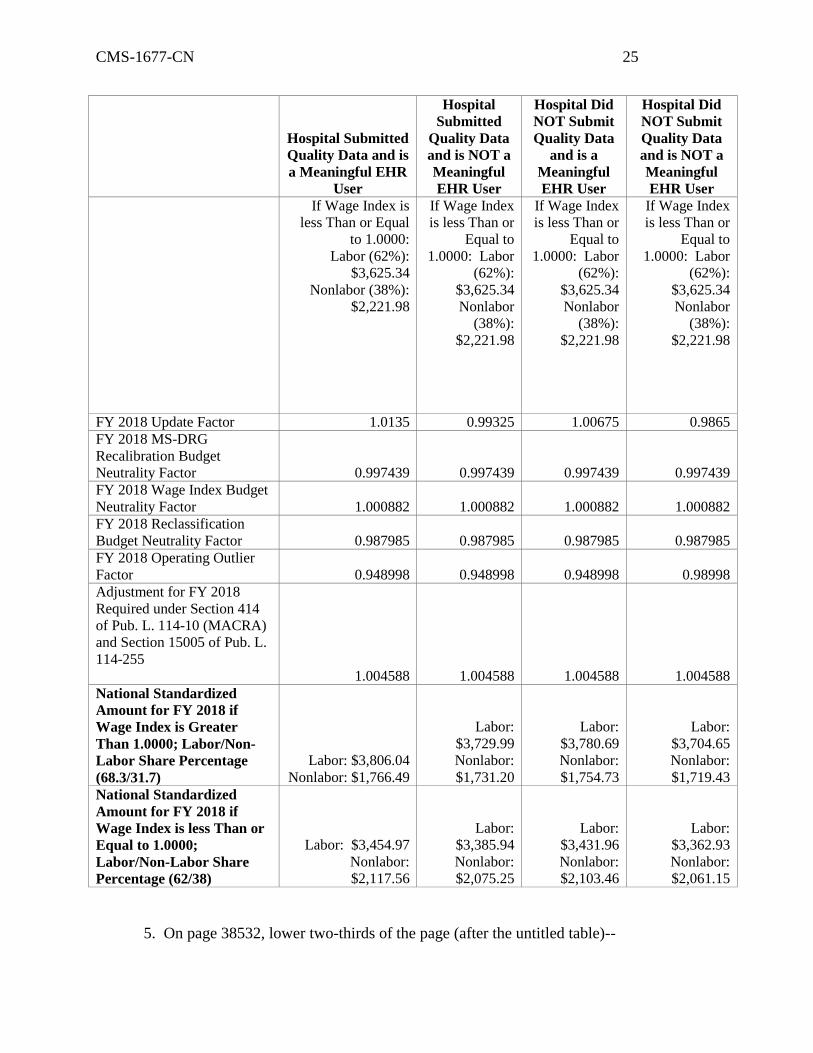
4. On page 38529, top of the page, the table titled “CHANGES FROM FY 2017
STANDARDIZED AMOUNTS TO THE FY 2018 STANDARDIZED AMOUNTS”, is
corrected to read as follows:
CHANGES FROM FY 2017 STANDARDIZED AMOUNTS TO THE FY 2018
STANDARDIZED AMOUNTS
Hospital Submitted
Quality Data and is
a Meaningful EHR
User
Hospital
Submitted
Quality Data
and is NOT a
Meaningful
EHR User
Hospital Did
NOT Submit
Quality Data
and is a
Meaningful
EHR User
Hospital Did
NOT Submit
Quality Data
and is NOT a
Meaningful
EHR User
FY 2018 Base Rate after
removing:
1. FY 2017 Geographic
Reclassification Budget
Neutrality (0.988136)
2. FY 2017 Operating
Outlier Offset (0.948998)
3. FY 2017 2-Midnight Rule
One-Time Prospective
Increase (1.006)
4. FY 2017 Labor Market
Delineation Wage Index
Transition Budget Neutrality
Factor (0.999997)
If Wage Index is
Greater Than
1.0000:
Labor (68.3%):
$3,993.72
Nonlabor (30.4%):
$1,853.60
If Wage Index
is Greater
Than 1.0000:
Labor (68.3%):
$3,993.72
Nonlabor
(30.4%):
$1,853.60
If Wage Index
is Greater
Than 1.0000:
Labor (68.3%):
$3,993.72
Nonlabor
(30.4%):
$1,853.60
If Wage Index
is Greater Than
1.0000:
Labor (68.3%):
$3,993.72
Nonlabor
(30.4%):
$1,853.60
CMS-1677-CN 25
Hospital Submitted
Quality Data and is
a Meaningful EHR
User
Hospital
Submitted
Quality Data
and is NOT a
Meaningful
EHR User
Hospital Did
NOT Submit
Quality Data
and is a
Meaningful
EHR User
Hospital Did
NOT Submit
Quality Data
and is NOT a
Meaningful
EHR User
If Wage Index is
less Than or Equal
to 1.0000:
Labor (62%):
$3,625.34
Nonlabor (38%):
$2,221.98
If Wage Index
is less Than or
Equal to
1.0000: Labor
(62%):
$3,625.34
Nonlabor
(38%):
$2,221.98
If Wage Index
is less Than or
Equal to
1.0000: Labor
(62%):
$3,625.34
Nonlabor
(38%):
$2,221.98
If Wage Index
is less Than or
Equal to
1.0000: Labor
(62%):
$3,625.34
Nonlabor
(38%):
$2,221.98
FY 2018 Update Factor 1.0135 0.99325 1.00675 0.9865
FY 2018 MS-DRG
Recalibration Budget
Neutrality Factor 0.997439 0.997439 0.997439 0.997439
FY 2018 Wage Index Budget
Neutrality Factor 1.000882 1.000882 1.000882 1.000882
FY 2018 Reclassification
Budget Neutrality Factor 0.987985 0.987985 0.987985 0.987985
FY 2018 Operating Outlier
Factor 0.948998 0.948998 0.948998 0.98998
Adjustment for FY 2018
Required under Section 414
of Pub. L. 114-10 (MACRA)
and Section 15005 of Pub. L.
114-255
1.004588 1.004588 1.004588 1.004588
National Standardized
Amount for FY 2018 if
Wage Index is Greater
Than 1.0000; Labor/Non-
Labor Share Percentage
(68.3/31.7)
Labor: $3,806.04
Nonlabor: $1,766.49
Labor:
$3,729.99
Nonlabor:
$1,731.20
Labor:
$3,780.69
Nonlabor:
$1,754.73
Labor:
$3,704.65
Nonlabor:
$1,719.43
National Standardized
Amount for FY 2018 if
Wage Index is less Than or
Equal to 1.0000;
Labor/Non-Labor Share
Percentage (62/38)
Labor: $3,454.97
Nonlabor:
$2,117.56
Labor:
$3,385.94
Nonlabor:
$2,075.25
Labor:
$3,431.96
Nonlabor:
$2,103.46
Labor:
$3,362.93
Nonlabor:
$2,061.15
5. On page 38532, lower two-thirds of the page (after the untitled table)--
CMS-1677-CN 26
a. First column, second full paragraph, line 13, the figure “0.997432” is corrected to read
“0.997439”.
b. Third column, second full paragraph, line 6, the figure “1.61” is corrected to read
“1.60”.
6. On page 38534--
a. First column –
(1) First full paragraph –
(a) Line 8, the figure “5.16” is corrected to read “5.17”.
(b) Line 12, the figure “0.9484” is corrected to read “0.9483”.
(2) Second full paragraph -–
(a) Lines 5 and 6, the phrase “outlier adjustment of 0.9484 is a 1.04 percent change” is
corrected to read “outlier adjustment of 0.9483 is a 1.03 percent change”.
(b) Line 10, the figures “1.0104 (0.9484/0.9386)” are corrected to read
“1.0103(0.9483/0.9386)”.
(c) Line 12, the figure “1.04” is corrected to read “1.03”.
(3) Fourth full paragraph --
(a) Line 13, the figure “0.9994” is corrected to read “0.9995”.
(b) Line 16, the figure “0.9844” is corrected to read “0.99845”.
b. Second column--–
(1). First partial paragraph, line 8, the figure “0.9837” is corrected to read “0.9838”.
(2). Third full paragraph--
(a) Line 1, the figure “0.9986” is corrected to read “0.9987”.
(b) Line 3, the figure “0.9994” is corrected to read “0.9995”.
CMS-1677-CN 27
c. Third column--
(1). First full paragraph--
(a) Line 4, the figure “1.61” is corrected to read “1.60”.
(b) Line 15, the figure “$453.97” is corrected to read “$453.95”.
(c) Second bulleted paragraph, last line, the figure “0.9986” is corrected to read
“0.9987”.
(d) Third bulleted paragraph, last line, the figure “0.9484” is corrected to read “0.9483”.
(e) Last paragraph--
(1) Line 15, the figure “0.14” is corrected to read “0.13”.
(2) Line 18, the figure “1.04” is corrected to read “1.03”.
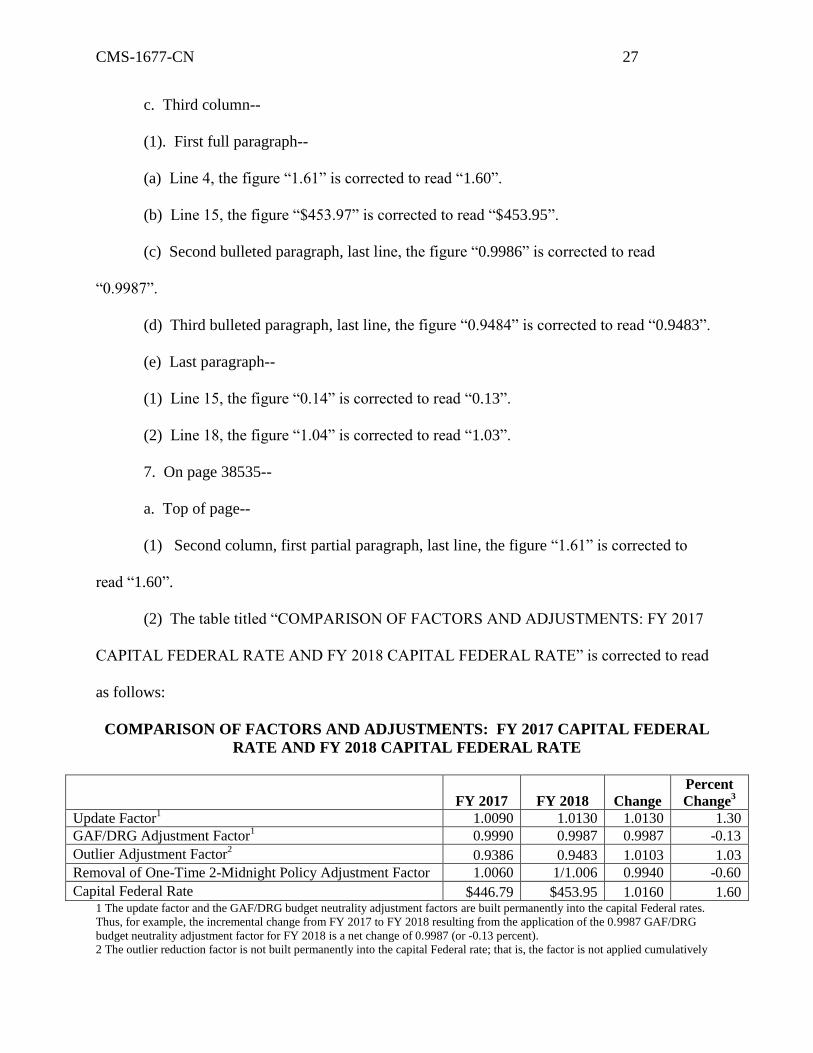
7. On page 38535--
a. Top of page--
(1) Second column, first partial paragraph, last line, the figure “1.61” is corrected to
read “1.60”.
(2) The table titled “COMPARISON OF FACTORS AND ADJUSTMENTS: FY 2017
CAPITAL FEDERAL RATE AND FY 2018 CAPITAL FEDERAL RATE” is corrected to read
as follows:
COMPARISON OF FACTORS AND ADJUSTMENTS: FY 2017 CAPITAL FEDERAL
RATE AND FY 2018 CAPITAL FEDERAL RATE
1 The update factor and the GAF/DRG budget neutrality adjustment factors are built permanently into the capital Federal rates.
Thus, for example, the incremental change from FY 2017 to FY 2018 resulting from the application of the 0.9987 GAF/DRG
budget neutrality adjustment factor for FY 2018 is a net change of 0.9987 (or -0.13 percent).
2 The outlier reduction factor is not built permanently into the capital Federal rate; that is, the factor is not applied cumulatively
FY 2017 FY 2018
Change
Percent
Change3
Update Factor1 1.0090 1.0130 1.0130 1.30
GAF/DRG Adjustment Factor1 0.9990 0.9987 0.9987 -0.13
Outlier Adjustment Factor2 0.9386 0.9483 1.0103 1.03
Removal of One-Time 2-Midnight Policy Adjustment Factor 1.0060 1/1.006 0.9940 -0.60
Capital Federal Rate $446.79 $453.95 1.0160 1.60
CMS-1677-CN 28
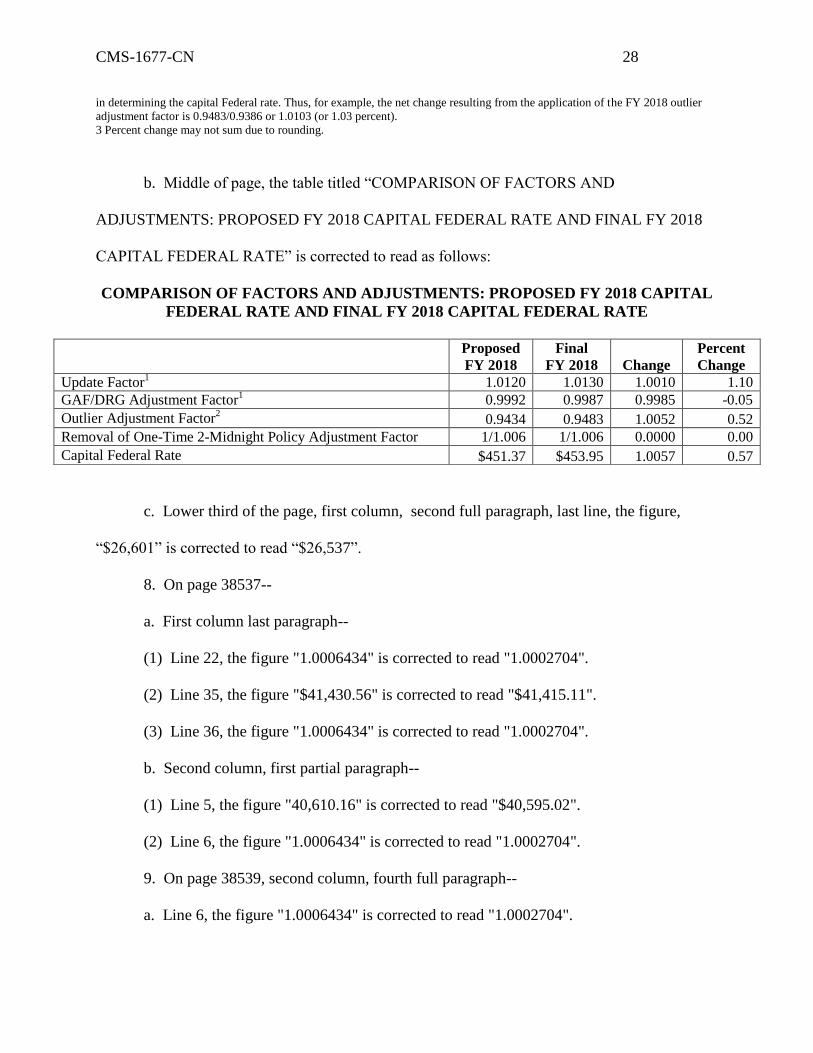
in determining the capital Federal rate. Thus, for example, the net change resulting from the application of the FY 2018 outlier
adjustment factor is 0.9483/0.9386 or 1.0103 (or 1.03 percent).
3 Percent change may not sum due to rounding.
b. Middle of page, the table titled “COMPARISON OF FACTORS AND
ADJUSTMENTS: PROPOSED FY 2018 CAPITAL FEDERAL RATE AND FINAL FY 2018
CAPITAL FEDERAL RATE” is corrected to read as follows:
COMPARISON OF FACTORS AND ADJUSTMENTS: PROPOSED FY 2018 CAPITAL
FEDERAL RATE AND FINAL FY 2018 CAPITAL FEDERAL RATE
c. Lower third of the page, first column, second full paragraph, last line, the figure,
“$26,601” is corrected to read “$26,537”.
8. On page 38537--
a. First column last paragraph--
(1) Line 22, the figure "1.0006434" is corrected to read "1.0002704".
(2) Line 35, the figure "$41,430.56" is corrected to read "$41,415.11".
(3) Line 36, the figure "1.0006434" is corrected to read "1.0002704".
b. Second column, first partial paragraph--
(1) Line 5, the figure "40,610.16" is corrected to read "$40,595.02".
(2) Line 6, the figure "1.0006434" is corrected to read "1.0002704".
9. On page 38539, second column, fourth full paragraph--
a. Line 6, the figure "1.0006434" is corrected to read "1.0002704".
Proposed
FY 2018
Final
FY 2018
Change
Percent
Change
Update Factor1 1.0120 1.0130 1.0010 1.10
GAF/DRG Adjustment Factor1 0.9992 0.9987 0.9985 -0.05
Outlier Adjustment Factor2 0.9434 0.9483 1.0052 0.52
Removal of One-Time 2-Midnight Policy Adjustment Factor 1/1.006 1/1.006 0.0000 0.00
Capital Federal Rate $451.37 $453.95 1.0057 0.57
CMS-1677-CN 29
b. Line 11, the figure "1.0006434" is corrected to read "1.0002704".
10. On page 38544—
a. First column--
(1) First partial paragraph—
(a) Line 6, the figure “27,382” is corrected to read “27,381”.
(b) Last line, the figure “27,382” is corrected to read “27,381”.
(2) First full paragraph—
(a) Line 4, the figure “27,382” is corrected to read “27,381”.
(b) Line 27, the figure “27,240” is corrected to read “27,239”.
(3) Second column, first partial paragraph, line 25, the figure “27,382” is corrected to
read “27,381”.
10. On page 38545--
a. Second column, second full paragraph--
(1) Line 14, the figure, “$26,601” is corrected to read “$26,537”.
(2) Last line, the figure, “$26,601” is corrected to read “$26,537”.
b. Third column, second full paragraph, line 3, the figure, “$26,601” is corrected to read
“$26,537”.
11. On page 38546, third column--
a. Second full paragraph, line 27, the figure "$41,430.56" is corrected to read
"$41,415.11".
b. Last paragraph, line 7, the figure "1.0547" is corrected to read "1.0553".
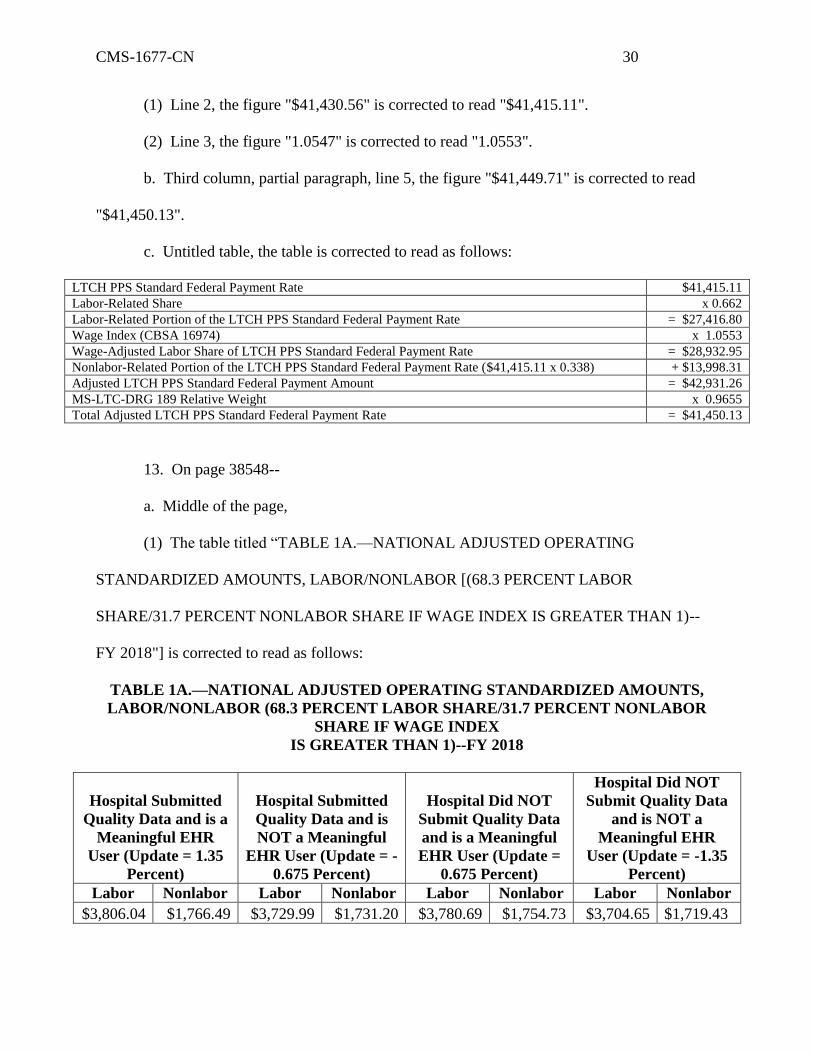
12. On page 38547, top of the page--
a. Second column, partial paragraph--
CMS-1677-CN 30
(1) Line 2, the figure "$41,430.56" is corrected to read "$41,415.11".
(2) Line 3, the figure "1.0547" is corrected to read "1.0553".
b. Third column, partial paragraph, line 5, the figure "$41,449.71" is corrected to read
"$41,450.13".
c. Untitled table, the table is corrected to read as follows:
LTCH PPS Standard Federal Payment Rate $41,415.11
Labor-Related Share x 0.662
Labor-Related Portion of the LTCH PPS Standard Federal Payment Rate = $27,416.80
Wage Index (CBSA 16974) x 1.0553
Wage-Adjusted Labor Share of LTCH PPS Standard Federal Payment Rate = $28,932.95
Nonlabor-Related Portion of the LTCH PPS Standard Federal Payment Rate ($41,415.11 x 0.338) + $13,998.31
Adjusted LTCH PPS Standard Federal Payment Amount = $42,931.26
MS-LTC-DRG 189 Relative Weight x 0.9655
Total Adjusted LTCH PPS Standard Federal Payment Rate = $41,450.13
13. On page 38548--
a. Middle of the page,
(1) The table titled “TABLE 1A.—NATIONAL ADJUSTED OPERATING
STANDARDIZED AMOUNTS, LABOR/NONLABOR [(68.3 PERCENT LABOR
SHARE/31.7 PERCENT NONLABOR SHARE IF WAGE INDEX IS GREATER THAN 1)--
FY 2018"] is corrected to read as follows:
TABLE 1A.—NATIONAL ADJUSTED OPERATING STANDARDIZED AMOUNTS,
LABOR/NONLABOR (68.3 PERCENT LABOR SHARE/31.7 PERCENT NONLABOR
SHARE IF WAGE INDEX
IS GREATER THAN 1)--FY 2018
Hospital Submitted
Quality Data and is a
Meaningful EHR
User (Update = 1.35
Percent)
Hospital Submitted
Quality Data and is
NOT a Meaningful
EHR User (Update = -
0.675 Percent)
Hospital Did NOT
Submit Quality Data
and is a Meaningful
EHR User (Update =
0.675 Percent)
Hospital Did NOT
Submit Quality Data
and is NOT a
Meaningful EHR
User (Update = -1.35
Percent)
Labor Nonlabor Labor Nonlabor Labor Nonlabor Labor Nonlabor
$3,806.04 $1,766.49 $3,729.99 $1,731.20 $3,780.69 $1,754.73 $3,704.65 $1,719.43
CMS-1677-CN 31
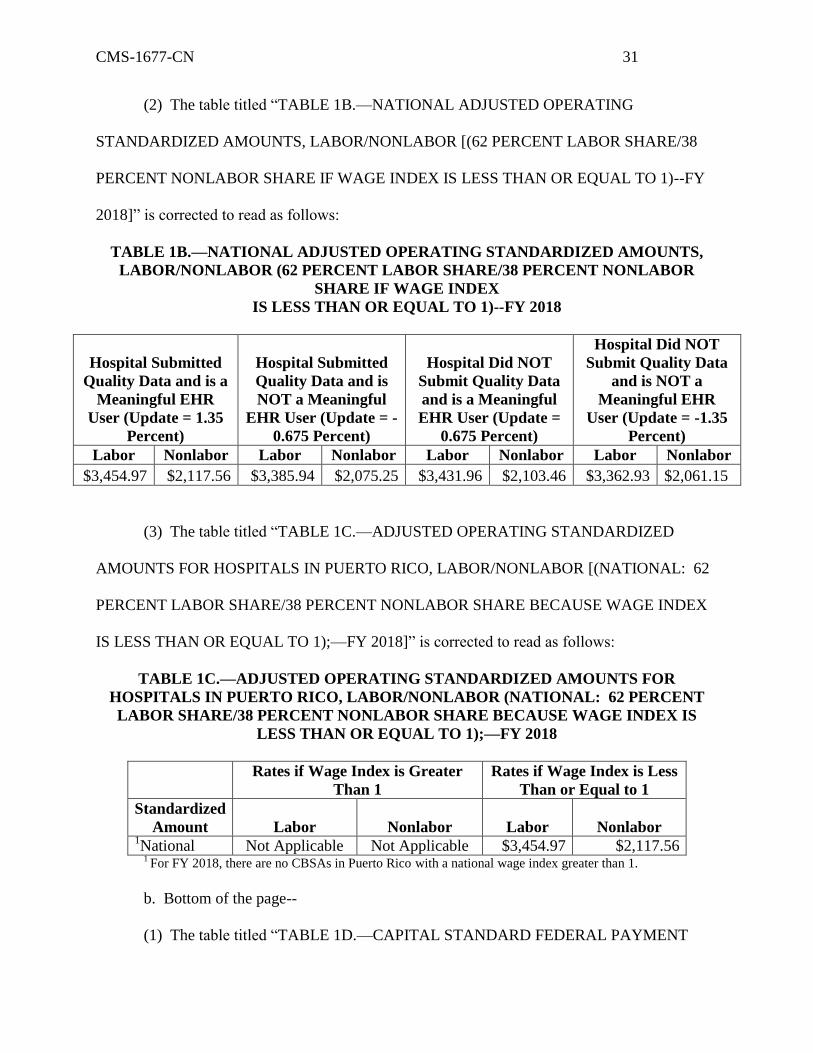
(2) The table titled “TABLE 1B.—NATIONAL ADJUSTED OPERATING
STANDARDIZED AMOUNTS, LABOR/NONLABOR [(62 PERCENT LABOR SHARE/38
PERCENT NONLABOR SHARE IF WAGE INDEX IS LESS THAN OR EQUAL TO 1)--FY
2018]” is corrected to read as follows:
TABLE 1B.—NATIONAL ADJUSTED OPERATING STANDARDIZED AMOUNTS,
LABOR/NONLABOR (62 PERCENT LABOR SHARE/38 PERCENT NONLABOR
SHARE IF WAGE INDEX
IS LESS THAN OR EQUAL TO 1)--FY 2018
Hospital Submitted
Quality Data and is a
Meaningful EHR
User (Update = 1.35
Percent)
Hospital Submitted
Quality Data and is
NOT a Meaningful
EHR User (Update = -
0.675 Percent)
Hospital Did NOT
Submit Quality Data
and is a Meaningful
EHR User (Update =
0.675 Percent)
Hospital Did NOT
Submit Quality Data
and is NOT a
Meaningful EHR
User (Update = -1.35
Percent)
Labor Nonlabor Labor Nonlabor Labor Nonlabor Labor Nonlabor
$3,454.97 $2,117.56 $3,385.94 $2,075.25 $3,431.96 $2,103.46 $3,362.93 $2,061.15
(3) The table titled “TABLE 1C.—ADJUSTED OPERATING STANDARDIZED
AMOUNTS FOR HOSPITALS IN PUERTO RICO, LABOR/NONLABOR [(NATIONAL: 62
PERCENT LABOR SHARE/38 PERCENT NONLABOR SHARE BECAUSE WAGE INDEX
IS LESS THAN OR EQUAL TO 1);—FY 2018]” is corrected to read as follows:
TABLE 1C.—ADJUSTED OPERATING STANDARDIZED AMOUNTS FOR
HOSPITALS IN PUERTO RICO, LABOR/NONLABOR (NATIONAL: 62 PERCENT
LABOR SHARE/38 PERCENT NONLABOR SHARE BECAUSE WAGE INDEX IS
LESS THAN OR EQUAL TO 1);—FY 2018
Rates if Wage Index is Greater
Than 1
Rates if Wage Index is Less
Than or Equal to 1
Standardized
Amount Labor Nonlabor Labor Nonlabor 1National Not Applicable Not Applicable $3,454.97 $2,117.56
1 For FY 2018, there are no CBSAs in Puerto Rico with a national wage index greater than 1.
b. Bottom of the page--
(1) The table titled “TABLE 1D.—CAPITAL STANDARD FEDERAL PAYMENT
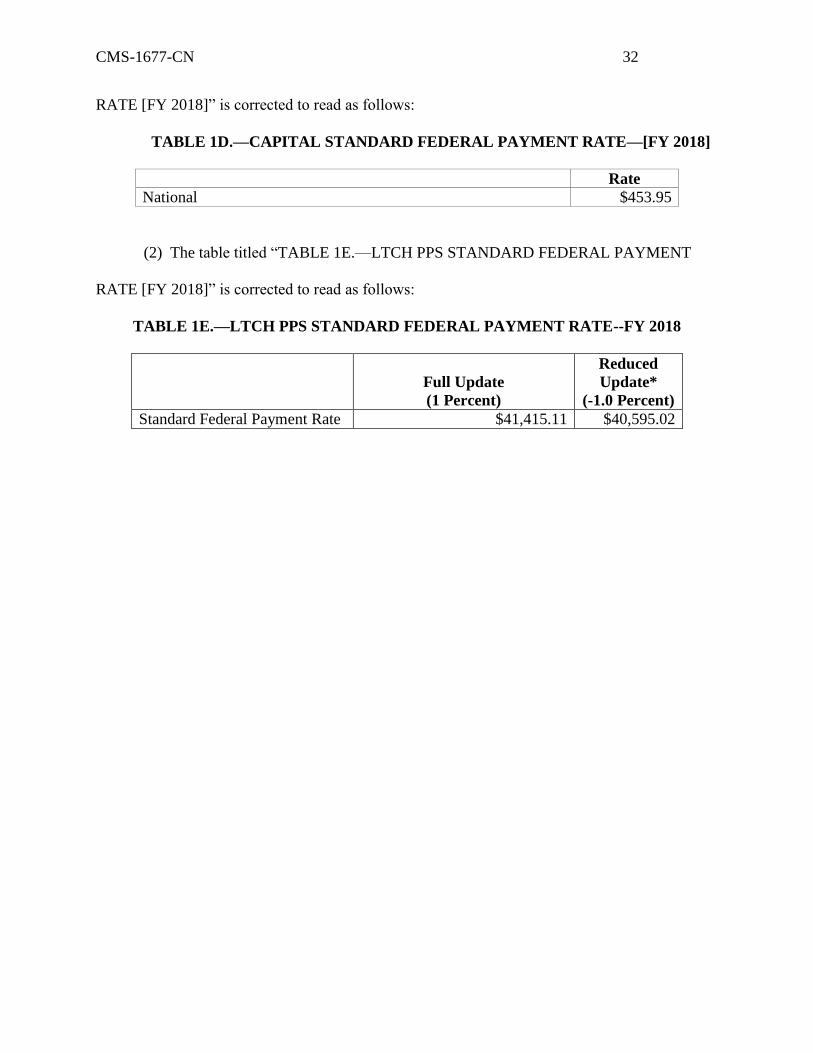
CMS-1677-CN 32
RATE [FY 2018]” is corrected to read as follows:
TABLE 1D.—CAPITAL STANDARD FEDERAL PAYMENT RATE—[FY 2018]
Rate
National $453.95
(2) The table titled “TABLE 1E.—LTCH PPS STANDARD FEDERAL PAYMENT
RATE [FY 2018]” is corrected to read as follows:
TABLE 1E.—LTCH PPS STANDARD FEDERAL PAYMENT RATE--FY 2018
Full Update
(1 Percent)
Reduced
Update*
(-1.0 Percent)
Standard Federal Payment Rate $41,415.11 $40,595.02
CMS-1677-CN 33
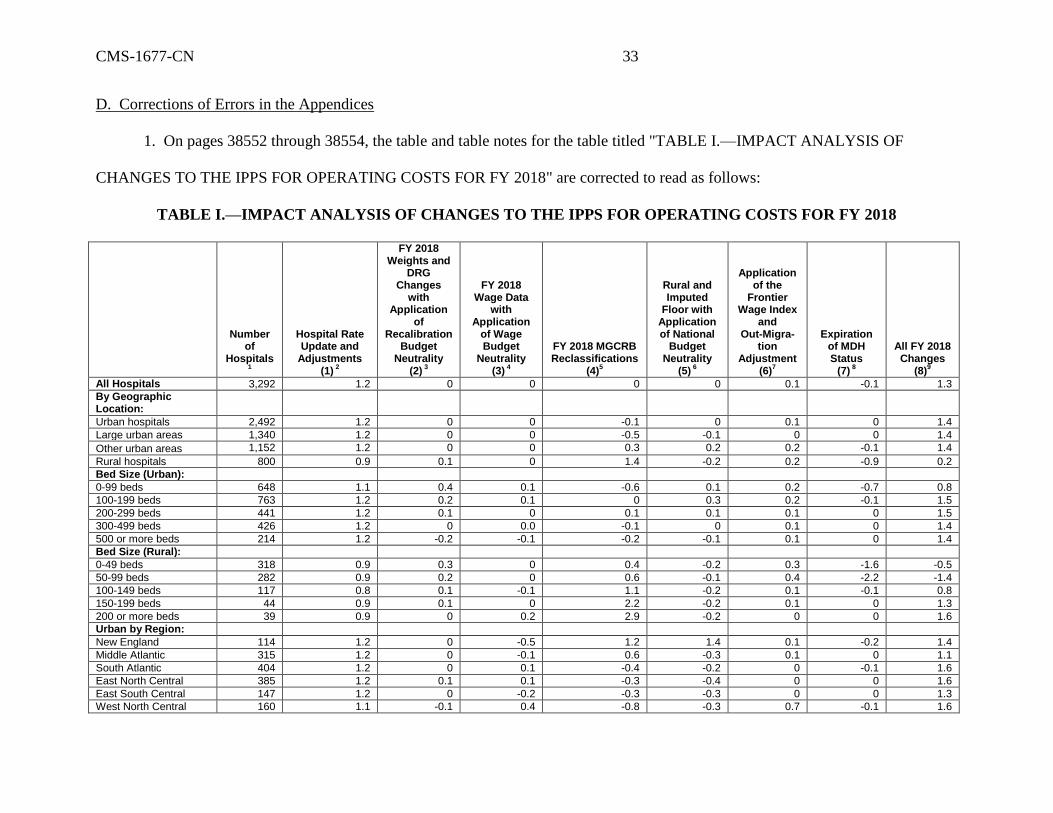
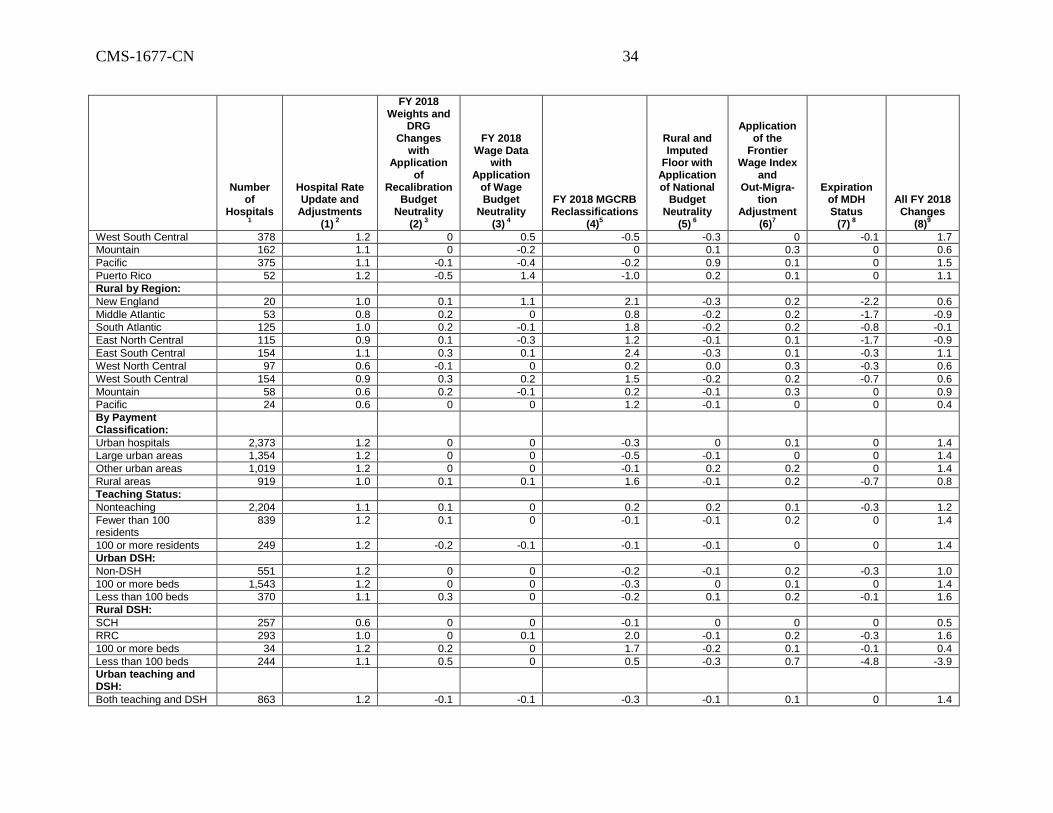
D. Corrections of Errors in the Appendices
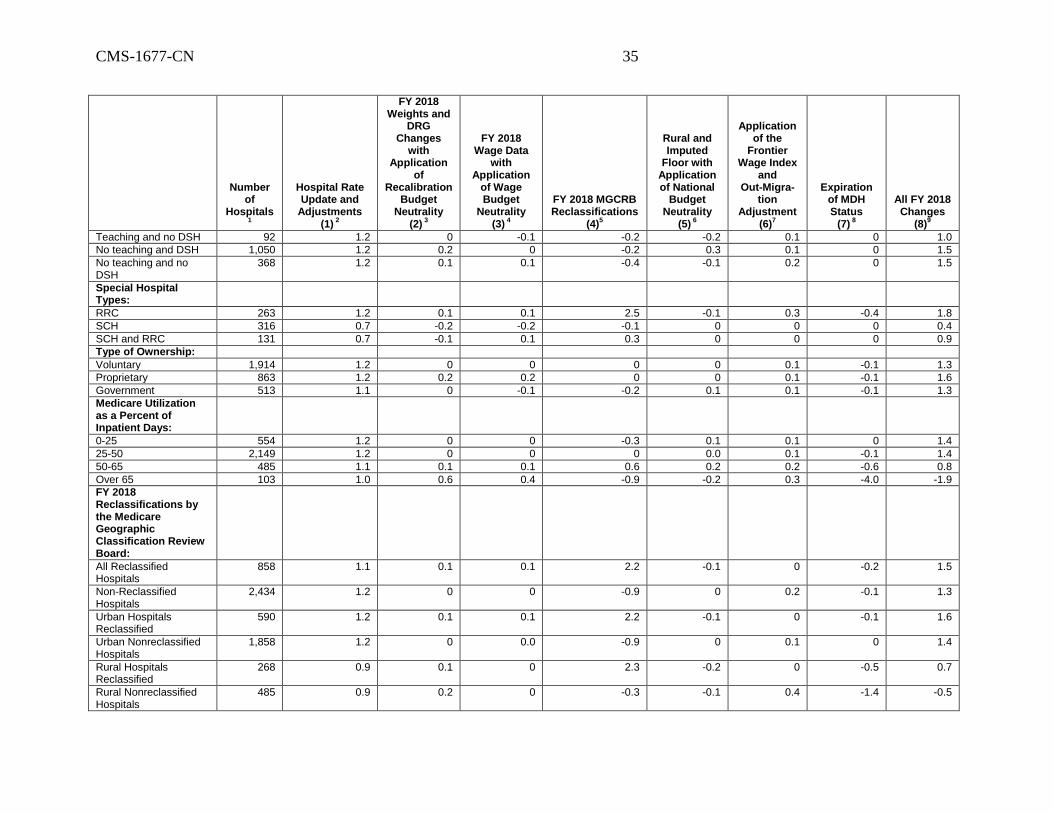
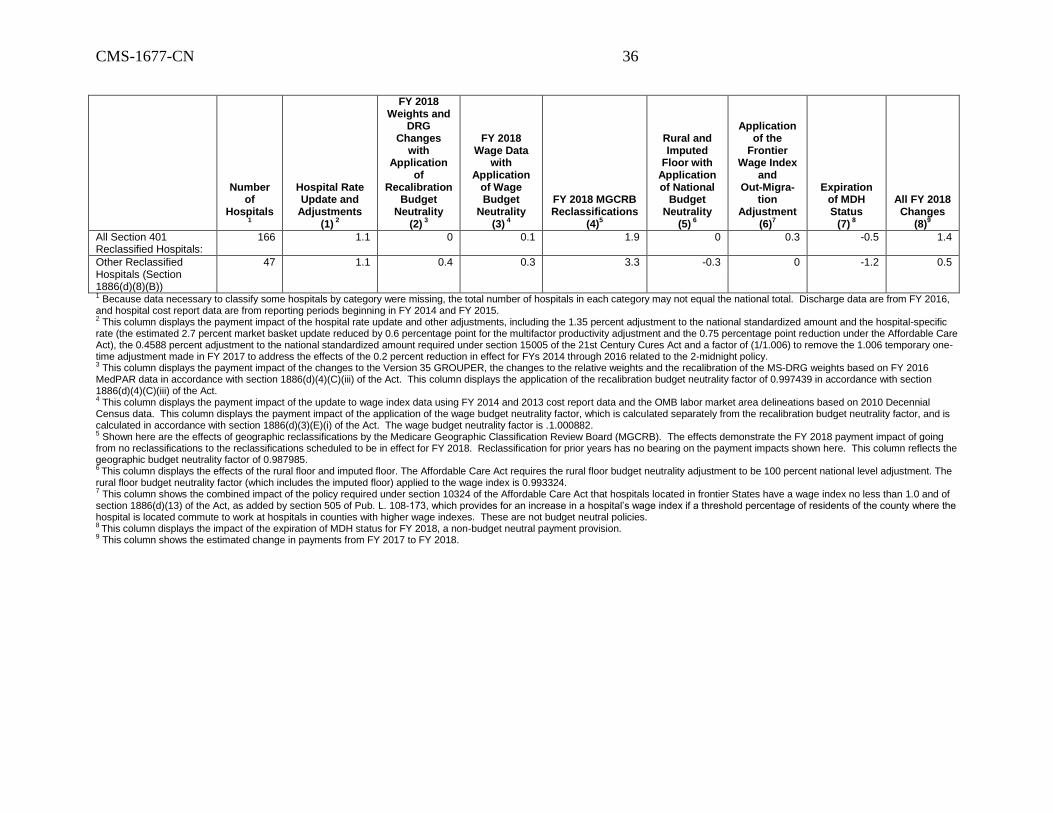
1. On pages 38552 through 38554, the table and table notes for the table titled "TABLE I.—IMPACT ANALYSIS OF
CHANGES TO THE IPPS FOR OPERATING COSTS FOR FY 2018" are corrected to read as follows:
TABLE I.—IMPACT ANALYSIS OF CHANGES TO THE IPPS FOR OPERATING COSTS FOR FY 2018
Number of
Hospitals1
Hospital Rate Update and
Adjustments (1)
2
FY 2018 Weights and
DRG Changes
with Application
of Recalibration
Budget Neutrality
(2) 3
FY 2018 Wage Data
with Application
of Wage Budget
Neutrality (3)
4
FY 2018 MGCRB Reclassifications
(4)5
Rural and Imputed
Floor with Application of National
Budget Neutrality
(5) 6
Application of the
Frontier Wage Index
and Out-Migra-
tion Adjustment
(6)7
Expiration of MDH Status
(7) 8
All FY 2018 Changes
(8)9
All Hospitals 3,292 1.2 0 0 0 0 0.1 -0.1 1.3
By Geographic Location:
Urban hospitals 2,492 1.2 0 0 -0.1 0 0.1 0 1.4
Large urban areas 1,340 1.2 0 0 -0.5 -0.1 0 0 1.4
Other urban areas 1,152 1.2 0 0 0.3 0.2 0.2 -0.1 1.4
Rural hospitals 800 0.9 0.1 0 1.4 -0.2 0.2 -0.9 0.2
Bed Size (Urban):
0-99 beds 648 1.1 0.4 0.1 -0.6 0.1 0.2 -0.7 0.8
100-199 beds 763 1.2 0.2 0.1 0 0.3 0.2 -0.1 1.5
200-299 beds 441 1.2 0.1 0 0.1 0.1 0.1 0 1.5
300-499 beds 426 1.2 0 0.0 -0.1 0 0.1 0 1.4
500 or more beds 214 1.2 -0.2 -0.1 -0.2 -0.1 0.1 0 1.4
Bed Size (Rural):
0-49 beds 318 0.9 0.3 0 0.4 -0.2 0.3 -1.6 -0.5
50-99 beds 282 0.9 0.2 0 0.6 -0.1 0.4 -2.2 -1.4
100-149 beds 117 0.8 0.1 -0.1 1.1 -0.2 0.1 -0.1 0.8
150-199 beds 44 0.9 0.1 0 2.2 -0.2 0.1 0 1.3
200 or more beds 39 0.9 0 0.2 2.9 -0.2 0 0 1.6
Urban by Region:
New England 114 1.2 0 -0.5 1.2 1.4 0.1 -0.2 1.4
Middle Atlantic 315 1.2 0 -0.1 0.6 -0.3 0.1 0 1.1
South Atlantic 404 1.2 0 0.1 -0.4 -0.2 0 -0.1 1.6
East North Central 385 1.2 0.1 0.1 -0.3 -0.4 0 0 1.6
East South Central 147 1.2 0 -0.2 -0.3 -0.3 0 0 1.3
West North Central 160 1.1 -0.1 0.4 -0.8 -0.3 0.7 -0.1 1.6
CMS-1677-CN 34
Number of
Hospitals1
Hospital Rate Update and
Adjustments (1)
2
FY 2018 Weights and
DRG Changes
with Application
of Recalibration
Budget Neutrality
(2) 3
FY 2018 Wage Data
with Application
of Wage Budget
Neutrality (3)
4
FY 2018 MGCRB Reclassifications
(4)5
Rural and Imputed
Floor with Application of National
Budget Neutrality
(5) 6
Application of the
Frontier Wage Index
and Out-Migra-
tion Adjustment
(6)7
Expiration of MDH Status
(7) 8
All FY 2018 Changes
(8)9
West South Central 378 1.2 0 0.5 -0.5 -0.3 0 -0.1 1.7
Mountain 162 1.1 0 -0.2 0 0.1 0.3 0 0.6
Pacific 375 1.1 -0.1 -0.4 -0.2 0.9 0.1 0 1.5
Puerto Rico 52 1.2 -0.5 1.4 -1.0 0.2 0.1 0 1.1
Rural by Region:
New England 20 1.0 0.1 1.1 2.1 -0.3 0.2 -2.2 0.6
Middle Atlantic 53 0.8 0.2 0 0.8 -0.2 0.2 -1.7 -0.9
South Atlantic 125 1.0 0.2 -0.1 1.8 -0.2 0.2 -0.8 -0.1
East North Central 115 0.9 0.1 -0.3 1.2 -0.1 0.1 -1.7 -0.9
East South Central 154 1.1 0.3 0.1 2.4 -0.3 0.1 -0.3 1.1
West North Central 97 0.6 -0.1 0 0.2 0.0 0.3 -0.3 0.6
West South Central 154 0.9 0.3 0.2 1.5 -0.2 0.2 -0.7 0.6
Mountain 58 0.6 0.2 -0.1 0.2 -0.1 0.3 0 0.9
Pacific 24 0.6 0 0 1.2 -0.1 0 0 0.4
By Payment Classification:
Urban hospitals 2,373 1.2 0 0 -0.3 0 0.1 0 1.4
Large urban areas 1,354 1.2 0 0 -0.5 -0.1 0 0 1.4
Other urban areas 1,019 1.2 0 0 -0.1 0.2 0.2 0 1.4
Rural areas 919 1.0 0.1 0.1 1.6 -0.1 0.2 -0.7 0.8
Teaching Status:
Nonteaching 2,204 1.1 0.1 0 0.2 0.2 0.1 -0.3 1.2
Fewer than 100 residents
839 1.2 0.1 0 -0.1 -0.1 0.2 0 1.4
100 or more residents 249 1.2 -0.2 -0.1 -0.1 -0.1 0 0 1.4
Urban DSH:
Non-DSH 551 1.2 0 0 -0.2 -0.1 0.2 -0.3 1.0
100 or more beds 1,543 1.2 0 0 -0.3 0 0.1 0 1.4
Less than 100 beds 370 1.1 0.3 0 -0.2 0.1 0.2 -0.1 1.6
Rural DSH:
SCH 257 0.6 0 0 -0.1 0 0 0 0.5
RRC 293 1.0 0 0.1 2.0 -0.1 0.2 -0.3 1.6
100 or more beds 34 1.2 0.2 0 1.7 -0.2 0.1 -0.1 0.4
Less than 100 beds 244 1.1 0.5 0 0.5 -0.3 0.7 -4.8 -3.9
Urban teaching and DSH:
Both teaching and DSH 863 1.2 -0.1 -0.1 -0.3 -0.1 0.1 0 1.4
CMS-1677-CN 35
Number of
Hospitals1
Hospital Rate Update and
Adjustments (1)
2
FY 2018 Weights and
DRG Changes
with Application
of Recalibration
Budget Neutrality
(2) 3
FY 2018 Wage Data
with Application
of Wage Budget
Neutrality (3)
4
FY 2018 MGCRB Reclassifications
(4)5
Rural and Imputed
Floor with Application of National
Budget Neutrality
(5) 6
Application of the
Frontier Wage Index
and Out-Migra-
tion Adjustment
(6)7
Expiration of MDH Status
(7) 8
All FY 2018 Changes
(8)9
Teaching and no DSH 92 1.2 0 -0.1 -0.2 -0.2 0.1 0 1.0
No teaching and DSH 1,050 1.2 0.2 0 -0.2 0.3 0.1 0 1.5
No teaching and no DSH
368 1.2 0.1 0.1 -0.4 -0.1 0.2 0 1.5
Special Hospital Types:
RRC 263 1.2 0.1 0.1 2.5 -0.1 0.3 -0.4 1.8
SCH 316 0.7 -0.2 -0.2 -0.1 0 0 0 0.4
SCH and RRC 131 0.7 -0.1 0.1 0.3 0 0 0 0.9
Type of Ownership:
Voluntary 1,914 1.2 0 0 0 0 0.1 -0.1 1.3
Proprietary 863 1.2 0.2 0.2 0 0 0.1 -0.1 1.6
Government 513 1.1 0 -0.1 -0.2 0.1 0.1 -0.1 1.3
Medicare Utilization as a Percent of Inpatient Days:
0-25 554 1.2 0 0 -0.3 0.1 0.1 0 1.4
25-50 2,149 1.2 0 0 0 0.0 0.1 -0.1 1.4
50-65 485 1.1 0.1 0.1 0.6 0.2 0.2 -0.6 0.8
Over 65 103 1.0 0.6 0.4 -0.9 -0.2 0.3 -4.0 -1.9
FY 2018 Reclassifications by the Medicare Geographic Classification Review Board:
All Reclassified Hospitals
858 1.1 0.1 0.1 2.2 -0.1 0 -0.2 1.5
Non-Reclassified Hospitals
2,434 1.2 0 0 -0.9 0 0.2 -0.1 1.3
Urban Hospitals Reclassified
590 1.2 0.1 0.1 2.2 -0.1 0 -0.1 1.6
Urban Nonreclassified Hospitals
1,858 1.2 0 0.0 -0.9 0 0.1 0 1.4
Rural Hospitals Reclassified
268 0.9 0.1 0 2.3 -0.2 0 -0.5 0.7
Rural Nonreclassified Hospitals
485 0.9 0.2 0 -0.3 -0.1 0.4 -1.4 -0.5
CMS-1677-CN 36
Number of
Hospitals1
Hospital Rate Update and
Adjustments (1)
2
FY 2018 Weights and
DRG Changes
with Application
of Recalibration
Budget Neutrality
(2) 3
FY 2018 Wage Data
with Application
of Wage Budget
Neutrality (3)
4
FY 2018 MGCRB Reclassifications
(4)5
Rural and Imputed
Floor with Application of National
Budget Neutrality
(5) 6
Application of the
Frontier Wage Index
and Out-Migra-
tion Adjustment
(6)7
Expiration of MDH Status
(7) 8
All FY 2018 Changes
(8)9
All Section 401 Reclassified Hospitals:
166 1.1 0 0.1 1.9 0 0.3 -0.5 1.4
Other Reclassified Hospitals (Section 1886(d)(8)(B))
47 1.1 0.4 0.3 3.3 -0.3 0 -1.2 0.5
1 Because data necessary to classify some hospitals by category were missing, the total number of hospitals in each category may not equal the national total. Discharge data are from FY 2016, and hospital cost report data are from reporting periods beginning in FY 2014 and FY 2015. 2 This column displays the payment impact of the hospital rate update and other adjustments, including the 1.35 percent adjustment to the national standardized amount and the hospital-specific rate (the estimated 2.7 percent market basket update reduced by 0.6 percentage point for the multifactor productivity adjustment and the 0.75 percentage point reduction under the Affordable Care Act), the 0.4588 percent adjustment to the national standardized amount required under section 15005 of the 21st Century Cures Act and a factor of (1/1.006) to remove the 1.006 temporary one-time adjustment made in FY 2017 to address the effects of the 0.2 percent reduction in effect for FYs 2014 through 2016 related to the 2-midnight policy. 3 This column displays the payment impact of the changes to the Version 35 GROUPER, the changes to the relative weights and the recalibration of the MS-DRG weights based on FY 2016 MedPAR data in accordance with section 1886(d)(4)(C)(iii) of the Act. This column displays the application of the recalibration budget neutrality factor of 0.997439 in accordance with section 1886(d)(4)(C)(iii) of the Act. 4 This column displays the payment impact of the update to wage index data using FY 2014 and 2013 cost report data and the OMB labor market area delineations based on 2010 Decennial Census data. This column displays the payment impact of the application of the wage budget neutrality factor, which is calculated separately from the recalibration budget neutrality factor, and is calculated in accordance with section 1886(d)(3)(E)(i) of the Act. The wage budget neutrality factor is .1.000882. 5 Shown here are the effects of geographic reclassifications by the Medicare Geographic Classification Review Board (MGCRB). The effects demonstrate the FY 2018 payment impact of going from no reclassifications to the reclassifications scheduled to be in effect for FY 2018. Reclassification for prior years has no bearing on the payment impacts shown here. This column reflects the geographic budget neutrality factor of 0.987985. 6 This column displays the effects of the rural floor and imputed floor. The Affordable Care Act requires the rural floor budget neutrality adjustment to be 100 percent national level adjustment. The rural floor budget neutrality factor (which includes the imputed floor) applied to the wage index is 0.993324. 7 This column shows the combined impact of the policy required under section 10324 of the Affordable Care Act that hospitals located in frontier States have a wage index no less than 1.0 and of section 1886(d)(13) of the Act, as added by section 505 of Pub. L. 108-173, which provides for an increase in a hospital’s wage index if a threshold percentage of residents of the county where the hospital is located commute to work at hospitals in counties with higher wage indexes. These are not budget neutral policies. 8 This column displays the impact of the expiration of MDH status for FY 2018, a non-budget neutral payment provision. 9 This column shows the estimated change in payments from FY 2017 to FY 2018.
CMS-1677-CN 37
2. On page 38555,
a. Second column, second full paragraph --
(1) Line 6, the figure “0.997432” is corrected to read “0.997439”.
(2) Line 14, the figure “0.2” is corrected to read “0.1”.
b. Third column, first full paragraph, line 26, the figure “1.001148” is corrected
to read “1.000882”.
3. On page 38556, lower half of the page--
a. First column, third full paragraph, line 6, the figure “0.988008” is corrected to
read “0.987985”.
b. Third column--
(1) First full paragraph, line 8, the figure “0.993348” is corrected to read
“0.993324”.
(2) Last paragraph, line 5, the figure “0.993348” is corrected to read “0.993324”.
4. On page 38557, top of the page, first column, first partial paragraph, line 20,
the figure “$44 million” is corrected to read “$43 million”.
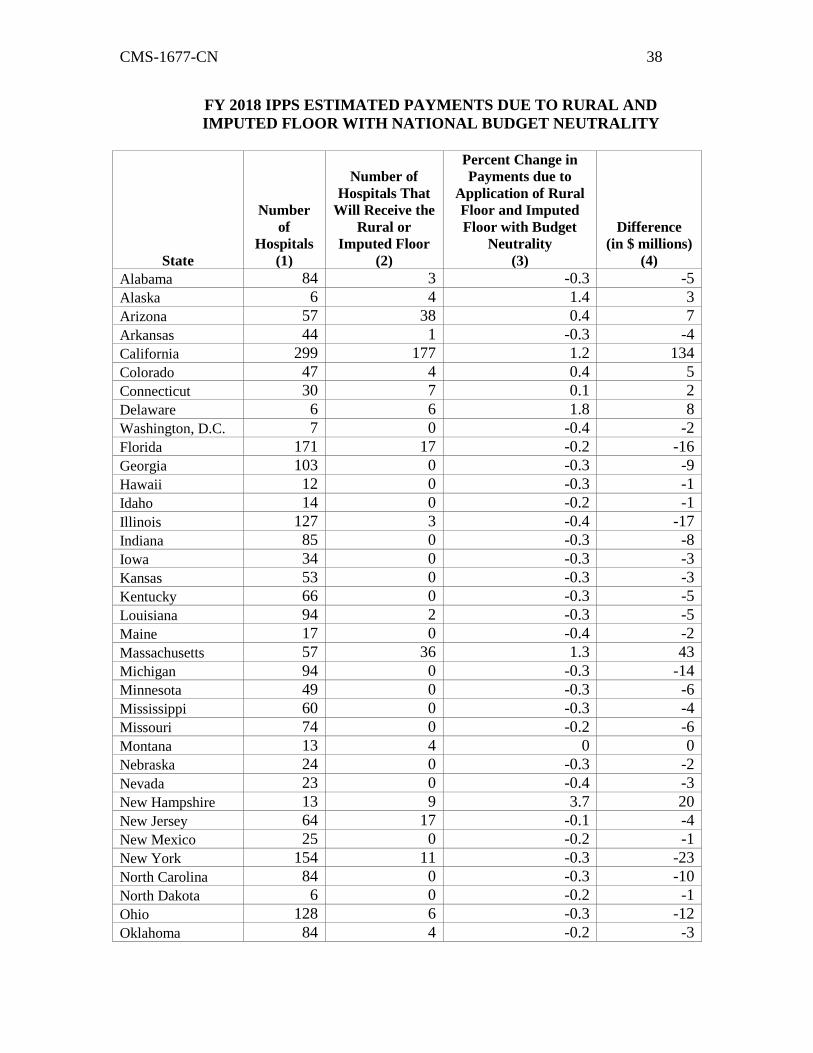
5. On pages 38557 and 38558, the table titled “FY 2018 IPPS ESTIMATED
PAYMENTS DUE TO RURAL AND IMPUTED FLOOR WITH NATIONAL
BUDGET NEUTRALITY” is corrected to read as follows:
CMS-1677-CN 38
FY 2018 IPPS ESTIMATED PAYMENTS DUE TO RURAL AND
IMPUTED FLOOR WITH NATIONAL BUDGET NEUTRALITY
State
Number
of
Hospitals
(1)
Number of
Hospitals That
Will Receive the
Rural or
Imputed Floor
(2)
Percent Change in
Payments due to
Application of Rural
Floor and Imputed
Floor with Budget
Neutrality
(3)
Difference
(in $ millions)
(4)
Alabama 84 3 -0.3 -5
Alaska 6 4 1.4 3
Arizona 57 38 0.4 7
Arkansas 44 1 -0.3 -4
California 299 177 1.2 134
Colorado 47 4 0.4 5
Connecticut 30 7 0.1 2
Delaware 6 6 1.8 8
Washington, D.C. 7 0 -0.4 -2
Florida 171 17 -0.2 -16
Georgia 103 0 -0.3 -9
Hawaii 12 0 -0.3 -1
Idaho 14 0 -0.2 -1
Illinois 127 3 -0.4 -17
Indiana 85 0 -0.3 -8
Iowa 34 0 -0.3 -3
Kansas 53 0 -0.3 -3
Kentucky 66 0 -0.3 -5
Louisiana 94 2 -0.3 -5
Maine 17 0 -0.4 -2
Massachusetts 57 36 1.3 43
Michigan 94 0 -0.3 -14
Minnesota 49 0 -0.3 -6
Mississippi 60 0 -0.3 -4
Missouri 74 0 -0.2 -6
Montana 13 4 0 0
Nebraska 24 0 -0.3 -2
Nevada 23 0 -0.4 -3
New Hampshire 13 9 3.7 20
New Jersey 64 17 -0.1 -4
New Mexico 25 0 -0.2 -1
New York 154 11 -0.3 -23
North Carolina 84 0 -0.3 -10
North Dakota 6 0 -0.2 -1
Ohio 128 6 -0.3 -12
Oklahoma 84 4 -0.2 -3
CMS-1677-CN 39
State
Number
of
Hospitals
(1)
Number of
Hospitals That
Will Receive the
Rural or
Imputed Floor
(2)
Percent Change in
Payments due to
Application of Rural
Floor and Imputed
Floor with Budget
Neutrality
(3)
Difference
(in $ millions)
(4)
Oregon 34 5 -0.3 -3
Pennsylvania 150 3 -0.4 -17
Puerto Rico 52 10 0.2 0
Rhode Island 11 10 5.0 19
South Carolina 56 0 -0.3 -5
South Dakota 17 0 -0.2 -1
Tennessee 91 3 -0.3 -8
Texas 310 4 -0.3 -22
Utah 31 1 -0.3 -2
Vermont 6 0 -0.2 0
Virginia 73 1 -0.3 -7
Washington 48 3 -0.2 -5
West Virginia 29 3 -0.1 -1
Wisconsin 66 8 -0.2 -3
Wyoming 10 0 -0.1 0
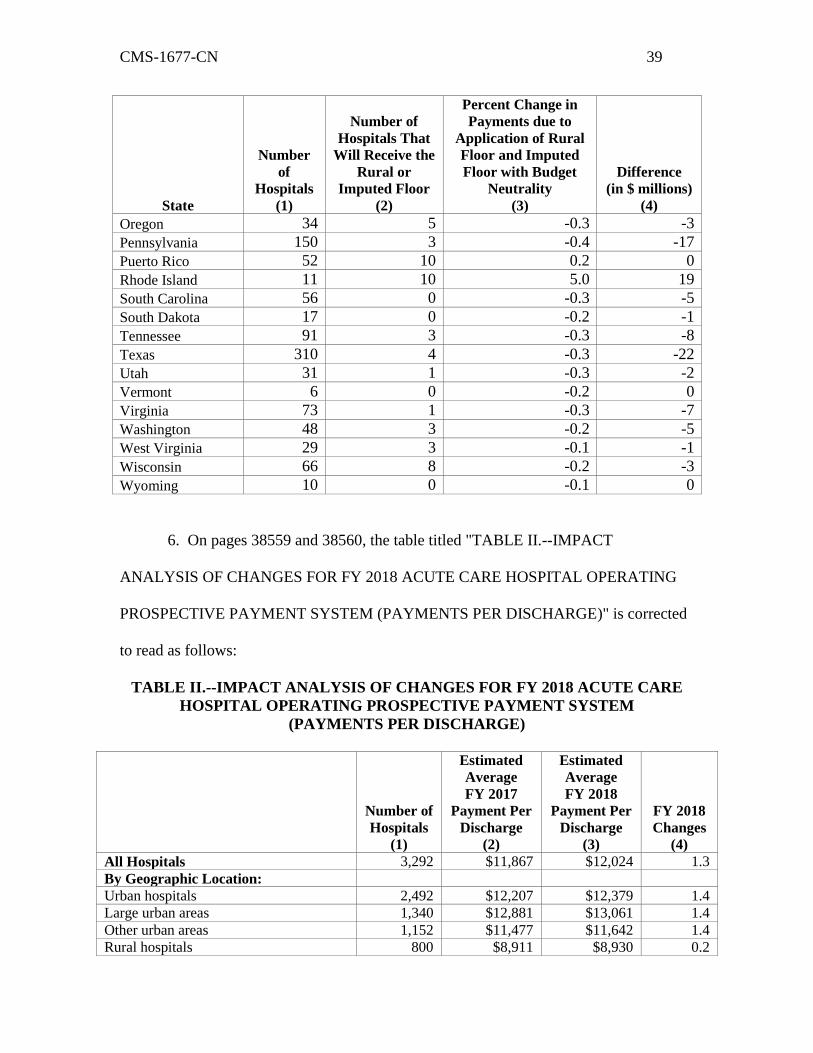
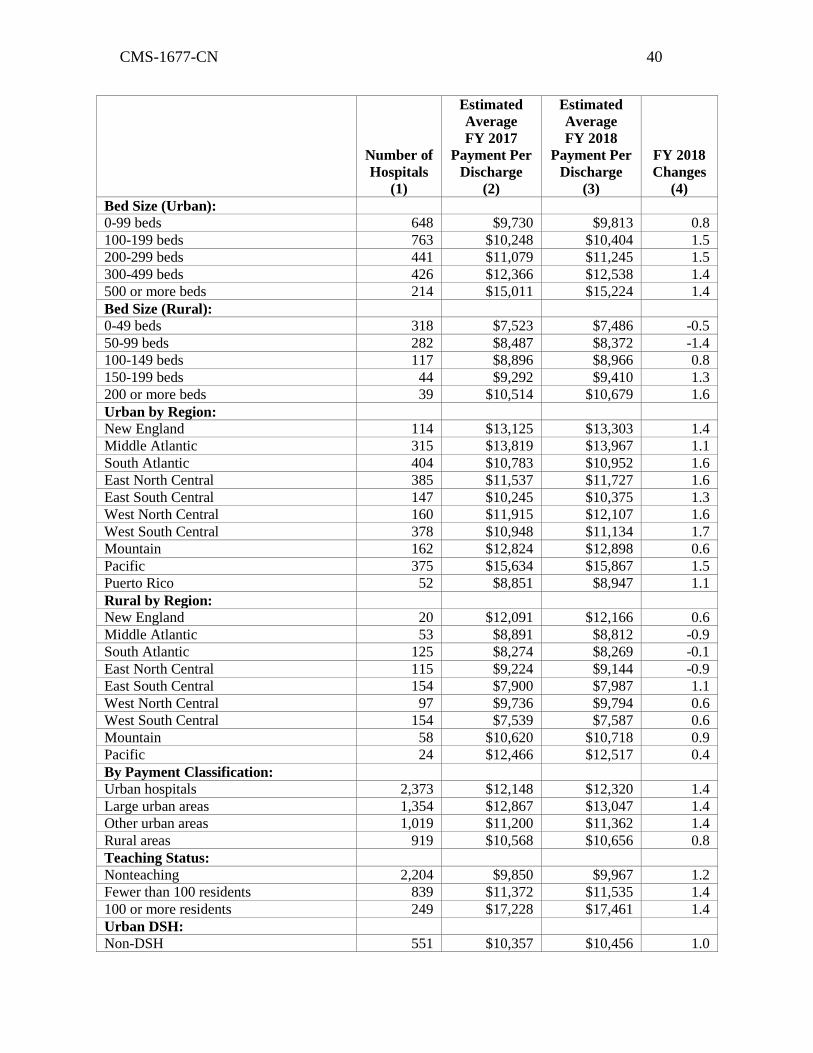
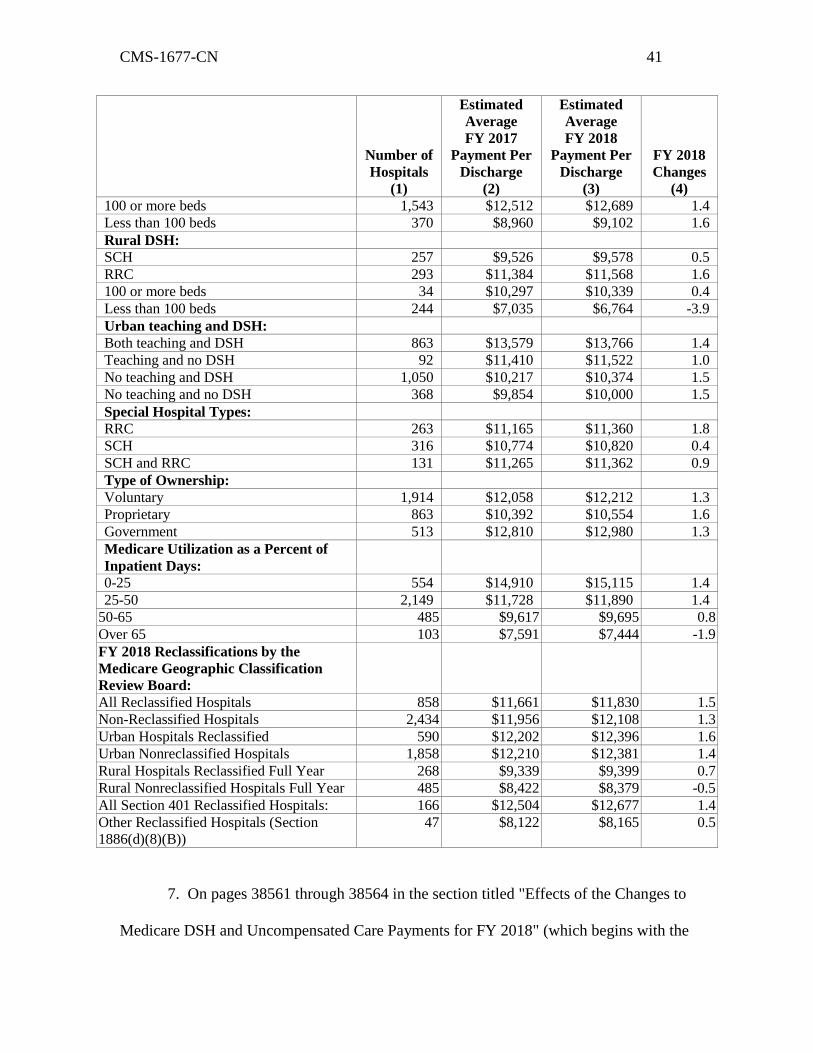
6. On pages 38559 and 38560, the table titled "TABLE II.--IMPACT
ANALYSIS OF CHANGES FOR FY 2018 ACUTE CARE HOSPITAL OPERATING
PROSPECTIVE PAYMENT SYSTEM (PAYMENTS PER DISCHARGE)" is corrected
to read as follows:
TABLE II.--IMPACT ANALYSIS OF CHANGES FOR FY 2018 ACUTE CARE
HOSPITAL OPERATING PROSPECTIVE PAYMENT SYSTEM
(PAYMENTS PER DISCHARGE)
Number of
Hospitals
(1)
Estimated
Average
FY 2017
Payment Per
Discharge
(2)
Estimated
Average
FY 2018
Payment Per
Discharge
(3)
FY 2018
Changes
(4)
All Hospitals 3,292 $11,867 $12,024 1.3
By Geographic Location:
Urban hospitals 2,492 $12,207 $12,379 1.4
Large urban areas 1,340 $12,881 $13,061 1.4
Other urban areas 1,152 $11,477 $11,642 1.4
Rural hospitals 800 $8,911 $8,930 0.2
CMS-1677-CN 40
Number of
Hospitals
(1)
Estimated
Average
FY 2017
Payment Per
Discharge
(2)
Estimated
Average
FY 2018
Payment Per
Discharge
(3)
FY 2018
Changes
(4)
Bed Size (Urban):
0-99 beds 648 $9,730 $9,813 0.8
100-199 beds 763 $10,248 $10,404 1.5
200-299 beds 441 $11,079 $11,245 1.5
300-499 beds 426 $12,366 $12,538 1.4
500 or more beds 214 $15,011 $15,224 1.4
Bed Size (Rural):
0-49 beds 318 $7,523 $7,486 -0.5
50-99 beds 282 $8,487 $8,372 -1.4
100-149 beds 117 $8,896 $8,966 0.8
150-199 beds 44 $9,292 $9,410 1.3
200 or more beds 39 $10,514 $10,679 1.6
Urban by Region:
New England 114 $13,125 $13,303 1.4
Middle Atlantic 315 $13,819 $13,967 1.1
South Atlantic 404 $10,783 $10,952 1.6
East North Central 385 $11,537 $11,727 1.6
East South Central 147 $10,245 $10,375 1.3
West North Central 160 $11,915 $12,107 1.6
West South Central 378 $10,948 $11,134 1.7
Mountain 162 $12,824 $12,898 0.6
Pacific 375 $15,634 $15,867 1.5
Puerto Rico 52 $8,851 $8,947 1.1
Rural by Region:
New England 20 $12,091 $12,166 0.6
Middle Atlantic 53 $8,891 $8,812 -0.9
South Atlantic 125 $8,274 $8,269 -0.1
East North Central 115 $9,224 $9,144 -0.9
East South Central 154 $7,900 $7,987 1.1
West North Central 97 $9,736 $9,794 0.6
West South Central 154 $7,539 $7,587 0.6
Mountain 58 $10,620 $10,718 0.9
Pacific 24 $12,466 $12,517 0.4
By Payment Classification:
Urban hospitals 2,373 $12,148 $12,320 1.4
Large urban areas 1,354 $12,867 $13,047 1.4
Other urban areas 1,019 $11,200 $11,362 1.4
Rural areas 919 $10,568 $10,656 0.8
Teaching Status:
Nonteaching 2,204 $9,850 $9,967 1.2
Fewer than 100 residents 839 $11,372 $11,535 1.4
100 or more residents 249 $17,228 $17,461 1.4
Urban DSH:
Non-DSH 551 $10,357 $10,456 1.0
CMS-1677-CN 41
Number of
Hospitals
(1)
Estimated
Average
FY 2017
Payment Per
Discharge
(2)
Estimated
Average
FY 2018
Payment Per
Discharge
(3)
FY 2018
Changes
(4)
100 or more beds 1,543 $12,512 $12,689 1.4
Less than 100 beds 370 $8,960 $9,102 1.6
Rural DSH:
SCH 257 $9,526 $9,578 0.5
RRC 293 $11,384 $11,568 1.6
100 or more beds 34 $10,297 $10,339 0.4
Less than 100 beds 244 $7,035 $6,764 -3.9
Urban teaching and DSH:
Both teaching and DSH 863 $13,579 $13,766 1.4
Teaching and no DSH 92 $11,410 $11,522 1.0
No teaching and DSH 1,050 $10,217 $10,374 1.5
No teaching and no DSH 368 $9,854 $10,000 1.5
Special Hospital Types:
RRC 263 $11,165 $11,360 1.8
SCH 316 $10,774 $10,820 0.4
SCH and RRC 131 $11,265 $11,362 0.9
Type of Ownership:
Voluntary 1,914 $12,058 $12,212 1.3
Proprietary 863 $10,392 $10,554 1.6
Government 513 $12,810 $12,980 1.3
Medicare Utilization as a Percent of
Inpatient Days:
0-25 554 $14,910 $15,115 1.4
25-50 2,149 $11,728 $11,890 1.4
50-65 485 $9,617 $9,695 0.8
Over 65 103 $7,591 $7,444 -1.9
FY 2018 Reclassifications by the
Medicare Geographic Classification
Review Board:
All Reclassified Hospitals 858 $11,661 $11,830 1.5
Non-Reclassified Hospitals 2,434 $11,956 $12,108 1.3
Urban Hospitals Reclassified 590 $12,202 $12,396 1.6
Urban Nonreclassified Hospitals 1,858 $12,210 $12,381 1.4
Rural Hospitals Reclassified Full Year 268 $9,339 $9,399 0.7
Rural Nonreclassified Hospitals Full Year 485 $8,422 $8,379 -0.5
All Section 401 Reclassified Hospitals: 166 $12,504 $12,677 1.4
Other Reclassified Hospitals (Section
1886(d)(8)(B))
47 $8,122 $8,165 0.5
7. On pages 38561 through 38564 in the section titled "Effects of the Changes to
Medicare DSH and Uncompensated Care Payments for FY 2018" (which begins with the
CMS-1677-CN 42
phrase "As discussed in section V.G of the preamble" and ends with the phrase "hospitals
are projected to receive large increases") the section is corrected to read as follows:
"5. Effects of the Changes to Medicare DSH and Uncompensated Care Payments for
FY 2018
As discussed in section V.G. of the preamble of this final rule, under section 3133
of the Affordable Care Act, hospitals that are eligible to receive Medicare DSH payments
will receive 25 percent of the amount they previously would have received under the
statutory formula for Medicare DSH payments under section 1886(d)(5)(F) of the Act.
The remainder, equal to an estimate of 75 percent of what formerly would have been paid
as Medicare DSH payments (Factor 1), reduced to reflect changes in the percentage of
uninsured individuals and additional statutory adjustments (Factor 2), is available to
make additional payments to each hospital that qualifies for Medicare DSH payments and
that has uncompensated care. Each hospital eligible for Medicare DSH payments will
receive an additional payment based on its estimated share of the total amount of
uncompensated care for all hospitals eligible for Medicare DSH payments. The
uncompensated care payment methodology has redistributive effects based on the
proportion of a hospital’s uncompensated care relative to the uncompensated care for all
hospitals eligible for Medicare DSH payments (Factor 3).
For FY 2018, we are establishing a Factor 2 of 58.01 percent determined using the
uninsured estimates produced by CMS’ Office of the Actuary (OACT) as part of the
development of the National Health Expenditure Accounts (NHEA). Although we are
continuing to use low-income insured patient days as a proxy for uncompensated care, for
the first time, we are using these data in combination with data on uncompensated care
CMS-1677-CN 43
costs from Worksheet S–10 in the calculation of Factor 3. The uncompensated care
payment methodology has redistributive effects based on the proportion of a hospital’s
uncompensated care relative to the total uncompensated care for all hospitals eligible for
Medicare DSH payments. The change to Medicare DSH payments under section 3133 of
the Affordable Care Act is not budget neutral.
In this final rule, we are establishing the amount to be distributed as
uncompensated care payments to DSH eligible hospitals, which for FY 2018 is
$6,766,695,163.56. This figure represents 75 percent of the amount that otherwise would
have been paid for Medicare DSH payment adjustments adjusted by a Factor 2 of 58.01
percent. For FY 2017, the amount available to be distributed for uncompensated care was
$5,977,483,146.86, or 75 percent of the amount that otherwise would have been paid for
Medicare DSH payment adjustments adjusted by a Factor 2 of 55.36 percent. To
calculate Factor 3 for FY 2018, we used an average of data computed using Medicaid
days from hospitals’ 2012 and 2013 cost reports from the March 2017 update of the
HCRIS database, uncompensated care costs from hospitals’ 2014 cost reports from the
same extract of HCRIS, Medicaid days from 2012 cost report data submitted to CMS by
IHS hospitals, and SSI days from the FY 2014 and FY 2015 SSI ratios. For each eligible
hospital, we calculated an individual Factor 3 for cost reporting years FYs 2012, 2013,
and 2014. We then added the individual amounts and divided the sum by the number of
cost reporting periods with data to calculate an average Factor 3 for FY 2018. For
purposes of this final rule, as we proposed, we used the most recent data from the March
2017 update of the HCRIS database for the Medicaid days component of the Factor 3
calculation as well as for the Worksheet S– 10 uncompensated care cost component.
CMS-1677-CN 44
The FY 2018 policy of using data from hospitals’ FY 2012, FY 2013, and FY
2014 cost reporting years to determine Factor 3 is based on our FY 2017 final policy (81
FR 56943 through 56973), which is in contrast to the methodology used in FY 2016,
when we used Medicaid days from the more recent of a hospital’s full year 2012 or 2011
cost report from the March 2015 update of the HCRIS database, Medicaid days from
2012 cost report data submitted to CMS by IHS hospitals, and SSI days from the FY
2013 SSI ratios to calculate Factor 3. In addition, as explained in section V.G.4.c. of the
preamble of this final rule, we are making several additional modifications to the Factor 3
methodology: (1) To annualize Medicaid data and uncompensated care data if a
hospital’s cost report does not equal 12 months of data; (2) to apply a scaling factor to the
uncompensated care payment amount calculated for each DSH eligible hospital so that
total uncompensated care payments are consistent with the estimated amount available to
make uncompensated care payments for FY 2018; (3) to apply statistical trims to the
CCRs on Worksheet S–10 that are considered anomalies to ensure reasonable CCRs are
used to convert charges to costs for purposes of determining uncompensated care costs;
(4) to calculate Factor 3 for Puerto Rico hospitals, all-inclusive rate providers, and Indian
Health Service and Tribal hospitals by substituting data regarding low-income insured
days for FY 2013 for the Worksheet S–10 data on uncompensated care costs from FY
2014 cost reports, and (5) to determine the ratio of uncompensated care costs relative to
total operating costs on the hospital’s 2014 cost report (as of March 2017), and in cases
where the ratio of uncompensated care costs relative to total operating costs exceeds 50
percent, to determine the ratio of uncompensated care costs to total operating costs from
the hospital’s 2015 cost report (as of March 2017) and apply that ratio to the hospital’s
CMS-1677-CN 45
total operating costs from its 2014 cost report to determine uncompensated care costs for
FY 2014.
We also are continuing the policies that were finalized in the FY 2015
IPPS/LTCH PPS final rule (79 FR 50020 through 50022) to address several specific
issues concerning the process and data to be employed in determining Factor 3 in the case
of hospital mergers for FY 2018 and subsequent years, as well as continuing the policies
finalized in the FY 2017 IPPS/LTCH PPS final rule concerning the methodology for
calculating each hospital’s relative share of uncompensated care, such as combining data
from multiple cost reports beginning in the same fiscal year and calculating Factor 3
based on an average of the three individual Factor 3s for FYs 2012, 2013, and 2014,
determined by adding the Factor 3 values for these years, and dividing by the number of
cost reporting periods with data.
To estimate the impact of the combined effect of changes in Factors 1 and 2, as
well as the changes to the data used in determining Factor 3, on the calculation of
Medicare DSH payments, including both empirically justified Medicare DSH payments
and uncompensated care payments, we compared total DSH payments estimated in the
FY 2017 IPPS/LTCH PPS final rule to total DSH payments estimated in this FY 2018
IPPS/LTCH PPS final rule. For FY 2017, for each hospital, we calculated the sum of: (1)
25 percent of the estimated amount of what would have been paid as Medicare DSH in
FY 2017 in the absence of section 3133 of the Affordable Care Act; and (2) 75 percent of
the estimated amount of what would have been paid as Medicare DSH payments in the
absence of section 3133 of the Affordable Care Act, adjusted by a Factor 2 of 55.36
percent and multiplied by a Factor 3 calculated as described in the FY 2017 IPPS/ LTCH
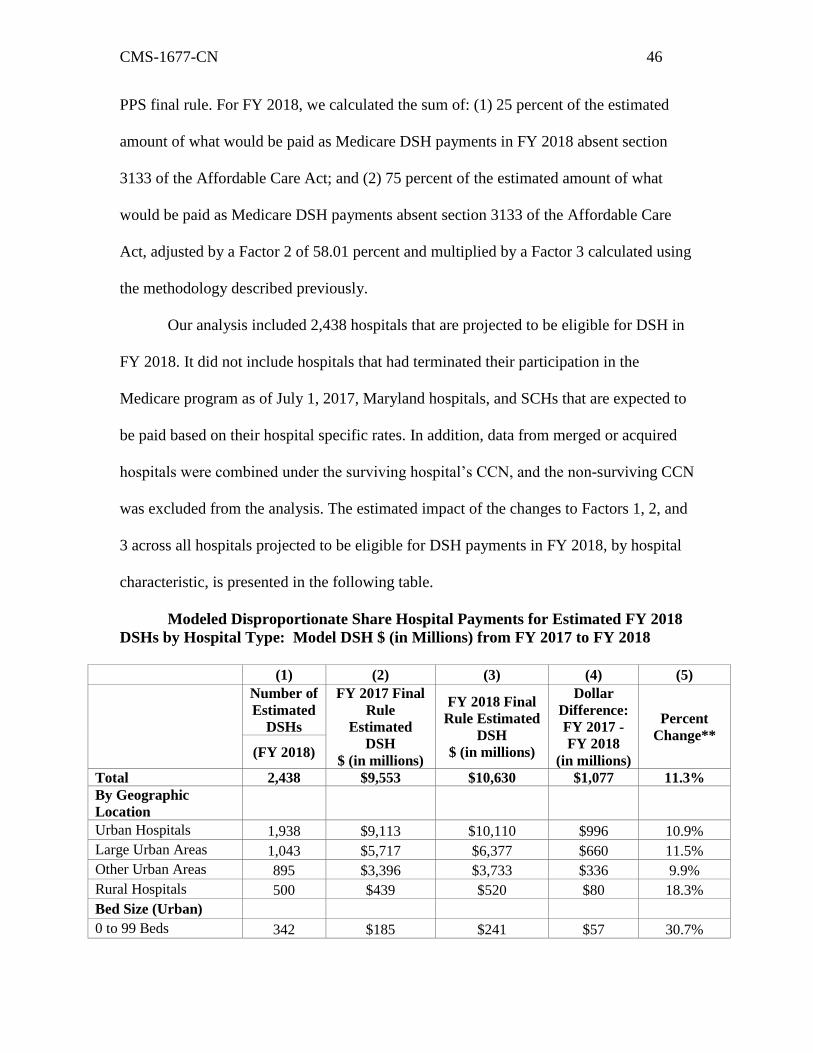
CMS-1677-CN 46
PPS final rule. For FY 2018, we calculated the sum of: (1) 25 percent of the estimated
amount of what would be paid as Medicare DSH payments in FY 2018 absent section
3133 of the Affordable Care Act; and (2) 75 percent of the estimated amount of what
would be paid as Medicare DSH payments absent section 3133 of the Affordable Care
Act, adjusted by a Factor 2 of 58.01 percent and multiplied by a Factor 3 calculated using
the methodology described previously.
Our analysis included 2,438 hospitals that are projected to be eligible for DSH in
FY 2018. It did not include hospitals that had terminated their participation in the
Medicare program as of July 1, 2017, Maryland hospitals, and SCHs that are expected to
be paid based on their hospital specific rates. In addition, data from merged or acquired
hospitals were combined under the surviving hospital’s CCN, and the non-surviving CCN
was excluded from the analysis. The estimated impact of the changes to Factors 1, 2, and
3 across all hospitals projected to be eligible for DSH payments in FY 2018, by hospital
characteristic, is presented in the following table.
Modeled Disproportionate Share Hospital Payments for Estimated FY 2018
DSHs by Hospital Type: Model DSH $ (in Millions) from FY 2017 to FY 2018
(1) (2) (3) (4) (5)
Number of
Estimated
DSHs
FY 2017 Final
Rule
Estimated
DSH
$ (in millions)
FY 2018 Final
Rule Estimated
DSH
$ (in millions)
Dollar
Difference:
FY 2017 -
FY 2018
(in millions)
Percent
Change**
(FY 2018)
Total 2,438 $9,553 $10,630 $1,077 11.3%
By Geographic
Location
Urban Hospitals 1,938 $9,113 $10,110 $996 10.9%
Large Urban Areas 1,043 $5,717 $6,377 $660 11.5%
Other Urban Areas 895 $3,396 $3,733 $336 9.9%
Rural Hospitals 500 $439 $520 $80 18.3%
Bed Size (Urban)
0 to 99 Beds 342 $185 $241 $57 30.7%
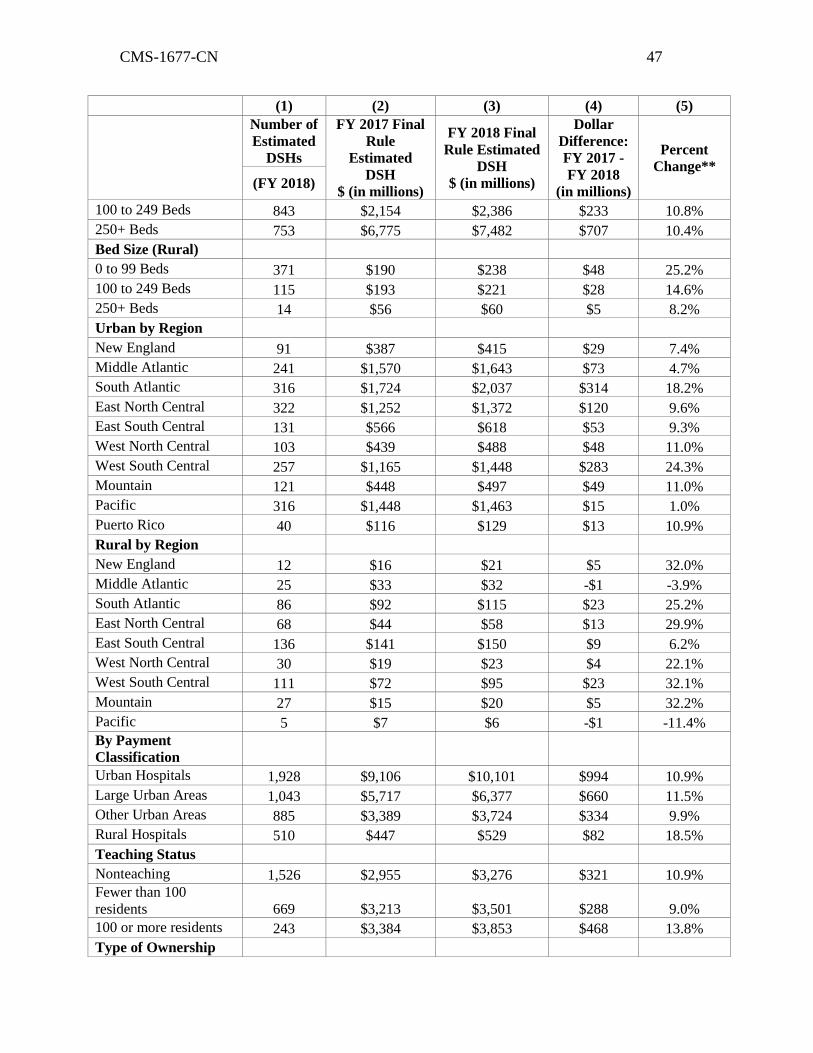
CMS-1677-CN 47
(1) (2) (3) (4) (5)
Number of
Estimated
DSHs
FY 2017 Final
Rule
Estimated
DSH
$ (in millions)
FY 2018 Final
Rule Estimated
DSH
$ (in millions)
Dollar
Difference:
FY 2017 -
FY 2018
(in millions)
Percent
Change**
(FY 2018)
100 to 249 Beds 843 $2,154 $2,386 $233 10.8%
250+ Beds 753 $6,775 $7,482 $707 10.4%
Bed Size (Rural)
0 to 99 Beds 371 $190 $238 $48 25.2%
100 to 249 Beds 115 $193 $221 $28 14.6%
250+ Beds 14 $56 $60 $5 8.2%
Urban by Region
New England 91 $387 $415 $29 7.4%
Middle Atlantic 241 $1,570 $1,643 $73 4.7%
South Atlantic 316 $1,724 $2,037 $314 18.2%
East North Central 322 $1,252 $1,372 $120 9.6%
East South Central 131 $566 $618 $53 9.3%
West North Central 103 $439 $488 $48 11.0%
West South Central 257 $1,165 $1,448 $283 24.3%
Mountain 121 $448 $497 $49 11.0%
Pacific 316 $1,448 $1,463 $15 1.0%
Puerto Rico 40 $116 $129 $13 10.9%
Rural by Region
New England 12 $16 $21 $5 32.0%
Middle Atlantic 25 $33 $32 -$1 -3.9%
South Atlantic 86 $92 $115 $23 25.2%
East North Central 68 $44 $58 $13 29.9%
East South Central 136 $141 $150 $9 6.2%
West North Central 30 $19 $23 $4 22.1%
West South Central 111 $72 $95 $23 32.1%
Mountain 27 $15 $20 $5 32.2%
Pacific 5 $7 $6 -$1 -11.4%
By Payment
Classification
Urban Hospitals 1,928 $9,106 $10,101 $994 10.9%
Large Urban Areas 1,043 $5,717 $6,377 $660 11.5%
Other Urban Areas 885 $3,389 $3,724 $334 9.9%
Rural Hospitals 510 $447 $529 $82 18.5%
Teaching Status
Nonteaching 1,526 $2,955 $3,276 $321 10.9%
Fewer than 100
residents 669 $3,213 $3,501 $288 9.0%
100 or more residents 243 $3,384 $3,853 $468 13.8%
Type of Ownership
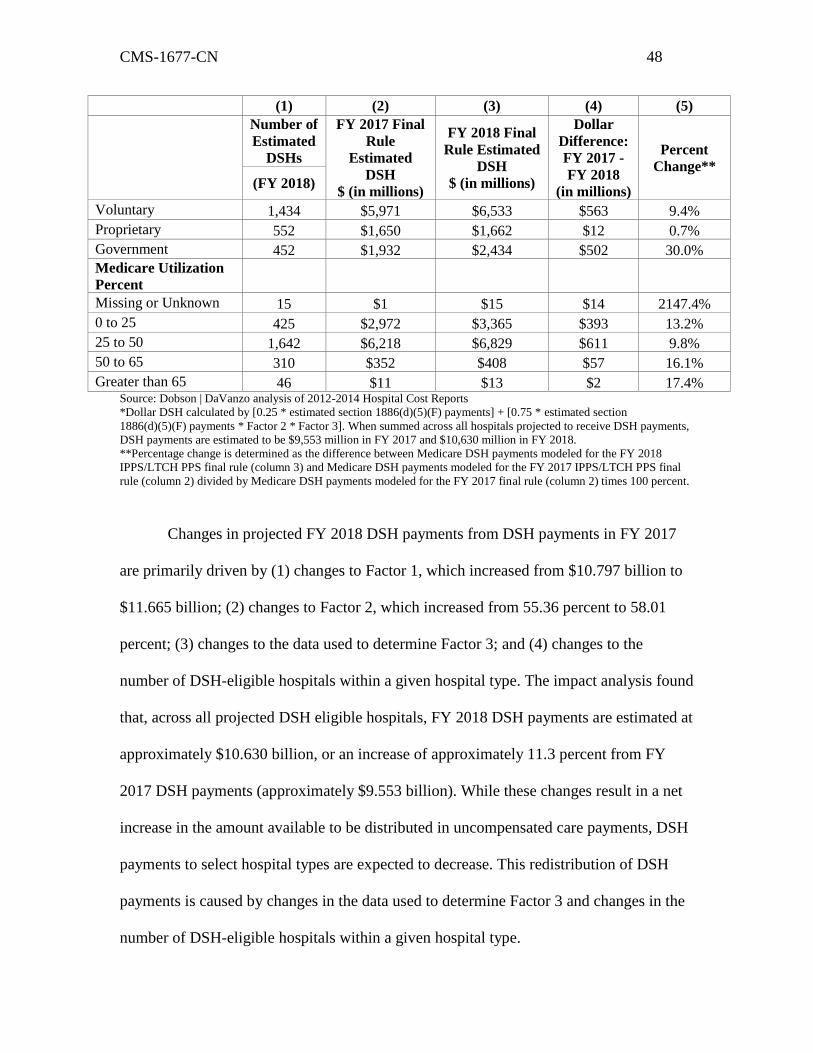
CMS-1677-CN 48
(1) (2) (3) (4) (5)
Number of
Estimated
DSHs
FY 2017 Final
Rule
Estimated
DSH
$ (in millions)
FY 2018 Final
Rule Estimated
DSH
$ (in millions)
Dollar
Difference:
FY 2017 -
FY 2018
(in millions)
Percent
Change**
(FY 2018)
Voluntary 1,434 $5,971 $6,533 $563 9.4%
Proprietary 552 $1,650 $1,662 $12 0.7%
Government 452 $1,932 $2,434 $502 30.0%
Medicare Utilization
Percent
Missing or Unknown 15 $1 $15 $14 2147.4%
0 to 25 425 $2,972 $3,365 $393 13.2%
25 to 50 1,642 $6,218 $6,829 $611 9.8%
50 to 65 310 $352 $408 $57 16.1%
Greater than 65 46 $11 $13 $2 17.4% Source: Dobson | DaVanzo analysis of 2012-2014 Hospital Cost Reports
*Dollar DSH calculated by [0.25 * estimated section 1886(d)(5)(F) payments] + [0.75 * estimated section
1886(d)(5)(F) payments * Factor 2 * Factor 3]. When summed across all hospitals projected to receive DSH payments,
DSH payments are estimated to be $9,553 million in FY 2017 and $10,630 million in FY 2018.
**Percentage change is determined as the difference between Medicare DSH payments modeled for the FY 2018
IPPS/LTCH PPS final rule (column 3) and Medicare DSH payments modeled for the FY 2017 IPPS/LTCH PPS final
rule (column 2) divided by Medicare DSH payments modeled for the FY 2017 final rule (column 2) times 100 percent.
Changes in projected FY 2018 DSH payments from DSH payments in FY 2017
are primarily driven by (1) changes to Factor 1, which increased from $10.797 billion to
$11.665 billion; (2) changes to Factor 2, which increased from 55.36 percent to 58.01
percent; (3) changes to the data used to determine Factor 3; and (4) changes to the
number of DSH-eligible hospitals within a given hospital type. The impact analysis found
that, across all projected DSH eligible hospitals, FY 2018 DSH payments are estimated at
approximately $10.630 billion, or an increase of approximately 11.3 percent from FY
2017 DSH payments (approximately $9.553 billion). While these changes result in a net
increase in the amount available to be distributed in uncompensated care payments, DSH
payments to select hospital types are expected to decrease. This redistribution of DSH
payments is caused by changes in the data used to determine Factor 3 and changes in the
number of DSH-eligible hospitals within a given hospital type.
CMS-1677-CN 49
As seen in the above table, percent changes in DSH payments of less than 11.3
percent indicate that hospitals within the specified category are projected to experience a
smaller increase in DSH payments, on average, compared to the universe of projected FY
2018 DSH hospitals. Conversely, percent changes in DSH payments that are greater than
11.3 percent indicate a hospital type is projected to have a larger increase than the overall
percent change on average, a larger increase than the overall percent change. The
variation in the distribution of DSH payments by hospital characteristic is largely
dependent on the change in a given hospital’s number of Medicaid days and SSI days for
purposes of the low-income insured days proxy between FY 2017 and FY 2018, as well
as on its uncompensated care costs as reported on its FY 2014 Worksheet S–10.
Many rural hospitals, grouped by geographic location, payment classification, and
bed size, are projected to experience a larger increase in DSH payments than their urban
counterparts. Overall, rural hospitals are projected to receive an 18.3 percent increase in
DSH payments, and urban hospitals are projected to receive a 10.9 percent increase.
However, only smaller and medium-sized rural hospitals are projected to receive
increases in DSH payments that are, on average, higher than the 11.3 percent change
across all hospitals that are projected to be eligible for DSH in FY 2018. Rural hospitals
that have 0–99 beds are projected to experience a 25.2 percent payment increase, those
with 100–249 beds are projected to receive a 14.6 percent increase, and larger rural
hospitals with 250+ beds are projected to experience an 8.2 percent payment increase.
This trend is somewhat consistent with urban hospitals, in which the smallest urban
hospitals (0– 99 beds) are projected to receive an increase in DSH payments of 30.7
percent. Medium sized hospitals (100–250 beds) and larger hospitals (250+ beds) are
CMS-1677-CN 50
projected to receive increases of 10.8 and 10.4 percent in DSH payments, respectively,
which are relatively consistent with the overall average.
By region, projected DSH payment increases for urban hospitals are smaller than
the overall percent change in the New England, Middle Atlantic, East North Central, East
South Central, and Pacific regions. Hospitals in the South Atlantic and West South
Central regions are projected to receive increases in DSH payments that are, on average,
larger than the 11.3 percent change across all hospitals projected to be eligible for DSH in
FY 2018. Increases in the West North Central, Mountain, and Puerto Rico regions are
generally consistent with the overall average percent increase of 11.3 percent. Regionally,
rural hospitals are projected to receive a wider range of increases. Rural hospitals in the
Middle Atlantic and Pacific regions are expected to receive a decrease in DSH payments,
while those in the East South Central region are projected to receive an increase in DSH
payments smaller than the 11.3 overall percent change. Increases are projected to be
substantially larger than the overall average in many regions, including New England,
South Atlantic, East North Central, West North Central, West South Central, and
Mountain.
Nonteaching hospitals and teaching hospitals with fewer than 100 residents are
projected to receive smaller increases than the overall percent change, at 10.9 and 9.0
percent respectively. Conversely, teaching hospitals with 100 or more residents are
projected to receive, on average, larger increases than the overall percent change of 11.3
percent, with a projected increase of 13.8 percent. Voluntary hospitals are expected to
receive a 9.4 percent increase, which is somewhat smaller than the overall percent
change, while proprietary hospitals are expected to receive almost no change in DSH
CMS-1677-CN 51
payments. Government hospitals are projected to receive a larger than average 30.0
percent increase. Hospitals with 25 to 50 percent Medicare utilization are projected to
receive increases in DSH payments slightly below the overall average at 9.8 percent,
while all other hospitals are projected to receive larger increases.”
8. On page 38572 top of the page--
a. First column, fourth bulleted paragraph--
(1) Line 4, the figure “0.9986” is corrected to read “0.9987”
(2) Line 5, the figure “0.9484” is corrected to read “0.9483”
b Second column, first full paragraph--
(1) Line 8, the figure “0.9484” is corrected to read “0.9483”
(2) Line 9, the figure “1.04” is corrected to read “1.03”.
c. Third column--
(1) First partial paragraph--
(a) Line 1, the figure “2.9” is corrected to read “3.0”
(b) Line 4, the figure 2.0” is corrected to read “1.9”.
(2) First full paragraph –
(a) Line 4, the figure “3.7” is corrected to read “3.8”.
(b) Line 9, the figure “5.2” is corrected to read “5.3”.
(c) Line 12, the figure “1.9” is corrected to read “2.0”.
(3) Second full paragraph--
(a) Line 7, the figure “2.3” is corrected to read “2.2”.
(b) Lines 10 and 11, the phrase "3.2 percent." is corrected to read "3.2 percent
and 3.3 percent, respectively.”.
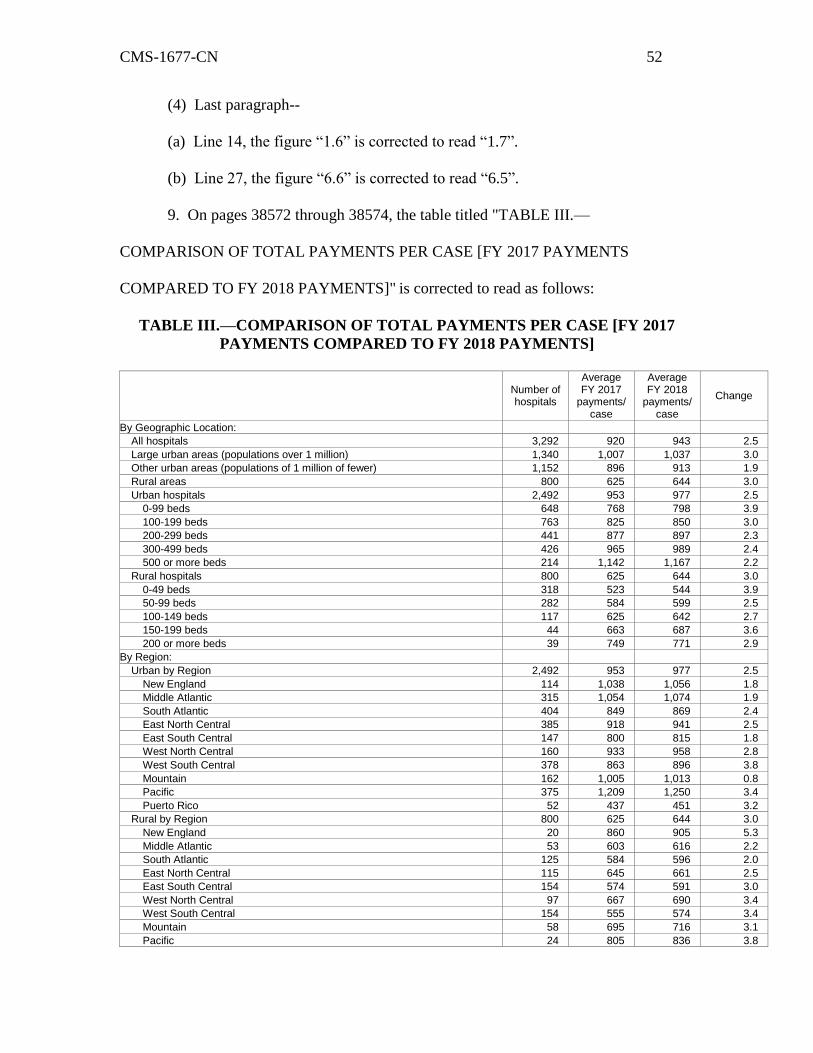
CMS-1677-CN 52
(4) Last paragraph--
(a) Line 14, the figure “1.6” is corrected to read “1.7”.
(b) Line 27, the figure “6.6” is corrected to read “6.5”.
9. On pages 38572 through 38574, the table titled "TABLE III.—
COMPARISON OF TOTAL PAYMENTS PER CASE [FY 2017 PAYMENTS
COMPARED TO FY 2018 PAYMENTS]" is corrected to read as follows:
TABLE III.—COMPARISON OF TOTAL PAYMENTS PER CASE [FY 2017
PAYMENTS COMPARED TO FY 2018 PAYMENTS]
Number of hospitals
Average FY 2017
payments/ case
Average FY 2018
payments/ case
Change
By Geographic Location:
All hospitals 3,292 920 943 2.5
Large urban areas (populations over 1 million) 1,340 1,007 1,037 3.0
Other urban areas (populations of 1 million of fewer) 1,152 896 913 1.9
Rural areas 800 625 644 3.0
Urban hospitals 2,492 953 977 2.5
0-99 beds 648 768 798 3.9
100-199 beds 763 825 850 3.0
200-299 beds 441 877 897 2.3
300-499 beds 426 965 989 2.4
500 or more beds 214 1,142 1,167 2.2
Rural hospitals 800 625 644 3.0
0-49 beds 318 523 544 3.9
50-99 beds 282 584 599 2.5
100-149 beds 117 625 642 2.7
150-199 beds 44 663 687 3.6
200 or more beds 39 749 771 2.9
By Region:
Urban by Region 2,492 953 977 2.5
New England 114 1,038 1,056 1.8
Middle Atlantic 315 1,054 1,074 1.9
South Atlantic 404 849 869 2.4
East North Central 385 918 941 2.5
East South Central 147 800 815 1.8
West North Central 160 933 958 2.8
West South Central 378 863 896 3.8
Mountain 162 1,005 1,013 0.8
Pacific 375 1,209 1,250 3.4
Puerto Rico 52 437 451 3.2
Rural by Region 800 625 644 3.0
New England 20 860 905 5.3
Middle Atlantic 53 603 616 2.2
South Atlantic 125 584 596 2.0
East North Central 115 645 661 2.5
East South Central 154 574 591 3.0
West North Central 97 667 690 3.4
West South Central 154 555 574 3.4
Mountain 58 695 716 3.1
Pacific 24 805 836 3.8
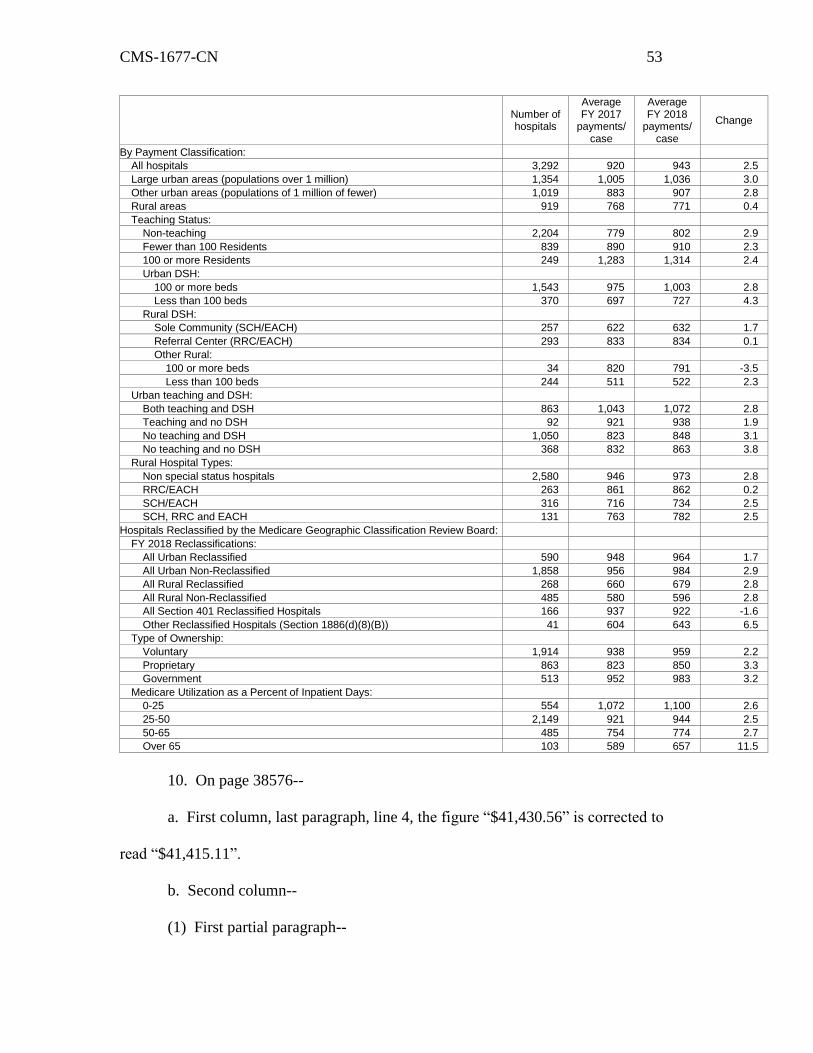
CMS-1677-CN 53
Number of hospitals
Average FY 2017
payments/ case
Average FY 2018
payments/ case
Change
By Payment Classification:
All hospitals 3,292 920 943 2.5
Large urban areas (populations over 1 million) 1,354 1,005 1,036 3.0
Other urban areas (populations of 1 million of fewer) 1,019 883 907 2.8
Rural areas 919 768 771 0.4
Teaching Status:
Non-teaching 2,204 779 802 2.9
Fewer than 100 Residents 839 890 910 2.3
100 or more Residents 249 1,283 1,314 2.4
Urban DSH:
100 or more beds 1,543 975 1,003 2.8
Less than 100 beds 370 697 727 4.3
Rural DSH:
Sole Community (SCH/EACH) 257 622 632 1.7
Referral Center (RRC/EACH) 293 833 834 0.1
Other Rural:
100 or more beds 34 820 791 -3.5
Less than 100 beds 244 511 522 2.3
Urban teaching and DSH:
Both teaching and DSH 863 1,043 1,072 2.8
Teaching and no DSH 92 921 938 1.9
No teaching and DSH 1,050 823 848 3.1
No teaching and no DSH 368 832 863 3.8
Rural Hospital Types:
Non special status hospitals 2,580 946 973 2.8
RRC/EACH 263 861 862 0.2
SCH/EACH 316 716 734 2.5
SCH, RRC and EACH 131 763 782 2.5
Hospitals Reclassified by the Medicare Geographic Classification Review Board:
FY 2018 Reclassifications:
All Urban Reclassified 590 948 964 1.7
All Urban Non-Reclassified 1,858 956 984 2.9
All Rural Reclassified 268 660 679 2.8
All Rural Non-Reclassified 485 580 596 2.8
All Section 401 Reclassified Hospitals 166 937 922 -1.6
Other Reclassified Hospitals (Section 1886(d)(8)(B)) 41 604 643 6.5
Type of Ownership:
Voluntary 1,914 938 959 2.2
Proprietary 863 823 850 3.3
Government 513 952 983 3.2
Medicare Utilization as a Percent of Inpatient Days:
0-25 554 1,072 1,100 2.6
25-50 2,149 921 944 2.5
50-65 485 754 774 2.7
Over 65 103 589 657 11.5
10. On page 38576--
a. First column, last paragraph, line 4, the figure “$41,430.56” is corrected to
read “$41,415.11”.
b. Second column--
(1) First partial paragraph--
CMS-1677-CN 54
(a) Line 1, the figure “1.0006434” is corrected to read “1.0002704”.
(b) Line 12, the figure “$40,610.16” is corrected to read “$40,595.02”.
(2) Second full paragraph, line 14, the figure “1.0006434” is corrected to read
“1.0002704”.
11. On page 38578, second column, second full paragraph--
a. Line 21, the figure “$41,430.56” is corrected to read “$41,415.11”.
b. Line 22, the figure “$40,610.16” is corrected to read “$40,595.02”.
12. On page 38579--
a. Top of the page, the table title and the table titled "TABLE IV: IMPACT OF
PAYMENT RATE AND POLICY CHANGES TO LTCH PPS PAYMENTS FOR
STANDARD PAYMENT RATE CASES FOR FY 2018 [Estimated FY 2017 payments
compared to estimated FY 2018 payments]" are corrected to read as follows:
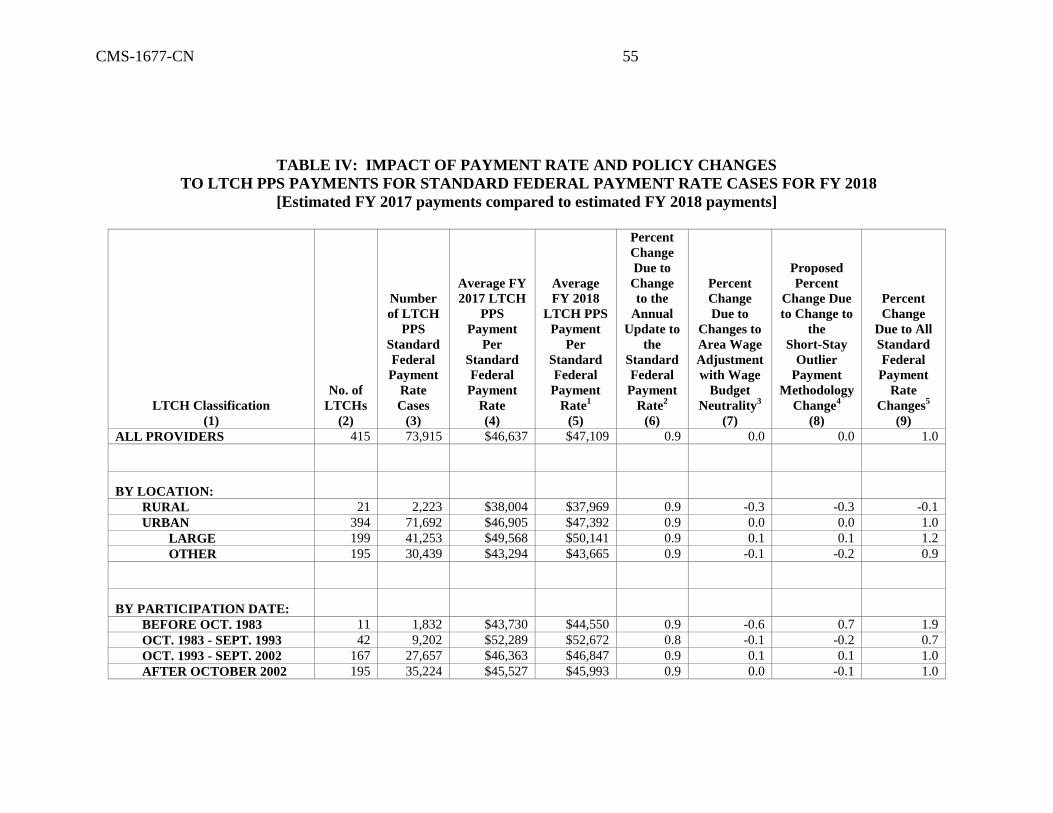
CMS-1677-CN 55
TABLE IV: IMPACT OF PAYMENT RATE AND POLICY CHANGES
TO LTCH PPS PAYMENTS FOR STANDARD FEDERAL PAYMENT RATE CASES FOR FY 2018
[Estimated FY 2017 payments compared to estimated FY 2018 payments]
LTCH Classification
(1)
No. of
LTCHs
(2)
Number
of LTCH
PPS
Standard
Federal
Payment
Rate
Cases
(3)
Average FY
2017 LTCH
PPS
Payment
Per
Standard
Federal
Payment
Rate
(4)
Average
FY 2018
LTCH PPS
Payment
Per
Standard
Federal
Payment
Rate1
(5)
Percent
Change
Due to
Change
to the
Annual
Update to
the
Standard
Federal
Payment
Rate2
(6)
Percent
Change
Due to
Changes to
Area Wage
Adjustment
with Wage
Budget
Neutrality3
(7)
Proposed
Percent
Change Due
to Change to
the
Short-Stay
Outlier
Payment
Methodology
Change4
(8)
Percent
Change
Due to All
Standard
Federal
Payment
Rate
Changes5
(9)
ALL PROVIDERS 415 73,915 $46,637 $47,109 0.9 0.0 0.0 1.0
BY LOCATION:
RURAL 21 2,223 $38,004 $37,969 0.9 -0.3 -0.3 -0.1
URBAN 394 71,692 $46,905 $47,392 0.9 0.0 0.0 1.0
LARGE 199 41,253 $49,568 $50,141 0.9 0.1 0.1 1.2
OTHER 195 30,439 $43,294 $43,665 0.9 -0.1 -0.2 0.9
BY PARTICIPATION DATE:
BEFORE OCT. 1983 11 1,832 $43,730 $44,550 0.9 -0.6 0.7 1.9
OCT. 1983 - SEPT. 1993 42 9,202 $52,289 $52,672 0.8 -0.1 -0.2 0.7
OCT. 1993 - SEPT. 2002 167 27,657 $46,363 $46,847 0.9 0.1 0.1 1.0
AFTER OCTOBER 2002 195 35,224 $45,527 $45,993 0.9 0.0 -0.1 1.0
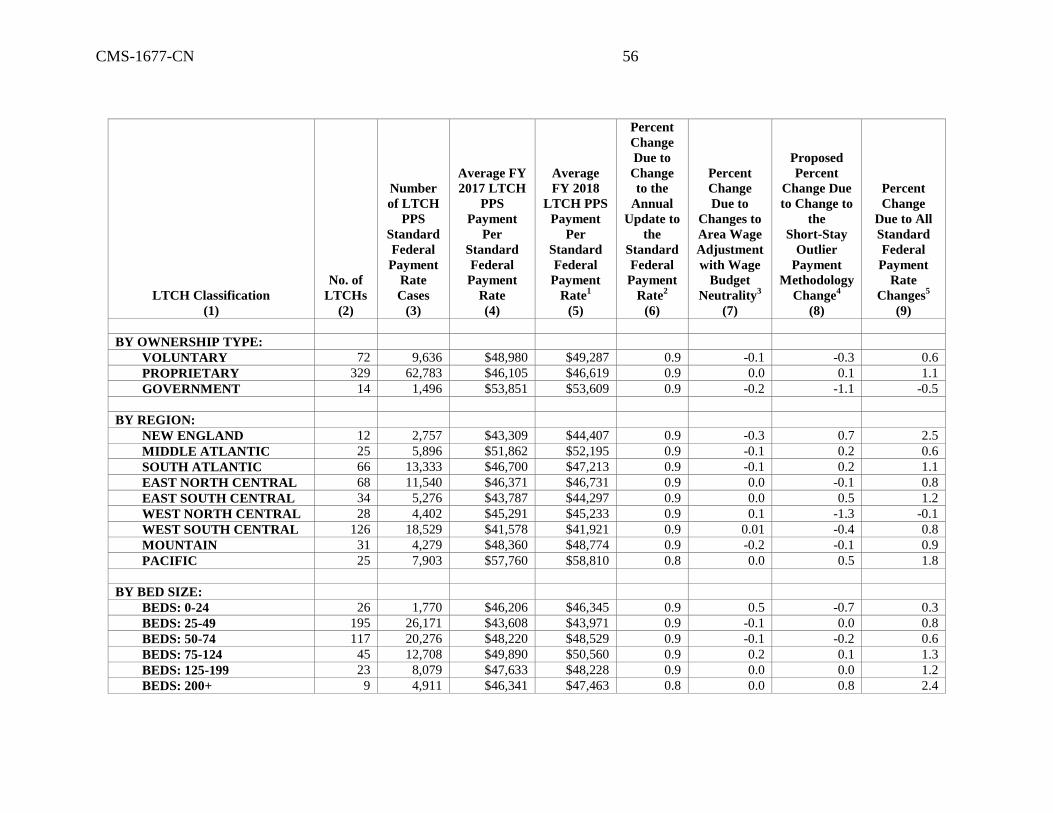
CMS-1677-CN 56
LTCH Classification
(1)
No. of
LTCHs
(2)
Number
of LTCH
PPS
Standard
Federal
Payment
Rate
Cases
(3)
Average FY
2017 LTCH
PPS
Payment
Per
Standard
Federal
Payment
Rate
(4)
Average
FY 2018
LTCH PPS
Payment
Per
Standard
Federal
Payment
Rate1
(5)
Percent
Change
Due to
Change
to the
Annual
Update to
the
Standard
Federal
Payment
Rate2
(6)
Percent
Change
Due to
Changes to
Area Wage
Adjustment
with Wage
Budget
Neutrality3
(7)
Proposed
Percent
Change Due
to Change to
the
Short-Stay
Outlier
Payment
Methodology
Change4
(8)
Percent
Change
Due to All
Standard
Federal
Payment
Rate
Changes5
(9)
BY OWNERSHIP TYPE:
VOLUNTARY 72 9,636 $48,980 $49,287 0.9 -0.1 -0.3 0.6
PROPRIETARY 329 62,783 $46,105 $46,619 0.9 0.0 0.1 1.1
GOVERNMENT 14 1,496 $53,851 $53,609 0.9 -0.2 -1.1 -0.5
BY REGION:
NEW ENGLAND 12 2,757 $43,309 $44,407 0.9 -0.3 0.7 2.5
MIDDLE ATLANTIC 25 5,896 $51,862 $52,195 0.9 -0.1 0.2 0.6
SOUTH ATLANTIC 66 13,333 $46,700 $47,213 0.9 -0.1 0.2 1.1
EAST NORTH CENTRAL 68 11,540 $46,371 $46,731 0.9 0.0 -0.1 0.8
EAST SOUTH CENTRAL 34 5,276 $43,787 $44,297 0.9 0.0 0.5 1.2
WEST NORTH CENTRAL 28 4,402 $45,291 $45,233 0.9 0.1 -1.3 -0.1
WEST SOUTH CENTRAL 126 18,529 $41,578 $41,921 0.9 0.01 -0.4 0.8
MOUNTAIN 31 4,279 $48,360 $48,774 0.9 -0.2 -0.1 0.9
PACIFIC 25 7,903 $57,760 $58,810 0.8 0.0 0.5 1.8
BY BED SIZE:
BEDS: 0-24 26 1,770 $46,206 $46,345 0.9 0.5 -0.7 0.3
BEDS: 25-49 195 26,171 $43,608 $43,971 0.9 -0.1 0.0 0.8
BEDS: 50-74 117 20,276 $48,220 $48,529 0.9 -0.1 -0.2 0.6
BEDS: 75-124 45 12,708 $49,890 $50,560 0.9 0.2 0.1 1.3
BEDS: 125-199 23 8,079 $47,633 $48,228 0.9 0.0 0.0 1.2
BEDS: 200+ 9 4,911 $46,341 $47,463 0.8 0.0 0.8 2.4
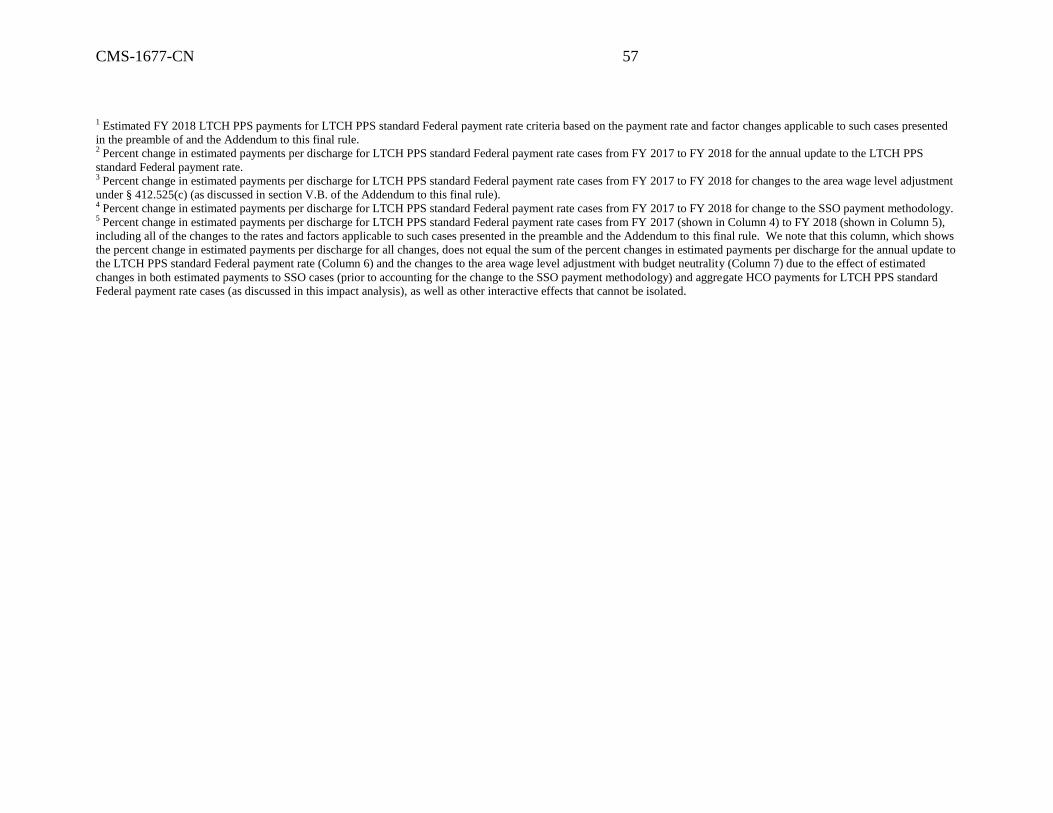
CMS-1677-CN 57
1 Estimated FY 2018 LTCH PPS payments for LTCH PPS standard Federal payment rate criteria based on the payment rate and factor changes applicable to such cases presented
in the preamble of and the Addendum to this final rule. 2 Percent change in estimated payments per discharge for LTCH PPS standard Federal payment rate cases from FY 2017 to FY 2018 for the annual update to the LTCH PPS
standard Federal payment rate. 3 Percent change in estimated payments per discharge for LTCH PPS standard Federal payment rate cases from FY 2017 to FY 2018 for changes to the area wage level adjustment
under § 412.525(c) (as discussed in section V.B. of the Addendum to this final rule). 4 Percent change in estimated payments per discharge for LTCH PPS standard Federal payment rate cases from FY 2017 to FY 2018 for change to the SSO payment methodology. 5 Percent change in estimated payments per discharge for LTCH PPS standard Federal payment rate cases from FY 2017 (shown in Column 4) to FY 2018 (shown in Column 5),
including all of the changes to the rates and factors applicable to such cases presented in the preamble and the Addendum to this final rule. We note that this column, which shows
the percent change in estimated payments per discharge for all changes, does not equal the sum of the percent changes in estimated payments per discharge for the annual update to
the LTCH PPS standard Federal payment rate (Column 6) and the changes to the area wage level adjustment with budget neutrality (Column 7) due to the effect of estimated
changes in both estimated payments to SSO cases (prior to accounting for the change to the SSO payment methodology) and aggregate HCO payments for LTCH PPS standard
Federal payment rate cases (as discussed in this impact analysis), as well as other interactive effects that cannot be isolated.
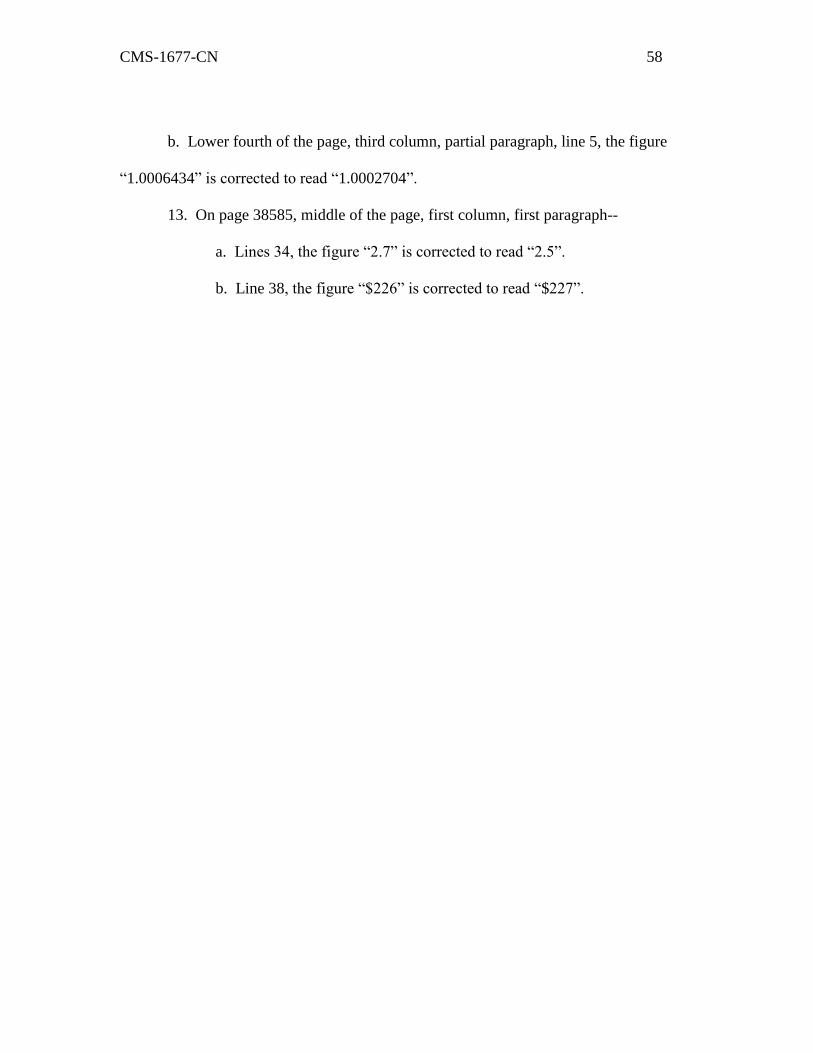
CMS-1677-CN 58
b. Lower fourth of the page, third column, partial paragraph, line 5, the figure
“1.0006434” is corrected to read “1.0002704”.
13. On page 38585, middle of the page, first column, first paragraph--
a. Lines 34, the figure “2.7” is corrected to read “2.5”.
b. Line 38, the figure “$226” is corrected to read “$227”.
CMS-1677-CN
Dated: September 29, 2017.
_________________________________
Ann C. Agnew,
Executive Secretary to the Department,
Department of Health and Human Services.
BILLING CODE 4120-01-P
[FR Doc. 2017-21325 Filed: 9/29/2017 4:15 pm; Publication Date: 10/4/2017]