Embed Size (px)
Citation preview
Department of Public Safety and Correctional Services
STATE OF MARYLAND Maryland Correctional Enterprises
LAWRENCE J. HOGAN, JR. GOVERNOR 7275 WATERLOO ROAD • JESSUP, MARYLAND 20794 • www.mce.md.gov
(410) 540-5400 • FAX (410) 540-5570 • TTY USERS (800) 735-2258
RUTHERFORD K. BOYD LT. GOVERNOR
STEPHEN T. MOYER
SECRETARY
WENDELL M. FRANCE DEPUTY SECRETARY-
OPERATIONS
STEPHEN M. SHILOH, CCE
CHIEF EXECUTIVE OFFICER
MANAGING FOR RESULTS
MARYLAND CORRECTIONAL ENTERPRISES
STRATEGIC BUSINESS PLAN FISCAL YEARS
2016-2018
Stephen M. Shiloh, CCE Chief Executive Officer
SEPTEMBER 2015
Stephen T. Moyer Wendell M. France Secretary Deputy Secretary-Operations
Department of Public Safety and Correctional Services
Department of Public Safety and Correctional Services

1
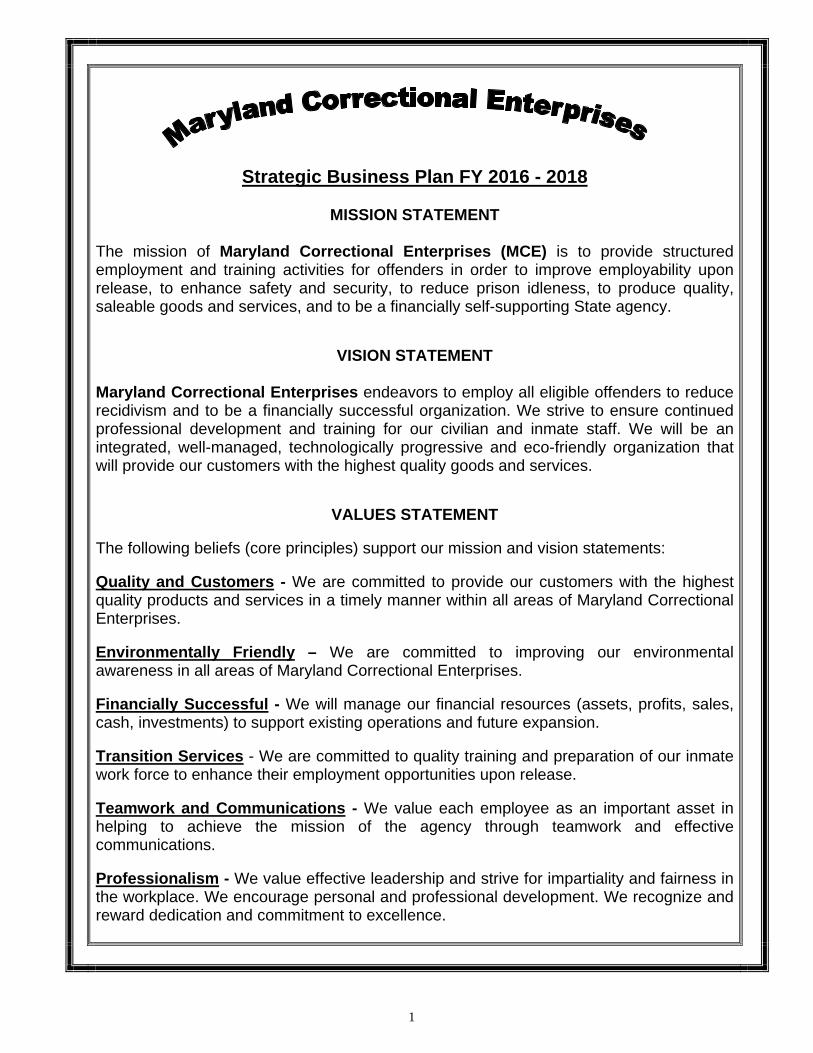
Strategic Business Plan FY 2016 - 2018
MISSION STATEMENT The mission of Maryland Correctional Enterprises (MCE) is to provide structured employment and training activities for offenders in order to improve employability upon release, to enhance safety and security, to reduce prison idleness, to produce quality, saleable goods and services, and to be a financially self-supporting State agency.
VISION STATEMENT
Maryland Correctional Enterprises endeavors to employ all eligible offenders to reduce recidivism and to be a financially successful organization. We strive to ensure continued professional development and training for our civilian and inmate staff. We will be an integrated, well-managed, technologically progressive and eco-friendly organization that will provide our customers with the highest quality goods and services.
VALUES STATEMENT The following beliefs (core principles) support our mission and vision statements: Quality and Customers - We are committed to provide our customers with the highest quality products and services in a timely manner within all areas of Maryland Correctional Enterprises. Environmentally Friendly – We are committed to improving our environmental awareness in all areas of Maryland Correctional Enterprises. Financially Successful - We will manage our financial resources (assets, profits, sales, cash, investments) to support existing operations and future expansion. Transition Services - We are committed to quality training and preparation of our inmate work force to enhance their employment opportunities upon release. Teamwork and Communications - We value each employee as an important asset in helping to achieve the mission of the agency through teamwork and effective communications. Professionalism - We value effective leadership and strive for impartiality and fairness in the workplace. We encourage personal and professional development. We recognize and reward dedication and commitment to excellence.
2
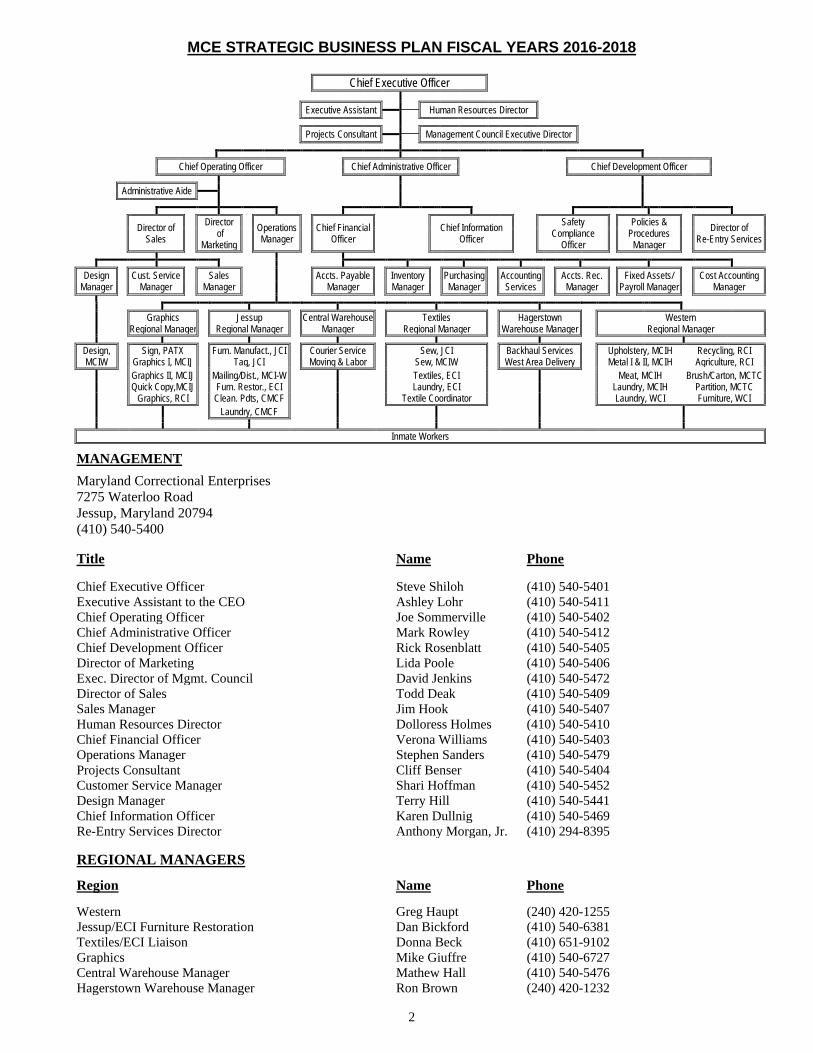
MCE STRATEGIC BUSINESS PLAN FISCAL YEARS 2016-2018
Chief Executive Officer Executive Assistant Human Resources Director
Projects Consultant Management Council Executive Director
Chief Operating Officer Chief Administrative Officer Chief Development Officer Administrative Aide
Director of
Sales Director
of Marketing
Operations Manager
Chief Financial Officer
Chief Information
Officer Safety
Compliance Officer
Policies & Procedures
Manager
Director of Re-Entry Services
Design Manager
Cust. Service Manager
Sales Manager
Accts. Payable Manager
Inventory Manager
Purchasing Manager
Accounting Services
Accts. Rec. Manager
Fixed Assets/ Payroll Manager
Cost Accounting Manager
Graphics Regional Manager Jessup
Regional Manager Central Warehouse Manager Textiles
Regional Manager Hagerstown Warehouse Manager Western
Regional Manager
Design, Sign, PATX Furn. Manufact., JCI Courier Service Sew, JCI Backhaul Services Upholstery, MCIH Recycling, RCI MCIW Graphics I, MCIJ Tag, JCI Moving & Labor Sew, MCIW West Area Delivery Metal I & II, MCIH Agriculture, RCI
Graphics II, MCIJ Mailing/Dist., MCI-W Textiles, ECI Meat, MCIH Brush/Carton, MCTC Quick Copy,MCIJ Furn. Restor., ECI Laundry, ECI Laundry, MCIH Partition, MCTC Graphics, RCI Clean. Pdts, CMCF Textile Coordinator Laundry, WCI Furniture, WCI Laundry, CMCF
Inmate Workers
MANAGEMENT
Maryland Correctional Enterprises 7275 Waterloo Road Jessup, Maryland 20794 (410) 540-5400 Title Name Phone Chief Executive Officer Steve Shiloh (410) 540-5401 Executive Assistant to the CEO Ashley Lohr (410) 540-5411 Chief Operating Officer Joe Sommerville (410) 540-5402 Chief Administrative Officer Mark Rowley (410) 540-5412 Chief Development Officer Rick Rosenblatt (410) 540-5405 Director of Marketing Lida Poole (410) 540-5406 Exec. Director of Mgmt. Council David Jenkins (410) 540-5472 Director of Sales Todd Deak (410) 540-5409 Sales Manager Jim Hook (410) 540-5407 Human Resources Director Dolloress Holmes (410) 540-5410 Chief Financial Officer Verona Williams (410) 540-5403 Operations Manager Stephen Sanders (410) 540-5479 Projects Consultant Cliff Benser (410) 540-5404 Customer Service Manager Shari Hoffman (410) 540-5452 Design Manager Terry Hill (410) 540-5441 Chief Information Officer Karen Dullnig (410) 540-5469 Re-Entry Services Director Anthony Morgan, Jr. (410) 294-8395 REGIONAL MANAGERS
Region Name Phone Western Greg Haupt (240) 420-1255 Jessup/ECI Furniture Restoration Dan Bickford (410) 540-6381 Textiles/ECI Liaison Donna Beck (410) 651-9102 Graphics Mike Giuffre (410) 540-6727 Central Warehouse Manager Mathew Hall (410) 540-5476 Hagerstown Warehouse Manager Ron Brown (240) 420-1232
3
Maryland Correctional Enterprises/Q00A 03.01 Fiscal Years 2016 – 2018
Goals, Objectives, Strategies
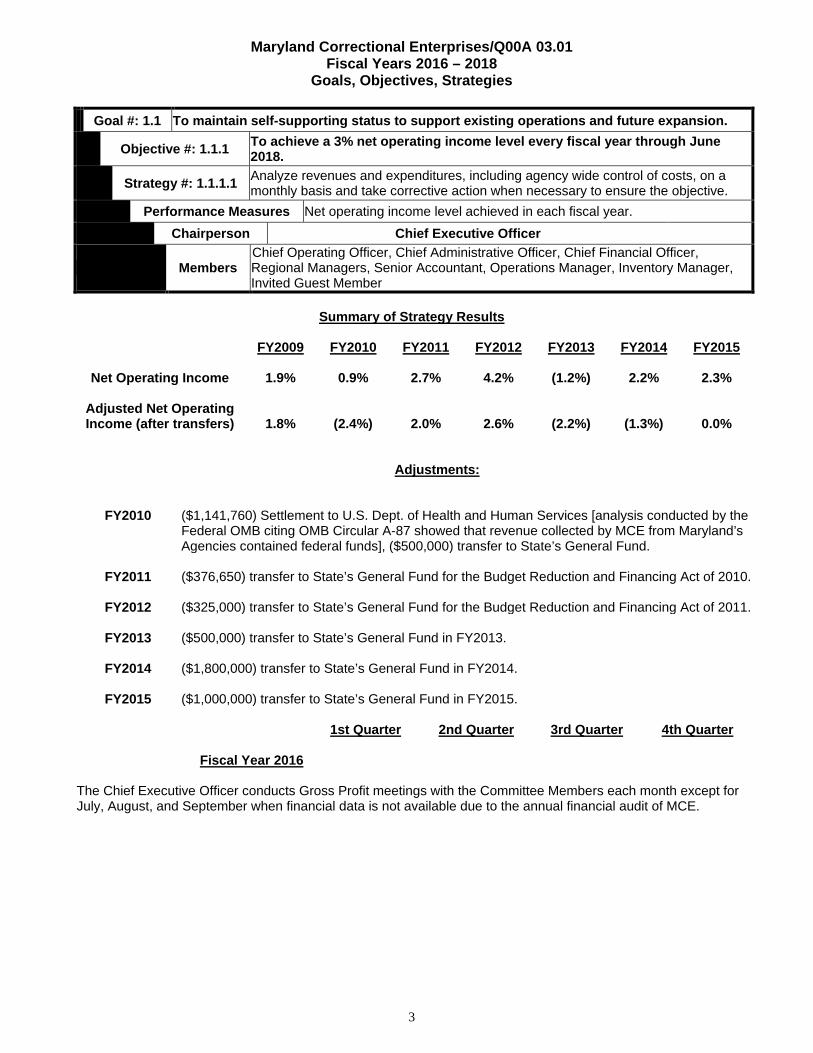
Goal #: 1.1 To maintain self-supporting status to support existing operations and future expansion.
Objective #: 1.1.1 To achieve a 3% net operating income level every fiscal year through June 2018.
Strategy #: 1.1.1.1 Analyze revenues and expenditures, including agency wide control of costs, on a monthly basis and take corrective action when necessary to ensure the objective.
Performance Measures Net operating income level achieved in each fiscal year.
Chairperson Chief Executive Officer
Members Chief Operating Officer, Chief Administrative Officer, Chief Financial Officer, Regional Managers, Senior Accountant, Operations Manager, Inventory Manager, Invited Guest Member
Summary of Strategy Results
FY2009 FY2010 FY2011 FY2012 FY2013 FY2014 FY2015
Net Operating Income 1.9% 0.9% 2.7% 4.2% (1.2%) 2.2% 2.3%
Adjusted Net Operating Income (after transfers) 1.8% (2.4%) 2.0% 2.6% (2.2%) (1.3%) 0.0%
Adjustments:
FY2010 ($1,141,760) Settlement to U.S. Dept. of Health and Human Services [analysis conducted by the Federal OMB citing OMB Circular A-87 showed that revenue collected by MCE from Maryland’s Agencies contained federal funds], ($500,000) transfer to State’s General Fund.
FY2011 ($376,650) transfer to State’s General Fund for the Budget Reduction and Financing Act of 2010.
FY2012 ($325,000) transfer to State’s General Fund for the Budget Reduction and Financing Act of 2011.
FY2013 ($500,000) transfer to State’s General Fund in FY2013.
FY2014 ($1,800,000) transfer to State’s General Fund in FY2014.
FY2015 ($1,000,000) transfer to State’s General Fund in FY2015.
1st Quarter 2nd Quarter 3rd Quarter 4th Quarter
Fiscal Year 2016
The Chief Executive Officer conducts Gross Profit meetings with the Committee Members each month except for July, August, and September when financial data is not available due to the annual financial audit of MCE.
4
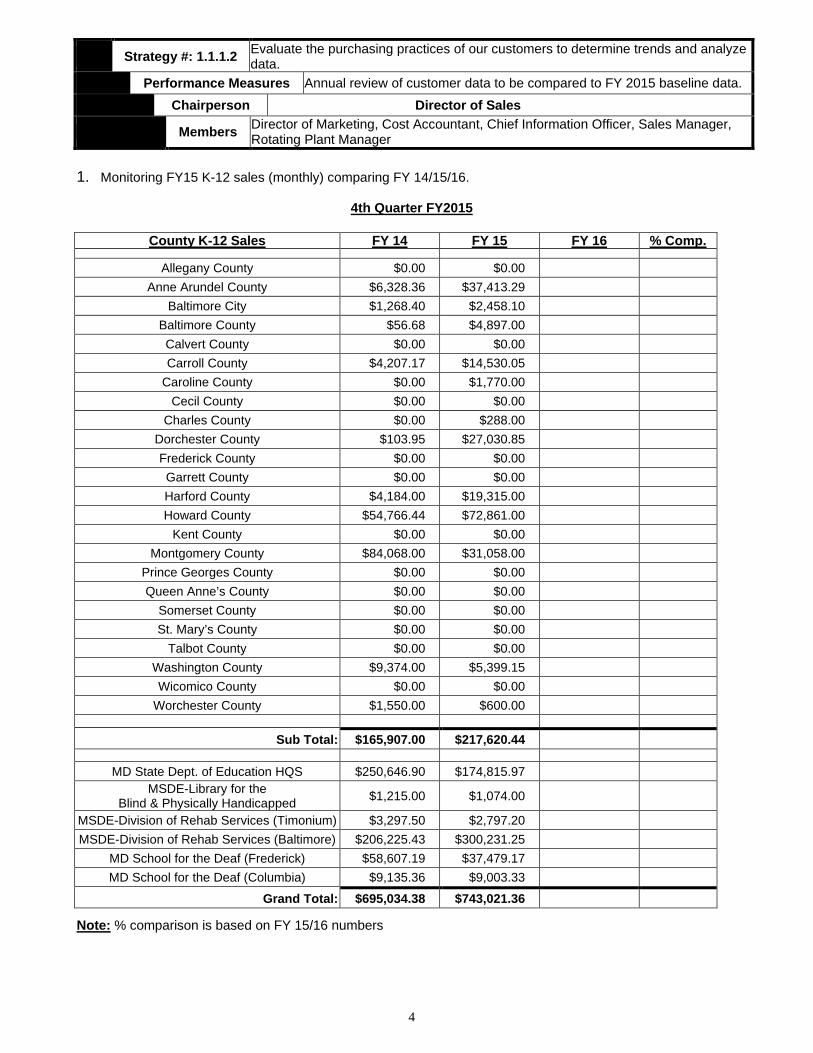
Strategy #: 1.1.1.2 Evaluate the purchasing practices of our customers to determine trends and analyze data.
Performance Measures Annual review of customer data to be compared to FY 2015 baseline data.
Chairperson Director of Sales
Members Director of Marketing, Cost Accountant, Chief Information Officer, Sales Manager, Rotating Plant Manager
1. Monitoring FY15 K-12 sales (monthly) comparing FY 14/15/16.
4th Quarter FY2015
County K-12 Sales FY 14 FY 15 FY 16 % Comp.
Allegany County $0.00 $0.00 Anne Arundel County $6,328.36 $37,413.29
Baltimore City $1,268.40 $2,458.10 Baltimore County $56.68 $4,897.00 Calvert County $0.00 $0.00 Carroll County $4,207.17 $14,530.05
Caroline County $0.00 $1,770.00 Cecil County $0.00 $0.00
Charles County $0.00 $288.00 Dorchester County $103.95 $27,030.85 Frederick County $0.00 $0.00 Garrett County $0.00 $0.00 Harford County $4,184.00 $19,315.00 Howard County $54,766.44 $72,861.00
Kent County $0.00 $0.00 Montgomery County $84,068.00 $31,058.00
Prince Georges County $0.00 $0.00 Queen Anne’s County $0.00 $0.00
Somerset County $0.00 $0.00 St. Mary’s County $0.00 $0.00
Talbot County $0.00 $0.00 Washington County $9,374.00 $5,399.15 Wicomico County $0.00 $0.00
Worchester County $1,550.00 $600.00
Sub Total: $165,907.00 $217,620.44
MD State Dept. of Education HQS $250,646.90 $174,815.97 MSDE-Library for the
Blind & Physically Handicapped $1,215.00 $1,074.00 MSDE-Division of Rehab Services (Timonium) $3,297.50 $2,797.20 MSDE-Division of Rehab Services (Baltimore) $206,225.43 $300,231.25
MD School for the Deaf (Frederick) $58,607.19 $37,479.17 MD School for the Deaf (Columbia) $9,135.36 $9,003.33
Grand Total: $695,034.38 $743,021.36
Note: % comparison is based on FY 15/16 numbers
5
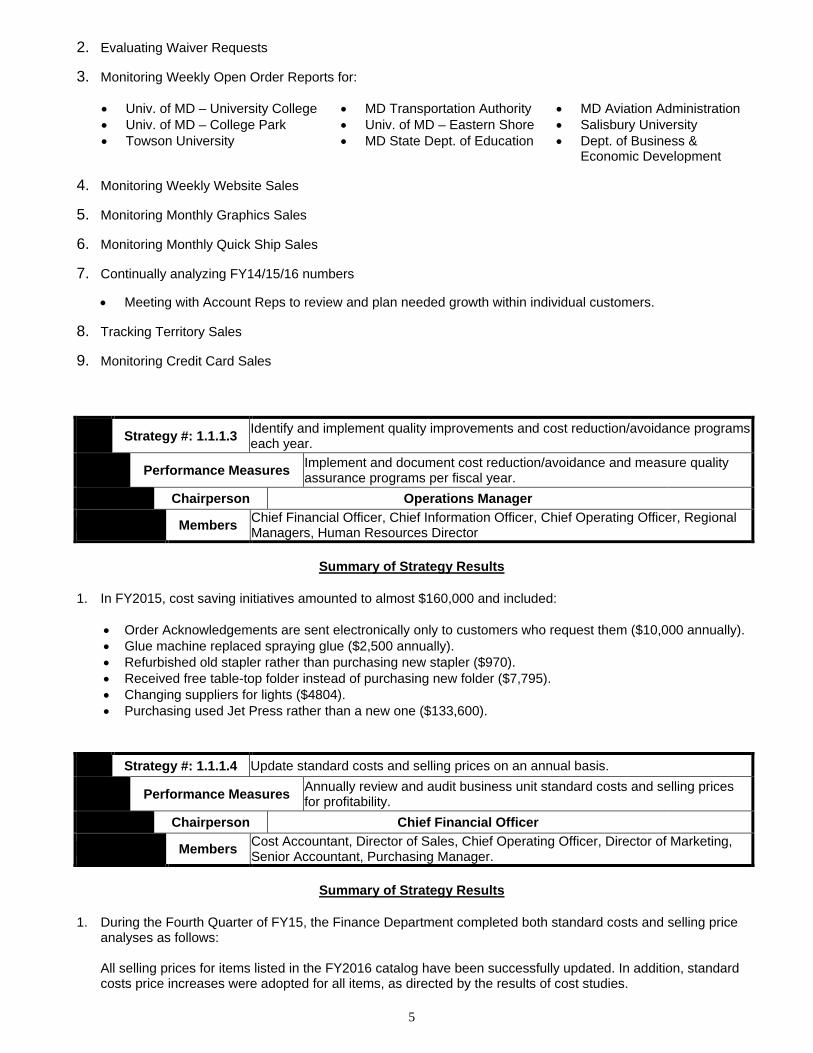
2. Evaluating Waiver Requests 3. Monitoring Weekly Open Order Reports for:
• Univ. of MD – University College • MD Transportation Authority • MD Aviation Administration • Univ. of MD – College Park • Univ. of MD – Eastern Shore • Salisbury University • Towson University • MD State Dept. of Education • Dept. of Business &
Economic Development 4. Monitoring Weekly Website Sales 5. Monitoring Monthly Graphics Sales 6. Monitoring Monthly Quick Ship Sales 7. Continually analyzing FY14/15/16 numbers
• Meeting with Account Reps to review and plan needed growth within individual customers. 8. Tracking Territory Sales 9. Monitoring Credit Card Sales
Strategy #: 1.1.1.3 Identify and implement quality improvements and cost reduction/avoidance programs each year.
Performance Measures Implement and document cost reduction/avoidance and measure quality assurance programs per fiscal year.
Chairperson Operations Manager
Members Chief Financial Officer, Chief Information Officer, Chief Operating Officer, Regional Managers, Human Resources Director
Summary of Strategy Results
1. In FY2015, cost saving initiatives amounted to almost $160,000 and included:
• Order Acknowledgements are sent electronically only to customers who request them ($10,000 annually). • Glue machine replaced spraying glue ($2,500 annually). • Refurbished old stapler rather than purchasing new stapler ($970). • Received free table-top folder instead of purchasing new folder ($7,795). • Changing suppliers for lights ($4804). • Purchasing used Jet Press rather than a new one ($133,600).
Strategy #: 1.1.1.4 Update standard costs and selling prices on an annual basis.
Performance Measures Annually review and audit business unit standard costs and selling prices for profitability.
Chairperson Chief Financial Officer
Members Cost Accountant, Director of Sales, Chief Operating Officer, Director of Marketing, Senior Accountant, Purchasing Manager.
Summary of Strategy Results
1. During the Fourth Quarter of FY15, the Finance Department completed both standard costs and selling price
analyses as follows:
All selling prices for items listed in the FY2016 catalog have been successfully updated. In addition, standard costs price increases were adopted for all items, as directed by the results of cost studies.
6
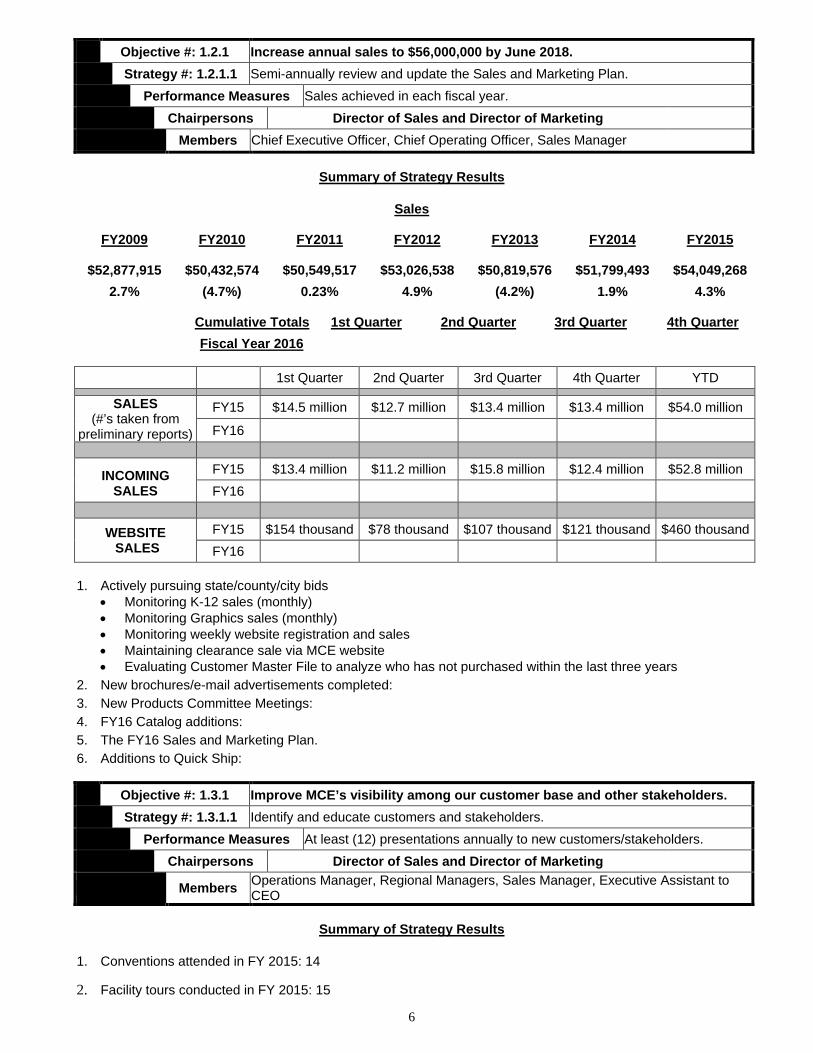
Objective #: 1.2.1 Increase annual sales to $56,000,000 by June 2018.
Strategy #: 1.2.1.1 Semi-annually review and update the Sales and Marketing Plan.
Performance Measures Sales achieved in each fiscal year.
Chairpersons Director of Sales and Director of Marketing
Members Chief Executive Officer, Chief Operating Officer, Sales Manager
Summary of Strategy Results
Sales
FY2009 FY2010 FY2011 FY2012 FY2013 FY2014 FY2015
$52,877,915 $50,432,574 $50,549,517 $53,026,538 $50,819,576 $51,799,493 $54,049,268
2.7% (4.7%) 0.23% 4.9% (4.2%) 1.9% 4.3%
Cumulative Totals 1st Quarter 2nd Quarter 3rd Quarter 4th Quarter
Fiscal Year 2016 1st Quarter 2nd Quarter 3rd Quarter 4th Quarter YTD
SALES (#’s taken from
preliminary reports)
FY15 $14.5 million $12.7 million $13.4 million $13.4 million $54.0 million FY16
INCOMING SALES
FY15 $13.4 million $11.2 million $15.8 million $12.4 million $52.8 million FY16
WEBSITE SALES
FY15 $154 thousand $78 thousand $107 thousand $121 thousand $460 thousand FY16
1. Actively pursuing state/county/city bids
• Monitoring K-12 sales (monthly) • Monitoring Graphics sales (monthly) • Monitoring weekly website registration and sales • Maintaining clearance sale via MCE website • Evaluating Customer Master File to analyze who has not purchased within the last three years
2. New brochures/e-mail advertisements completed:
3. New Products Committee Meetings:
4. FY16 Catalog additions:
5. The FY16 Sales and Marketing Plan.
6. Additions to Quick Ship:
Objective #: 1.3.1 Improve MCE’s visibility among our customer base and other stakeholders.
Strategy #: 1.3.1.1 Identify and educate customers and stakeholders.
Performance Measures At least (12) presentations annually to new customers/stakeholders.
Chairpersons Director of Sales and Director of Marketing
Members Operations Manager, Regional Managers, Sales Manager, Executive Assistant to CEO
Summary of Strategy Results
1. Conventions attended in FY 2015: 14 2. Facility tours conducted in FY 2015: 15
7
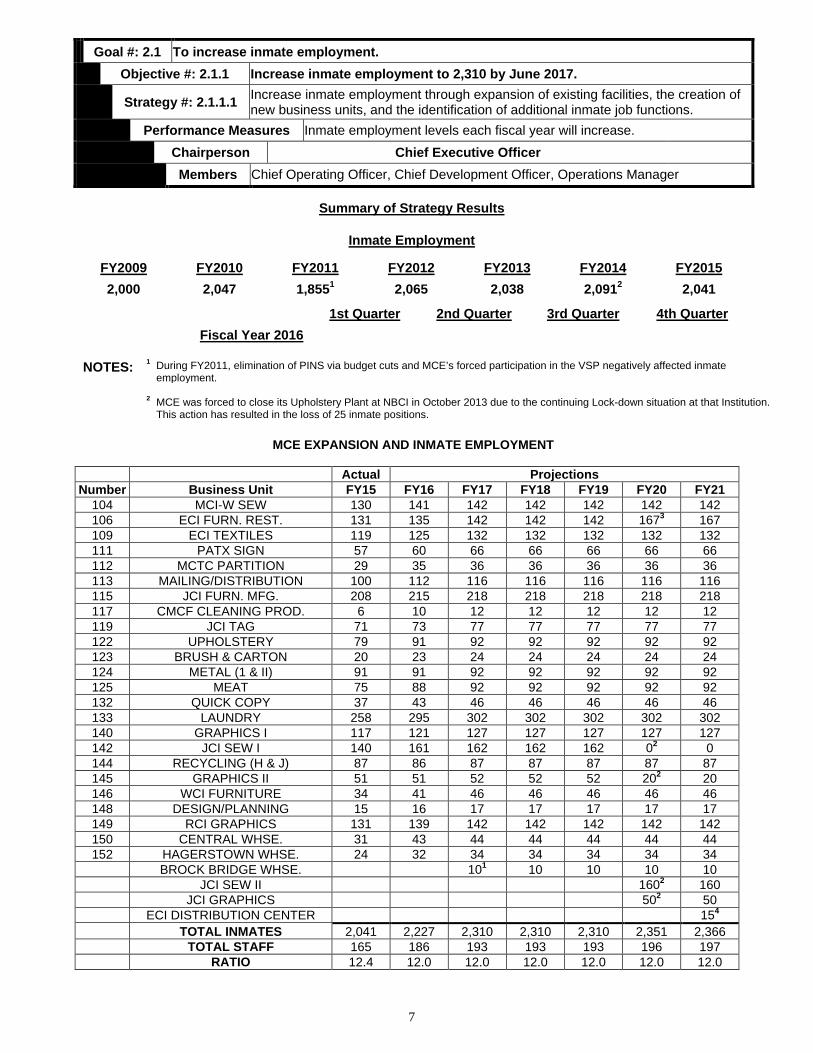
Goal #: 2.1 To increase inmate employment.
Objective #: 2.1.1 Increase inmate employment to 2,310 by June 2017.
Strategy #: 2.1.1.1 Increase inmate employment through expansion of existing facilities, the creation of new business units, and the identification of additional inmate job functions.
Performance Measures Inmate employment levels each fiscal year will increase.
Chairperson Chief Executive Officer
Members Chief Operating Officer, Chief Development Officer, Operations Manager
Summary of Strategy Results
Inmate Employment
FY2009 FY2010 FY2011 FY2012 FY2013 FY2014 FY2015
2,000 2,047 1,8551 2,065 2,038 2,0912 2,041
1st Quarter 2nd Quarter 3rd Quarter 4th Quarter
Fiscal Year 2016 NOTES: 1 During FY2011, elimination of PINS via budget cuts and MCE’s forced participation in the VSP negatively affected inmate
employment. 2 MCE was forced to close its Upholstery Plant at NBCI in October 2013 due to the continuing Lock-down situation at that Institution.
This action has resulted in the loss of 25 inmate positions.
MCE EXPANSION AND INMATE EMPLOYMENT
Actual Projections Number Business Unit FY15 FY16 FY17 FY18 FY19 FY20 FY21
104 MCI-W SEW 130 141 142 142 142 142 142 106 ECI FURN. REST. 131 135 142 142 142 1673 167 109 ECI TEXTILES 119 125 132 132 132 132 132 111 PATX SIGN 57 60 66 66 66 66 66 112 MCTC PARTITION 29 35 36 36 36 36 36 113 MAILING/DISTRIBUTION 100 112 116 116 116 116 116 115 JCI FURN. MFG. 208 215 218 218 218 218 218 117 CMCF CLEANING PROD. 6 10 12 12 12 12 12 119 JCI TAG 71 73 77 77 77 77 77 122 UPHOLSTERY 79 91 92 92 92 92 92 123 BRUSH & CARTON 20 23 24 24 24 24 24 124 METAL (1 & II) 91 91 92 92 92 92 92 125 MEAT 75 88 92 92 92 92 92 132 QUICK COPY 37 43 46 46 46 46 46 133 LAUNDRY 258 295 302 302 302 302 302 140 GRAPHICS I 117 121 127 127 127 127 127 142 JCI SEW I 140 161 162 162 162 02 0 144 RECYCLING (H & J) 87 86 87 87 87 87 87 145 GRAPHICS II 51 51 52 52 52 202 20 146 WCI FURNITURE 34 41 46 46 46 46 46 148 DESIGN/PLANNING 15 16 17 17 17 17 17 149 RCI GRAPHICS 131 139 142 142 142 142 142 150 CENTRAL WHSE. 31 43 44 44 44 44 44 152 HAGERSTOWN WHSE. 24 32 34 34 34 34 34
BROCK BRIDGE WHSE. 101 10 10 10 10 JCI SEW II 1602 160 JCI GRAPHICS 502 50 ECI DISTRIBUTION CENTER 154
TOTAL INMATES 2,041 2,227 2,310 2,310 2,310 2,351 2,366 TOTAL STAFF 165 186 193 193 193 196 197 RATIO 12.4 12.0 12.0 12.0 12.0 12.0 12.0
8
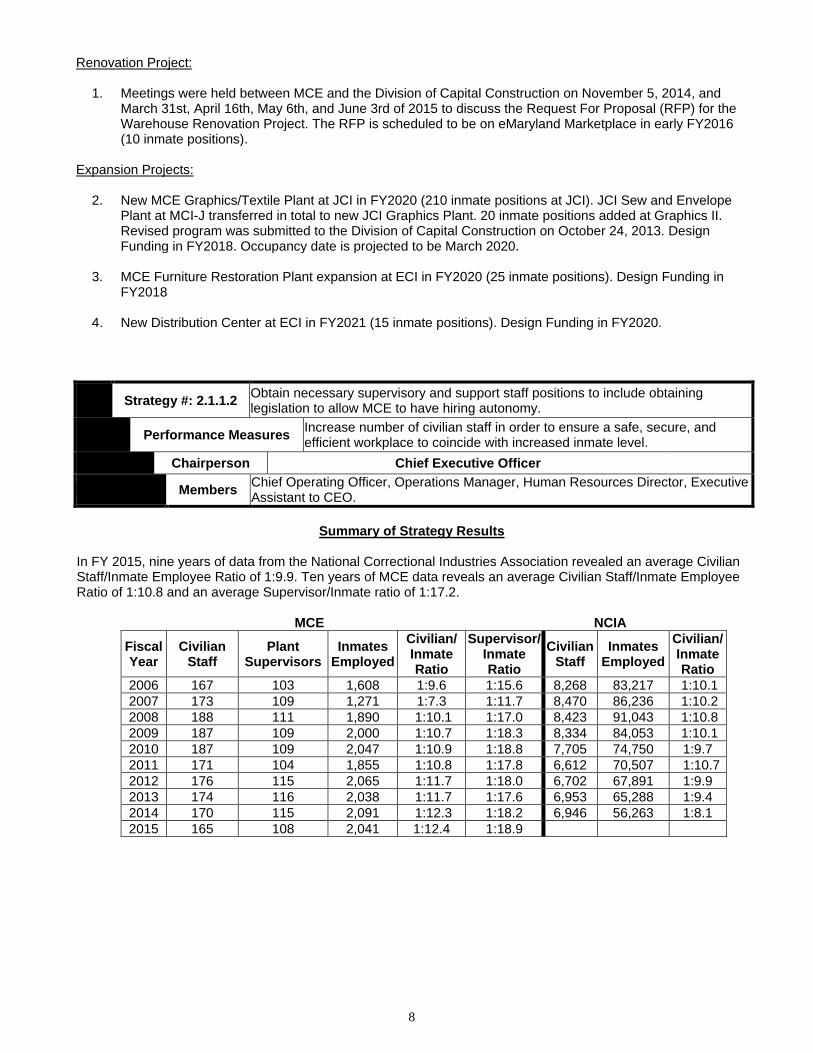
Renovation Project:
1. Meetings were held between MCE and the Division of Capital Construction on November 5, 2014, and
March 31st, April 16th, May 6th, and June 3rd of 2015 to discuss the Request For Proposal (RFP) for the Warehouse Renovation Project. The RFP is scheduled to be on eMaryland Marketplace in early FY2016 (10 inmate positions).
Expansion Projects:
2. New MCE Graphics/Textile Plant at JCI in FY2020 (210 inmate positions at JCI). JCI Sew and Envelope
Plant at MCI-J transferred in total to new JCI Graphics Plant. 20 inmate positions added at Graphics II. Revised program was submitted to the Division of Capital Construction on October 24, 2013. Design Funding in FY2018. Occupancy date is projected to be March 2020.
3. MCE Furniture Restoration Plant expansion at ECI in FY2020 (25 inmate positions). Design Funding in
FY2018
4. New Distribution Center at ECI in FY2021 (15 inmate positions). Design Funding in FY2020.
Strategy #: 2.1.1.2 Obtain necessary supervisory and support staff positions to include obtaining legislation to allow MCE to have hiring autonomy.
Performance Measures Increase number of civilian staff in order to ensure a safe, secure, and efficient workplace to coincide with increased inmate level.
Chairperson Chief Executive Officer
Members Chief Operating Officer, Operations Manager, Human Resources Director, Executive Assistant to CEO.
Summary of Strategy Results
In FY 2015, nine years of data from the National Correctional Industries Association revealed an average Civilian Staff/Inmate Employee Ratio of 1:9.9. Ten years of MCE data reveals an average Civilian Staff/Inmate Employee Ratio of 1:10.8 and an average Supervisor/Inmate ratio of 1:17.2. MCE NCIA
Fiscal Year
Civilian Staff
Plant Supervisors
Inmates Employed
Civilian/ Inmate Ratio
Supervisor/Inmate Ratio
Civilian Staff
Inmates Employed
Civilian/ Inmate Ratio
2006 167 103 1,608 1:9.6 1:15.6 8,268 83,217 1:10.1 2007 173 109 1,271 1:7.3 1:11.7 8,470 86,236 1:10.2 2008 188 111 1,890 1:10.1 1:17.0 8,423 91,043 1:10.8 2009 187 109 2,000 1:10.7 1:18.3 8,334 84,053 1:10.1 2010 187 109 2,047 1:10.9 1:18.8 7,705 74,750 1:9.7 2011 171 104 1,855 1:10.8 1:17.8 6,612 70,507 1:10.7 2012 176 115 2,065 1:11.7 1:18.0 6,702 67,891 1:9.9 2013 174 116 2,038 1:11.7 1:17.6 6,953 65,288 1:9.4 2014 170 115 2,091 1:12.3 1:18.2 6,946 56,263 1:8.1 2015 165 108 2,041 1:12.4 1:18.9
9
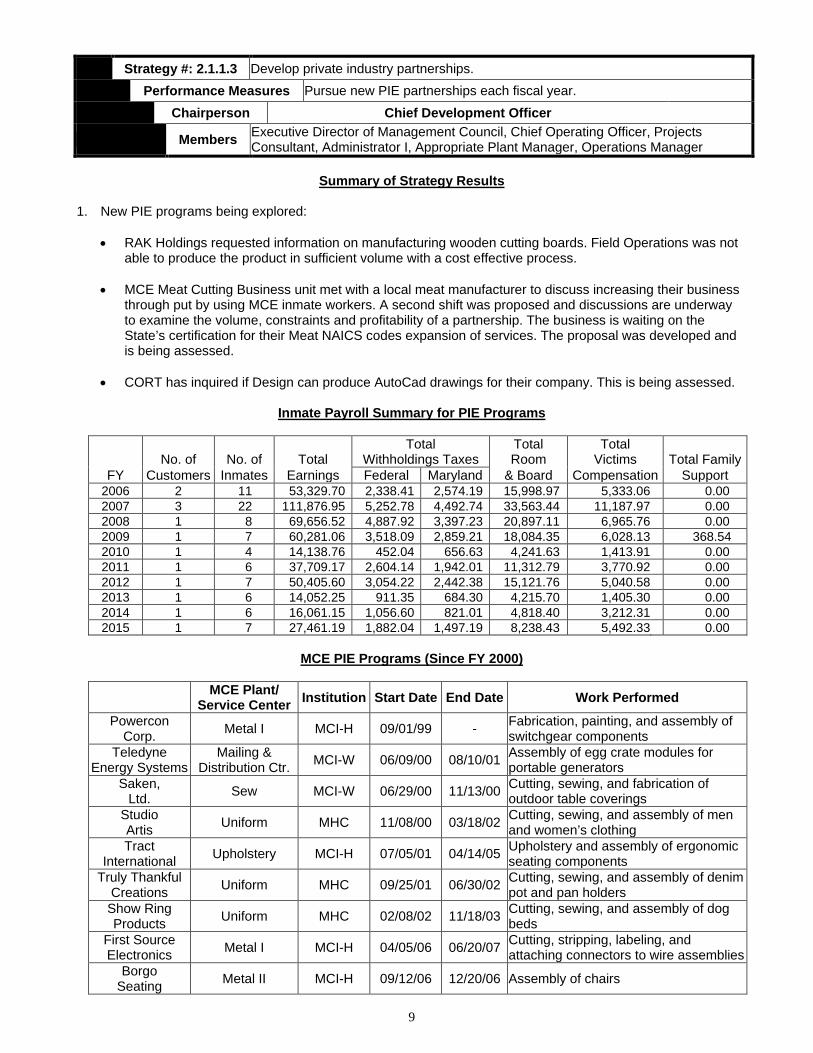
Strategy #: 2.1.1.3 Develop private industry partnerships.
Performance Measures Pursue new PIE partnerships each fiscal year.
Chairperson Chief Development Officer
Members Executive Director of Management Council, Chief Operating Officer, Projects Consultant, Administrator I, Appropriate Plant Manager, Operations Manager
Summary of Strategy Results
1. New PIE programs being explored:
• RAK Holdings requested information on manufacturing wooden cutting boards. Field Operations was not able to produce the product in sufficient volume with a cost effective process.
• MCE Meat Cutting Business unit met with a local meat manufacturer to discuss increasing their business
through put by using MCE inmate workers. A second shift was proposed and discussions are underway to examine the volume, constraints and profitability of a partnership. The business is waiting on the State’s certification for their Meat NAICS codes expansion of services. The proposal was developed and is being assessed.
• CORT has inquired if Design can produce AutoCad drawings for their company. This is being assessed.
Inmate Payroll Summary for PIE Programs
No. of No. of Total Total
Withholdings Taxes Total Room
Total Victims Total Family
FY Customers Inmates Earnings Federal Maryland & Board Compensation Support 2006 2 11 53,329.70 2,338.41 2,574.19 15,998.97 5,333.06 0.00 2007 3 22 111,876.95 5,252.78 4,492.74 33,563.44 11,187.97 0.00 2008 1 8 69,656.52 4,887.92 3,397.23 20,897.11 6,965.76 0.00 2009 1 7 60,281.06 3,518.09 2,859.21 18,084.35 6,028.13 368.54 2010 1 4 14,138.76 452.04 656.63 4,241.63 1,413.91 0.00 2011 1 6 37,709.17 2,604.14 1,942.01 11,312.79 3,770.92 0.00 2012 1 7 50,405.60 3,054.22 2,442.38 15,121.76 5,040.58 0.00 2013 1 6 14,052.25 911.35 684.30 4,215.70 1,405.30 0.00 2014 1 6 16,061.15 1,056.60 821.01 4,818.40 3,212.31 0.00 2015 1 7 27,461.19 1,882.04 1,497.19 8,238.43 5,492.33 0.00
MCE PIE Programs (Since FY 2000)
MCE Plant/ Service Center Institution Start Date End Date Work Performed
Powercon Corp. Metal I MCI-H 09/01/99 - Fabrication, painting, and assembly of
switchgear components Teledyne
Energy Systems Mailing &
Distribution Ctr. MCI-W 06/09/00 08/10/01 Assembly of egg crate modules for portable generators
Saken, Ltd. Sew MCI-W 06/29/00 11/13/00 Cutting, sewing, and fabrication of
outdoor table coverings Studio Artis Uniform MHC 11/08/00 03/18/02 Cutting, sewing, and assembly of men
and women’s clothing Tract
International Upholstery MCI-H 07/05/01 04/14/05 Upholstery and assembly of ergonomic seating components
Truly Thankful Creations Uniform MHC 09/25/01 06/30/02 Cutting, sewing, and assembly of denim
pot and pan holders Show Ring Products Uniform MHC 02/08/02 11/18/03 Cutting, sewing, and assembly of dog
beds First Source Electronics Metal I MCI-H 04/05/06 06/20/07 Cutting, stripping, labeling, and
attaching connectors to wire assemblies Borgo
Seating Metal II MCI-H 09/12/06 12/20/06 Assembly of chairs
10
Quarterly Inmate Summary for PIE Programs (FY 2016)
No. of Total
Withholdings Taxes Room
Total Victims Total Family
QTR Customers Inmates Earnings Federal Maryland & Board Compensation Support 1st 2nd 3rd 4th
Goal #: 3.1 To increase customer satisfaction.
Objective #: 3.1.1 Determine the relative importance of customer satisfaction factors and take appropriate steps to address these issues.
Strategy #: 3.1.1.1 Annual customer survey to identify areas of customer needs.
Performance Measures Survey results and analysis annually.
Chairperson Director of Marketing
Members Customer Service Manager, Chief Information Officer, Regional Managers, Sales Manager, Director of Sales
Summary of Strategy Results
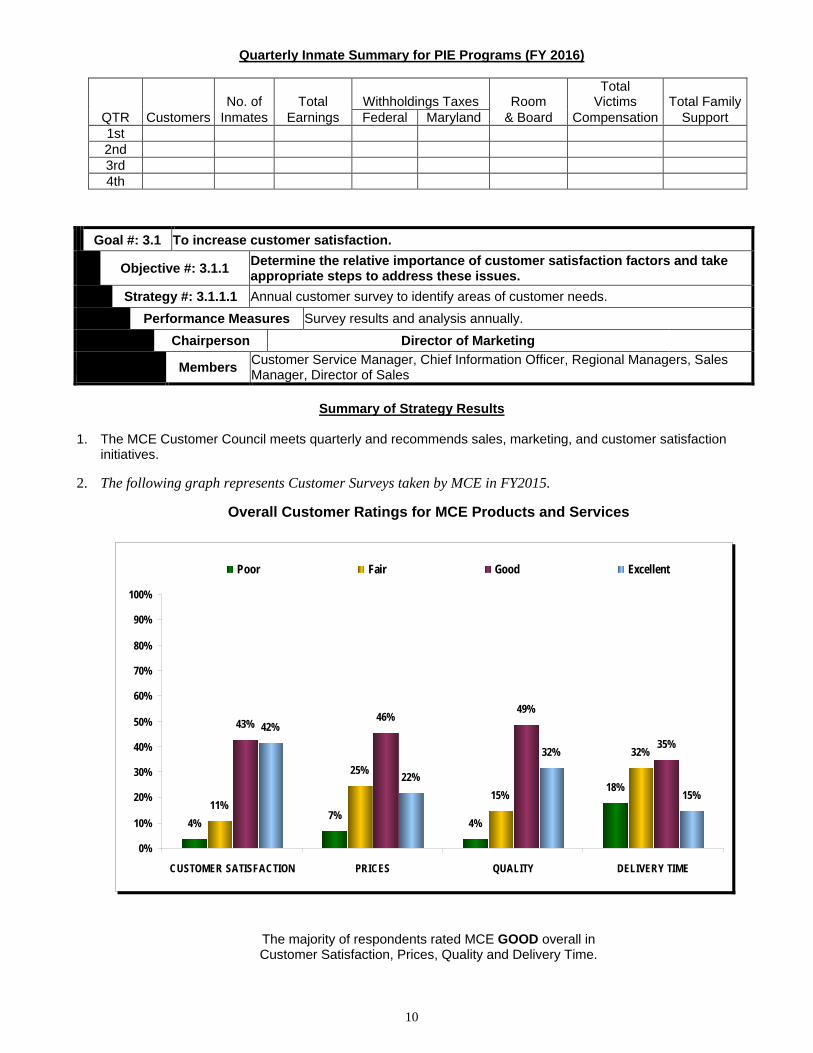
1. The MCE Customer Council meets quarterly and recommends sales, marketing, and customer satisfaction
initiatives. 2. The following graph represents Customer Surveys taken by MCE in FY2015.
Overall Customer Ratings for MCE Products and Services
The majority of respondents rated MCE GOOD overall in Customer Satisfaction, Prices, Quality and Delivery Time.
4% 4%11%
15%
43% 42%
7%
18%25%
32%
46%49%
35%
22%
32%
15%
0%
10%
20%
30%
40%
50%
60%
70%
80%
90%
100%
CUSTOMER SATISFACTION PRICES QUALITY DELIVERY TIME
Poor Fair Good Excellent
11
Objective #: 3.1.2 To meet or exceed industry standards for delivery time by product grouping.
Strategy #: 3.1.2.1 Define industry standards for product groupings to include evaluation and analyses of order process, production, and delivery.
Performance Measures Actual delivery times and monthly value of overdue orders.
Chairperson Chief Operating Officer
Members Operations Manager, Regional Managers, Warehouse Managers, Director of Sales, Administrator I
Summary of Strategy Results
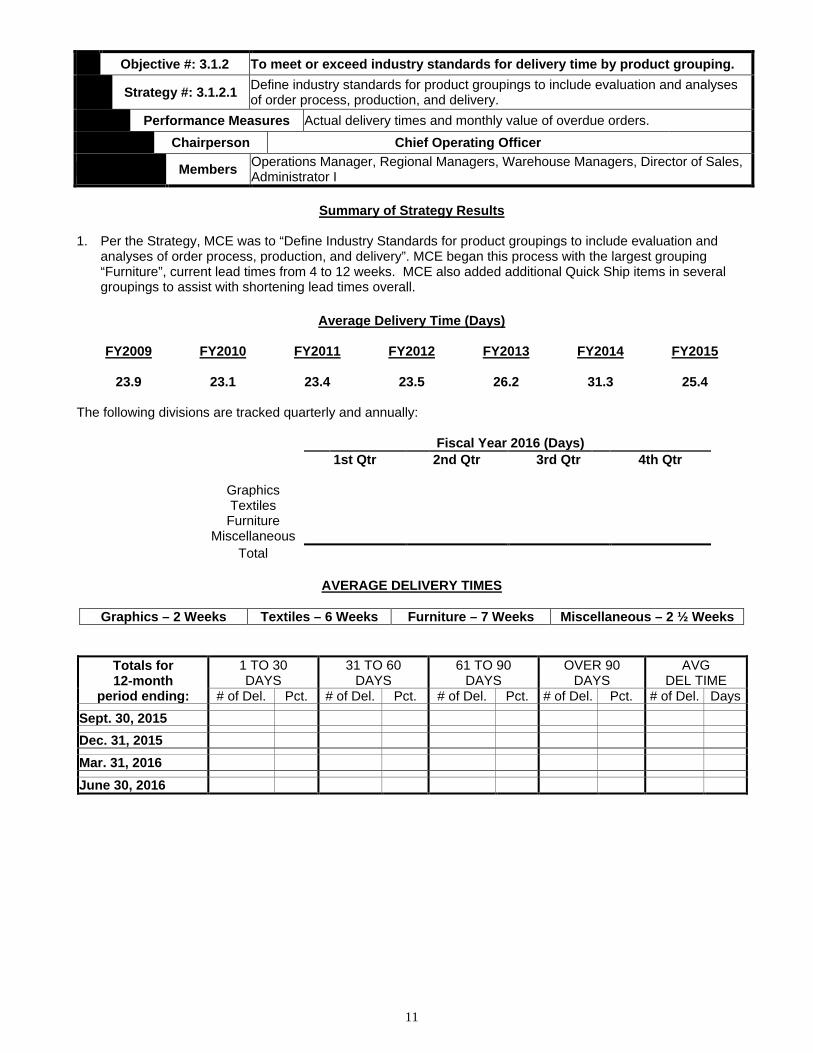
1. Per the Strategy, MCE was to “Define Industry Standards for product groupings to include evaluation and
analyses of order process, production, and delivery”. MCE began this process with the largest grouping “Furniture”, current lead times from 4 to 12 weeks. MCE also added additional Quick Ship items in several groupings to assist with shortening lead times overall.
Average Delivery Time (Days)
FY2009 FY2010 FY2011 FY2012 FY2013 FY2014 FY2015
23.9 23.1 23.4 23.5 26.2 31.3 25.4
The following divisions are tracked quarterly and annually:
Fiscal Year 2016 (Days) 1st Qtr 2nd Qtr 3rd Qtr 4th Qtr Graphics Textiles Furniture Miscellaneous Total
AVERAGE DELIVERY TIMES
Graphics – 2 Weeks Textiles – 6 Weeks Furniture – 7 Weeks Miscellaneous – 2 ½ Weeks
Totals for 12-month
period ending:
1 TO 30 DAYS
31 TO 60 DAYS
61 TO 90 DAYS
OVER 90 DAYS
AVG DEL TIME
# of Del. Pct. # of Del. Pct. # of Del. Pct. # of Del. Pct. # of Del. Days
Sept. 30, 2015
Dec. 31, 2015
Mar. 31, 2016
June 30, 2016
12
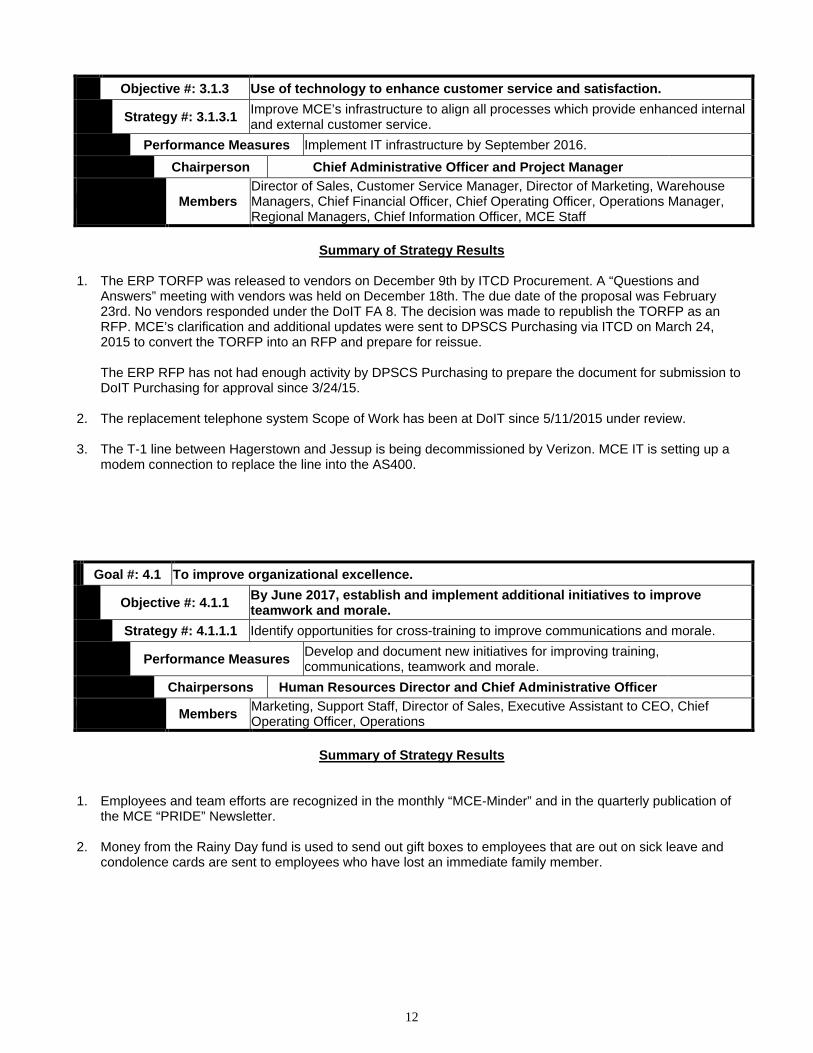
Objective #: 3.1.3 Use of technology to enhance customer service and satisfaction.
Strategy #: 3.1.3.1 Improve MCE’s infrastructure to align all processes which provide enhanced internal and external customer service.
Performance Measures Implement IT infrastructure by September 2016.
Chairperson Chief Administrative Officer and Project Manager
Members Director of Sales, Customer Service Manager, Director of Marketing, Warehouse Managers, Chief Financial Officer, Chief Operating Officer, Operations Manager, Regional Managers, Chief Information Officer, MCE Staff
Summary of Strategy Results
1. The ERP TORFP was released to vendors on December 9th by ITCD Procurement. A “Questions and
Answers” meeting with vendors was held on December 18th. The due date of the proposal was February 23rd. No vendors responded under the DoIT FA 8. The decision was made to republish the TORFP as an RFP. MCE’s clarification and additional updates were sent to DPSCS Purchasing via ITCD on March 24, 2015 to convert the TORFP into an RFP and prepare for reissue.
The ERP RFP has not had enough activity by DPSCS Purchasing to prepare the document for submission to DoIT Purchasing for approval since 3/24/15.
2. The replacement telephone system Scope of Work has been at DoIT since 5/11/2015 under review. 3. The T-1 line between Hagerstown and Jessup is being decommissioned by Verizon. MCE IT is setting up a
modem connection to replace the line into the AS400. Goal #: 4.1 To improve organizational excellence.
Objective #: 4.1.1 By June 2017, establish and implement additional initiatives to improve teamwork and morale.
Strategy #: 4.1.1.1 Identify opportunities for cross-training to improve communications and morale.
Performance Measures Develop and document new initiatives for improving training, communications, teamwork and morale.
Chairpersons Human Resources Director and Chief Administrative Officer
Members Marketing, Support Staff, Director of Sales, Executive Assistant to CEO, Chief Operating Officer, Operations
Summary of Strategy Results
1. Employees and team efforts are recognized in the monthly “MCE-Minder” and in the quarterly publication of
the MCE “PRIDE” Newsletter. 2. Money from the Rainy Day fund is used to send out gift boxes to employees that are out on sick leave and
condolence cards are sent to employees who have lost an immediate family member.
13
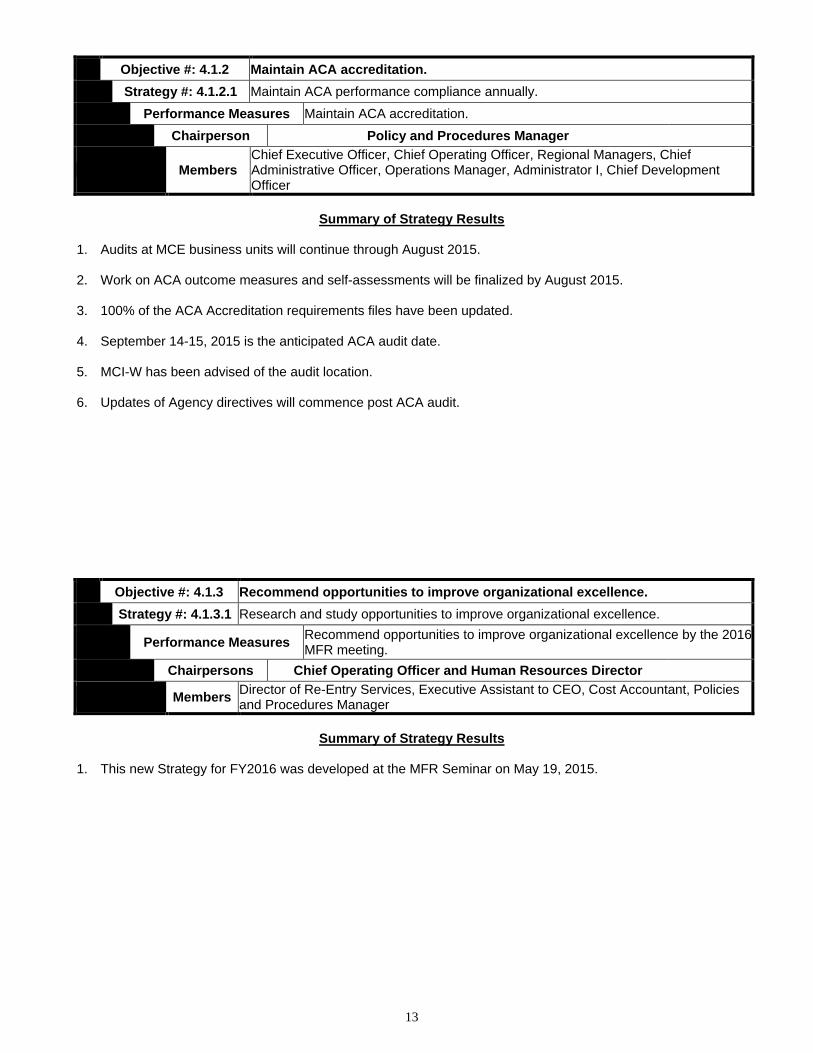
Objective #: 4.1.2 Maintain ACA accreditation.
Strategy #: 4.1.2.1 Maintain ACA performance compliance annually.
Performance Measures Maintain ACA accreditation.
Chairperson Policy and Procedures Manager
Members Chief Executive Officer, Chief Operating Officer, Regional Managers, Chief Administrative Officer, Operations Manager, Administrator I, Chief Development Officer
Summary of Strategy Results
1. Audits at MCE business units will continue through August 2015. 2. Work on ACA outcome measures and self-assessments will be finalized by August 2015. 3. 100% of the ACA Accreditation requirements files have been updated. 4. September 14-15, 2015 is the anticipated ACA audit date. 5. MCI-W has been advised of the audit location. 6. Updates of Agency directives will commence post ACA audit.
Objective #: 4.1.3 Recommend opportunities to improve organizational excellence.
Strategy #: 4.1.3.1 Research and study opportunities to improve organizational excellence.
Performance Measures Recommend opportunities to improve organizational excellence by the 2016 MFR meeting.
Chairpersons Chief Operating Officer and Human Resources Director
Members Director of Re-Entry Services, Executive Assistant to CEO, Cost Accountant, Policies and Procedures Manager
Summary of Strategy Results
1. This new Strategy for FY2016 was developed at the MFR Seminar on May 19, 2015.
14
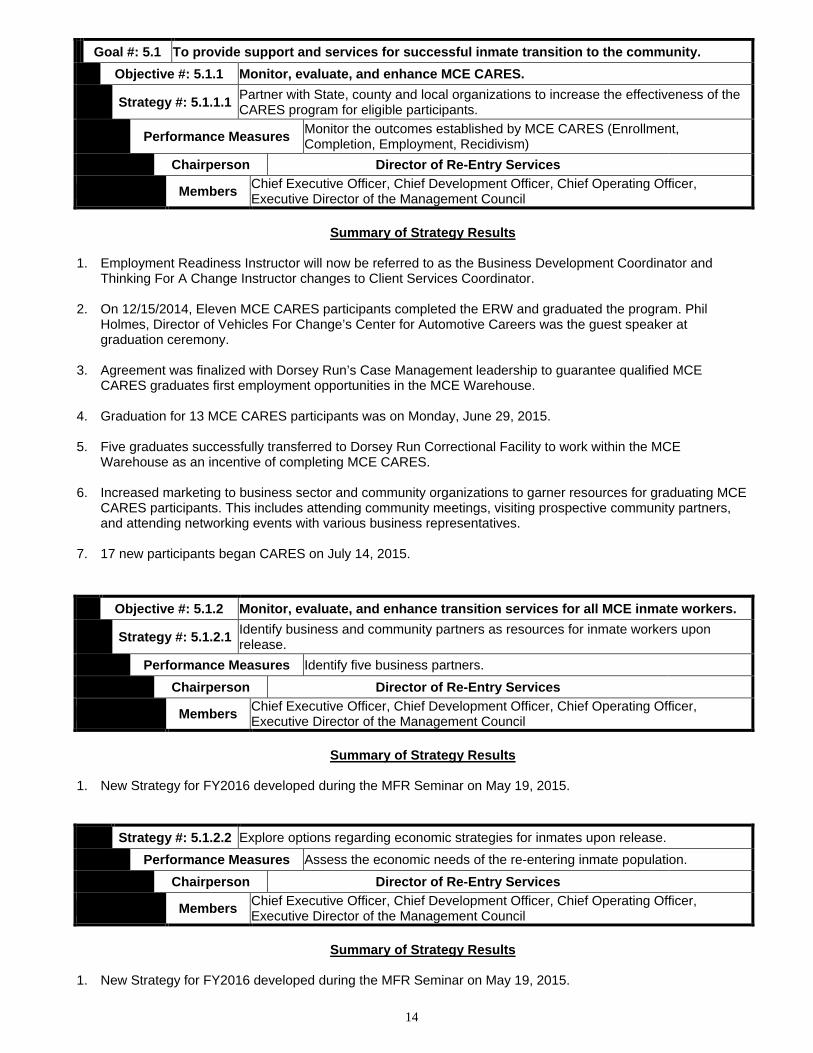
Goal #: 5.1 To provide support and services for successful inmate transition to the community.
Objective #: 5.1.1 Monitor, evaluate, and enhance MCE CARES.
Strategy #: 5.1.1.1 Partner with State, county and local organizations to increase the effectiveness of the CARES program for eligible participants.
Performance Measures Monitor the outcomes established by MCE CARES (Enrollment, Completion, Employment, Recidivism)
Chairperson Director of Re-Entry Services
Members Chief Executive Officer, Chief Development Officer, Chief Operating Officer, Executive Director of the Management Council
Summary of Strategy Results
1. Employment Readiness Instructor will now be referred to as the Business Development Coordinator and
Thinking For A Change Instructor changes to Client Services Coordinator. 2. On 12/15/2014, Eleven MCE CARES participants completed the ERW and graduated the program. Phil
Holmes, Director of Vehicles For Change’s Center for Automotive Careers was the guest speaker at graduation ceremony.
3. Agreement was finalized with Dorsey Run’s Case Management leadership to guarantee qualified MCE
CARES graduates first employment opportunities in the MCE Warehouse. 4. Graduation for 13 MCE CARES participants was on Monday, June 29, 2015. 5. Five graduates successfully transferred to Dorsey Run Correctional Facility to work within the MCE
Warehouse as an incentive of completing MCE CARES. 6. Increased marketing to business sector and community organizations to garner resources for graduating MCE
CARES participants. This includes attending community meetings, visiting prospective community partners, and attending networking events with various business representatives.
7. 17 new participants began CARES on July 14, 2015.
Objective #: 5.1.2 Monitor, evaluate, and enhance transition services for all MCE inmate workers.
Strategy #: 5.1.2.1 Identify business and community partners as resources for inmate workers upon release.
Performance Measures Identify five business partners.
Chairperson Director of Re-Entry Services
Members Chief Executive Officer, Chief Development Officer, Chief Operating Officer, Executive Director of the Management Council
Summary of Strategy Results
1. New Strategy for FY2016 developed during the MFR Seminar on May 19, 2015.
Strategy #: 5.1.2.2 Explore options regarding economic strategies for inmates upon release.
Performance Measures Assess the economic needs of the re-entering inmate population.
Chairperson Director of Re-Entry Services
Members Chief Executive Officer, Chief Development Officer, Chief Operating Officer, Executive Director of the Management Council
Summary of Strategy Results
1. New Strategy for FY2016 developed during the MFR Seminar on May 19, 2015.