Embed Size (px)
Citation preview

impact evaluationscounterfactual
Design and commissioning of
Social Europe

DESIGN AND COMMISSIONING OF COUNTERFACTUAL IMPACT EVALUATIONS
A Practical Guidance for ESF Managing Authorities
European CommissionDirectorate-General for Employment, Social Affairs and Inclusion
Unit A3Manuscript completed in October 2012

Neither the European Commission nor any person acting on behalf of the Commission may be held responsible for the use that may be made of the information contained in this publication.
ACKNOWLEDGEMENTS
This practical guidance has been produced based on the work of the following experts contracted by the European Commission, DG Employment:
Stephen Morris, NatCen Social Research and Policy Studies Institute, LondonHerta Tödtling-Schönhofer, Metis GmbH, ViennaMichael Wiseman, George Washington Institute of Public Policy
Layout: Alexandru Coca
© Cover photo: www.shutterstock.com, ollyy
For any use or reproduction of photos which are not under European Union copyright, permission must be sought directly from the copyright holder(s).
More information on the European Union is available on the Internet (http://europa.eu).
Cataloguing data as well as an abstract can be found at the end of this publication.
Luxembourg: Publications Office of the European Union, 2013
ISBN 978-92-79-28238-6
doi: 10.2767/94454
© European Union, 2013
Reproduction is authorised provided the source is acknowledged.
Europe Direct is a service to help you find answers to your questions about the European Union
Freephone number (*):
00 800 6 7 8 9 10 11
(*) Certain mobile telephone operators do not allow access to 00 800 numbers or these calls may be billed.

iii
Purpose and background to the guidance 1
Chapter 1: Concept and methods 5
1.1. The essence of the counterfactual 5
1.2. Why are counterfactual evaluations important? 6
1.3. Why are counterfactual evaluations technically challenging? 7
1.4. An overview of CIE designs and approaches 8
1.4.1 Randomisation - the experimental approach 9
1.4.2 Non-randomised or quasi-experimental designs 12
1.5. How CIE can be embedded in a wider evaluation framework 26
Chapter 2: Practical considerations in preparing a CIE 33
2.1. Selecting interventions for impact evaluation 34
2.1.1. Choosing interventions to prioritise for impact evaluation 36
2.1.2. Selecting interventions that are amenable to a counterfactual approach 37
2.1.3. Are the appropriate data available or can they be made available? 43
2.2. Developing an evaluation scheme 47
Contents

iv
2.2.1. What are the aims and objectives of the intervention? 49
2.2.2. What is the purpose of the evaluation? 49
2.2.3. What resources are available? 52
2.2.4. When should the intervention be evaluated? 54
2.9.1. How is the ‘treated’ group to be identified? 57
2.9.2. What factors need to be considered in identifying a control group 58
2.9.3. What kinds of data issues need to be raised in the evaluation scheme? 62
2.9.4. What are the key constraints in analysing data and results? 63
2.10.1. How will the results be reported? 66
Chapter 3: Moving the CIE agenda forward 67
3.1. Improving levels of understanding among stakeholders 67
3.2. Capacity development 68
3.3. Confronting legal barriers 70
3.4. Moving toward more prospective approaches 71
Glossaries 73
4.1. Acronyms 73
4.2. Definitions 75
Bibliography 79
Annexes 83
Annex 1. Further readings 83
Annex 2. UK Treasury guidelines for expenditure on evaluation 86
Annex 3. Suggested CIE course outline 87
Annex 4. Counterfactual Impact Evaluations-Examples provided by Member States 88
v
List of figures
Figure 1. Two-group randomised control trial design ...................................................................... 10
Figure 2. Stylised quasi-experimental design with treatment and control groups ............. 13
Figure 3. Illustration of the prospensity score approach ................................................................ 14
Figure 4. Illustration of difference-in-differences approach ........................................................ 17
Figure 5. Illustration of the regression discontinuity approach ................................................... 18
Figure 6. Illustration of an instrumental variables approach ....................................................... 22
List of Boxes
Box 1. An example of a randomised trial of an active labour market policy ................... 11
Box 2. An example of an evaluation adopting a matching approach .................................. 16
Box 3. An example of an evaluation adopting a form of difference-in-differences ..... 19
Box 4. An example of an evaluation adopting a regression discontinuity approach .... 21
Box 5. An example of a study adopting an instrumental variables approach ................. 23
Box 6. Questions for selecting interventions for a CIE ............................................................... 35
Box 7. Motivations for conducting CIE ................................................................................................ 38
Box 8. Most common types of interventions and target groups chosen for ESF CIEs . 39
Box 9. Defining control groups ............................................................................................................... 42
Box 10. Examples of data used for CIEs .............................................................................................. 45
Box 11. Data protection and exchange - the experience of Lithuania ................................... 47
Box 12. Recommended content of an evaluation scheme ........................................................... 48
Box 13. CIE evaluation being embedded in a wider framework ............................................... 48
Box 14. Policy questions related to a training programme ......................................................... 61
Box 15. Interpreting net effects ............................................................................................................... 61
Box 16. Uncertainties in interpreting the results ............................................................................. 65
vi
Figure 7. Different tasks and types of evaluation .............................................................................. 27
Figure 8. Illustration of the logic model approach............................................................................. 28
Figure 9. Simplified timeline for results of a training programme ............................................. 56
Figure 10. Minimum detectable effects sizes at different sample sizes..................................... 64
List of tables
Table 1. Comparison of some key features of main CIE approaches ...................................... 26
Table 2. Data types and sources .............................................................................................................. 46

1
As the European Union approaches the next seven-year programming period for the European Social Fund (ESF), budgets are tighter and concern about the effective use of funds has grown. In addition, evaluations of ESF programmes and interventions have proven challenging and have in many cases not allowed policy-makers to draw evidence-based conclusions regarding their effectiveness and efficiency. Accordingly, the European Commission (EC) is encouraging Member States (MS) to increase efforts to develop credible evidence of ESF effects beyond what would have been achieved in the absence of ESF support. Such evidence requires counterfactual impact evaluations (CIEs) - comparison of results to estimates of what would have occurred otherwise. This guidance provides practical advice on some of the key questions that need to be considered in developing plans for CIEs. The guidance is intended for Managing Authorities (MA) and other bodies responsible for the implementation of ESF-funded interventions and programmes. The aim is to aid the design and commissioning of CIEs. The focus is on practicalities, though through necessity some technical issues are discussed.
CIEs address the crucial question of causal inference and of ‘what works?’ They seek evidence of whether ESF-financed interventions actually cause the changes in participants’ circumstances and accomplishments that are their intended consequences. When done well, CIEs provide evidence of the net effect, or impact, of an intervention, and enable policymakers to rule out alternative explanations for changes in circumstances or accomplishments that might be observed. They also provide estimates of the sign and magnitude of the net effect and a measure of uncertainty around this estimate. The type of evidence provided by CIEs enables policymakers to assess the effectiveness of interventions, and moreover, make comparisons between interventions and assess their relative performance. Evidence from CIEs provides important inputs into cost-benefit or cost-effectiveness analysis.
This guidance is published at a time of unprecedented strain on public funds. Given this context, it is critical that policymakers understand the effects of the interventions they are responsible for. Interventions absorb public funds
CIE address ‘what works?’
Introduction
Purpose and background to the guidance

2
Practical guidance for CIEs
that could be put to alternative, productive uses. Therefore it is incumbent upon those responsible for disbursing ESF resources to justify the continued receipt of ESF money through showing that their interventions work and provide value for citizens. An important way this goal can be achieved is through conducting more and better CIEs.
The ESF is the main European instrument to support employment and social inclusion. In the current programming period 2007 - 2013, the ESF is spending nearly € 76.5 billion on active labour market policies implemented through operational programmes (OP) in the 27 Member States. As stipulated by the General Regulation 1083/2006, evaluations ‘shall aim to improve the quality, effectiveness, and consistency of the assistance from the Funds and the strategy and implementation of the operational programmes’.
In the programming period 2014 – 2020, performance and results will receive increased attention.1 This will require a review of current monitoring and evaluation systems and capacities, including data collection arrangements. Moreover, evaluation plans will become obligatory, and more emphasis is to be placed on impact evaluation. As a variety of methods are available to capture the impacts of ESF supported interventions, it is for the managing authorities to decide which one, or which combination of methods, is most suitable in satisfying the regulatory requirements. A rigorous quantification of impacts of interventions involves counterfactuals.
This shift in focus towards a stronger performance and result orientation is important. High-quality evaluation strategies and techniques are essential for generating knowledge useful to all MS about which interventions ‘work’ and which do not. Strengthening the quality of evaluations and developing reliable evidence of value added is essential.
In principle, the starting point for building evidence on the effectiveness of policy interventions is simple. The requirements include:
• Identification of the problem to be addressed
• Identification of the instruments to be employed to address the problem
• A theory connecting the instruments and results.
In order to evaluate a funding scheme or instrument it is necessary, at a bare minimum, to have clear and measurable indicators of both the inputs applied and problem-related outputs and results. It is common to set targets for both outputs and results, and to compare actual achievements to targets. Monitoring is employed to track inputs and results over time and provide management feedback. The underlying intervention theory often points to intermediate results that may also become the focus of monitoring.
1 Proposal for a Regulation of the European Parliament and of the Council laying down common provisions on the ERDF, ESF, CF, EAFRD and the EMFF covered by the Common Strategic Framework and laying down general provisions on the ERDF, ESF and CF and repealing Regulation (EC) No 1083/2006; COM (2011) 615 final
The need for results
3
Introduction: Purpose and background to the guidance
But getting from this starting point to evidence of whether a particular intervention works is not easy.
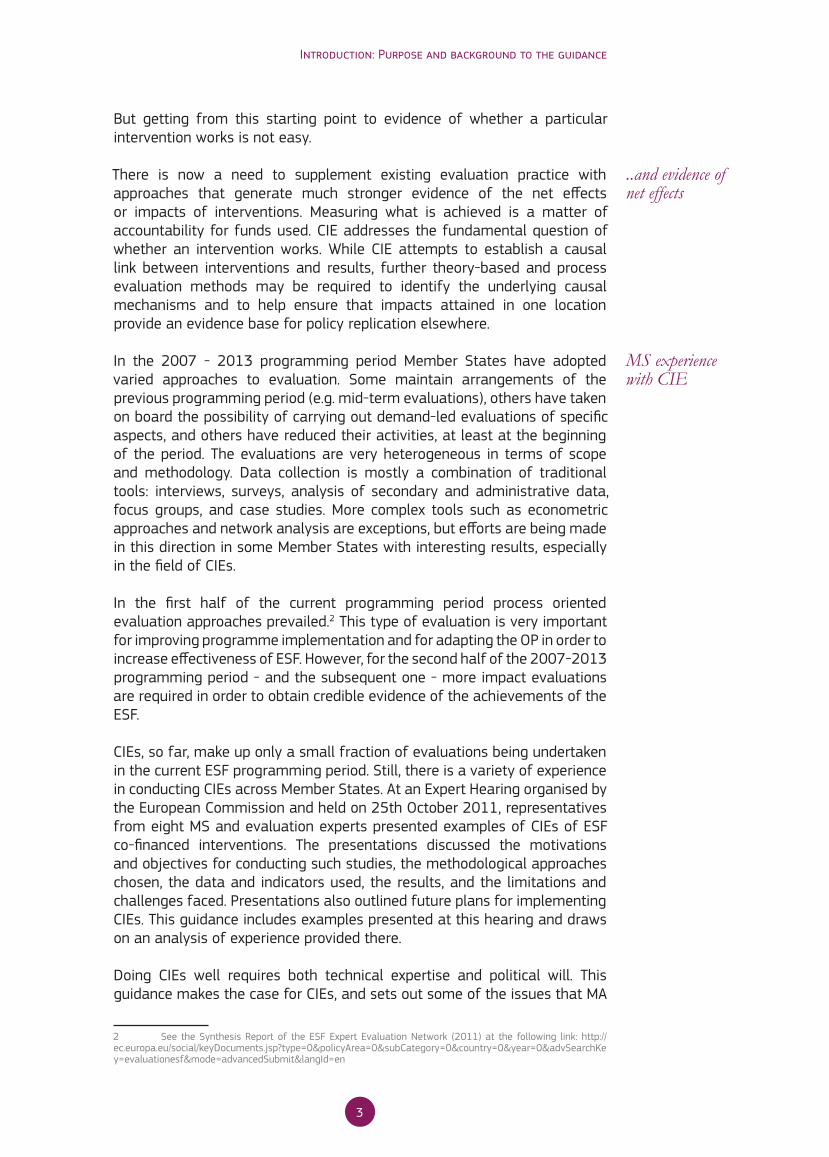
There is now a need to supplement existing evaluation practice with approaches that generate much stronger evidence of the net effects or impacts of interventions. Measuring what is achieved is a matter of accountability for funds used. CIE addresses the fundamental question of whether an intervention works. While CIE attempts to establish a causal link between interventions and results, further theory-based and process evaluation methods may be required to identify the underlying causal mechanisms and to help ensure that impacts attained in one location provide an evidence base for policy replication elsewhere.
In the 2007 - 2013 programming period Member States have adopted varied approaches to evaluation. Some maintain arrangements of the previous programming period (e.g. mid-term evaluations), others have taken on board the possibility of carrying out demand-led evaluations of specific aspects, and others have reduced their activities, at least at the beginning of the period. The evaluations are very heterogeneous in terms of scope and methodology. Data collection is mostly a combination of traditional tools: interviews, surveys, analysis of secondary and administrative data, focus groups, and case studies. More complex tools such as econometric approaches and network analysis are exceptions, but efforts are being made in this direction in some Member States with interesting results, especially in the field of CIEs.
In the first half of the current programming period process oriented evaluation approaches prevailed.2 This type of evaluation is very important for improving programme implementation and for adapting the OP in order to increase effectiveness of ESF. However, for the second half of the 2007-2013 programming period - and the subsequent one - more impact evaluations are required in order to obtain credible evidence of the achievements of the ESF.
CIEs, so far, make up only a small fraction of evaluations being undertaken in the current ESF programming period. Still, there is a variety of experience in conducting CIEs across Member States. At an Expert Hearing organised by the European Commission and held on 25th October 2011, representatives from eight MS and evaluation experts presented examples of CIEs of ESF co-financed interventions. The presentations discussed the motivations and objectives for conducting such studies, the methodological approaches chosen, the data and indicators used, the results, and the limitations and challenges faced. Presentations also outlined future plans for implementing CIEs. This guidance includes examples presented at this hearing and draws on an analysis of experience provided there.
Doing CIEs well requires both technical expertise and political will. This guidance makes the case for CIEs, and sets out some of the issues that MA
2 See the Synthesis Report of the ESF Expert Evaluation Network (2011) at the following link: http://ec.europa.eu/social/keyDocuments.jsp?type=0&policyArea=0&subCategory=0&country=0&year=0&advSearchKey=evaluationesf&mode=advancedSubmit&langId=en
..and evidence of net effects
MS experience with CIE

4
Practical guidance for CIEs
need to address if their conduct is to be successful. Beyond the practical aspects of CIE, attention is paid to wider issues that may need to be addressed to facilitate better impact evaluation.
The guidance is structured in three sections.
The first chapter discusses the nature of CIEs and why they are important. It provides an overview of CIE methods, emphasising the critical distinction between experimental and quasi-experimental approaches. Further consideration is given, in general terms, to the types of policy questions that might be addressed through the application of CIEs and the relationship between CIE methods and other approaches to evaluation (for example: theory-based approaches, process evaluation and efficiency analysis).
The second chapter presents a series of questions to be considered by MA in designing CIEs. This guidance sets out some of the key challenges that are commonly confronted in developing CIEs and makes some recommendations as to how such challenges might be addressed. The questions considered seek to guide those aiming to commission CIEs of ESF-financed interventions before planning and commissioning an evaluation. However, this guide does not attempt to second-guess the specific requirements and plans that will need to be tailored to the often unique circumstances MA, intermediate bodies and evaluators will face with each evaluation commissioned.
CIEs provide high quality evidence of the effectiveness of funds. They only do so, however, if they are well planned and executed appropriately. In order for this to be achieved, it is essential that MA have addressed certain key issues prior to commissioning an evaluation. The precise manner in which MA consider these issues and the order in which they do so, will be dictated by practicalities and institutional arrangements on-the-ground within Member States. This guide merely seeks to highlight some of these important issues and draw them to the attention of MA.
The third chapter addresses wider issues of reform. These include the need to develop capacity to conduct CIEs successfully, both within MA (policy makers and officials) and among MS’s research and academic communities. This section also addresses the need to confront legal barriers around data sharing and encourages a move toward more prospective evaluation designs.
In sum, this guidance: 1) makes the case for CIEs, 2) identifies the important steps along the path toward successful conduct of CIEs and 3) moves beyond details to making CIEs an essential part of the ESF landscape. The ultimate objective is to enhance the contribution of the ESF to the well-being of Europe’s citizens.
Guidance for practitioners

5
Chapter 1
Concept and methods
This chapter addresses fundamental questions about the nature of counterfactual approaches and their purpose. Specifically, it sets out an understanding of the essence of the counterfactual approach, particularly as it relates to the types of interventions co-financed through ESF. It also examines the relationship between counterfactual approaches and other evaluation methodologies and discusses why CIEs are important - particularly at the present time. The policy questions that CIEs can be used to address are examined, and a brief, simplified, overview of some of the main approaches relevant to evaluating ESF co-financed interventions are presented.
1.1. The essence of the counterfactualCIEs seek to identify net effects or impacts of interventions. Their distinctive feature is that they aim to support claims that interventions cause results through ruling out explanations, other than the effects of the intervention under consideration, for the results observed.
Underlying their capacity to rule out alternative explanations is the idea of the ‘counterfactual’. To understand clearly the concept of the counterfactual, and put very simply to clarify the issues, it is helpful to consider the example of an unemployed individual participating in a training programme, the aim of which is to encourage employment. In order to determine the effect of training on the individual, the counterfactual approach conceives of two potential results.3 The first result is the trainee’s employment status subsequent to having taken part in training. This is the observed result for the trainee. The second potential result is this trainee’s employment status had he or she not taken part in the training programme, all else being equal. In these circumstances this second result is referred to as the counterfactual result. The impact of training for the individual trainee is simply the difference between the observed and counterfactual results. This is the causal effect or impact of the training for the individual. The
3 A more detailed discussion of the ‘potential outcomes’ model of causation can be found in Holland, P. (1986) Statistics and causal inference, Journal of American Statistical Association, 81, 945-970
The counterfactual
6
Practical guidance for CIEs
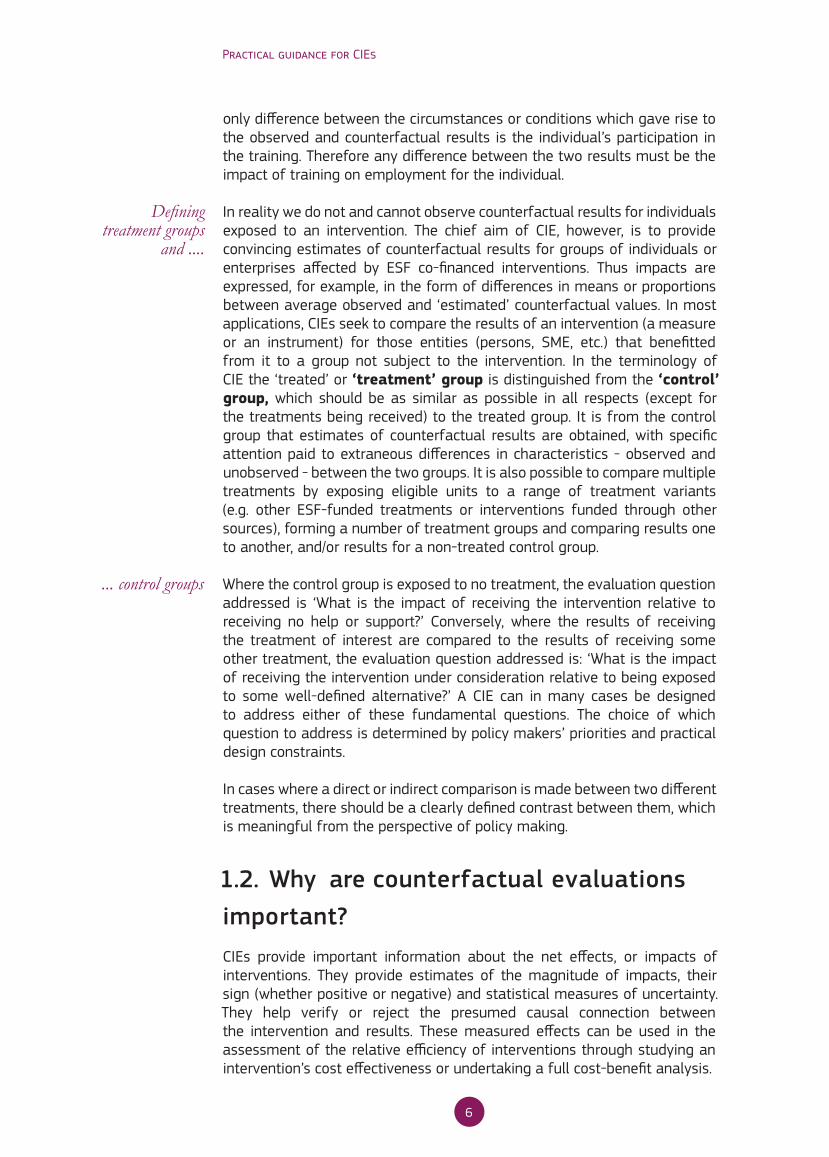
only difference between the circumstances or conditions which gave rise to the observed and counterfactual results is the individual’s participation in the training. Therefore any difference between the two results must be the impact of training on employment for the individual.
In reality we do not and cannot observe counterfactual results for individuals exposed to an intervention. The chief aim of CIE, however, is to provide convincing estimates of counterfactual results for groups of individuals or enterprises affected by ESF co-financed interventions. Thus impacts are expressed, for example, in the form of differences in means or proportions between average observed and ‘estimated’ counterfactual values. In most applications, CIEs seek to compare the results of an intervention (a measure or an instrument) for those entities (persons, SME, etc.) that benefitted from it to a group not subject to the intervention. In the terminology of CIE the ‘treated’ or ‘treatment’ group is distinguished from the ‘control’ group, which should be as similar as possible in all respects (except for the treatments being received) to the treated group. It is from the control group that estimates of counterfactual results are obtained, with specific attention paid to extraneous differences in characteristics - observed and unobserved - between the two groups. It is also possible to compare multiple treatments by exposing eligible units to a range of treatment variants (e.g. other ESF-funded treatments or interventions funded through other sources), forming a number of treatment groups and comparing results one to another, and/or results for a non-treated control group.
Where the control group is exposed to no treatment, the evaluation question addressed is ‘What is the impact of receiving the intervention relative to receiving no help or support?’ Conversely, where the results of receiving the treatment of interest are compared to the results of receiving some other treatment, the evaluation question addressed is: ‘What is the impact of receiving the intervention under consideration relative to being exposed to some well-defined alternative?’ A CIE can in many cases be designed to address either of these fundamental questions. The choice of which question to address is determined by policy makers’ priorities and practical design constraints.
In cases where a direct or indirect comparison is made between two different treatments, there should be a clearly defined contrast between them, which is meaningful from the perspective of policy making.
1.2. Why are counterfactual evaluations important?CIEs provide important information about the net effects, or impacts of interventions. They provide estimates of the magnitude of impacts, their sign (whether positive or negative) and statistical measures of uncertainty. They help verify or reject the presumed causal connection between the intervention and results. These measured effects can be used in the assessment of the relative efficiency of interventions through studying an intervention’s cost effectiveness or undertaking a full cost-benefit analysis.
Defining treatment groups
and ....
... control groups
7
Chapter 1: Concepts and methods
These features of CIEs mean they provide important information to policy makers whose task is to allocate resources to different interventions. Decisions regarding the funding of potential interventions take place within a context of resource limits. Increasingly, resource allocation decisions are being made against a backdrop of fiscal austerity. In this context, decision makers need sound evidence of programme impacts and cost effectiveness so they can use the available resources optimally.
Those responsible for interventions and concerned with ensuring their programmes continue to attract funding will have a keen interest in promoting CIEs in order to show that their programmes provide value for money and yield measureable benefits to participants, as well as to society as a whole. Evidence from CIEs will be of particular interest to those responsible for resource allocation. MA will be eager to show that their programmes indeed ‘work’. To do this convincingly, they will need to commission high-quality CIEs.
1.3. Why are counterfactual evaluations technically challenging?There are a number of approaches that might be described as ‘unreliable’ attempts at estimating intervention impacts. These are discussed here in order to illustrate the complexities inherent in CIEs and no reference is being made to actual evaluation practice.
First, a policymaker may wish to evaluate the impact of a training programme for the unemployed by comparing wages for trainees subsequent to training, to wages for all unemployed persons who did not participate. The policymaker then attributes to the training programme the difference in wages between participants and non-participants.
This is not a valid strategy for identifying the impact of training on wages because non-trainees may differ in important ways to trainees, and these differences may influence results - they frustrate the ability to rule out alternative explanations for any differences in wages observed. For example, trainees may have greater inherent ability than non-trainees. In other words, unemployed persons of greater ability select themselves into, or decide to participate in the training programme. Thus ability affects the decision to participate but also results - unemployed persons with higher levels of inherent ability are more likely to command a higher wage than those with lower ability.
If ability cannot be measured and differences in inherent ability between the two groups cannot be taken into account in estimating impacts, the estimated impact of the training programme would be said to suffer from selection bias. To counteract this problem, evaluators attempt to collect as much information as possible on important factors that affect the decision to participate and the outcomes that result. These data are employed to select a valid control group from among non-participants and to conduct appropriate statistical analyses. In doing so, evaluators often invoke the assumption that selection into the programme is determined by observable
Supporting resourse allocation decisions
Moving beyond simplistic approaches
Counteract selection bias

8
Practical guidance for CIEs
factors. This ‘identifying assumption’ is always questionable and difficult to test. Judgement is required as to whether such an assumption is plausible on the basis of knowledge of institutional factors and behavioural theory.
A second ‘unreliable’ approach might be for the policy maker to observe wages for trainees before and after training, and attribute the before/after change in wages to the training intervention. In essence, this approach assumes that in the absence of the intervention average wages remain unchanged.
Again, this in almost all cases is not a valid strategy for uncovering the impact of training on wages, unless the assumption of temporal stability can be plausibly invoked. This is because trainees’ wages will inevitably change over time in ways that are completely unrelated to training. For example, it is common to observe that the earnings of trainees dip prior to participation, in part due to transitory factors. In many cases rebound would occur regardless of a training intervention.4 The unreliable approach of gauging the impact of training by the difference between earnings immediately before programme entry and earnings afterward ignores the fact that in many cases earnings would have risen anyway.
To adjust such designs a measure of the counterfactual - that is a measure of how wages would have changed for trainees in the absence of the training intervention - is required. For example, such a counterfactual result can be obtained from a carefully matched control group not exposed to the training intervention and whose wages are observed at the same points in time as trainees. The common trends assumption is then often invoked, which posits that the trend in wages among trainees and the control group would have been the same in the absence of the intervention.
The limits of these ‘unreliable’ approaches motivate the search for more convincing methods of evaluation. As has been suggested above, more convincing methods are, however, more technically challenging to implement. The next section of this chapter provides a brief, simplified, outline discussion of some of the specific approaches to CIE that are likely to be most relevant in an ESF context.
1.4. An overview of CIE designs and approachesWhere interest is in the effects of an intervention on those who participate, counterfactual results are usually estimated using data collected from groups of non-participants who are similar to those participating in the intervention being evaluated. Table 1 at the end of this chapter presents a brief overview of approaches, some of their advantages and limitations and the essential types of data they require.
4 This pattern is famously called the ‘Ashenfelter Dip’ after the economist who first commented on it. See Ashenfelter, O (1978) Estimating the effect of training programmes on earnings, Review of Economics and Statistics, 6, 47-57
Before and after change

9
Chapter 1: Concepts and methods
It is not possible to provide detailed guidance on the choice of the most appropriate evaluation design across what are highly varied circumstances faced by MA. In choosing which approach to CIE is most relevant in a particular set of circumstances, MA should consider what has worked well in previous evaluations both within the MA itself, within the MS and in other MS - MA can learn from what has been achieved before within their programme and from elsewhere where similar circumstances have been faced. Forums for the exchange of lessons learnt in design and implementation of evaluation can be useful sources of information in this regard. Searching the literature for evaluations of similar interventions can also be an important source of information to aid in the design process. Experts commissioned by the MA will also have views as to how best to approach an evaluation design. It is important to remember that there may be considerable expertise and experience within MAs that can be drawn upon.
The main distinction in CIE is between evaluation designs that are experimental and those that are quasi-experimental. The experimental approach is commonly referred to as the ‘randomised control trial’, or RCT, and sometimes also as ‘social experimentation’.
It is the experimental approach that is considered the gold standard among CIE methods, for evaluating the effects of interventions that can be tested and manipulated over relative short time horizons, and represents in most circumstances the ideal. A good impact evaluation design should strive to obtain estimates of counterfactual results that are unbiased. In many applications, an experimental approach can be considered as yielding such unbiased estimates. In discussing approaches to CIE, it is often desirable to start by outlining the experimental approach. This is because quasi-experimental methods essentially seek to mimic the experimental ideal.
In discussing CIE designs, the key features of each approach are set out as simply as possible in order to clarify the underlying principles. In reality, applications of these methods can be considerably more complex, and issues such as non-compliance can add significantly to the challenges faced.
1.4.1 Randomisation - the experimental approach
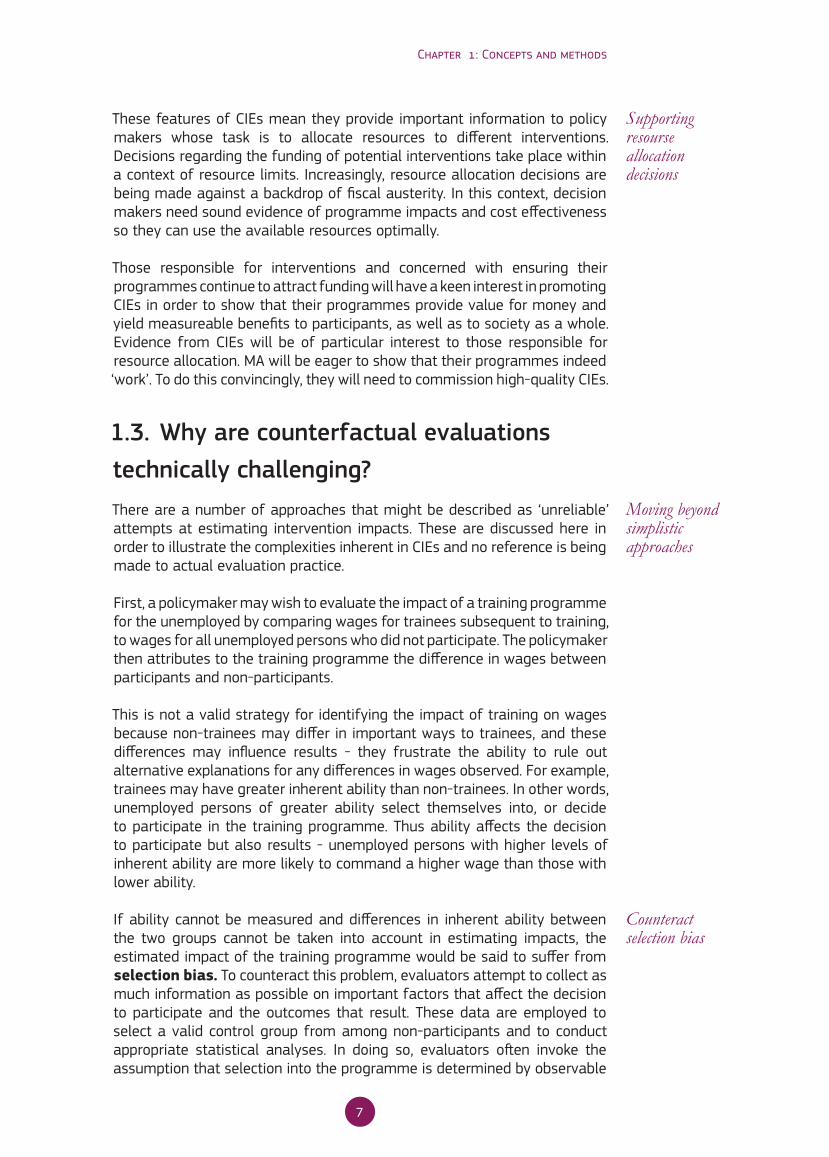
Randomised designs can take many forms. Here the focus is on a straightforward two-group approach in order to clarify the key principles. Figure 1 illustrates a simple randomised design.
The key point is that the randomisation ensures the two groups are statistically equivalent in all respects at the point they are randomised. Subsequent to randomisation, the treatment group is exposed to the intervention which is the focus of the evaluation and whose impacts or effects are to be measured.
Depending on the policy question of central concern, the control group can be assigned to receive no treatment at all, or the treatment group can be compared to a group exposed to some other treatment of interest (may be conceived as representing treatment as usual), or there can be multiple treatment groups alongside a control group. For example, there may be interest in comparing the effects of an ESF-financed training programme to
Selecting the right approach
Randomised design - the golden standard
Statistically equivalent groups
No/other treatment for control groups
10
Practical guidance for CIEs
other nationally-financed training, or to the provision of other services to the same population.
Because treatment and control groups are statistically equivalent at randomisation and exposure to subsequent treatments is controlled, differences in results can be attributed to the intervention being evaluated (subject to standard statistical uncertainties), and alternative explanations ruled out as the causes of any observed differences (see Box 1).
As a result of their intrinsic design features and if implemented correctly, randomised designs offer the prospect of providing strong evidence of an intervention’s effects. They are highly favoured for this reason. However, they require early and detailed planning and are quite complicated to design and administer. Furthermore, programme managers face significant challenges in implementing them correctly. Some have raised ethical and legal objections to their use. Moreover, the presence of the randomisation process itself may alter the composition of those who take-part in an intervention. For example, some potential participants may be put off by the idea of randomisation and refuse to participate. Furthermore, individuals subject to randomisation may not always comply with their assignment status, and there are a range of other challenges that may need to be confronted. In some circumstances randomised control trial designs can be expensive to implement.
For these and other reasons, it may appear unlikely that evaluations of ESF-financed instruments and interventions will be conducted using a randomised approach. However, this guidance cautions against the impulse to rule randomisation out of bounds in all cases without proper consideration. The
Figure 1. Two-group randomised control trial design
Strong evidence but difficult to
design
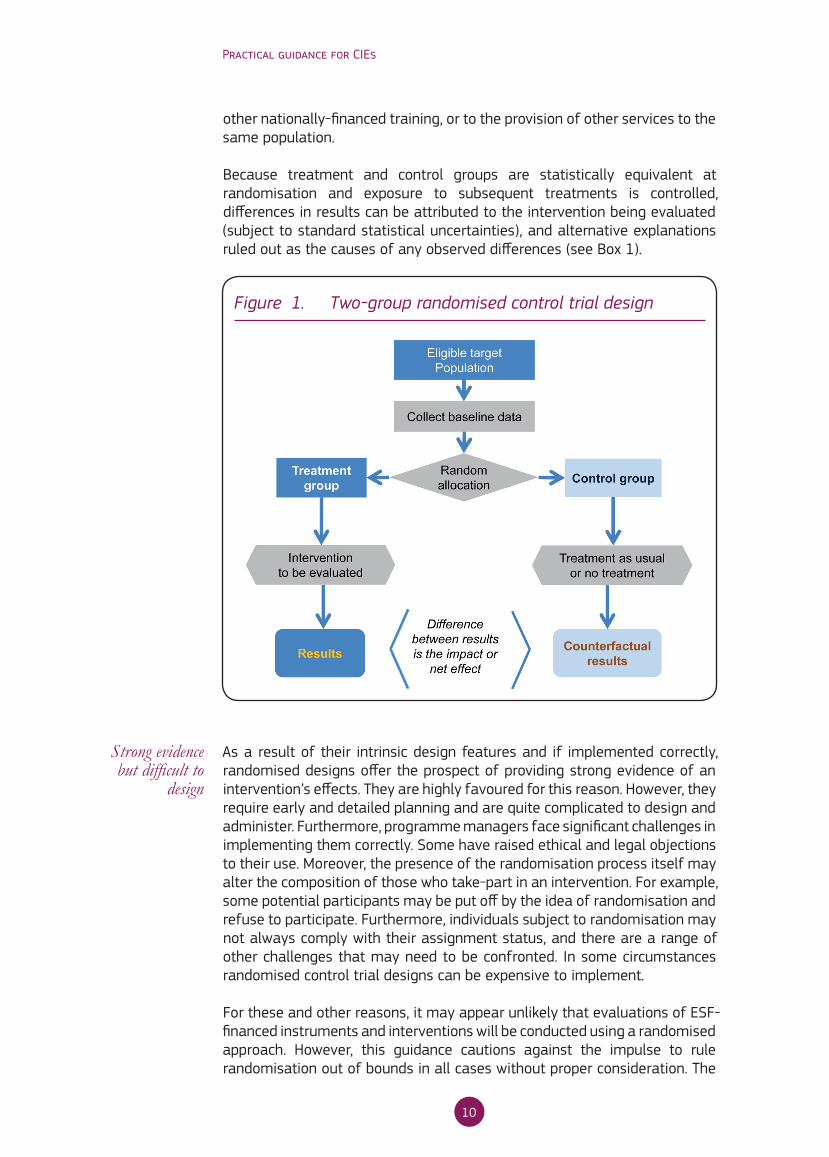
The UK Employment Retention and Advancement Demonstration
The UK Employment Retention and Advancement (ERA) Demonstration project involved testing the effects on the long-term unemployed and economically inactive, of extending help and support, as well as financial incentives, to those who had left welfare and entered work. Thus the ERA project extended the support provided through active labour market policies to low income groups in work.
Those eligible for two of the UK’s major active labour market programmes at the time - the New Deal for the Long-term Unemployed and the New Deal for Lone Parents - were allocated at random to treatment and control groups. The control group entered the New Deal programmes as normal. The treatment group received pre-employment support (in a similar manner to the control group) but continued to receive advice and help on leaving welfare and entering a job. At the time the study ran, help and support for welfare claimants in the UK ended on entry into work. Participants were also eligible for a range of financial support and incentives to encourage training and work retention. The aim was to encourage participants to remain off welfare and advance through improving their earnings and other terms and conditions of employment.
In all some 16,000 individuals were randomly allocated to treatment and control groups across some fifty public employment service offices. The random allocation process produced treatment and control groups that were very similar to one another at the point of allocation. As a result, any differences between the two groups on key result measures such as job entry, earnings, hours and job quality, subsequent to entry into the intervention, could be confidently attributed to the ERA intervention.
Findings from the study show that the intervention was particularly successful among the long-term unemployed, raising both their levels of employment and earnings. 1
(1) Interested readers can find out more about this evaluation here:http://statistics.dwp.gov.uk/asd/asd5/rports2011-2012/rrep765.pdf
Box 1. An example of a randomised trial of an active labour market policy
11
Chapter 1: Concepts and methods
approach has been widely used and examples additional to that from the UK discussed at Box 1 include the GAIN experiments from the United States 5 (there are numerous other examples from North America), experiments conducted in Sweden6 as well as a study undertaken in Germany to assess the effects of active labour market services supplied by private providers
5 See Riccio J, Friedlander, D. And Freedman S. (1994) GAIN: Benefits, Costs, and Three-Year Impacts of a Welfare-to-Work Program, MDRC, NYC http://www.mdrc.org/publications/175/full.pdf
6 See Hagglund, P (2006) A description of three randomised experiments in Swedish labour market policy, Institute for Labour Market Policy Evaluation, Report 2006: 4, http://ifauweb.webhotel.qd.se/Upload/pdf/se/2006/r06-04.pdf
other nationally-financed training, or to the provision of other services to the same population.
Because treatment and control groups are statistically equivalent at randomisation and exposure to subsequent treatments is controlled, differences in results can be attributed to the intervention being evaluated (subject to standard statistical uncertainties), and alternative explanations ruled out as the causes of any observed differences (see Box 1).
As a result of their intrinsic design features and if implemented correctly, randomised designs offer the prospect of providing strong evidence of an intervention’s effects. They are highly favoured for this reason. However, they require early and detailed planning and are quite complicated to design and administer. Furthermore, programme managers face significant challenges in implementing them correctly. Some have raised ethical and legal objections to their use. Moreover, the presence of the randomisation process itself may alter the composition of those who take-part in an intervention. For example, some potential participants may be put off by the idea of randomisation and refuse to participate. Furthermore, individuals subject to randomisation may not always comply with their assignment status, and there are a range of other challenges that may need to be confronted. In some circumstances randomised control trial designs can be expensive to implement.
For these and other reasons, it may appear unlikely that evaluations of ESF-financed instruments and interventions will be conducted using a randomised approach. However, this guidance cautions against the impulse to rule randomisation out of bounds in all cases without proper consideration. The
Figure 1. Two-group randomised control trial design
Strong evidence but difficult to
design
The UK Employment Retention and Advancement Demonstration
The UK Employment Retention and Advancement (ERA) Demonstration project involved testing the effects on the long-term unemployed and economically inactive, of extending help and support, as well as financial incentives, to those who had left welfare and entered work. Thus the ERA project extended the support provided through active labour market policies to low income groups in work.
Those eligible for two of the UK’s major active labour market programmes at the time - the New Deal for the Long-term Unemployed and the New Deal for Lone Parents - were allocated at random to treatment and control groups. The control group entered the New Deal programmes as normal. The treatment group received pre-employment support (in a similar manner to the control group) but continued to receive advice and help on leaving welfare and entering a job. At the time the study ran, help and support for welfare claimants in the UK ended on entry into work. Participants were also eligible for a range of financial support and incentives to encourage training and work retention. The aim was to encourage participants to remain off welfare and advance through improving their earnings and other terms and conditions of employment.
In all some 16,000 individuals were randomly allocated to treatment and control groups across some fifty public employment service offices. The random allocation process produced treatment and control groups that were very similar to one another at the point of allocation. As a result, any differences between the two groups on key result measures such as job entry, earnings, hours and job quality, subsequent to entry into the intervention, could be confidently attributed to the ERA intervention.
Findings from the study show that the intervention was particularly successful among the long-term unemployed, raising both their levels of employment and earnings. 1
(1) Interested readers can find out more about this evaluation here:http://statistics.dwp.gov.uk/asd/asd5/rports2011-2012/rrep765.pdf
Box 1. An example of a randomised trial of an active labour market policy

12
Practical guidance for CIEs
compared to those supplied through the public employment service7 , among many others.
Randomised designs can be chiefly distinguished from other approaches through their strong emphasis on controlling bias through research design. This heavy emphasis on design requires advanced planning. Randomised designs are often best implemented in evaluating new pilot interventions rather than existing ones. This is because they require some control over how participants are recruited into the intervention being evaluated. This ‘control’ is often harder to achieve in existing programmes than in new interventions that are open to influence.
As has been made clear, implementing a randomised design requires that a fraction of the eligible target group is diverted away from the intervention to form a control group. This diversion takes place at random and is not at the behest of either the applicant or the intervention’s administrators. For this reason, policy makers often object to RCTs on ethical grounds before considering whether they are feasible from practical and analytical perspectives.
However, there is a strong case to be made for randomised designs. If randomisation provides the best quality, most reliable evidence of the effectiveness of publicly funded interventions, then it is important they are used more widely in assessing intervention impacts. Further still, if the impacts of a certain intervention are a priori unknown, it is not unethical to exclude individuals as we cannot assume that they would have benefited. Moreover, such approaches are used widely in medicine and in other fields of study such as, increasingly, education research. Finally, in some circumstances where the services and support provided by an intervention are over-subscribed, assigning individuals to the intervention at random from among the pool of those who qualify may be the most ethical means of allocating scarce resources.
1.4.2 Non-randomised or quasi-experimental designs
There are a wide range of approaches that essentially seek to mimic randomisation. These are referred to as being quasi-experimental. It is not possible to review them all within the confines of this guidance, or to provide a complete, detailed technical account of each one. However, in broad terms the quasi-experimental methodologies most likely to be implemented in the context of the ESF are presented: 1. propensity score matching; 2. difference-in-differences; 3. regression discontinuity; 4. instrumental variables. Their presentation is highly simplified in order to draw out the key principles of each approach. An overview of major approaches and their relative merits is provided in Table 1 at the end of this section. Further readings on quasi-experimental methodologies are presented in Annex 1.
In quasi-experimental designs, target groups receiving the intervention are compared to a control group of non-randomly allocated targets or potential
7 See Krug, G and Stephan, G. (2011) Is contracting-out intensified placement services more effective than in-house production? Evidence from a randomized field experiment, LASER Discussion Papers - Paper No. 5 http://doku.iab.de/externe/2011/k110912303.pdf
Randomisation through research
design
Ethical objections
...but also strong arguments for
using randomised design
Target and control groups
without randomisation
13
Chapter 1: Concepts and methods
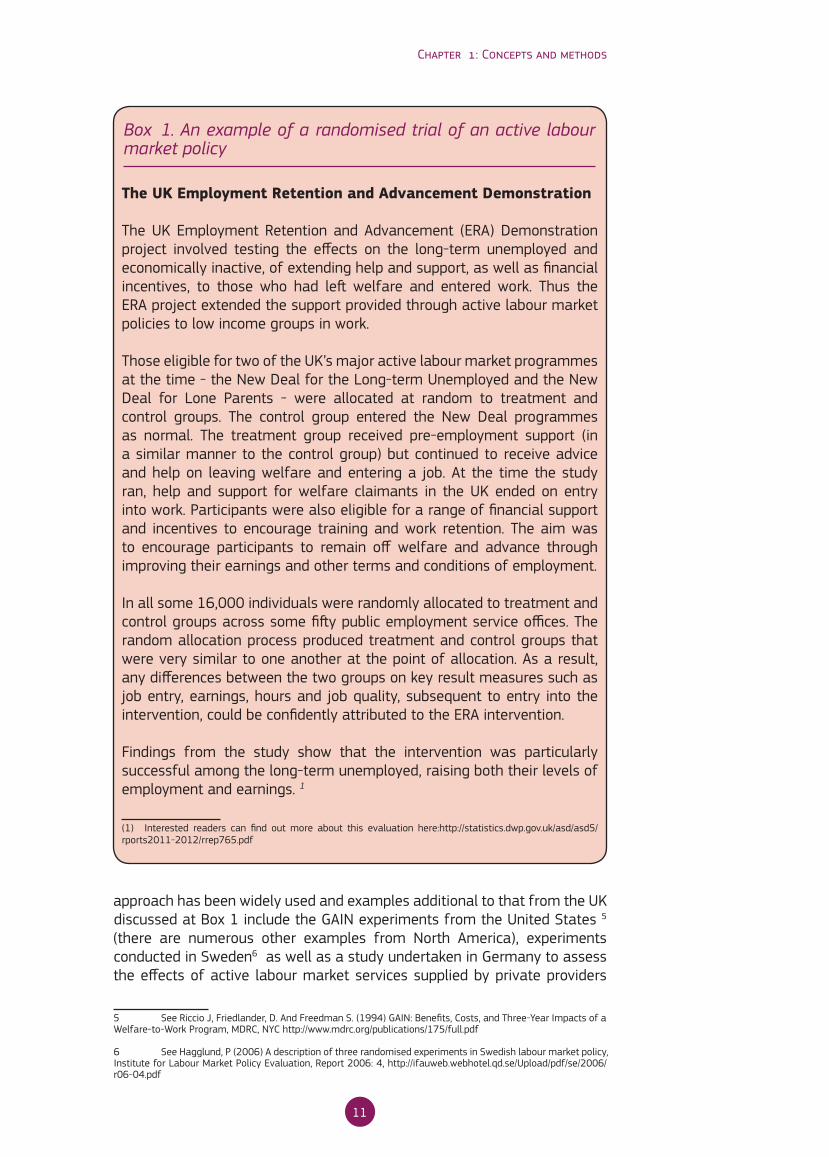
targets that do not receive the intervention. As with an experiment, the objective is to obtain an unbiased estimate of the change the intervention under consideration has brought about. Because treatment and control groups are not formed at random, quasi-experimental designs require far more attention to methods accounting for potential differences between treatment group members and potential controls that are likely to affect the decision to participate and results. Key is the selection of a plausible control group. Failure to select an adequate control group and account for remaining differences between the two groups in the analysis weakens the credibility of estimates and can confound attempts to rule out alternative explanations for any observed effects.
In terms of ESF co-financed interventions, the quasi-experimental evaluation design implemented most frequently will be a two group, baseline/follow-up design. Such designs feature a control group and a treatment group as in the case of randomisation, except that the control group is selected (without the use of randomisation) from existing non-participant groups such that it is as similar as possible to the treated group.
An important possible strategy for finding a valid control group within a quasi-experimental setting is to select controls that have been excluded from the treatment on the basis of factors un-related to their characteristics and potential results. In some circumstances there may be reason to
Figure 2. Stylised quasi-experimental design with treatment and control groups
Control and treatment groups need to be similar to each other
14
Practical guidance for CIEs
believe that although control groups have not been constructed explicitly at random, individuals or enterprises can be found ex-post whose exclusion from the treatment turns out to be random with respect to potential results
- if these circumstances materialise, they are close to ideal within the context of a quasi-experimental approach. For example, certain members of an intervention’s target group may be excluded from participation in the intervention as a result of administrative oversight or error. Understanding the process of selection into the treatment is extremely important in drawing a valid control group - this cannot be emphasised enough.
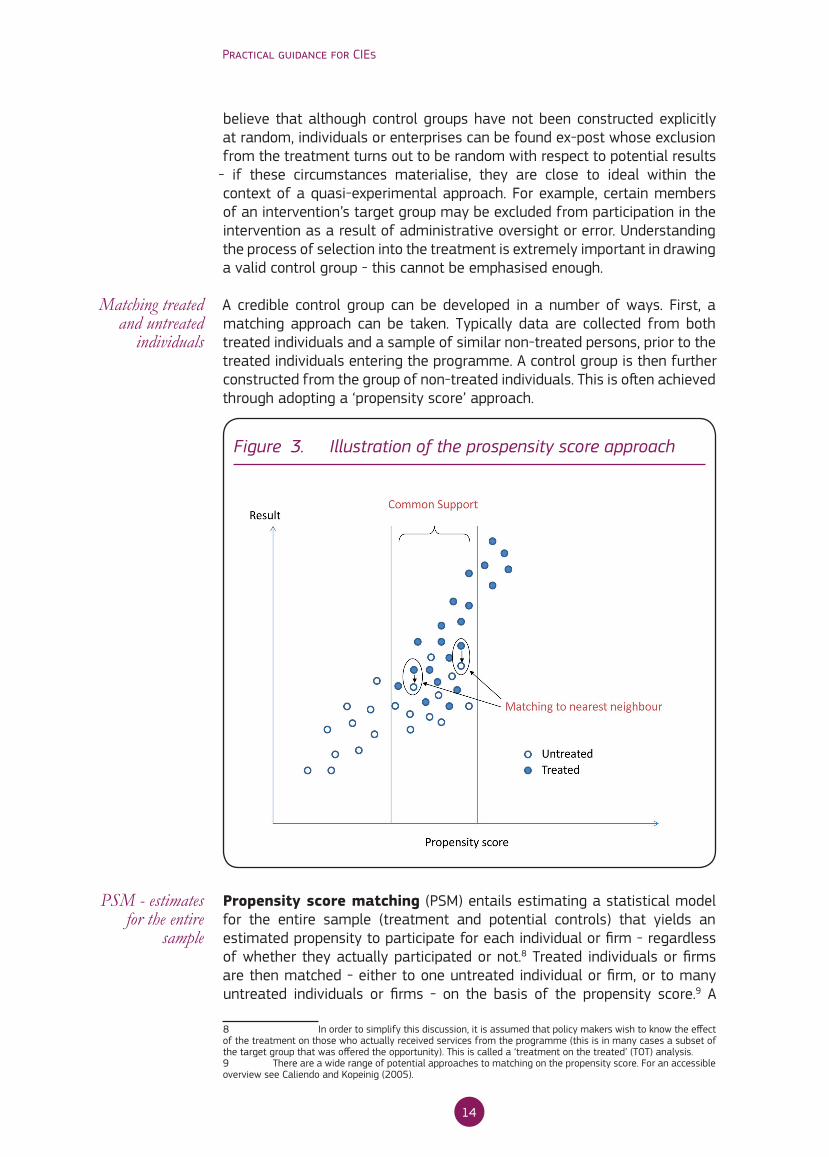
A credible control group can be developed in a number of ways. First, a matching approach can be taken. Typically data are collected from both treated individuals and a sample of similar non-treated persons, prior to the treated individuals entering the programme. A control group is then further constructed from the group of non-treated individuals. This is often achieved through adopting a ‘propensity score’ approach.
Propensity score matching (PSM) entails estimating a statistical model for the entire sample (treatment and potential controls) that yields an estimated propensity to participate for each individual or firm - regardless of whether they actually participated or not.8 Treated individuals or firms are then matched - either to one untreated individual or firm, or to many untreated individuals or firms - on the basis of the propensity score.9 A
8 In order to simplify this discussion, it is assumed that policy makers wish to know the effect of the treatment on those who actually received services from the programme (this is in many cases a subset of the target group that was offered the opportunity). This is called a ‘treatment on the treated’ (TOT) analysis.9 There are a wide range of potential approaches to matching on the propensity score. For an accessible overview see Caliendo and Kopeinig (2005).
Matching treated and untreated
individuals
Figure 3. Illustration of the prospensity score approach
PSM - estimates for the entire
sample

15
Chapter 1: Concepts and methods
control group identified in such a manner can subsequently be used to derive an estimate of the counterfactual. Matching in this way ensures that impact estimates take account of the observable differences between the treated group and those acting as controls, and thus under certain assumptions, an unbiased estimate of intervention effects can be obtained. However, if selection into treatment is based on unobserved factors there will remain a question mark over the adequacy of matching in terms of its capacity to control for bias. The critical assumption underlying the matching approach is that the selection process can be characterised by the observable data.
Figure 3 presents an intuitive and simplified illustration of the propensity score matching approach. The Y axis represents the result. The X-axis the propensity score. The figure depicts treated and untreated units. The region over which the propensity scores for the two groups overlap is known as the region of common support.10 Treated cases are matched to untreated cases within this region. Two examples are given in the diagram, but the process is essentially repeated until every treated case is matched to an untreated case within the region of common support. In the figure this is done using ‘nearest-neighbour’ matching. The ‘nearest neighbour’ to any member of the treatment group is the control group observation with the closest propensity score. Once two groups have been formed, mean results can be compared in order to obtain an estimate of impact. In practice, carrying out propensity score matching can become a highly complex process with a range of issues to consider. Many of these issues are ignored here in order to ensure the key principles are clear. A practical example, where an ESF evaluation used a matching approach is presented in Box 2.
The plausibility of the propensity score approach rests on the assumption, among others, that selection into treatment can be fully characterised by the observable data. In other words, that there are no unobserved differences between treatment and control groups that are related to results and the decision to participate in the intervention. The plausibility of this assumption is enhanced by incorporation of a rich range of variables into the estimation of propensity scores, the selection of variables being based on prior knowledge and theory.
Either separately or in conjunction with matching, baseline (or pre-treatment) measures of result variables can be used to conduct difference-in-differences (DiD) estimation. Here, the difference in a result before and after treatment in a control group is subtracted from the same difference observed among a treated group in order to obtain an estimate of an intervention’s impact. Again, selection of a plausible control group is essential. Impacts calculated on the basis of difference-in-differences are usually derived within a regression framework that also accounts for other observed differences between treatment and control groups. Moreover, this approach controls for unobserved differences between the two groups which are fixed over time as well as differences which vary through time but which affect both control and treatment groups equally (for example economy wide factors) . Because of this capability to control for some aspects of unobserved differences between treatment and controls, in most cases a difference-in-
10 The extent of the region of common support has implications for sample size and the usefulness of results to policy, particularly where a large number of treated cases fall outside the region of common support.
Selection based on observable data
Difference-in-differences
16
Practical guidance for CIEs
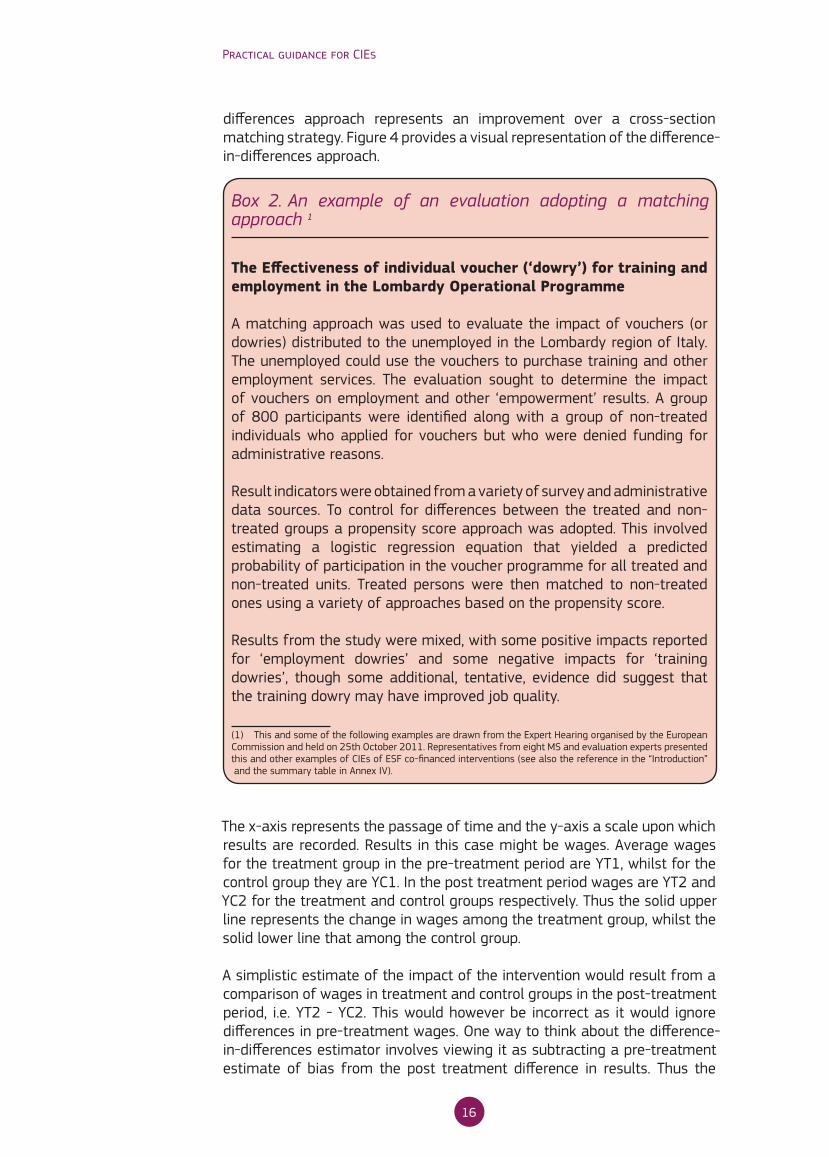
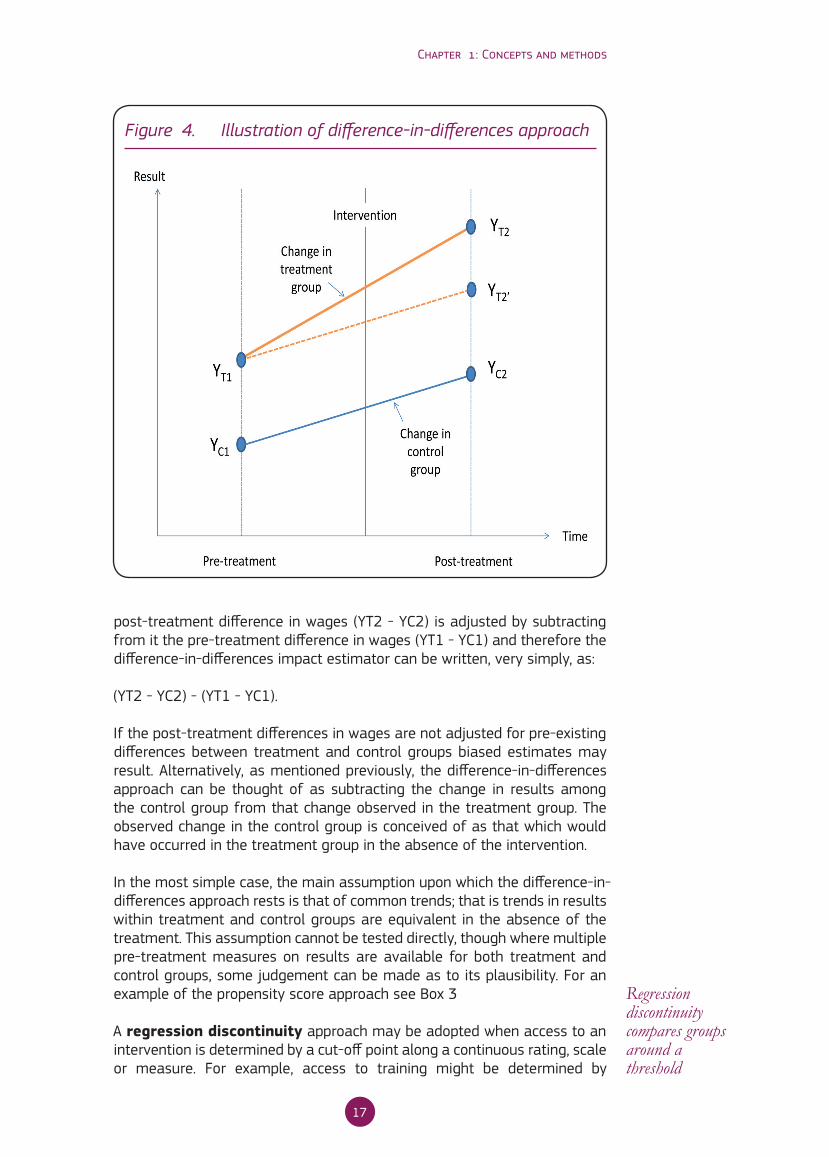
differences approach represents an improvement over a cross-section matching strategy. Figure 4 provides a visual representation of the difference-in-differences approach.
The x-axis represents the passage of time and the y-axis a scale upon which results are recorded. Results in this case might be wages. Average wages for the treatment group in the pre-treatment period are YT1, whilst for the control group they are YC1. In the post treatment period wages are YT2 and YC2 for the treatment and control groups respectively. Thus the solid upper line represents the change in wages among the treatment group, whilst the solid lower line that among the control group.
A simplistic estimate of the impact of the intervention would result from a comparison of wages in treatment and control groups in the post-treatment period, i.e. YT2 - YC2. This would however be incorrect as it would ignore differences in pre-treatment wages. One way to think about the difference-in-differences estimator involves viewing it as subtracting a pre-treatment estimate of bias from the post treatment difference in results. Thus the
The Effectiveness of individual voucher (‘dowry’) for training and employment in the Lombardy Operational Programme
A matching approach was used to evaluate the impact of vouchers (or dowries) distributed to the unemployed in the Lombardy region of Italy. The unemployed could use the vouchers to purchase training and other employment services. The evaluation sought to determine the impact of vouchers on employment and other ‘empowerment’ results. A group of 800 participants were identified along with a group of non-treated individuals who applied for vouchers but who were denied funding for administrative reasons.
Result indicators were obtained from a variety of survey and administrative data sources. To control for differences between the treated and non-treated groups a propensity score approach was adopted. This involved estimating a logistic regression equation that yielded a predicted probability of participation in the voucher programme for all treated and non-treated units. Treated persons were then matched to non-treated ones using a variety of approaches based on the propensity score.
Results from the study were mixed, with some positive impacts reported for ‘employment dowries’ and some negative impacts for ‘training dowries’, though some additional, tentative, evidence did suggest that the training dowry may have improved job quality.
(1) This and some of the following examples are drawn from the Expert Hearing organised by the European Commission and held on 25th October 2011. Representatives from eight MS and evaluation experts presented this and other examples of CIEs of ESF co-financed interventions (see also the reference in the “Introduction” and the summary table in Annex IV).
Box 2. An example of an evaluation adopting a matching approach 1
Figure 4. Illustration of difference-in-differences approach
17
Chapter 1: Concepts and methods
post-treatment difference in wages (YT2 - YC2) is adjusted by subtracting from it the pre-treatment difference in wages (YT1 - YC1) and therefore the difference-in-differences impact estimator can be written, very simply, as:
(YT2 - YC2) - (YT1 - YC1).
If the post-treatment differences in wages are not adjusted for pre-existing differences between treatment and control groups biased estimates may result. Alternatively, as mentioned previously, the difference-in-differences approach can be thought of as subtracting the change in results among the control group from that change observed in the treatment group. The observed change in the control group is conceived of as that which would have occurred in the treatment group in the absence of the intervention.
In the most simple case, the main assumption upon which the difference-in-differences approach rests is that of common trends; that is trends in results within treatment and control groups are equivalent in the absence of the treatment. This assumption cannot be tested directly, though where multiple pre-treatment measures on results are available for both treatment and control groups, some judgement can be made as to its plausibility. For an example of the propensity score approach see Box 3
A regression discontinuity approach may be adopted when access to an intervention is determined by a cut-off point along a continuous rating, scale or measure. For example, access to training might be determined by
Regression discontinuity compares groups around a threshold
differences approach represents an improvement over a cross-section matching strategy. Figure 4 provides a visual representation of the difference-in-differences approach.
The x-axis represents the passage of time and the y-axis a scale upon which results are recorded. Results in this case might be wages. Average wages for the treatment group in the pre-treatment period are YT1, whilst for the control group they are YC1. In the post treatment period wages are YT2 and YC2 for the treatment and control groups respectively. Thus the solid upper line represents the change in wages among the treatment group, whilst the solid lower line that among the control group.
A simplistic estimate of the impact of the intervention would result from a comparison of wages in treatment and control groups in the post-treatment period, i.e. YT2 - YC2. This would however be incorrect as it would ignore differences in pre-treatment wages. One way to think about the difference-in-differences estimator involves viewing it as subtracting a pre-treatment estimate of bias from the post treatment difference in results. Thus the
The Effectiveness of individual voucher (‘dowry’) for training and employment in the Lombardy Operational Programme
A matching approach was used to evaluate the impact of vouchers (or dowries) distributed to the unemployed in the Lombardy region of Italy. The unemployed could use the vouchers to purchase training and other employment services. The evaluation sought to determine the impact of vouchers on employment and other ‘empowerment’ results. A group of 800 participants were identified along with a group of non-treated individuals who applied for vouchers but who were denied funding for administrative reasons.
Result indicators were obtained from a variety of survey and administrative data sources. To control for differences between the treated and non-treated groups a propensity score approach was adopted. This involved estimating a logistic regression equation that yielded a predicted probability of participation in the voucher programme for all treated and non-treated units. Treated persons were then matched to non-treated ones using a variety of approaches based on the propensity score.
Results from the study were mixed, with some positive impacts reported for ‘employment dowries’ and some negative impacts for ‘training dowries’, though some additional, tentative, evidence did suggest that the training dowry may have improved job quality.
(1) This and some of the following examples are drawn from the Expert Hearing organised by the European Commission and held on 25th October 2011. Representatives from eight MS and evaluation experts presented this and other examples of CIEs of ESF co-financed interventions (see also the reference in the “Introduction” and the summary table in Annex IV).
Box 2. An example of an evaluation adopting a matching approach 1
Figure 4. Illustration of difference-in-differences approach
18
Practical guidance for CIEs
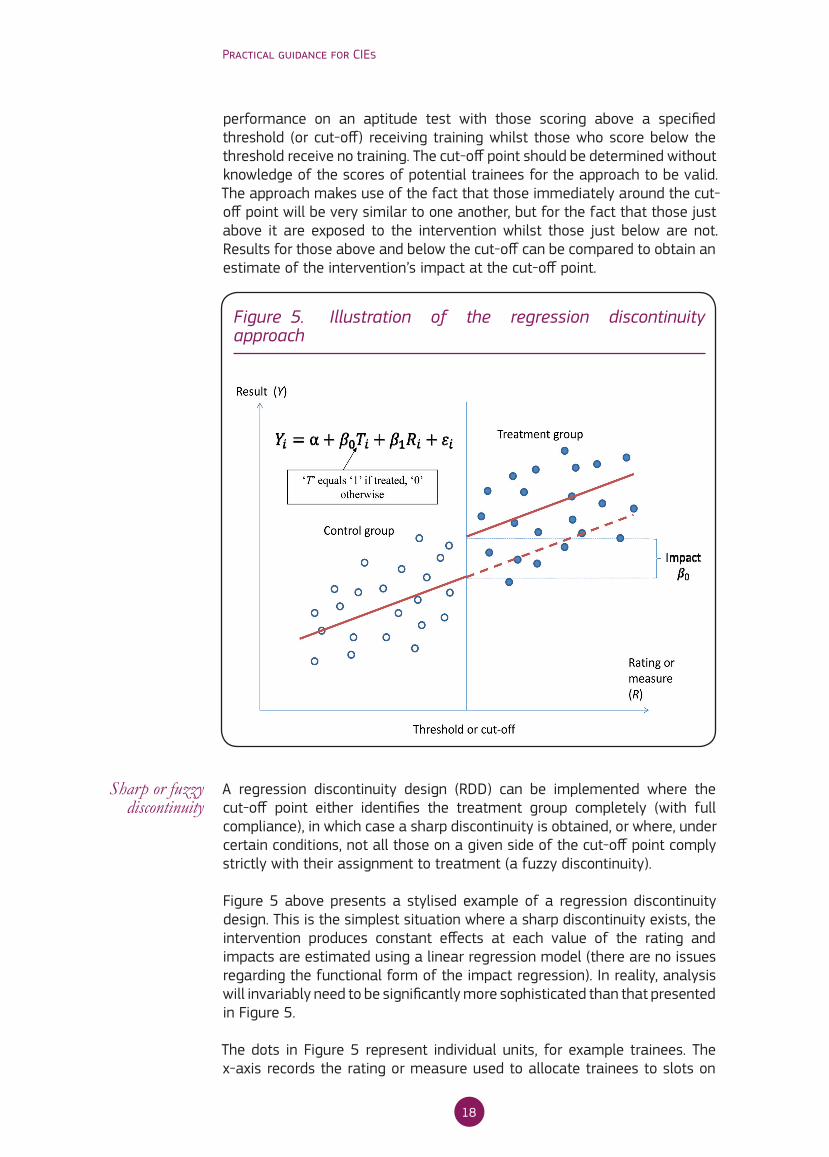
performance on an aptitude test with those scoring above a specified threshold (or cut-off) receiving training whilst those who score below the threshold receive no training. The cut-off point should be determined without knowledge of the scores of potential trainees for the approach to be valid. The approach makes use of the fact that those immediately around the cut-off point will be very similar to one another, but for the fact that those just above it are exposed to the intervention whilst those just below are not. Results for those above and below the cut-off can be compared to obtain an estimate of the intervention’s impact at the cut-off point.
A regression discontinuity design (RDD) can be implemented where the cut-off point either identifies the treatment group completely (with full compliance), in which case a sharp discontinuity is obtained, or where, under certain conditions, not all those on a given side of the cut-off point comply strictly with their assignment to treatment (a fuzzy discontinuity).
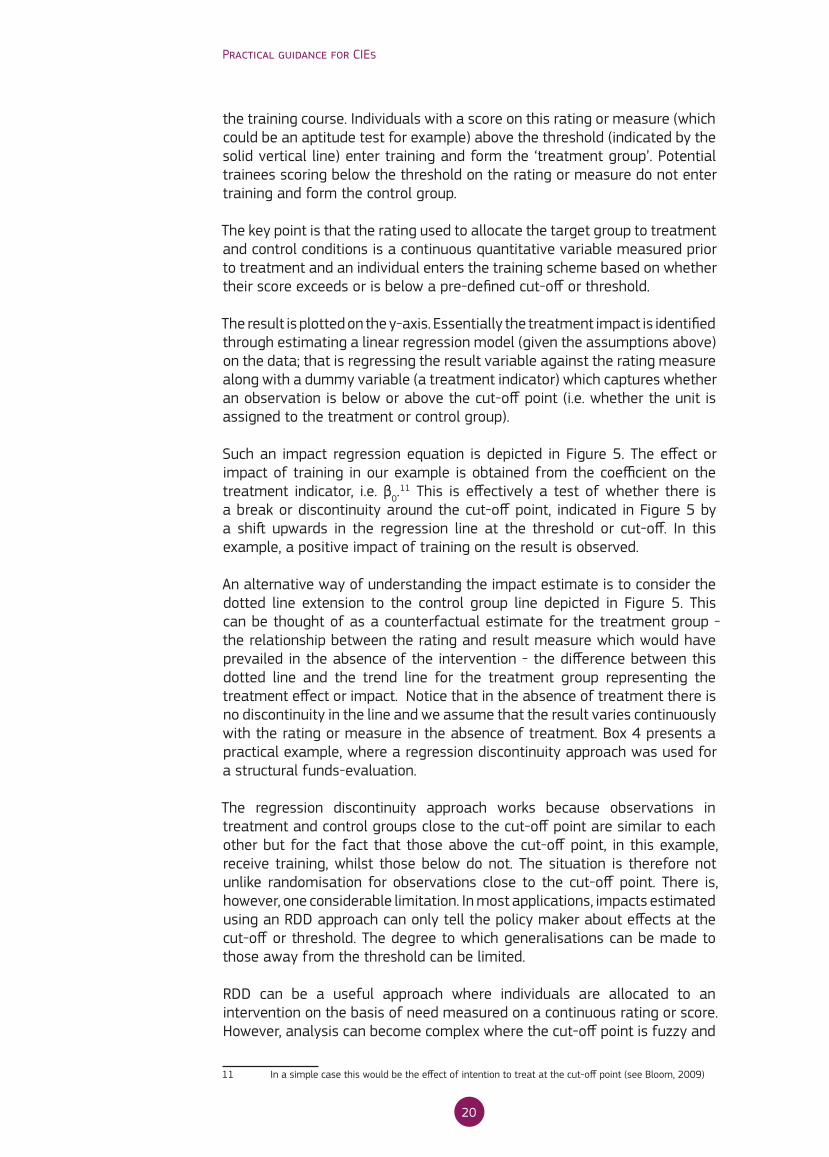
Figure 5 above presents a stylised example of a regression discontinuity design. This is the simplest situation where a sharp discontinuity exists, the intervention produces constant effects at each value of the rating and impacts are estimated using a linear regression model (there are no issues regarding the functional form of the impact regression). In reality, analysis will invariably need to be significantly more sophisticated than that presented in Figure 5.
The dots in Figure 5 represent individual units, for example trainees. The x-axis records the rating or measure used to allocate trainees to slots on
Figure 5. Illustration of the regression discontinuity approach
Sharp or fuzzy discontinuity
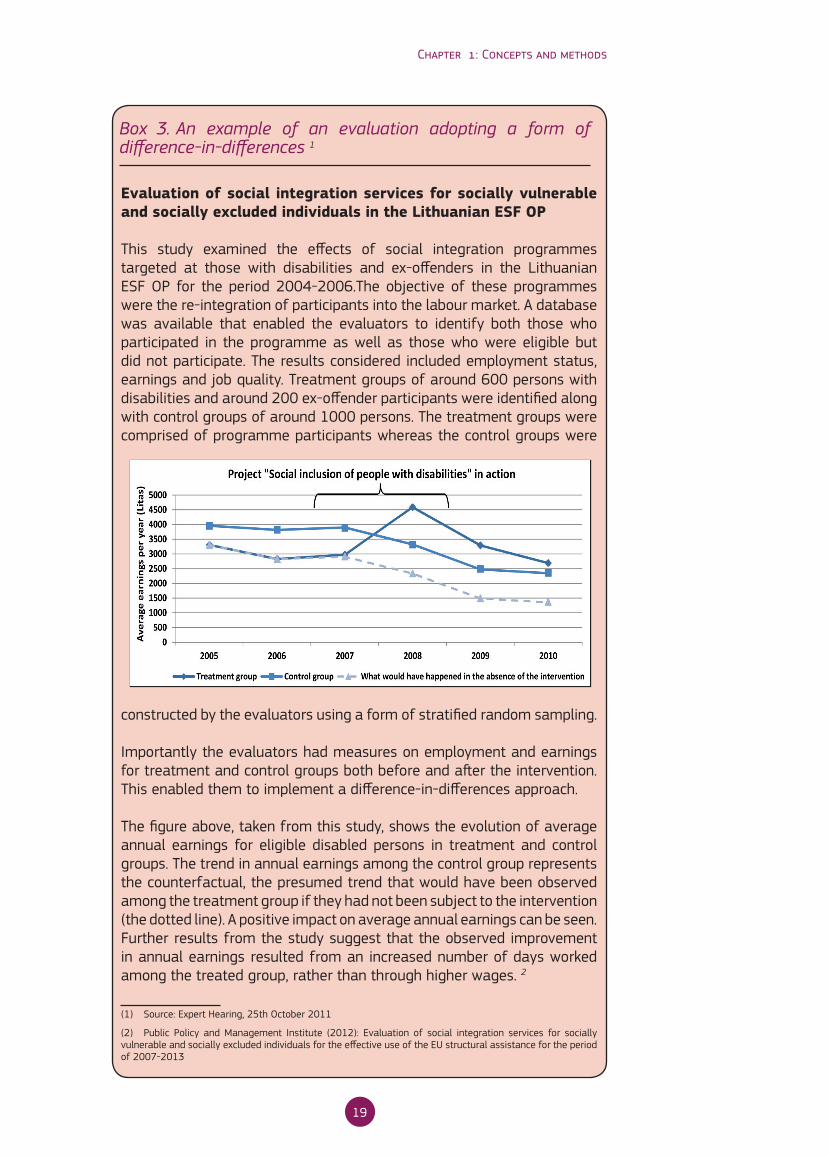
Evaluation of social integration services for socially vulnerable and socially excluded individuals in the Lithuanian ESF OP
This study examined the effects of social integration programmes targeted at those with disabilities and ex-offenders in the Lithuanian ESF OP for the period 2004-2006.The objective of these programmes were the re-integration of participants into the labour market. A database was available that enabled the evaluators to identify both those who participated in the programme as well as those who were eligible but did not participate. The results considered included employment status, earnings and job quality. Treatment groups of around 600 persons with disabilities and around 200 ex-offender participants were identified along with control groups of around 1000 persons. The treatment groups were comprised of programme participants whereas the control groups were
constructed by the evaluators using a form of stratified random sampling.
Importantly the evaluators had measures on employment and earnings for treatment and control groups both before and after the intervention. This enabled them to implement a difference-in-differences approach.
The figure above, taken from this study, shows the evolution of average annual earnings for eligible disabled persons in treatment and control groups. The trend in annual earnings among the control group represents the counterfactual, the presumed trend that would have been observed among the treatment group if they had not been subject to the intervention (the dotted line). A positive impact on average annual earnings can be seen. Further results from the study suggest that the observed improvement in annual earnings resulted from an increased number of days worked among the treated group, rather than through higher wages. 2
(1) Source: Expert Hearing, 25th October 2011
(2) Public Policy and Management Institute (2012): Evaluation of social integration services for socially vulnerable and socially excluded individuals for the effective use of the EU structural assistance for the period of 2007-2013
Box 3. An example of an evaluation adopting a form of difference-in-differences 1
19
Chapter 1: Concepts and methods
performance on an aptitude test with those scoring above a specified threshold (or cut-off) receiving training whilst those who score below the threshold receive no training. The cut-off point should be determined without knowledge of the scores of potential trainees for the approach to be valid. The approach makes use of the fact that those immediately around the cut-off point will be very similar to one another, but for the fact that those just above it are exposed to the intervention whilst those just below are not. Results for those above and below the cut-off can be compared to obtain an estimate of the intervention’s impact at the cut-off point.
A regression discontinuity design (RDD) can be implemented where the cut-off point either identifies the treatment group completely (with full compliance), in which case a sharp discontinuity is obtained, or where, under certain conditions, not all those on a given side of the cut-off point comply strictly with their assignment to treatment (a fuzzy discontinuity).
Figure 5 above presents a stylised example of a regression discontinuity design. This is the simplest situation where a sharp discontinuity exists, the intervention produces constant effects at each value of the rating and impacts are estimated using a linear regression model (there are no issues regarding the functional form of the impact regression). In reality, analysis will invariably need to be significantly more sophisticated than that presented in Figure 5.
The dots in Figure 5 represent individual units, for example trainees. The x-axis records the rating or measure used to allocate trainees to slots on
Figure 5. Illustration of the regression discontinuity approach
Sharp or fuzzy discontinuity
Evaluation of social integration services for socially vulnerable and socially excluded individuals in the Lithuanian ESF OP
This study examined the effects of social integration programmes targeted at those with disabilities and ex-offenders in the Lithuanian ESF OP for the period 2004-2006.The objective of these programmes were the re-integration of participants into the labour market. A database was available that enabled the evaluators to identify both those who participated in the programme as well as those who were eligible but did not participate. The results considered included employment status, earnings and job quality. Treatment groups of around 600 persons with disabilities and around 200 ex-offender participants were identified along with control groups of around 1000 persons. The treatment groups were comprised of programme participants whereas the control groups were
constructed by the evaluators using a form of stratified random sampling.
Importantly the evaluators had measures on employment and earnings for treatment and control groups both before and after the intervention. This enabled them to implement a difference-in-differences approach.
The figure above, taken from this study, shows the evolution of average annual earnings for eligible disabled persons in treatment and control groups. The trend in annual earnings among the control group represents the counterfactual, the presumed trend that would have been observed among the treatment group if they had not been subject to the intervention (the dotted line). A positive impact on average annual earnings can be seen. Further results from the study suggest that the observed improvement in annual earnings resulted from an increased number of days worked among the treated group, rather than through higher wages. 2
(1) Source: Expert Hearing, 25th October 2011
(2) Public Policy and Management Institute (2012): Evaluation of social integration services for socially vulnerable and socially excluded individuals for the effective use of the EU structural assistance for the period of 2007-2013
Box 3. An example of an evaluation adopting a form of difference-in-differences 1
20
Practical guidance for CIEs
the training course. Individuals with a score on this rating or measure (which could be an aptitude test for example) above the threshold (indicated by the solid vertical line) enter training and form the ‘treatment group’. Potential trainees scoring below the threshold on the rating or measure do not enter training and form the control group.
The key point is that the rating used to allocate the target group to treatment and control conditions is a continuous quantitative variable measured prior to treatment and an individual enters the training scheme based on whether their score exceeds or is below a pre-defined cut-off or threshold.
The result is plotted on the y-axis. Essentially the treatment impact is identified through estimating a linear regression model (given the assumptions above) on the data; that is regressing the result variable against the rating measure along with a dummy variable (a treatment indicator) which captures whether an observation is below or above the cut-off point (i.e. whether the unit is assigned to the treatment or control group).
Such an impact regression equation is depicted in Figure 5. The effect or impact of training in our example is obtained from the coefficient on the treatment indicator, i.e. β0.
11 This is effectively a test of whether there is a break or discontinuity around the cut-off point, indicated in Figure 5 by a shift upwards in the regression line at the threshold or cut-off. In this example, a positive impact of training on the result is observed.
An alternative way of understanding the impact estimate is to consider the dotted line extension to the control group line depicted in Figure 5. This can be thought of as a counterfactual estimate for the treatment group - the relationship between the rating and result measure which would have prevailed in the absence of the intervention - the difference between this dotted line and the trend line for the treatment group representing the treatment effect or impact. Notice that in the absence of treatment there is no discontinuity in the line and we assume that the result varies continuously with the rating or measure in the absence of treatment. Box 4 presents a practical example, where a regression discontinuity approach was used for a structural funds-evaluation.
The regression discontinuity approach works because observations in treatment and control groups close to the cut-off point are similar to each other but for the fact that those above the cut-off point, in this example, receive training, whilst those below do not. The situation is therefore not unlike randomisation for observations close to the cut-off point. There is, however, one considerable limitation. In most applications, impacts estimated using an RDD approach can only tell the policy maker about effects at the cut-off or threshold. The degree to which generalisations can be made to those away from the threshold can be limited.
RDD can be a useful approach where individuals are allocated to an intervention on the basis of need measured on a continuous rating or score. However, analysis can become complex where the cut-off point is fuzzy and
11 In a simple case this would be the effect of intention to treat at the cut-off point (see Bloom, 2009)

21
Chapter 1: Concepts and methods
there is non-compliance, and where issues of functional form in the impact regression model exist. Effectively a range of assumptions need to be invoked and the veracity of these assumptions cannot always be verified.
For the instrumental variables (IV) approach, selection into treatment should be at least partially determined by an exogenous factor (or shock) which is unrelated to results other than through the treatment. Thus the exogenous factor influences participation, but not directly the results. Typically, such exogenous factors can be administrative errors or oversights, or other random variations in treatment receipt.
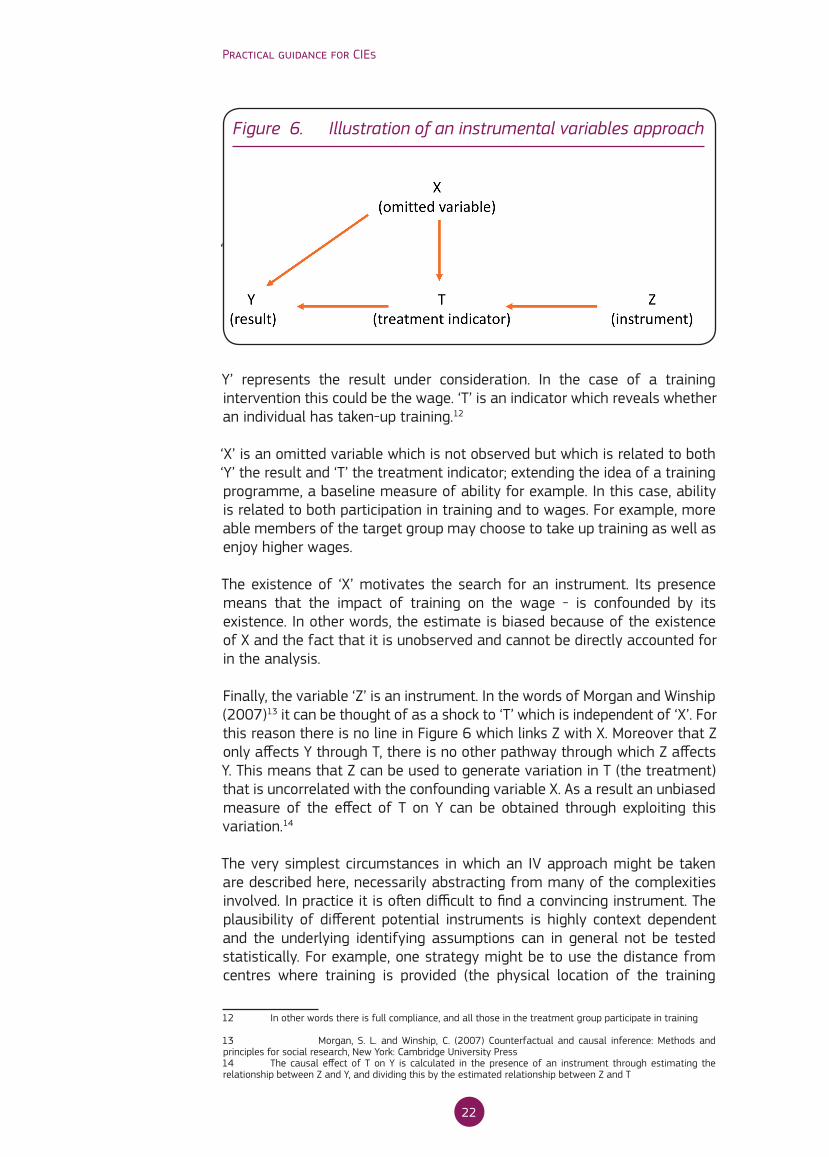
Figure 6 illustrates the instrumental variables approach. Four variables are depicted in a highly simplified causal system. The variables represent data collected from a population hypothetically targeted by a training scheme (both those who receive training and those who act as controls).
Measuring the effects of European regional policy on economic growth: a regression discontinuity approach
Evaluators used a regression discontinuity approach to assess the effects of EU regional funds on economic growth. Using data over the period 1995 to 2005, they exploited the fact the EU-15 regions received funds if their per capita GDP was less than 75 per cent of the EU average. Thus the rating used to assign treatment was per capita GDP and the cut-off point or threshold was 75 per cent of the average for EU regions as a whole. The identification strategy relied on the fact that regions close to the cut-off point, lying either side of it, were similar to each other but for the fact that those below the threshold received funds whilst those above did not.
This is an example of a sharp RDD. However, the researchers had to address a number of challenges. Not least among these was the fact that there were not many regions found in the locality of the threshold or cut-off point. They used both parametric and non-parametric methods of analysis, and performed a range of robustness checks. Findings are that EU regional funds have a small, positive impact on economic growth. Impact estimates are statistically significant and robust to different specifications 1
(1) For further details see: http://www.dps.tesoro.it/documentazione/uval/materiali_uval/european_regional_
policy_Muval20.pdf
Box 4. An example of an evaluation adopting a regression discontinuity approach
Instrumental variables
22
Practical guidance for CIEs
‘
Figure 6. Illustration of an instrumental variables approach
Y’ represents the result under consideration. In the case of a training intervention this could be the wage. ‘T’ is an indicator which reveals whether an individual has taken-up training.12
‘X’ is an omitted variable which is not observed but which is related to both ‘Y’ the result and ‘T’ the treatment indicator; extending the idea of a training programme, a baseline measure of ability for example. In this case, ability is related to both participation in training and to wages. For example, more able members of the target group may choose to take up training as well as enjoy higher wages.
The existence of ‘X’ motivates the search for an instrument. Its presence means that the impact of training on the wage - is confounded by its existence. In other words, the estimate is biased because of the existence of X and the fact that it is unobserved and cannot be directly accounted for in the analysis.
Finally, the variable ‘Z’ is an instrument. In the words of Morgan and Winship (2007)13 it can be thought of as a shock to ‘T’ which is independent of ‘X’. For this reason there is no line in Figure 6 which links Z with X. Moreover that Z only affects Y through T, there is no other pathway through which Z affects Y. This means that Z can be used to generate variation in T (the treatment) that is uncorrelated with the confounding variable X. As a result an unbiased measure of the effect of T on Y can be obtained through exploiting this variation.14
The very simplest circumstances in which an IV approach might be taken are described here, necessarily abstracting from many of the complexities involved. In practice it is often difficult to find a convincing instrument. The plausibility of different potential instruments is highly context dependent and the underlying identifying assumptions can in general not be tested statistically. For example, one strategy might be to use the distance from centres where training is provided (the physical location of the training
12 In other words there is full compliance, and all those in the treatment group participate in training
13 Morgan, S. L. and Winship, C. (2007) Counterfactual and causal inference: Methods and principles for social research, New York: Cambridge University Press 14 The causal effect of T on Y is calculated in the presence of an instrument through estimating the relationship between Z and Y, and dividing this by the estimated relationship between Z and T

23
Chapter 1: Concepts and methods
course) to a trainee’s home as an instrument in estimating the effect of training on trainees’ wages. It might be observed that trainees that live closer to training centres are more likely to participate in a training intervention. Moreover, that the distance between a trainee’s home and a training centre is unrelated to other determinants of wages and participation in training (for example human capital measures). The only pathway therefore through which this distance measure might affect wages is through its effect on training.15
Instrumental variables can be used in a wide variety of contexts. Estimates can be obtained using a variety of estimation approaches depending on the response variable. So far this approach has not been used within the ESF evaluation. In Box 5 an example for the analysis of causal effects between early retirement and mortality is presented.
The risk of all-cause mortality is significantly higher for retirees than for older workers still engaged in economic activity. This difference could be the result of some perverse consequence of retirement or simply indicate that healthy workers postpone leaving paid employment. In a recent paper (Kuhn, Wuellrich, and Zweimüller, 2010)1 researchers use an instrumental variable technique to estimate the causal effect of early retirement on mortality for blue-collar workers. To overcome the problem of “endogenous selection,” i.e. that bad health leads to retirement and hence is both cause and effect, the study takes advantage of a change in unemployment insurance rules in Austria (AT) in 1988 (the Regional Extended Benefit Program, or REBP) that allowed workers in eligible regions to withdraw from the workforce up to 3.5 years earlier than those in non-eligible regions. Residence in an eligible region can be employed as an instrument for early retirement because worker eligibility for the programme is independent of health status. Using administrative data on work history and mortality drawn from the Austrian Social Security Database, mortality subsequent to the reform is compared for blue-collar workers meeting demographic and employment criteria for REBP but differing in region of residence and hence actual eligibility. For males, these estimates show a significant 13% increase in the probability of dying before age 67 for workers eligible for REBP. No adverse effect of early retirement on mortality is found for females. Data on cause of death suggest that changes in health-related behavior among male early retirees may explain at least part of the impact. The programme ended in 1993.
(1) Kuhn, Andreas, Jean-Philippe Wuellrich, and Josef Zweimüller. 2010. Fatal Attraction? Access to Early
Retirement and Mortality. IZA Discussion Paper No. 5160. Bonn: Forschungsinstitut zur Zukunft der Arbeit
Box 5. An example of a study adopting an instrumental variables approach
15 Interpretation of findings from such an analysis may be complicated by whether the instrument is correlated with variation in treatment effect (see Bryson, et al, 2002: 9)
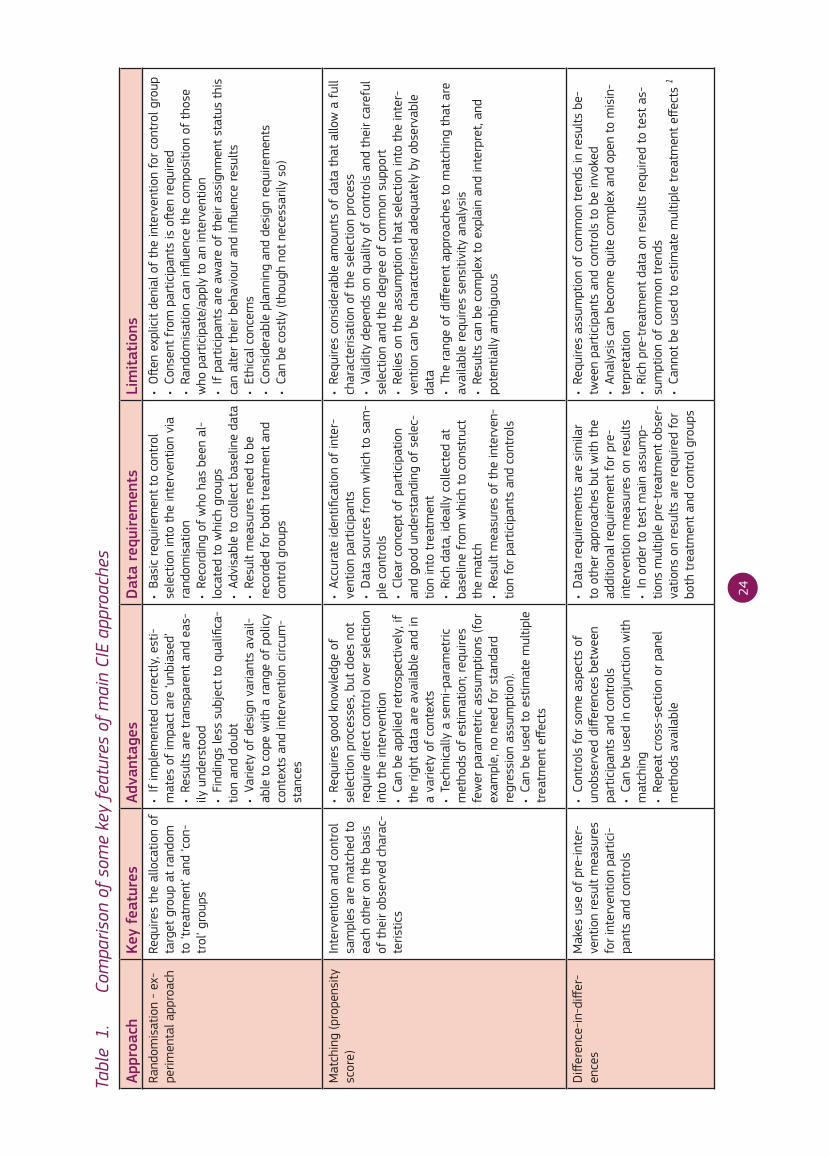
24
Appr
oach
Key
feat
ures
Adva
ntag
esD
ata
requ
irem
ents
Lim
itat
ions
Rand
omis
atio
n -
ex-
perim
enta
l app
roac
hRe
quire
s th
e al
loca
tion
of
targ
et g
roup
at
rand
om
to ‘t
reat
men
t’ an
d ‘c
on-
trol
’ gro
ups
• If im
plem
ented correctly, esti-
mat
es o
f im
pact
are
‘unb
iase
d’• Results are transparent and eas
-ily
und
erst
ood
• Findings less subject to qualifica
-tio
n an
d do
ubt
• Variety of design variants avail-
able
to
cope
with
a r
ange
of
polic
y co
ntex
ts a
nd in
terv
entio
n ci
rcum
-st
ance
s
• Basic requirement to control
sele
ctio
n in
to t
he in
terv
entio
n vi
a ra
ndom
isat
ion
• Recording of who has been al
-lo
cate
d to
whi
ch g
roup
s• Advisable to collect baseline data
• Result measures need to be
reco
rded
for
bot
h tr
eatm
ent
and
cont
rol g
roup
s
• Often explicit denial of the intervention for control group
• Consent from
participants is often required
• Random
isation can influence the com
position of those
who
par
ticip
ate/
appl
y to
an
inte
rven
tion
• If participants are aware of their assignment status this
can
alte
r th
eir
beha
viou
r an
d in
fluen
ce r
esul
ts• Ethical concerns
• Considerable planning and design requirements
• Can be costly (though not necessarily so)
Mat
chin
g (p
rope
nsity
sc
ore)
Inte
rven
tion
and
cont
rol
sam
ples
are
mat
ched
to
each
oth
er o
n th
e ba
sis
of t
heir
obse
rved
cha
rac-
teris
tics
• Requires good knowledge of
sele
ctio
n pr
oces
ses,
but
doe
s no
t re
quire
dire
ct c
ontr
ol o
ver
sele
ctio
n in
to t
he in
terv
entio
n • Can be applied retrospectively, if
the
right
dat
a ar
e av
aila
ble
and
in
a va
riety
of
cont
exts
• Technically a sem
i-parametric
met
hods
of
estim
atio
n; r
equi
res
few
er p
aram
etric
ass
umpt
ions
(for
ex
ampl
e, n
o ne
ed f
or s
tand
ard
regr
essi
on a
ssum
ptio
n).
• Can be used to estimate multiple
trea
tmen
t eff
ects
• Accurate identification of inter-
vent
ion
part
icip
ants
• Data sources from
which to sam
-pl
e co
ntro
ls• Clear concept of participation
and
good
und
erst
andi
ng o
f se
lec-
tion
into
tre
atm
ent
• Rich data, ideally collected at
base
line
from
whi
ch t
o co
nstr
uct
the
mat
ch• Result measures of the interven
-tio
n fo
r pa
rtic
ipan
ts a
nd c
ontr
ols
• Requires considerable amounts of data that allow a full
char
acte
risat
ion
of t
he s
elec
tion
proc
ess
• Validity depends on quality of controls and their careful
sele
ctio
n an
d th
e de
gree
of
com
mon
sup
port
• Relies on the assum
ption that selection into the inter-
vent
ion
can
be c
hara
cter
ised
ade
quat
ely
by o
bser
vabl
e da
ta• The range of different approaches to matching that are
avai
labl
e re
quire
s se
nsiti
vity
ana
lysi
s• Results can be complex to explain and interpret, and
pote
ntia
lly a
mbi
guou
s
Diff
eren
ce-i
n-di
ffer
-en
ces
Mak
es u
se o
f pr
e-in
ter-
vent
ion
resu
lt m
easu
res
for
inte
rven
tion
part
ici-
pant
s an
d co
ntro
ls
• Controls for som
e aspects of
unob
serv
ed d
iffer
ence
s be
twee
n pa
rtic
ipan
ts a
nd c
ontr
ols
• Can be used in conjunction with
mat
chin
g• Repeat cross-section or panel
met
hods
ava
ilabl
e
• Data requirements are similar
to o
ther
app
roac
hes
but
with
the
ad
ditio
nal r
equi
rem
ent
for
pre-
inte
rven
tion
mea
sure
s on
res
ults
• In order to test main assump-
tions
mul
tiple
pre
-tre
atm
ent
obse
r-va
tions
on
resu
lts a
re r
equi
red
for
both
tre
atm
ent
and
cont
rol g
roup
s
• Requires assumption of com
mon trends in results be-
twee
n pa
rtic
ipan
ts a
nd c
ontr
ols
to b
e in
voke
d • Analysis can becom
e quite com
plex and open to misin
-te
rpre
tatio
n• Rich pre-treatment data on results required to test as
-su
mpt
ion
of c
omm
on t
rend
s• Cannot be used to estim
ate multiple treatment effects 1
Tabl
e 1.
Co
mpa
rison
of
som
e ke
y fe
atur
es o
f m
ain
CIE
appr
oach
es
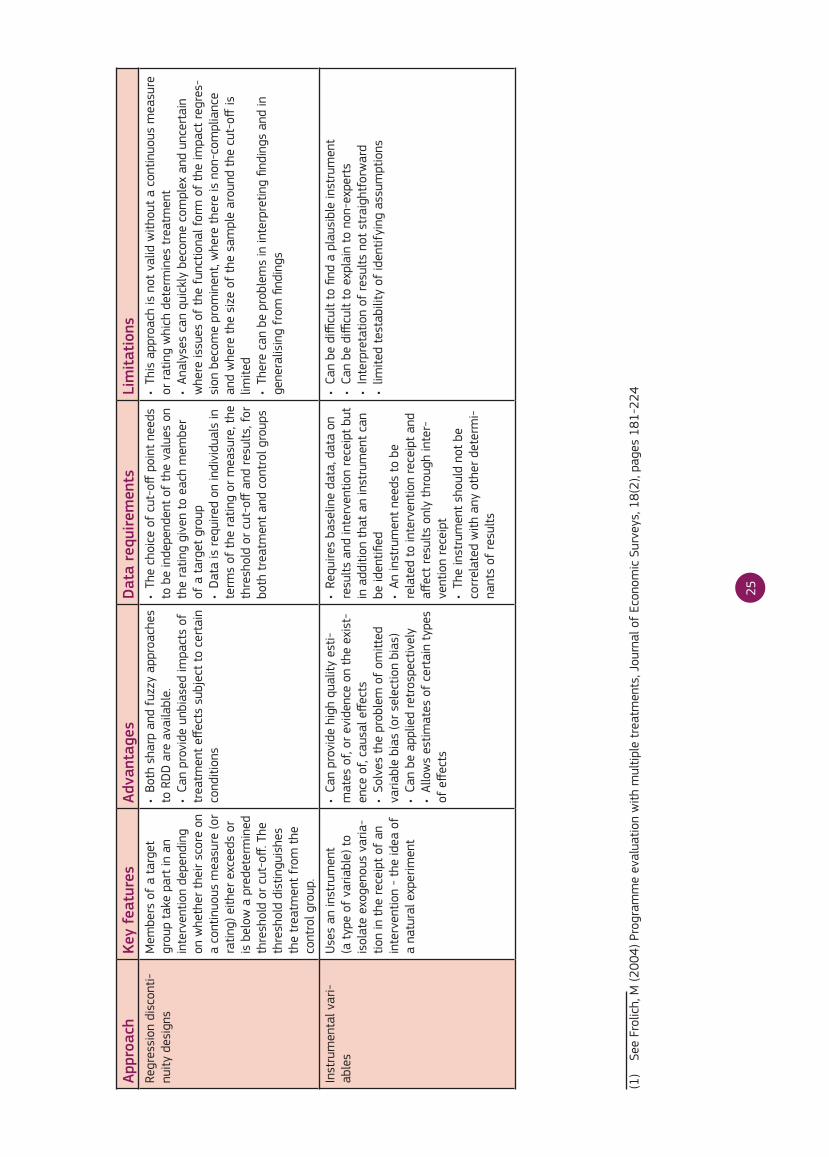
25
Appr
oach
Key
feat
ures
Adva
ntag
esD
ata
requ
irem
ents
Lim
itat
ions
Regr
essi
on d
isco
nti-
nuity
des
igns
Mem
bers
of
a ta
rget
gr
oup
take
par
t in
an
inte
rven
tion
depe
ndin
g on
whe
ther
the
ir sc
ore
on
a co
ntin
uous
mea
sure
(or
ratin
g) e
ither
exc
eeds
or
is b
elow
a p
rede
term
ined
th
resh
old
or c
ut-o
ff. T
he
thre
shol
d di
stin
guis
hes
the
trea
tmen
t fr
om t
he
cont
rol g
roup
.
• Both sharp and fuzzy approaches
to R
DD
are
ava
ilabl
e.
• Can provide unbiased im
pacts of
trea
tmen
t eff
ects
sub
ject
to
cert
ain
cond
ition
s
• The choice of cut-off
point needs
to b
e in
depe
nden
t of
the
val
ues
on
the
ratin
g gi
ven
to e
ach
mem
ber
of a
tar
get
grou
p• Data is required on individuals in
term
s of
the
rat
ing
or m
easu
re, t
he
thre
shol
d or
cut
-off
and
res
ults
, for
bo
th t
reat
men
t an
d co
ntro
l gro
ups
• This approach is not valid without a continuous measure
or r
atin
g w
hich
det
erm
ines
tre
atm
ent
• Analyses can quickly becom
e complex and uncertain
whe
re is
sues
of
the
func
tiona
l for
m o
f th
e im
pact
reg
res-
sion
bec
ome
prom
inen
t, w
here
the
re is
non
-com
plia
nce
and
whe
re t
he s
ize
of t
he s
ampl
e ar
ound
the
cut
-off
is
limite
d• There can be problem
s in interpreting findings and in
gene
ralis
ing
from
find
ings
Inst
rum
enta
l var
i-ab
les
Use
s an
inst
rum
ent
(a t
ype
of v
aria
ble)
to
isol
ate
exog
enou
s va
ria-
tion
in t
he r
ecei
pt o
f an
in
terv
entio
n -
the
idea
of
a na
tura
l exp
erim
ent
• Can provide high quality esti-
mat
es o
f, or
evi
denc
e on
the
exi
st-
ence
of,
caus
al e
ffec
ts• Solves the problem
of om
itted
varia
ble
bias
(or
sele
ctio
n bi
as)
• Can be applied retrospectively
• Allows estim
ates of certain types
of e
ffec
ts
• Requires baseline data, data on
resu
lts a
nd in
terv
entio
n re
ceip
t bu
t in
add
ition
tha
t an
inst
rum
ent
can
be id
entifi
ed• An instrument needs to be
rela
ted
to in
terv
entio
n re
ceip
t an
d aff
ect
resu
lts o
nly
thro
ugh
inte
r-ve
ntio
n re
ceip
t• The instrument should not be
corr
elat
ed w
ith a
ny o
ther
det
erm
i-na
nts
of r
esul
ts
• Can be difficult to find a plausible instrument
• Can be difficult to explain to non-experts
• Interpretation of results not straightforward
• lim
ited testability of identifying assum
ptions
(1)
See
Frol
ich,
M (2
004)
Pro
gram
me
eval
uatio
n w
ith m
ultip
le t
reat
men
ts, J
ourn
al o
f Ec
onom
ic S
urve
ys, 1
8(2)
, pag
es 1
81-2
24
26
Practical guidance for CIEs
1.5. How CIE can be embedded in a wider evaluation frameworkCounterfactual evaluations address certain types of questions about the causal effects of interventions. These approaches are constrained in the extent to which they might address other questions regarding an intervention. It is helpful to distinguish between evaluation questions concerning causal explanation and those regarding causal description. CIEs aim to describe the consequences of an intervention. Such methods are less suited to explaining the mechanisms and contexts through which causal relationships arise. This distinction is an important one, as it helps clarify the distinctive role of CIE16.
A well-designed CIE will tell the policy maker whether an intervention has led to the change in results it was designed to influence. It will provide evidence of the size of any impact, or effect, tell the policy maker whether the impact was positive or negative and provide a measure of uncertainty. What counterfactual impact evaluations do less well, is provide an account of why and how the impacts that are measured through the CIE came about. Conversely, it is often difficult to determine on the basis of a CIE why an intervention had no impact, if that proves to be the case.
Within most policymaking bodies, the stakeholders asking causal descriptive and causal explanative questions tend to have different interests and perspectives. Programme managers and practitioners tend to focus on causal explanative questions. Resource allocators and senior decision makers responsible for budget setting tend to focus on causal descriptive questions. In practice, the distinction between causal explanation and causal description can be a blurred one. CIEs in some circumstances can provide an explanation of why certain impacts were found, for example through exploring the impacts of interventions on important subgroups. However, it is essential to consider carefully the types of questions that stakeholders have regarding an intervention, and to select approaches appropriate to answering them. In cases when the primary question is whether an intervention works, a counterfactual impact evaluation is in many circumstances appropriate. In cases when the primary question is how an intervention works, attention turns instead to theory-based and process evaluation methods.
These different levels of questions and purposes are summarised in Figure 7.
This discussion leads to the conclusion that CIEs need to be developed within the evaluation plan. This evaluation plan has to comprise different forms of evaluation that are directed at answering different questions, for different policy stakeholders. In practice an evaluation plan will seldom if ever incorporate a CIE without a process evaluation.
A wide range of approaches are deployed in the name of evaluation, and serve a range of different purposes. The critical question is how these
16 Shadish, W. R., Cook, T. D. and Campbell, D. T. (2002) Experimental and quasi-experimental designs for generalised causal inference, Boston, US: Houghton Mifflin Company
Causal explanation and
description
What CIEs can tell policy makers
and what they cannot
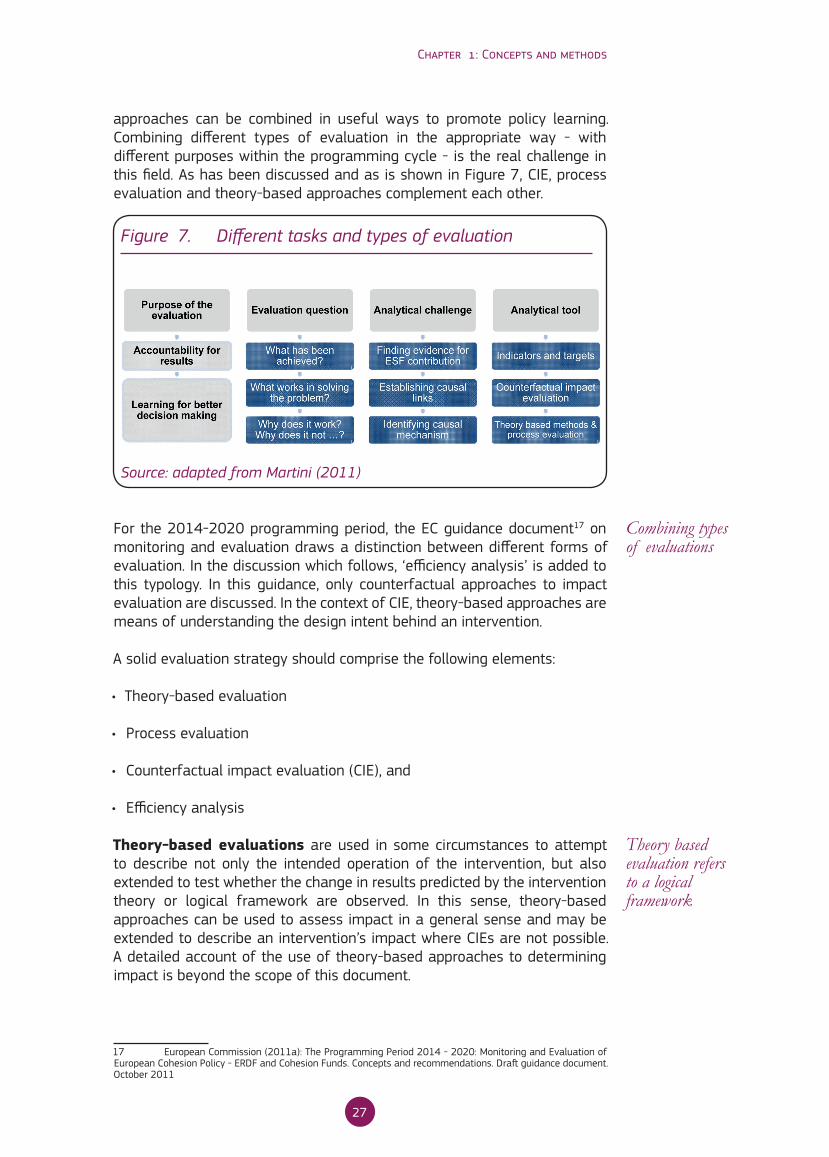
27
Chapter 1: Concepts and methods
approaches can be combined in useful ways to promote policy learning. Combining different types of evaluation in the appropriate way - with different purposes within the programming cycle - is the real challenge in this field. As has been discussed and as is shown in Figure 7, CIE, process evaluation and theory-based approaches complement each other.
For the 2014-2020 programming period, the EC guidance document17 on monitoring and evaluation draws a distinction between different forms of evaluation. In the discussion which follows, ‘efficiency analysis’ is added to this typology. In this guidance, only counterfactual approaches to impact evaluation are discussed. In the context of CIE, theory-based approaches are means of understanding the design intent behind an intervention.
A solid evaluation strategy should comprise the following elements:
• Theory-based evaluation
• Process evaluation
• Counterfactual impact evaluation (CIE), and
• Efficiency analysis
Theory-based evaluations are used in some circumstances to attempt to describe not only the intended operation of the intervention, but also extended to test whether the change in results predicted by the intervention theory or logical framework are observed. In this sense, theory-based approaches can be used to assess impact in a general sense and may be extended to describe an intervention’s impact where CIEs are not possible. A detailed account of the use of theory-based approaches to determining impact is beyond the scope of this document.
17 European Commission (2011a): The Programming Period 2014 - 2020: Monitoring and Evaluation of European Cohesion Policy - ERDF and Cohesion Funds. Concepts and recommendations. Draft guidance document. October 2011
Figure 7. Different tasks and types of evaluation
Source: adapted from Martini (2011)
Combining types of evaluations
Theory based evaluation refers to a logical framework
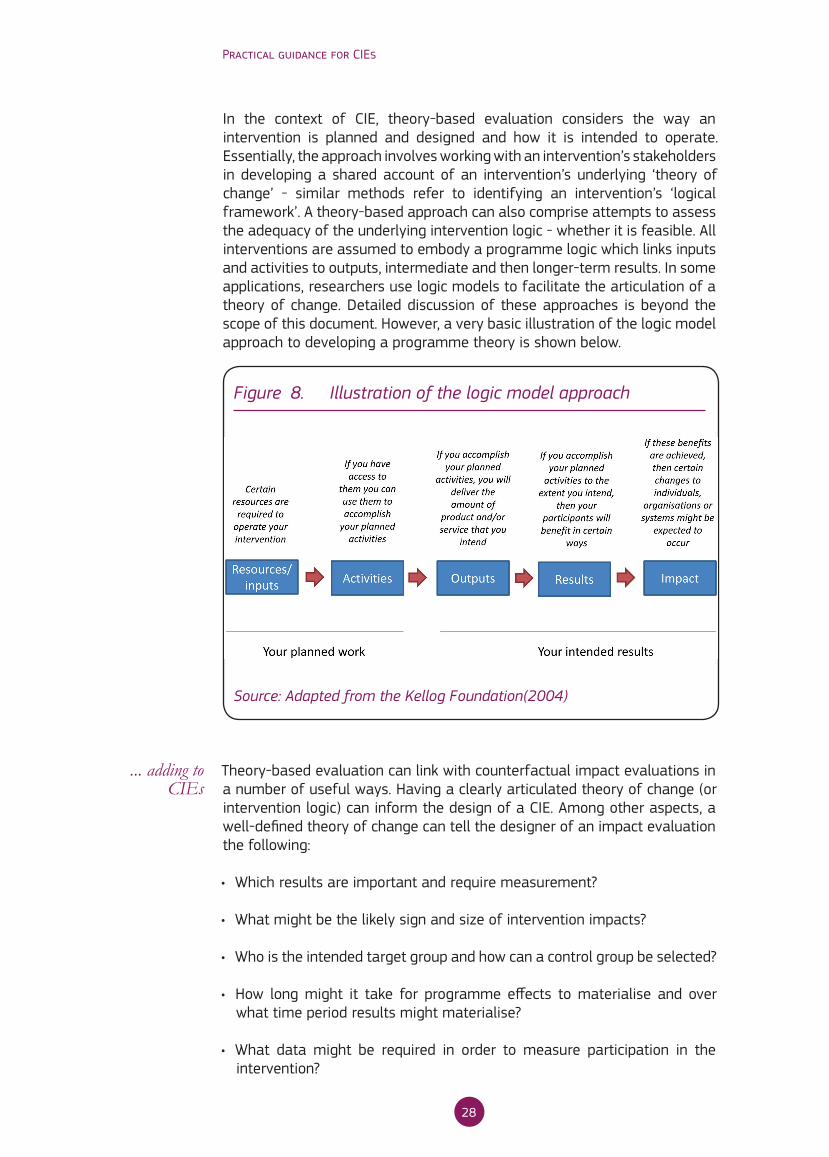
28
Practical guidance for CIEs
In the context of CIE, theory-based evaluation considers the way an intervention is planned and designed and how it is intended to operate. Essentially, the approach involves working with an intervention’s stakeholders in developing a shared account of an intervention’s underlying ‘theory of change’ - similar methods refer to identifying an intervention’s ‘logical framework’. A theory-based approach can also comprise attempts to assess the adequacy of the underlying intervention logic - whether it is feasible. All interventions are assumed to embody a programme logic which links inputs and activities to outputs, intermediate and then longer-term results. In some applications, researchers use logic models to facilitate the articulation of a theory of change. Detailed discussion of these approaches is beyond the scope of this document. However, a very basic illustration of the logic model approach to developing a programme theory is shown below.
Theory-based evaluation can link with counterfactual impact evaluations in a number of useful ways. Having a clearly articulated theory of change (or intervention logic) can inform the design of a CIE. Among other aspects, a well-defined theory of change can tell the designer of an impact evaluation the following:
• Which results are important and require measurement?
• What might be the likely sign and size of intervention impacts?
• Who is the intended target group and how can a control group be selected?
• How long might it take for programme effects to materialise and over what time period results might materialise?
• What data might be required in order to measure participation in the intervention?
Figure 8. Illustration of the logic model approach
Source: Adapted from the Kellog Foundation(2004)
... adding to CIEs
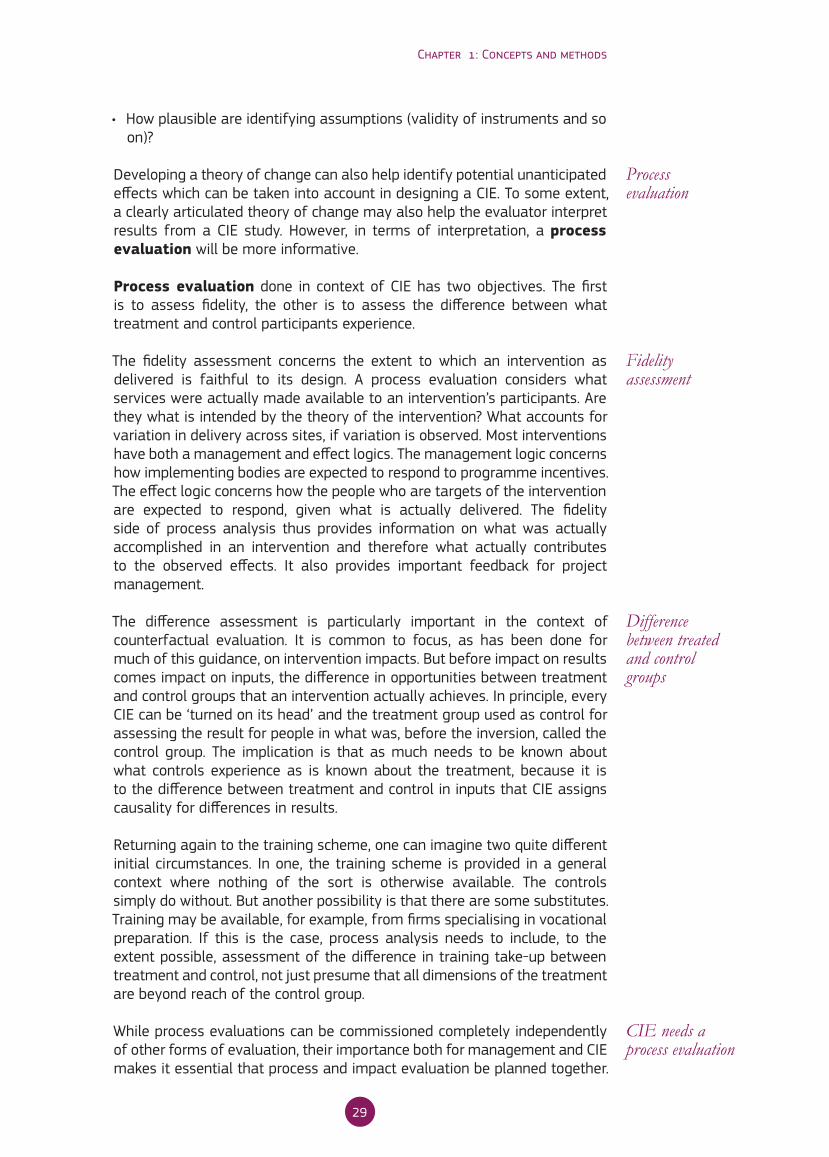
29
Chapter 1: Concepts and methods
• How plausible are identifying assumptions (validity of instruments and so on)?
Developing a theory of change can also help identify potential unanticipated effects which can be taken into account in designing a CIE. To some extent, a clearly articulated theory of change may also help the evaluator interpret results from a CIE study. However, in terms of interpretation, a process evaluation will be more informative.
Process evaluation done in context of CIE has two objectives. The first is to assess fidelity, the other is to assess the difference between what treatment and control participants experience.
The fidelity assessment concerns the extent to which an intervention as delivered is faithful to its design. A process evaluation considers what services were actually made available to an intervention’s participants. Are they what is intended by the theory of the intervention? What accounts for variation in delivery across sites, if variation is observed. Most interventions have both a management and effect logics. The management logic concerns how implementing bodies are expected to respond to programme incentives. The effect logic concerns how the people who are targets of the intervention are expected to respond, given what is actually delivered. The fidelity side of process analysis thus provides information on what was actually accomplished in an intervention and therefore what actually contributes to the observed effects. It also provides important feedback for project management.
The difference assessment is particularly important in the context of counterfactual evaluation. It is common to focus, as has been done for much of this guidance, on intervention impacts. But before impact on results comes impact on inputs, the difference in opportunities between treatment and control groups that an intervention actually achieves. In principle, every CIE can be ‘turned on its head’ and the treatment group used as control for assessing the result for people in what was, before the inversion, called the control group. The implication is that as much needs to be known about what controls experience as is known about the treatment, because it is to the difference between treatment and control in inputs that CIE assigns causality for differences in results.
Returning again to the training scheme, one can imagine two quite different initial circumstances. In one, the training scheme is provided in a general context where nothing of the sort is otherwise available. The controls simply do without. But another possibility is that there are some substitutes. Training may be available, for example, from firms specialising in vocational preparation. If this is the case, process analysis needs to include, to the extent possible, assessment of the difference in training take-up between treatment and control, not just presume that all dimensions of the treatment are beyond reach of the control group.
While process evaluations can be commissioned completely independently of other forms of evaluation, their importance both for management and CIE makes it essential that process and impact evaluation be planned together.
Process evaluation
Fidelity assessment
Difference between treated and control groups
CIE needs a process evaluation
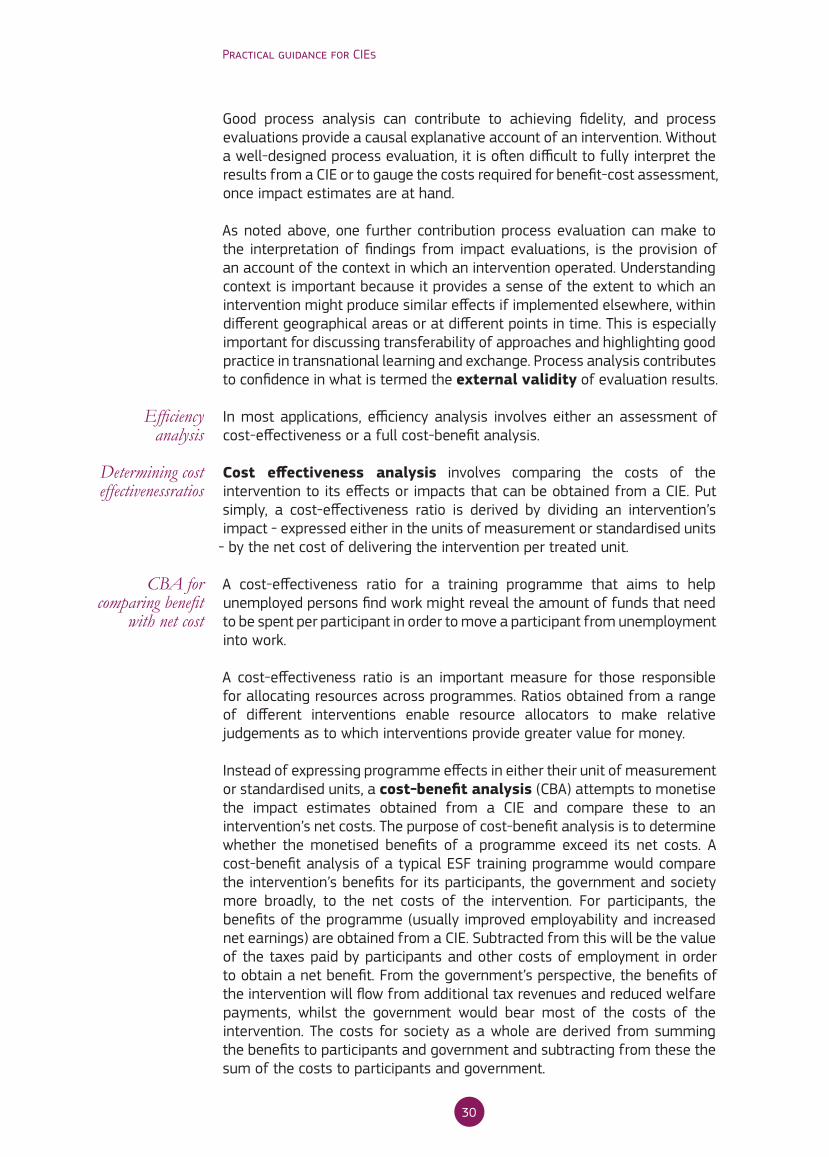
30
Practical guidance for CIEs
Good process analysis can contribute to achieving fidelity, and process evaluations provide a causal explanative account of an intervention. Without a well-designed process evaluation, it is often difficult to fully interpret the results from a CIE or to gauge the costs required for benefit-cost assessment, once impact estimates are at hand.
As noted above, one further contribution process evaluation can make to the interpretation of findings from impact evaluations, is the provision of an account of the context in which an intervention operated. Understanding context is important because it provides a sense of the extent to which an intervention might produce similar effects if implemented elsewhere, within different geographical areas or at different points in time. This is especially important for discussing transferability of approaches and highlighting good practice in transnational learning and exchange. Process analysis contributes to confidence in what is termed the external validity of evaluation results.
In most applications, efficiency analysis involves either an assessment of cost-effectiveness or a full cost-benefit analysis.
Cost effectiveness analysis involves comparing the costs of the intervention to its effects or impacts that can be obtained from a CIE. Put simply, a cost-effectiveness ratio is derived by dividing an intervention’s impact - expressed either in the units of measurement or standardised units
- by the net cost of delivering the intervention per treated unit.
A cost-effectiveness ratio for a training programme that aims to help unemployed persons find work might reveal the amount of funds that need to be spent per participant in order to move a participant from unemployment into work.
A cost-effectiveness ratio is an important measure for those responsible for allocating resources across programmes. Ratios obtained from a range of different interventions enable resource allocators to make relative judgements as to which interventions provide greater value for money.
Instead of expressing programme effects in either their unit of measurement or standardised units, a cost-benefit analysis (CBA) attempts to monetise the impact estimates obtained from a CIE and compare these to an intervention’s net costs. The purpose of cost-benefit analysis is to determine whether the monetised benefits of a programme exceed its net costs. A cost-benefit analysis of a typical ESF training programme would compare the intervention’s benefits for its participants, the government and society more broadly, to the net costs of the intervention. For participants, the benefits of the programme (usually improved employability and increased net earnings) are obtained from a CIE. Subtracted from this will be the value of the taxes paid by participants and other costs of employment in order to obtain a net benefit. From the government’s perspective, the benefits of the intervention will flow from additional tax revenues and reduced welfare payments, whilst the government would bear most of the costs of the intervention. The costs for society as a whole are derived from summing the benefits to participants and government and subtracting from these the sum of the costs to participants and government.
Efficiency analysis
Determining cost effectivenessratios
CBA for comparing benefit
with net cost

31
Chapter 1: Concepts and methods
Impact estimates from a CIE are a key ingredient in both cost-effectiveness and cost-benefit analysis. In the former, they provide the measures of effectiveness, whilst for the latter they provide a key source for estimating monetised benefits. What is also clear is that both cost-effectiveness studies and cost-benefit analysis require the collection of accurate cost data from which net costs might be derived. Such activities are usually referred to as a cost study. In some complex mixed-method evaluations, cost studies are frequently integrated into process evaluation, in which research instruments can be adapted in order to collect important cost data.


33
Chapter 2
Practical considerations in preparing a CIE
This chapter discusses practical issues to consider when preparing for an evaluation. It is to be used when planning evaluation activities, when deciding which interventions to subject to a CIE approach and for identifying key questions to address in designing a CIE.
The starting position is assumed to be one in which a programme manager within a MA (or a manager of an intermediate body (IB) responsible for implementing an ESF intervention) is considering which interventions to evaluate, and what might be appropriate strategies for incorporating a CIE. It is also assumed that officials within MA will not conduct evaluations themselves, but instead contract-out or commission evaluation services from external experts. Although the CIE will be undertaken by a contractor, the MA (or IB) will have to plan and prepare for an impact evaluation prior to commissioning.
The evaluation strategy including the various types of evaluations as described in the previous chapter, needs to be laid down in the evaluation plan.
Evaluation plans are generally recommended by the EC - not only under the convergence objective, but also for the competitiveness and employment objectives. These have to be set up at the beginning of the programming period and include arrangements for the evaluation process (especially the link between evaluation and monitoring), actual evaluation activities (e.g., an indicative list of evaluations to be carried out, scope of each evaluation, main questions, potential use, indicative time table, management structure), periodicity and time frame, overall budget, and capacity building.18
Evaluation plans tend to be general in nature, whereas planning a CIE requires more detailed preparation. Ideally this preparation should take place at the
18 Evaluation plans are requested according to Art 48 of Council Regulation (EC) No 1083/2006. For the programming period 2014-2020, an evaluation plan shall be prepared for each operational programme, Art 49 of the Draft Common Provision Regulation COM(2011) 615 final. More details are specified in the “Indicative Guidance on ESF Evaluation Quality Standards (EC, 2008); and in the respective guidance document for the 2014 – 2020 programming period, see European Commission (2012)
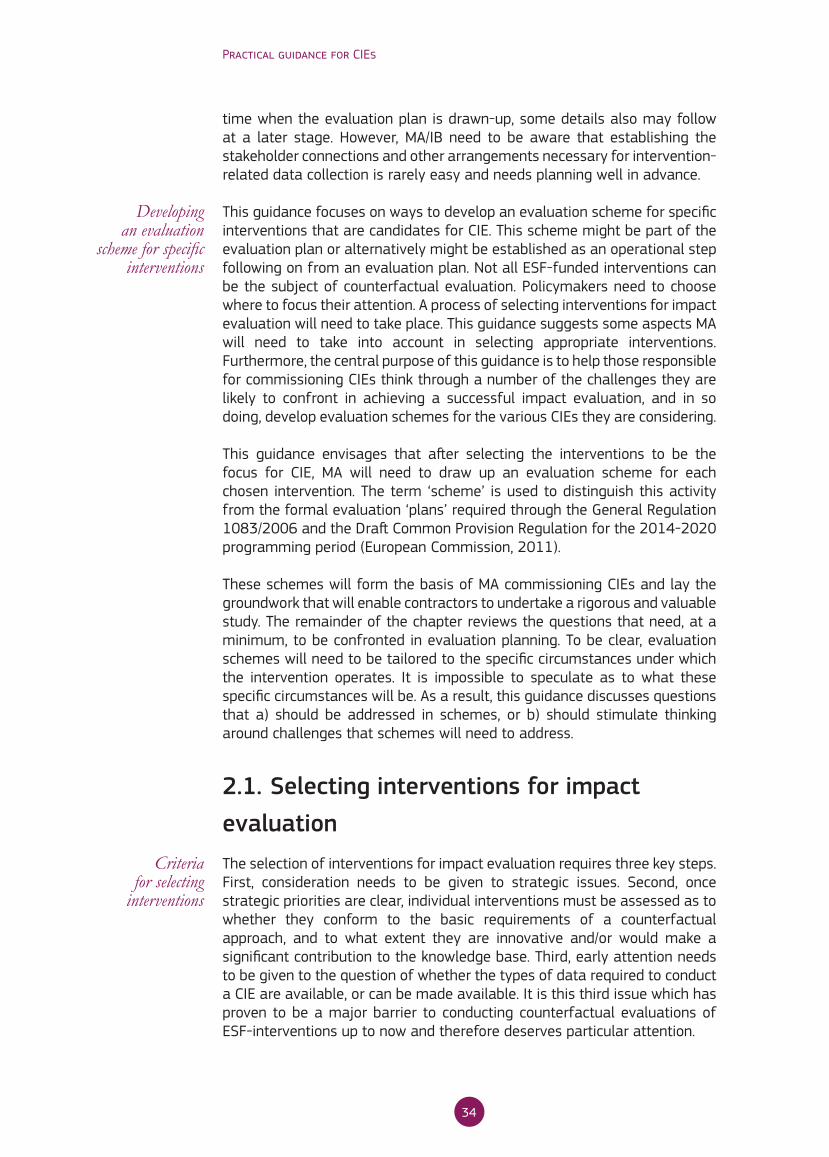
34
Practical guidance for CIEs
time when the evaluation plan is drawn-up, some details also may follow at a later stage. However, MA/IB need to be aware that establishing the stakeholder connections and other arrangements necessary for intervention-related data collection is rarely easy and needs planning well in advance.
This guidance focuses on ways to develop an evaluation scheme for specific interventions that are candidates for CIE. This scheme might be part of the evaluation plan or alternatively might be established as an operational step following on from an evaluation plan. Not all ESF-funded interventions can be the subject of counterfactual evaluation. Policymakers need to choose where to focus their attention. A process of selecting interventions for impact evaluation will need to take place. This guidance suggests some aspects MA will need to take into account in selecting appropriate interventions. Furthermore, the central purpose of this guidance is to help those responsible for commissioning CIEs think through a number of the challenges they are likely to confront in achieving a successful impact evaluation, and in so doing, develop evaluation schemes for the various CIEs they are considering.
This guidance envisages that after selecting the interventions to be the focus for CIE, MA will need to draw up an evaluation scheme for each chosen intervention. The term ‘scheme’ is used to distinguish this activity from the formal evaluation ‘plans’ required through the General Regulation 1083/2006 and the Draft Common Provision Regulation for the 2014-2020 programming period (European Commission, 2011).
These schemes will form the basis of MA commissioning CIEs and lay the groundwork that will enable contractors to undertake a rigorous and valuable study. The remainder of the chapter reviews the questions that need, at a minimum, to be confronted in evaluation planning. To be clear, evaluation schemes will need to be tailored to the specific circumstances under which the intervention operates. It is impossible to speculate as to what these specific circumstances will be. As a result, this guidance discusses questions that a) should be addressed in schemes, or b) should stimulate thinking around challenges that schemes will need to address.
2.1. Selecting interventions for impact evaluationThe selection of interventions for impact evaluation requires three key steps. First, consideration needs to be given to strategic issues. Second, once strategic priorities are clear, individual interventions must be assessed as to whether they conform to the basic requirements of a counterfactual approach, and to what extent they are innovative and/or would make a significant contribution to the knowledge base. Third, early attention needs to be given to the question of whether the types of data required to conduct a CIE are available, or can be made available. It is this third issue which has proven to be a major barrier to conducting counterfactual evaluations of ESF-interventions up to now and therefore deserves particular attention.
Developing an evaluation
scheme for specific interventions
Criteria for selecting
interventions
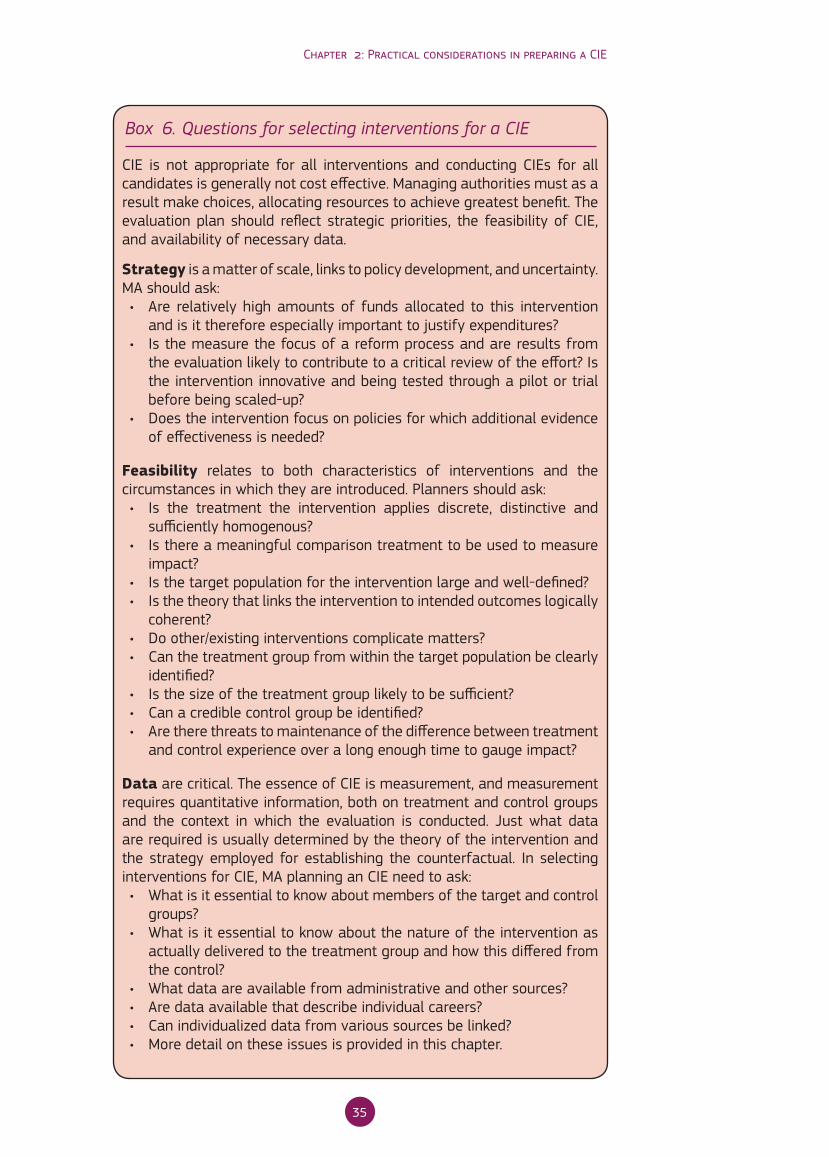
35
Chapter 2: Practical considerations in preparing a CIE
CIE is not appropriate for all interventions and conducting CIEs for all candidates is generally not cost effective. Managing authorities must as a result make choices, allocating resources to achieve greatest benefit. The evaluation plan should reflect strategic priorities, the feasibility of CIE, and availability of necessary data.
Strategy is a matter of scale, links to policy development, and uncertainty. MA should ask:• Are relatively high amounts of funds allocated to this intervention
and is it therefore especially important to justify expenditures?• Is the measure the focus of a reform process and are results from
the evaluation likely to contribute to a critical review of the effort? Is the intervention innovative and being tested through a pilot or trial before being scaled-up?
• Does the intervention focus on policies for which additional evidence of effectiveness is needed?
Feasibility relates to both characteristics of interventions and the circumstances in which they are introduced. Planners should ask: • Is the treatment the intervention applies discrete, distinctive and
sufficiently homogenous?• Is there a meaningful comparison treatment to be used to measure
impact?• Is the target population for the intervention large and well-defined?• Is the theory that links the intervention to intended outcomes logically
coherent?• Do other/existing interventions complicate matters?• Can the treatment group from within the target population be clearly
identified?• Is the size of the treatment group likely to be sufficient?• Can a credible control group be identified?• Are there threats to maintenance of the difference between treatment
and control experience over a long enough time to gauge impact?
Data are critical. The essence of CIE is measurement, and measurement requires quantitative information, both on treatment and control groups and the context in which the evaluation is conducted. Just what data are required is usually determined by the theory of the intervention and the strategy employed for establishing the counterfactual. In selecting interventions for CIE, MA planning an CIE need to ask: • What is it essential to know about members of the target and control
groups?• What is it essential to know about the nature of the intervention as
actually delivered to the treatment group and how this differed from the control?
• What data are available from administrative and other sources?• Are data available that describe individual careers?• Can individualized data from various sources be linked?• More detail on these issues is provided in this chapter.
Box 6. Questions for selecting interventions for a CIE
36
Practical guidance for CIEs
2.1.1. Choosing interventions to prioritise for impact evaluation
Before selecting specific interventions to be the focus of CIE, some consideration should first be given to wider strategic issues in selecting interventions for evaluation. The benefits that stem from well-designed, rigorous evaluations accrue not just to the MA and MS that commission them, but to other MS and their MA, to other stakeholders, and to the Commission.
From a strategic perspective, a process of prioritisation will be required. Here, the focus should be on selecting those interventions for which impact evaluations promise the greatest return in terms of learning about what works.
Contribution to justifying expenditures
Given the focus of CIEs on addressing questions that are critical for policymakers, particularly those who are responsible for resource allocation decisions, it makes sense to focus impact evaluation efforts on programmes and interventions that are particularly resource-intensive. The more time and other resources a particular programme or intervention absorbs, the more important it is to understand whether it works, and therefore whether the benefits generated exceed the costs incurred. Expensive interventions that do not produce social or economic value may need to be reconsidered, while others with evidence of added value may deserve increased funding and attention.
Results from ex-post evaluations of interventions funded in the previous programming period have shown that concentration on key policy objectives is necessary. A critical mass in spending is often required in order to achieve social and economic impact. CIEs offer the prospect of being able to sift interventions in order to identify the most effective approaches for given target groups, thereby maximising value.
Contribution of an intervention to a reform process
Interventions that form a key component of a broader reform programme will often be those attracting significant funding. However, the fact that an ESF intervention is central to a social inclusion strategy, or a critical feature of an active labour market programme, will add weight to the case for focusing attention upon it.
Innovative and exploratory
Interventions which are new and innovative, and that are being piloted are obvious candidates for CIE. Testing the effects of interventions through a pilot or trial quite clearly requires a rigorous evaluation. The onus to evaluate through implementing a well designed CIE is all the greater where there is a clear commitment to scale-up or roll out the intervention more widely should it be perceived as being successful.
Focus on resource intensive
interventions

37
Chapter 2: Practical considerations in preparing a CIE
Contribution to learning
The case for focusing attention and resources on specific programme areas - and specific interventions within these areas - is heightened where there is little or no existing evidence regarding what works within the policy area concerned. That is, where there is genuine uncertainty as to the way forward for policy and a risk of over-reliance on evidence that may not be directly relevant (for example evidence from other countries).
High quality evaluations can be considered a public good. The benefits they generate in terms of learning extend to stakeholders beyond those within a specific MA. As a result, it is important to consider which stakeholders might stand to benefit from the proposed impact evaluation. These stakeholders may be intermediate bodies or agencies dealing with interventions within the same programme, other MA or intermediate bodies in the Member State concerned, or agencies and institutions dealing with national or regional funds. Another obvious external stakeholder that should be considered is the European Commission, and there are also stakeholders in other MS who might learn from an evaluation. Taking into account the needs of those beyond the immediate stakeholders is an important contribution policy makers and programme managers can make to mutual learning.
A final strategic consideration in selecting areas for attention in developing CIEs is to consider those interventions that might enable the benefits of CIEs to be demonstrated; that is to develop evaluations that showcase this approach and act as an exemplar. Box 7 provides an overview of motivations for conducting CIE.19
2.1.2. Selecting interventions that are amenable to a counterfactual approach
Having considered wider strategic concerns that might motivate the selection of particular interventions for CIE, this section considers the specific nature of interventions that might make them amenable to the counterfactual approach.
The key point is that in preparing for an evaluation, it is important to select interventions for evaluation with the characteristics that lend themselves to the counterfactual approach. Such characteristics are many and varied. Some features of an intervention might lend themselves to a CIE in one set of circumstances but in another frustrate attempts at implementing such approaches. As a result, it is not possible to provide a comprehensive list of considerations. However, something can be said about the nature of interventions that appear more likely to lead to a successful CIE.
19 This Box is based again on the examples presented at the Expert Hearing on October 25th, 2011. A systematic overview of all CIE examples presented at the Expert Hearing with the Member States on October 25th, 2011 is presented in summary table in Annex 4. A detailed summary report on this hearing is available on CIRCA.
Producing evidence
Championing CIE methods
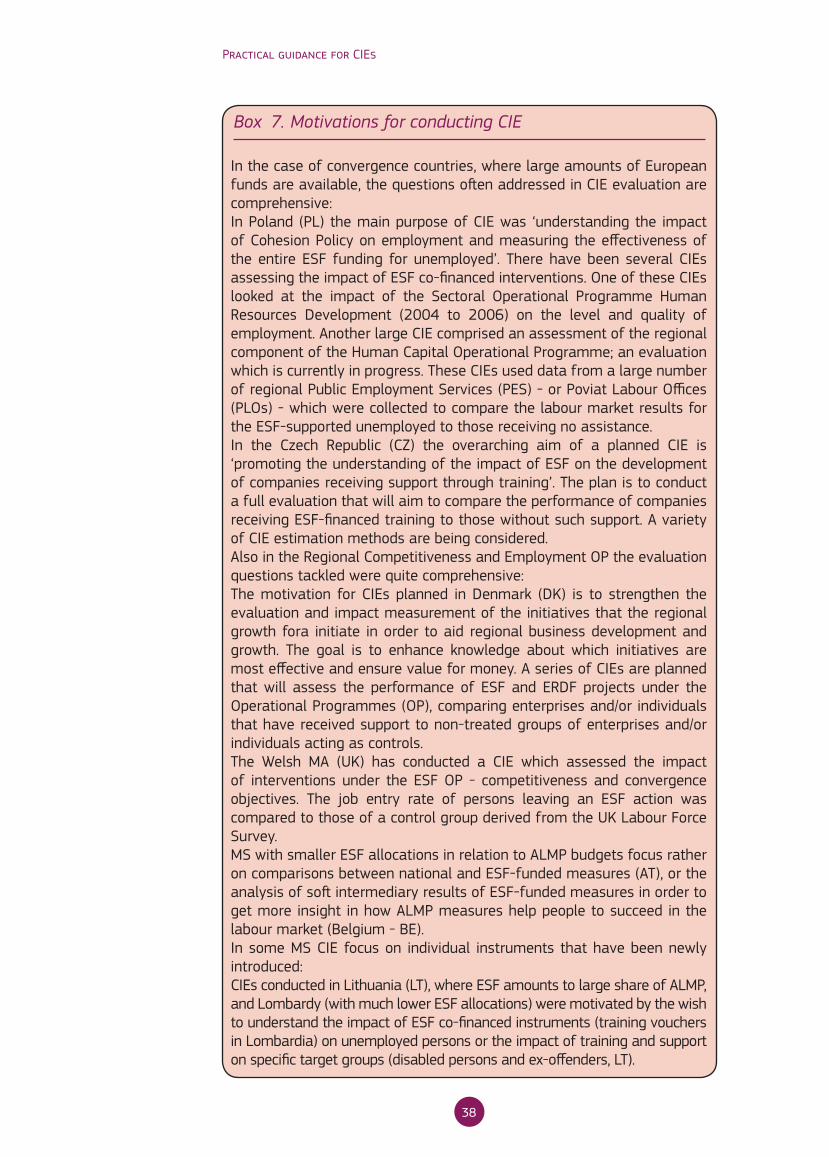
38
Practical guidance for CIEs
In the case of convergence countries, where large amounts of European funds are available, the questions often addressed in CIE evaluation are comprehensive: In Poland (PL) the main purpose of CIE was ‘understanding the impact of Cohesion Policy on employment and measuring the effectiveness of the entire ESF funding for unemployed’. There have been several CIEs assessing the impact of ESF co-financed interventions. One of these CIEs looked at the impact of the Sectoral Operational Programme Human Resources Development (2004 to 2006) on the level and quality of employment. Another large CIE comprised an assessment of the regional component of the Human Capital Operational Programme; an evaluation which is currently in progress. These CIEs used data from a large number of regional Public Employment Services (PES) - or Poviat Labour Offices (PLOs) - which were collected to compare the labour market results for the ESF-supported unemployed to those receiving no assistance.In the Czech Republic (CZ) the overarching aim of a planned CIE is ‘promoting the understanding of the impact of ESF on the development of companies receiving support through training’. The plan is to conduct a full evaluation that will aim to compare the performance of companies receiving ESF-financed training to those without such support. A variety of CIE estimation methods are being considered.Also in the Regional Competitiveness and Employment OP the evaluation questions tackled were quite comprehensive: The motivation for CIEs planned in Denmark (DK) is to strengthen the evaluation and impact measurement of the initiatives that the regional growth fora initiate in order to aid regional business development and growth. The goal is to enhance knowledge about which initiatives are most effective and ensure value for money. A series of CIEs are planned that will assess the performance of ESF and ERDF projects under the Operational Programmes (OP), comparing enterprises and/or individuals that have received support to non-treated groups of enterprises and/or individuals acting as controls.The Welsh MA (UK) has conducted a CIE which assessed the impact of interventions under the ESF OP - competitiveness and convergence objectives. The job entry rate of persons leaving an ESF action was compared to those of a control group derived from the UK Labour Force Survey. MS with smaller ESF allocations in relation to ALMP budgets focus rather on comparisons between national and ESF-funded measures (AT), or the analysis of soft intermediary results of ESF-funded measures in order to get more insight in how ALMP measures help people to succeed in the labour market (Belgium - BE). In some MS CIE focus on individual instruments that have been newly introduced: CIEs conducted in Lithuania (LT), where ESF amounts to large share of ALMP, and Lombardy (with much lower ESF allocations) were motivated by the wish to understand the impact of ESF co-financed instruments (training vouchers in Lombardia) on unemployed persons or the impact of training and support on specific target groups (disabled persons and ex-offenders, LT).
Box 7. Motivations for conducting CIE

39
Chapter 2: Practical considerations in preparing a CIE
The level at which a CIE can be conducted may cover ESF support in a Member State or a region (i.e. one or several Priority Axes, Sub-Priorities20 or operations21 in an Operational programme) and may focus on homogenous target groups or types of intervention (e.g. training) (see Box 8).
20 Sub-Priority is to be understood as the level directly below a Priority Axis, which in some countries is also referred to as “Key Area of Intervention”, “Area of Support” or “Measure”
21 According to Art. 2(3) of the Council Reg. (EC) No 1083/2006: “‘operation’ refers to a project or group of projects selected by the managing authority of the operational programme concerned or under its responsibility according to criteria laid down by the monitoring committee and implemented by one or more beneficiaries allowing achievement of the goals of the priority axis to which it relates;”
CIEs of ESF-funded interventions tend to be those directed toward the unemployed and subgroups among the unemployed affected by some specific disadvantage (e.g. PL, LI and AT). In Wales a CIE assessed the destination of all ESF leavers. CIEs also focus on the effects of training programmes targeted at employees within firms where the aim is to enhance productivity/competitiveness and prevent job losses (CZ, DK).
The interventions most frequently chosen for CIE were different forms of support provided to the unemployed, (training, start-up loans, internships, counselling and job matching services in PL; supported employment and training in LT), new instruments (training vouchers), through which the unemployed could obtain training or specified employment services in Lombardy.
A CIE conducted in Flanders attempted to examine the effects on ‘soft results’ (for example, the understanding of available job opportunities) of various forms of training (job application, vocational, person-oriented), support in the workplace and other actions. Some Polish evaluations also included soft result measures (for example: self-esteem, overcoming previously identified barriers, understanding of job opportunities, etc.).
In DK a CIE is planned for the job creating effects of ESF support for participants in ESF projects (companies and individuals).
A few of the CIE focused on individual instruments (e.g. on the Training and employment vouchers in Lombardy, IT, on the Social integration services for vulnerable and socially excluded persons in LT).
Interventions in systems and structures have also been assessed through a counterfactual approach: in Hungary a CIE was conducted to assess the impacts of the reform of the PES on the labour market position of the unemployed. The reform of the PES was rolled out sequentially in different regions. This meant that the evaluators could compare results in regions where the reforms had been rolled out to those where the changes had yet to take effect. The researchers used longitudinal data from administrative records and implemented a difference-in-differences CIE design. They looked at the impacts of reform on entry into employment and found that the reform had a positive net effect on job entry.
Box 8. Most common types of interventions and target groups chosen for ESF CIEs
40
Practical guidance for CIEs
The examples from the Member States suggest that a variety of instruments used within ESF, including training, employment incentives and labour market services (e.g. job counselling, coaching) would appear to be appropriate for CIE, whereas job rotation and job sharing interventions, start-up incentives or support for systems and structures seem to be more challenging in terms of adopting a CIE approach.
It is instructive to consider which interventions are more promising from a CIE perspective by considering the following questions:
Is the intervention discrete, distinctive and relatively homogenous?
The treatment or treatments delivered by an intervention need to be distinguishable from other interventions. Moreover, there needs to be a meaningful contrast between what an intervention’s participants receive and what other similar groups of individuals benefit from. If treatments are blurred to the point that it is not possible to identify a discrete group of recipients, then counterfactual approaches are not possible or desirable.
CIE methods become very complex and difficult, if the treatment status of a given unit (an enterprise or individual) affects the potential result of other units (through so-called wider ‘general equilibrium effects’). In training programmes, this can occur when graduates from the programme make it difficult for other non-trainees to find work in the short run. Where this is thought to be a substantial problem (for example in the case of large-scale interventions), macroeconomic analysis may be required to assess the extent of substitution and displacement effects. MA should obtain expert advice, where such effects are likely to be present.
The intervention itself should be relatively homogenous. This means participants in an intervention should receive or be exposed to broadly the same package of measures. There are a number of implications for CIE if the range of measures delivered to participants within a single intervention is too diverse. First, it might not in reality make sense to talk of a coherent intervention, but rather interventions with separate causal processes at work; second, it will be difficult to interpret impacts that are reported as average net effects over a group of disparate interventions; third, subgroup analysis might be warranted but if there are too many subgroups within a treatment group, sample size limitations may constrain the ability to report usable findings.
Is the treatment being compared to no treatment or do other relevant forms of treatment exist?
ESF is co-financing national and regional labour market and social inclusion policies. Thus, any CIE evaluation scheme needs to carefully take into account whether the intervention is clearly identifiable and if individuals have opportunity to receive services from other (national or regional) programmes and funding sources. What is important is that the treatments being evaluated actually alter the opportunities or resources available to participants compared to what is available to controls and that the difference can be measured and monitored.
Clearly distinguishable
treatment
Homogeneous interventions

41
Chapter 2: Practical considerations in preparing a CIE
Such ‘complex treatment’ issues tend to be context-specific. They complicate CIE design and implementation. Their presence underscores the importance of careful evaluation planning - developing the evaluation scheme - in advance of implementation.
Is there a large and well-defined target group?
CIEs require large sample sizes relative to some other forms of evaluation. Thus, target groups composed of individuals in adequate numbers are essential, and moreover, it must also be possible to locate control groups of sufficient size. This issue is discussed in more detail below.
It is important that the intervention being considered for CIE is targeted at a well-defined group. Without a clear understanding of who the target groups for an intervention are, it is difficult to identify a meaningful control group. Some interventions deliberately seek to recruit individuals into treatment through informal mechanisms, encouraging processes that are not predefined or too prescriptive - this can make it difficult to identify precisely who has been treated.
Is there a clear causal mechanism?
As mentioned previously, it is often useful for a theory-based evaluation to have been conducted in advance of a CIE. Developing a theory of change, or logic model, for an intervention can help those designing a CIE in a number of ways; most importantly, determining whether an intervention has a coherent causal mechanism which underpins it. Interventions without a clear and convincing causal mechanism are unlikely to produce impacts of sufficient magnitude to be identified statistically through a CIE.
Can results be defined quantitatively?
There is a need to obtain quantifiable measures of results. Such data and indicators may be obtained from administrative sources, or specifically targeted surveys.
In some circumstances, interventions may have intended results that need specific provisions to be measured quantitatively. For example, an intervention might be concerned with changing attitudes, beliefs or opinions. In such cases surveys need to be administered to measure these changes. Some interventions have quite vague or poorly defined results. Again, the development of an intervention logical framework can help sharpen understanding of what an intervention is seeking to achieve and how it intends to bring about change in the results of interest.
Is the intervention introduced in such a way which makes it possible to find a meaningful control group?
In order to identify a meaningful control group, it is important to consider how treated units (persons or enterprises) are selected for an intervention or decide to take part, whether the same research instruments can be administered to the control sample as to the treatment group, and whether
Complex treatments
Large sample size
Establishing the identity of the target group
Distinct policy mechanism
Need to measure results
Selection mechanism for treatment

42
Practical guidance for CIEs
it is necessary for control samples to be selected such that are subject to the same labour market conditions as the treatment group. Some examples are highlighted in Box 9.
If an intervention is mandatory and delivered to the entire target population more or less simultaneously, it might prove difficult to locate an untreated portion of the target population to act as a control. Issues associated with the selection of control groups are discussed further at Section 2.2.6.
For CIEs conducted to date to evaluate ESF interventions, the selection of both treatment and control groups was driven by the underlying evaluation questions, and also by the availability of appropriate data.In some cases, the control group was defined as those who received no treatment:
• In an example of one CIE from PL, only 7 per cent of the treated and 8 per cent of the control group had benefitted from other measures. So receipt of ESF-funded training was effectively compared to no training in this particular study.
• In LT, the control group included unemployed persons with disabilities and ex-offenders who were eligible participants but they did not benefit from the particular ESF interventions; however, some of them received similar services through national instruments.
• In the example from Lombardy in IT, the control group was composed of unsuccessful applicants for the intervention.
In other cases, it was rather difficult to establish a control group composed of individuals that had received no services. Therefore, treatments of interest were compared to alternative treatments:
• In AT, where nearly all the unemployed received services, the labour market results of persons receiving ESF-funded support were compared to those receiving services through national instruments.
• In Wales, the results for ESF leavers were compared to a sample of the unemployed population drawn from the Labour Force Survey (LFS), but it was not possible to identify the services received by this group.
• The Flemish CIE compared the results of recipients of one rather general form of treatment (counselling) against other forms - again it was not possible to identify a control group that had received no intervention.
Where the focus was on the impacts of ESF-funded measures on enterprises, the demarcation line was drawn between funded and not-funded enterprises:
• The planned CIE in DK will compare the performance of enterprises funded through the ESF against the results of a sample of companies with similar features but who received no support.
• A similar approach is planned in the Czech Republic.
Box 9. Defining control groups
43
Chapter 2: Practical considerations in preparing a CIE
2.1.3. Are the appropriate data available or can they be made available?
Discussions held with MA and evaluation experts from across the EU suggest that access to appropriate data is one of the key challenges faced in implementing CIEs. In deciding which interventions might be evaluated using CIEs, a key practical consideration is whether the types of data required are available. In this section, a simplified categorisation of the types of data required is presented, along with discussion of the sources from which such data might be obtained, or the types of primary data collection exercises that might be required. The crucial issue of data protection is also addressed.
Before proceeding with this discussion, however, an important point needs to be made concerning proper planning. To certain extent, attempts to implement CIEs have in the past been thwarted by a lack of data because adequate plans were not put in place early enough. For existing interventions, it is important to identify cohorts of treated and non-treated units who will be the focus of the evaluation and put in place mechanisms to collect data from these cohorts. For new interventions, steps should be taken early in their development to ensure the right types of data are collected at the appropriate points in time.
What types of data are required?
Broadly, three types of data are required in order to conduct a CIE. In some instances a single data source may contain one or more of these data types. These data types are treatment and control group records, result records, and contextual data records. We describe these data types briefly:
• Treatment and control group records: data sources are required that enable the evaluators to identify individual treatment and control group units (enterprises, persons or potentially geographical areas).
• Result records: as Figures 1 and 2 in the first chapter of this guidance show, CIEs require results to be measured for both treatment and control groups. Ideally, results for both groups should be constructed using the same research instruments and result measurements made at the same points in time.
• Control data: data are required that enable a control group that is well matched to the treatment group to be selected and at the case-level permit remaining differences between treatment and control groups to be controlled for in analysis. It is important to collect as much data as possible on factors and unit characteristics which may be related to both the choice to participate in an intervention and to potential results, particularly result indicators measured pre-treatment. Control variables might also include those which describe local labour markets (for example, local unemployment rates or measures of labour market tightness) and those that will enable analysis by subgroups.
Table 2 sets out these three data types and suggests sources from which they might be collected. Examples of data used for CIE are given in Box 10).
Planning data collection
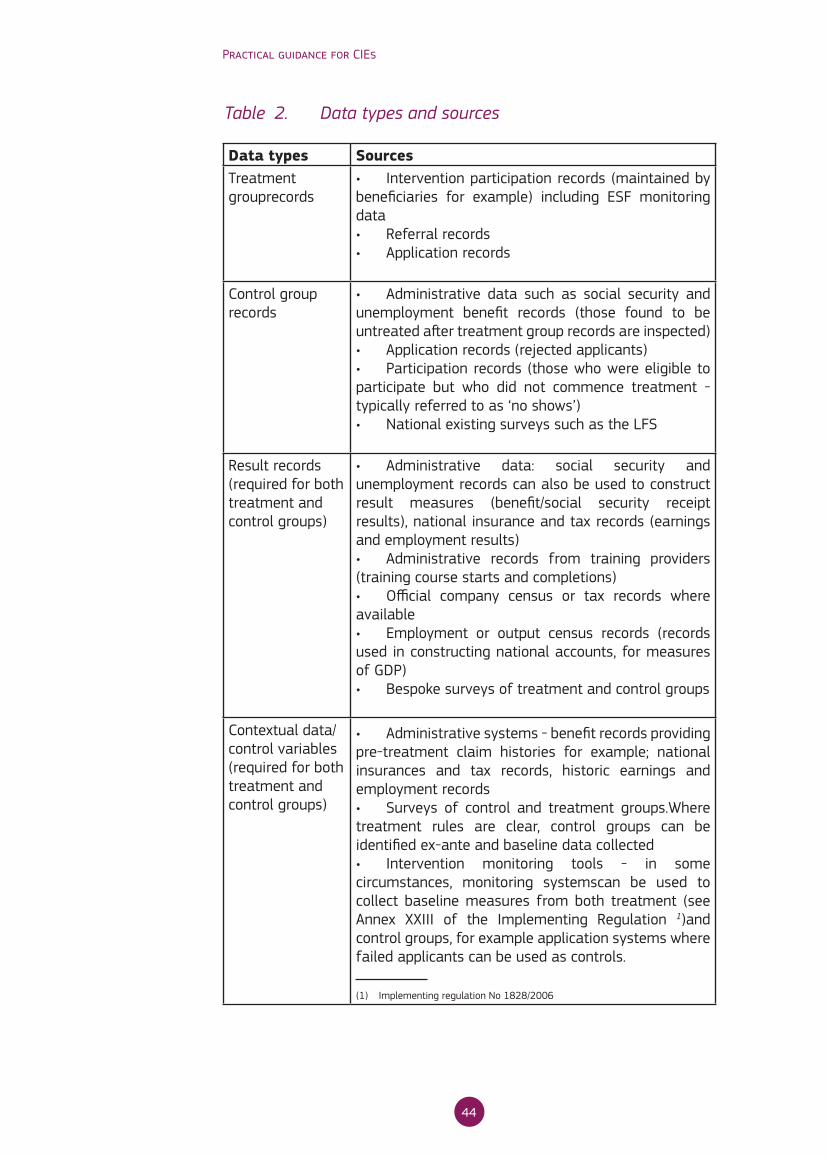
44
Practical guidance for CIEs
Data types SourcesTreatment grouprecords
• Intervention participation records (maintained by beneficiaries for example) including ESF monitoring data• Referral records• Application records
Control group records
• Administrative data such as social security and unemployment benefit records (those found to be untreated after treatment group records are inspected)• Application records (rejected applicants)• Participation records (those who were eligible to participate but who did not commence treatment - typically referred to as ‘no shows’)• National existing surveys such as the LFS
Result records (required for both treatment and control groups)
• Administrative data: social security and unemployment records can also be used to construct result measures (benefit/social security receipt results), national insurance and tax records (earnings and employment results)• Administrative records from training providers (training course starts and completions)• Official company census or tax records where available• Employment or output census records (records used in constructing national accounts, for measures of GDP)• Bespoke surveys of treatment and control groups
Contextual data/control variables (required for both treatment and control groups)
• Administrative systems - benefit records providing pre-treatment claim histories for example; national insurances and tax records, historic earnings and employment records• Surveys of control and treatment groups.Where treatment rules are clear, control groups can be identified ex-ante and baseline data collected• Intervention monitoring tools - in some circumstances, monitoring systemscan be used to collect baseline measures from both treatment (see Annex XXIII of the Implementing Regulation 1)and control groups, for example application systems where failed applicants can be used as controls.
(1) Implementing regulation No 1828/2006
Table 2. Data types and sources
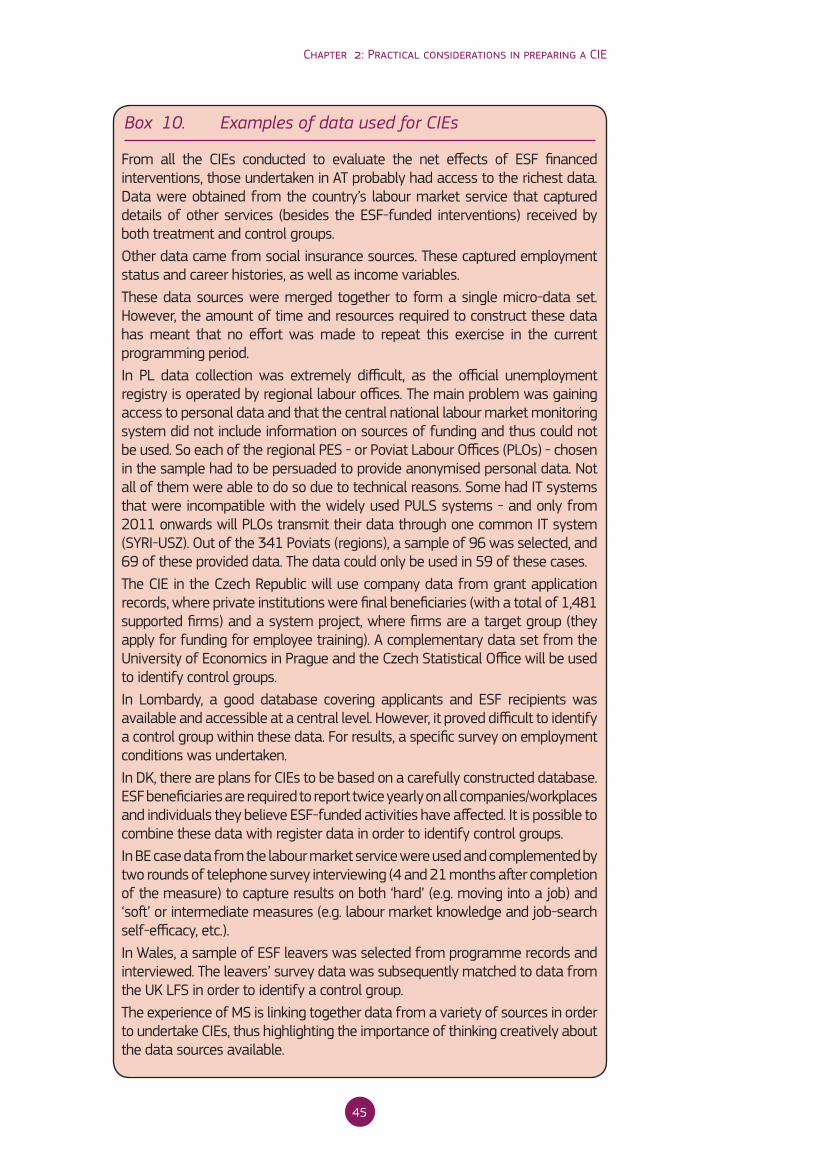
45
Chapter 2: Practical considerations in preparing a CIE
From all the CIEs conducted to evaluate the net effects of ESF financed interventions, those undertaken in AT probably had access to the richest data. Data were obtained from the country’s labour market service that captured details of other services (besides the ESF-funded interventions) received by both treatment and control groups.Other data came from social insurance sources. These captured employment status and career histories, as well as income variables. These data sources were merged together to form a single micro-data set. However, the amount of time and resources required to construct these data has meant that no effort was made to repeat this exercise in the current programming period.In PL data collection was extremely difficult, as the official unemployment registry is operated by regional labour offices. The main problem was gaining access to personal data and that the central national labour market monitoring system did not include information on sources of funding and thus could not be used. So each of the regional PES - or Poviat Labour Offices (PLOs) - chosen in the sample had to be persuaded to provide anonymised personal data. Not all of them were able to do so due to technical reasons. Some had IT systems that were incompatible with the widely used PULS systems - and only from 2011 onwards will PLOs transmit their data through one common IT system (SYRI-USZ). Out of the 341 Poviats (regions), a sample of 96 was selected, and 69 of these provided data. The data could only be used in 59 of these cases.The CIE in the Czech Republic will use company data from grant application records, where private institutions were final beneficiaries (with a total of 1,481 supported firms) and a system project, where firms are a target group (they apply for funding for employee training). A complementary data set from the University of Economics in Prague and the Czech Statistical Office will be used to identify control groups.In Lombardy, a good database covering applicants and ESF recipients was available and accessible at a central level. However, it proved difficult to identify a control group within these data. For results, a specific survey on employment conditions was undertaken.In DK, there are plans for CIEs to be based on a carefully constructed database. ESF beneficiaries are required to report twice yearly on all companies/workplaces and individuals they believe ESF-funded activities have affected. It is possible to combine these data with register data in order to identify control groups. In BE case data from the labour market service were used and complemented by two rounds of telephone survey interviewing (4 and 21 months after completion of the measure) to capture results on both ‘hard’ (e.g. moving into a job) and ‘soft’ or intermediate measures (e.g. labour market knowledge and job-search self-efficacy, etc.).In Wales, a sample of ESF leavers was selected from programme records and interviewed. The leavers’ survey data was subsequently matched to data from the UK LFS in order to identify a control group.The experience of MS is linking together data from a variety of sources in order to undertake CIEs, thus highlighting the importance of thinking creatively about the data sources available.
Box 10. Examples of data used for CIEs
46
Practical guidance for CIEs
What are the possible data protection issues?
Difficulties can be experienced in obtaining data that identifies individuals or companies who have participated in ESF-financed interventions.22 CIEs require micro-data - that is data which contains observations on the individual units (be they individual persons, enterprises or even geographical areas) in both treatment and control groups. The Implementing Regulation No 1828/2006 (Annex XXIII)23 asks for data on participants with a breakdown by gender, labour market status, age groups, educational attainment, and vulnerable groups (migrants, minorities, disabled, other disadvantaged). The CPR and ESF Regulations for 2014 - 2020 even establish a legal obligation for MA to collect and process personal data in the form of individual participant records.
Processing of these data must be in line with Directive 95/46/EC.24 This directive covers the general transfer of personal data, including sensitive data within the EU. Whereas labour market status, age and education are defined as personal data25 and allowed to be collected without the consent of the individual, data concerning the classification of individuals as being members of vulnerable groups are sensitive data26 and their collection is only allowed where individual consent is obtained.27 Exceptions can be granted, however, through Member States permitting exemptions for reasons of public interest. However, in several Member States it is very difficult to collect sensitive individualised data.
The usual practice is that MA collect micro-data and store them (at the level of MA, IB or beneficiary). Different techniques are used to anonymise the data (e.g. by unique or arbitrary identifier numbers). Mostly, MA require consent for data collection, where the award of funding might even be based on the consent of the individuals for collection of their personal data. Usually no distinction is drawn between personal and sensitive data - and no exemptions are granted by law for sensitive data. For evaluation purposes usually MS allow evaluators to use anonymised data.
Depending on the evaluation design it might be useful to ‘de-anonymise’ data (with consent) in order to re-contact participants for follow-up surveys. It is also useful to apply statistical anonymisation, in order to allow linking of participants’ ESF related data with national administrative data.
Evaluators report that national data protection rules pose serious obstacles in using micro-data. Accessing micro-data from EUROSTAT is also time-consuming and difficult. For new or additional data a formal consultation and agreement of national statistical offices is required. Some of the difficulties
22 Summary Report on an Expert Hearing on Data Protection Legislation and ESF Reporting, Brussels, 10 March 2011
23 Commission Regulation 1828/2006
24 Directive 95/46/EC of the European Parliament and of the Council of 24 October 1995 on the protection of individuals with regard to the processing of personal data and on the free movement of such data
25 Art 7of Directive 95/46
26 Art 8 of Directive 95/46
27 Art 8 of Directive 95/46
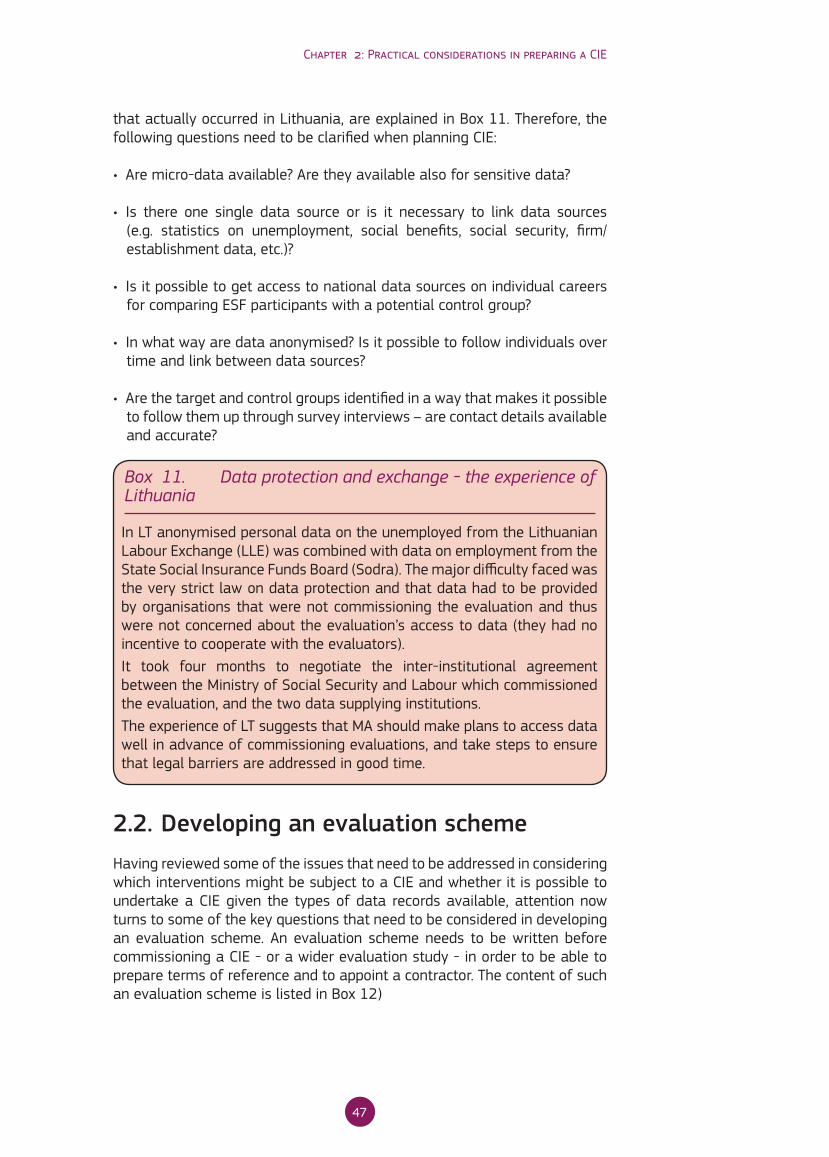
47
Chapter 2: Practical considerations in preparing a CIE
that actually occurred in Lithuania, are explained in Box 11. Therefore, the following questions need to be clarified when planning CIE:
• Are micro-data available? Are they available also for sensitive data?
• Is there one single data source or is it necessary to link data sources (e.g. statistics on unemployment, social benefits, social security, firm/establishment data, etc.)?
• Is it possible to get access to national data sources on individual careers for comparing ESF participants with a potential control group?
• In what way are data anonymised? Is it possible to follow individuals over time and link between data sources?
• Are the target and control groups identified in a way that makes it possible to follow them up through survey interviews – are contact details available and accurate?
2.2. Developing an evaluation schemeHaving reviewed some of the issues that need to be addressed in considering which interventions might be subject to a CIE and whether it is possible to undertake a CIE given the types of data records available, attention now turns to some of the key questions that need to be considered in developing an evaluation scheme. An evaluation scheme needs to be written before commissioning a CIE - or a wider evaluation study - in order to be able to prepare terms of reference and to appoint a contractor. The content of such an evaluation scheme is listed in Box 12)
In LT anonymised personal data on the unemployed from the Lithuanian Labour Exchange (LLE) was combined with data on employment from the State Social Insurance Funds Board (Sodra). The major difficulty faced was the very strict law on data protection and that data had to be provided by organisations that were not commissioning the evaluation and thus were not concerned about the evaluation’s access to data (they had no incentive to cooperate with the evaluators).It took four months to negotiate the inter-institutional agreement between the Ministry of Social Security and Labour which commissioned the evaluation, and the two data supplying institutions.The experience of LT suggests that MA should make plans to access data well in advance of commissioning evaluations, and take steps to ensure that legal barriers are addressed in good time.
Box 11. Data protection and exchange - the experience of Lithuania
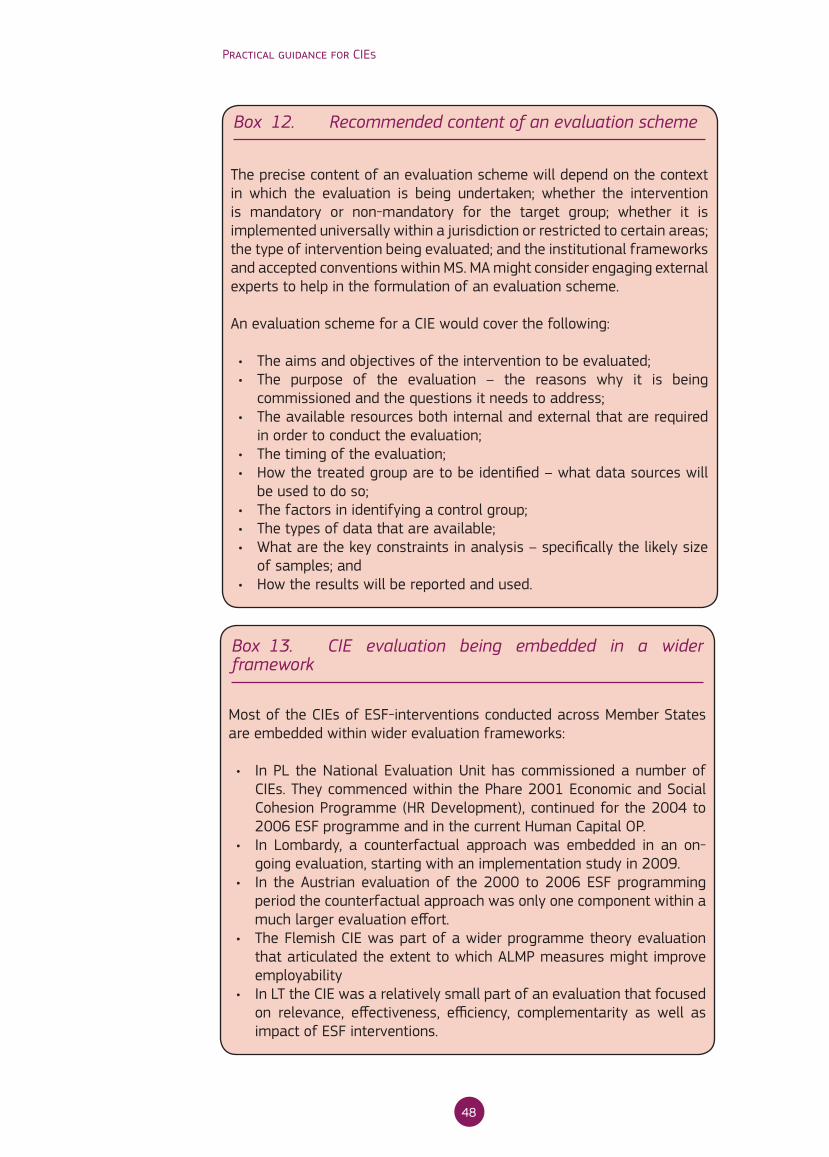
48
Practical guidance for CIEs
The precise content of an evaluation scheme will depend on the context in which the evaluation is being undertaken; whether the intervention is mandatory or non-mandatory for the target group; whether it is implemented universally within a jurisdiction or restricted to certain areas; the type of intervention being evaluated; and the institutional frameworks and accepted conventions within MS. MA might consider engaging external experts to help in the formulation of an evaluation scheme.
An evaluation scheme for a CIE would cover the following:
• The aims and objectives of the intervention to be evaluated;• The purpose of the evaluation – the reasons why it is being
commissioned and the questions it needs to address;• The available resources both internal and external that are required
in order to conduct the evaluation;• The timing of the evaluation;• How the treated group are to be identified – what data sources will
be used to do so;• The factors in identifying a control group;• The types of data that are available;• What are the key constraints in analysis – specifically the likely size
of samples; and • How the results will be reported and used.
Box 12. Recommended content of an evaluation scheme
Most of the CIEs of ESF-interventions conducted across Member States are embedded within wider evaluation frameworks:
• In PL the National Evaluation Unit has commissioned a number of CIEs. They commenced within the Phare 2001 Economic and Social Cohesion Programme (HR Development), continued for the 2004 to 2006 ESF programme and in the current Human Capital OP.
• In Lombardy, a counterfactual approach was embedded in an on-going evaluation, starting with an implementation study in 2009.
• In the Austrian evaluation of the 2000 to 2006 ESF programming period the counterfactual approach was only one component within a much larger evaluation effort.
• The Flemish CIE was part of a wider programme theory evaluation that articulated the extent to which ALMP measures might improve employability
• In LT the CIE was a relatively small part of an evaluation that focused on relevance, effectiveness, efficiency, complementarity as well as impact of ESF interventions.
Box 13. CIE evaluation being embedded in a wider framework

49
Chapter 2: Practical considerations in preparing a CIE
2.2.1. What are the aims and objectives of the intervention?
In setting out an evaluation scheme, it is first of all advisable to describe the aims and objectives of the intervention itself, and moreover, its key features.
In many cases, documents that set out the aims and objectives of the intervention will already exist. However, it is important in the case of a CIE to be specific about the results that an intervention is seeking to change and therefore the impacts that are expected.
It is often beneficial to articulate an intervention’s logical framework which sets out the means by which its various inputs and activities are intended to link to outputs, results and thereby impacts (for further discussion on this topic see Section 1.5 of this guidance).
2.2.2. What is the purpose of the evaluation?
In developing an evaluation scheme for a CIE it is important, to think through the purpose of the evaluation. Without a clear understanding of why the evaluation is needed, it is unlikely that the evaluation will produce the evidence required. In the context of evaluations of ESF financed interventions, a series of questions need to be considered:
• What is the purpose and nature of the evaluation in the context of EC regulatory requirements and guidelines?
• Who are evaluation’s main stakeholders?
• What use will the evaluation’s results be put to?
• What specific questions will the evaluation need to address?
What is the nature of the evaluation?
Firstly, the motivation for carrying out the evaluation needs to be defined. According to the Regulation 1083/2006, there are two specific cases in which Member States should carry out an evaluation: if monitoring reveals a significant departure from the goals initially set; and if major revisions in terms of content, finance and implementation of OP are proposed. Besides these cases that are defined in the Regulation, the EC encourages Member States to carry out other evaluations that meet internal MS demands in their scope, design and time frame.
The CPR draft regulation for the 2014 – 2020 programming period puts more emphasis on assessing the effectiveness, efficiency and impact: “Impact of programmes shall be evaluated in accordance with the mission of the respective CSF Funds in relation to the targets for the Union strategy for smart, sustainable and inclusive growth as well as in relation to Gross Domestic Product (GDP) and unemployment, where appropriate.”28
28 Art 47 (1) of the Draft CPR
Combining CIE design within insights from intervention logic

50
Practical guidance for CIEs
• Secondly, the nature of evaluation needs to be established:29
• Evaluations of a strategic nature examine the evolution of a programme or group of programmes in relation to Community and national priorities, especially the Lisbon goals (this may be macro-economic impact of the Structural Funds, focus on specific themes or horizontal priorities like equal opportunities and providing good practice examples).
• Evaluations of an operational nature support the monitoring of an operational programme and review the quality and relevance of the quantified objectives, analysing financial and physical progress and providing recommendations on the improvements of the programme.
In principle, the counterfactual approach can be applied to both strategic and operational evaluations. The main differences are the target audience and the use to which evaluation findings will be put to.
For the 2014 - 2020 programming period, the Draft CPR asks for at least one evaluation that assesses how support from European funds has contributed to the objectives for each priority.30 This type of question constitutes a case where conducting CIEs can be an appropriate method to arrive at conclusive results.
Who is the main audience?
The evaluation’s audience should be determined. Depending on the nature of the evaluation, these might include programme managers, other MA or implementing bodies in the Member State and national or regional authorities running similar programmes. Where data are provided by institutions outside the programme management, these bodies should also be considered stakeholders. It is important to include all major stakeholders in an evaluation steering group in order to establish joint ownership of the process of designing and conducting the evaluation.
What use will the evaluation’s results be put to?
Once the audience for the evaluation has been identified, the use to which findings will be put can be determined. Practically, this can be achieved through involving the steering group in the development of the evaluation and discussions around the terms of reference.
Two key decisions to which results from CIEs frequently contribute are:
• Whether an existing intervention should continue, and
• Whether a new type of intervention should be implemented more widely (that is scaled-up).
29 European Commission (2007): Indicative Guidelines on evaluation methods: evaluation during the programming period. Working paper no. 5. DG Regional Policy
30 Art 49 (3) of Draft CPR
Strategic and operational evaluations
Identifying the evaluation’s stakeholders

51
Chapter 2: Practical considerations in preparing a CIE
In the first instance, a CIE may attempt to assess the effectiveness of an existing or on-going programme where budgets are under pressure and there are potential alternative uses for resources involved. In this situation it is likely that the intervention has not been evaluated before using counterfactuals.
In some circumstances, interventions might have implementation constraints. For example, an intervention may be implemented in a particular region or area of a MS, or for a limited time period only. In these contexts, results from a CIE may be used to determine whether the intervention concerned is effective and therefore, can be usefully implemented elsewhere. Interventions in such situations are referred to as being piloted, or tested before wider rollout.
What questions need to be answered?
Once the intervention’s objectives and the evaluation’s purpose and ultimate uses are established, and the audience is clearly identified, it should be possible to specify in some detail the questions the CIE will need to address. In many circumstances, there are a range of audiences and stakeholders who will have questions of a causal nature they will want the CIE to explore. A process of prioritisation will be required.
Some of the issues that might be considered in finalising a list of key research questions for a CIE include:31
• What results and therefore impact estimates are most closely associated with the overall success of the intervention? Questions addressing these issues should be prioritised.
• How feasible is it to measure a result quantitatively? It may not be possible to measure some of the intended results within the data sources likely to be available. Research questions should be related to those results that can be measured.
• Within the main target group are there likely to be further subgroups of interest? For example, if an intervention is targeted at the long-term unemployed is there interest in the impact of the intervention on those under 25 years of age, or over 50 years? Research questions will need to specify which subgroups will require specific attention.
• How much evidence of the likely effectiveness of the policy is there already? If there are studies of interventions similar to that being evaluated, research questions can be more narrowly focused. Conversely, if an intervention is the first of its kind, then a more comprehensive set of research questions will be required.
• If the intervention is implemented in a range of regional contexts, are there contextual factors which are likely to be important in influencing impacts? What other confounding factors are there likely to be that might
31 These questions are adapted from a list provided in HM Treasury’s The Magenta Book (2011) page 44, a UK government policy evaluation guidance document.
Key research questions

52
Practical guidance for CIEs
influence results?
• Will intervention impacts change over time? How long will it take impacts to emerge and materialise? Will short-run effects differ from those in the long run?
It is important to have a clear idea of the range of research questions that a CIE will need to address prior to commissioning. A key element of an evaluation scheme should be the discussion of the questions the evaluation will address.
It is important to prioritise questions and not succumb to the tendency to over-load an evaluation with too many questions. There is a difficult balancing act to strike between ensuring the evaluation is relevant to a range of stakeholders who have differing interests, and making the evaluation tractable. If an evaluation is faced with the requirement to address too wide a range of research questions, the evaluation can lose focus and end up addressing a wide range of concerns in a sub-optimal manner. It is often a case of ‘less being more’ - prioritisation is a critical phase in the evaluation planning process.
2.2.3. What resources are available?
A key issue to consider in devising a CIE evaluation scheme is the resources that are available to the evaluation. This can be a wide-ranging set of considerations. Our discussion is arranged under three headings: a) expert resources; b) time; and c) financial resources.
Which external experts and internal staff are required for a CIE?
In most cases, an impact evaluation will be contracted to an external supplier. However, the contract will need to be managed within the MA by staff with knowledge of CIE methods. Such knowledge is required in order to ensure quality and to liaise effectively with external experts. Other forms of expertise may also be required within the MA, such as statistical skills, and expertise in data collection and management. It is important to consider in advance whether the MA has access to suitably qualified and trained staff, and that these staff have the capacity to support the evaluation.
Commissioning an effective CIE requires contractors who have the skills and experience necessary to conduct such evaluations. Not only this, suitable contractors will need to understand the policy and administrative context within the MS, be familiar with potential data sources and be proficient in the appropriate languages. It is important to consider whether steps are required in order to develop a CIE-supplier base within a MS (for further discussion on this topic see Chapter 4).
Effective CIEs require cooperation from those managing the programme or intervention being evaluated. For example, access to registers maintained by intervention managers will be required. These registers provide information about individuals or enterprises who participated in an intervention.
Prioritise questions
Internal personnel
External personnel
Staff managing programmes/ interventions
53
Chapter 2: Practical considerations in preparing a CIE
Programme/intervention managers can provide advice and guidance on these types of data. They also may be required to conduct some record keeping beyond that they would need to do in the absence of an impact evaluation.
In order to overcome the issue of data collection from various sources, those planning a CIE will need to liaise with staff dealing with official data sources (e.g. unemployment registry, social security data, statistical offices, etc.) in order to plan data provision well in advance.
Which factors are relevant for the time plan of a CIE?
Conducting a CIE requires contributions from a range of different human resources; in addition, such evaluations are conducted over considerable time spans. An evaluation scheme should contain an outline timetable with crucial project milestones. These milestones will need to comprise those associated with the intervention itself, as well as those associated with the evaluation. The outline timetable will need to be integrated across both evaluation and intervention delivery activities, as well as include key policy milestones.
Developing a meaningful and realistic outline timetable for a CIE is a difficult balancing act. On the one hand, the Managing Authority (or IB) planning the evaluation need to consider the crucial dates by which decisions that depend on the evaluation’s findings will have to be made. On the other, there will be constraints, which cannot be sensibly avoided that impinge on the timing of reports. Some results will take years to materialise, and data collection, analysis and reporting timetables will, as far as possible, need to reflect this (see Section 2.2.4). Where there is likely to be considerable delay before final results are available, it is important to build-in interim reporting where provisional results can be made available.
It is important to avoid the trap of evaluating too early during the programming period. The evaluation needs to come early enough so that changes can be made and so that experiences and lessons learnt can be capitalized upon in the following period. In some circumstances, the same or similar interventions might be supported in successive programming periods. Results from CIEs focusing on interventions from previous programming periods can be extremely helpful in informing implementation and design in subsequent programming periods.
It is also important to consider how the timing of a counterfactual evaluation might relate to the timing of other evaluation components. It is likely that theory based evaluation would need to be completed prior to a CIE. For innovative interventions (e.g. ESF interventions that have been launched to increase flexibility in the labour market, like the occupational transition contracts in France or instruments that were set up to fight the financial crisis, or interventions such as the ‘work with a stipend’ measure in Latvia), it is also likely that key elements of a process evaluation would need to have reported prior to conducting a CIE. In conducting a CIE of a mature on-going intervention it would probably be more relevant for the process evaluation to be conducted alongside the impact evaluation.
Statistical expertise
CIEs take time
Impacts take time to materialise
Focus on specific points in time
Sequence various types of evaluation

54
Practical guidance for CIEs
A timetable will also be affected by the availability of data. Data sources can take significant periods of time to update; this is often the case with tax records, for example. Surmounting legal and institutional barriers to acquiring the requisite data can also be time consuming and expensive. Moreover, drawing upon data from a range of sources, ensuring their compatibility, checking their quality and manipulating them into a form that can be used to estimate impacts requires considerable time and effort.
How can the costs be assessed?
It is important to set an indicative budget for how much the MA is able and willing to spend on conducting the CIE. The budget will have two components: the costs of the evaluation in terms of internal resourcing and the costs of commissioning external experts to conduct the CIE. The focus here is on the latter.
A distinction needs to be made between the evaluation of routine interventions, where expenditures are much lower, and innovative or pilot actions. Also the choice of the evaluation approach makes a difference. A guidance document issued by the Commission32 estimates the amount needed for routine interventions to be around 1% of the programme budget. In the case of innovative or pilot initiatives expenditures may be up to 10% of the programme budget. This guidance, however, does not explicitly address the resource needs of CIE. It is likely that if an impact study requires significant new primary data collection, for example in the form of quantitative surveys of participants and control group members, its costs will be considerable. Where a CIE relies instead on exploiting existing administrative data sources, total costs will be lower.33
2.2.4. When should the intervention be evaluated?
It is crucial to determine when in the life of an intervention it is most appropriate to conduct an impact evaluation, as well as the critical issues of when results should be measured and impacts estimated.
When to evaluate new and on-going interventions?
Discussion of when in the life of an intervention it is appropriate to conduct a counterfactual impact evaluation will be shaped by whether the intervention is new or a mature on-going scheme. For a new intervention, more time is needed for the intervention to become mature and reach a steady state. Conducting a CIE before this point is reached will be premature and potentially provide misleading evidence. In the case of new interventions, an initial process evaluation, conducted prior to a CIE is often a useful way to identify teething problems and suggest solutions.
32 European Commission (2009) EVALSED: The resource for the evaluation of socio-economic development
33 The UK HM Treasury (2011) provides a useful checklist of factors to consider in drawing up a budget for an evaluation. This is presented in Annex 2
Data collection can be time consuming
Assessing the costs
Timing differs for new and on-going
interventions
55
Chapter 2: Practical considerations in preparing a CIE
For a new intervention, there are a range of other factors to consider in determining the optimal timing of a CIE. The necessary steps to ensure that the appropriate data sources are available, the establishment of an internal project team comprising appropriately trained personnel, and that an external contractor has been appointed are chief among these factors. Furthermore, a critical constraint will be the needs of the decision-making process at which the evaluation is ultimately directed.
In terms of an on-going intervention, the timing of an impact evaluation will be driven mainly by practical and policy-related requirements. The intervention should have already bedded-down and reached a level of maturity making a CIE appropriate. One further issue that should be considered is the presence of other reforms running alongside the intervention being evaluated. The effects of these reforms may influence the impact of the intervention being considered. Policy makers will need to consider whether the presence of other reforms within the policy landscape is relevant for the policy decisions that will draw on the results of the CIE being contemplated.
ESF evaluations are usually focused on one programming period. However, especially in the case of stable interventions, that were already part of the ESF programme in the previous period, it is worthwhile considering combining a retrospective evaluation of the previous period and an on-going evaluation in the current period in order to cover a longer life-span of an intervention.
When to measure results and calculate impacts?
The second main issue associated with the timing of an evaluation is when impacts should be measured and estimated, or: more specifically, when it might be anticipated that impacts will emerge following an intervention.
In relation to a training intervention targeted at the unemployed for example, policymakers might hypothesise that the intervention will raise the productivity of trainees, their chances of employment and improve the wages that trainees receive. The question is over what time scales higher rates of employment and wages might materialise. It is a well-established feature of training programmes that in the short run they tend to reduce employment among participants. This is due to what is known as a ‘lock-in’ effect. Training interventions tend to divert unemployed trainees away from job search due to their attendance at courses of instruction. Thus, if impacts are calculated too soon they may well be negative. Alternatively, an intervention comprising in-work support for the unemployed who return to work may aim to encourage sustainable employment and long-term advancement in the form of rising wages and improved terms and conditions. Clearly, it would take some significant time for these types of results to emerge subsequent to treatment. The question in both these examples is when the best point in time is to measure results and therefore calculate impacts? How long does it take subsequent to exposure to the treatment for positive effects to emerge? In planning a CIE it is important to be realistic about the timing of impacts and when they are likely to measureable. A simplified model of subsequent impacts is given in Figure 9.
Resource issues
Multiple programming periods
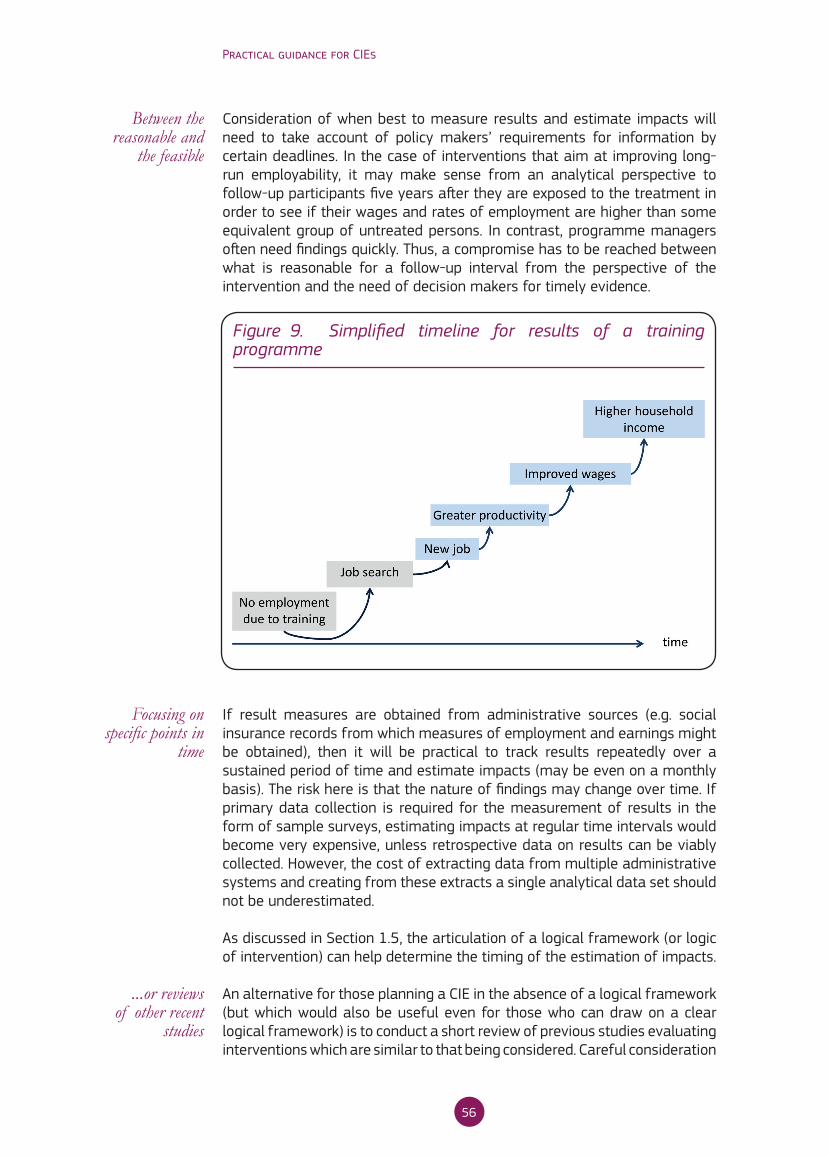
56
Practical guidance for CIEs
Consideration of when best to measure results and estimate impacts will need to take account of policy makers’ requirements for information by certain deadlines. In the case of interventions that aim at improving long-run employability, it may make sense from an analytical perspective to follow-up participants five years after they are exposed to the treatment in order to see if their wages and rates of employment are higher than some equivalent group of untreated persons. In contrast, programme managers often need findings quickly. Thus, a compromise has to be reached between what is reasonable for a follow-up interval from the perspective of the intervention and the need of decision makers for timely evidence.
If result measures are obtained from administrative sources (e.g. social insurance records from which measures of employment and earnings might be obtained), then it will be practical to track results repeatedly over a sustained period of time and estimate impacts (may be even on a monthly basis). The risk here is that the nature of findings may change over time. If primary data collection is required for the measurement of results in the form of sample surveys, estimating impacts at regular time intervals would become very expensive, unless retrospective data on results can be viably collected. However, the cost of extracting data from multiple administrative systems and creating from these extracts a single analytical data set should not be underestimated.
As discussed in Section 1.5, the articulation of a logical framework (or logic of intervention) can help determine the timing of the estimation of impacts.
An alternative for those planning a CIE in the absence of a logical framework (but which would also be useful even for those who can draw on a clear logical framework) is to conduct a short review of previous studies evaluating interventions which are similar to that being considered. Careful consideration
Between the reasonable and
the feasible
Figure 9. Simplified timeline for results of a training programme
Focusing on specific points in
time
...or reviews of other recent
studies
57
Chapter 2: Practical considerations in preparing a CIE
of results from previous studies can give a good indication of the appropriate measurement of results and calculation of impacts.
2.9.1. How is the ‘treated’ group to be identified?
In order to conduct a CIE, it is critical that there is a clear definition of what it means to be treated or to have participated in the intervention. Moreover, once a clear understanding has been determined of when an individual or enterprise is said to have been treated, it is then essential that those who have been treated can be identified.
When first considered, defining participation might appear straightforward. However, there are a number of issues that may not be immediately apparent but which are crucial and require careful thought. For example, are trainees in a training scheme that drop out of the intervention considered to have been treated? How many sessions in a training course do trainees need to have attended before they are considered to have been a participant? There are also anticipatory effects to consider. In anticipation of being subject to an intervention, some claimants of social security benefits may leave welfare rolls in order to avoid activation measures. Are these individuals treated even though, for example, they never physically attend appointments made for them at a PES office?
There is also the distinction between ‘intention to treat’ and ‘treatment on the treated’ to consider in defining the ‘treatment group’. From a policy perspective, the key question to address is usually whether the interest is in the effects of being offered the opportunity to participate in an intervention, or the effects of actually participating? In the former case, those offered an intervention may or may not participate. In the latter case, where interest is in the effect of treatment on the treated, the treated group contains only those who participate.34
At first glance, policy makers often assume that they are interested in determining the net effects of treatment on those who participate. However, on further reflection the issues can be less clear cut. If those who are offered treatment can be identified, it may be more useful from a policy perspective to define them as the ‘treated’ group. This is particularly so in circumstances where participation in an intervention is non-mandatory. Policy makers will never be able to force those offered an intervention to participate, therefore to some extent the relevant question to ask is: what is the impact of being offered a training programme on subsequent employment and wages for those who were offered the opportunity to take part?
To estimate the effects of the offer of treatment on a range of results, those who receive the offer need to be identifiable. In many circumstances this might be difficult to achieve.
34 Where participation in an intervention is mandatory, there is essentially no difference between these two statuses - everyone offered treatment has to participate. However, in most cases interventions are non-mandatory (and this is what is assumed throughout this guidance).
Definition of the treated group
Intention to treat or treatment on the treated
Offer or actual treatment

58
Practical guidance for CIEs
Where to find suitable data?
Once definitions of who are treated and what constitutes treatment have been decided upon, it is important to consider how those who are treated will be identified for the purposes of the evaluation. This invariably means finding a data source from which treated units, be they persons or enterprises, can either be fully enumerated or sampled. These records are usually those drawn from the ESF monitoring systems and - if available - further data records established for the particular intervention.
Due to ESF monitoring and reporting requirements, beneficiary organisations need to record the numbers and some personal characteristics of those who receive services through an intervention. For the purposes of CIE, interventions will need to go further and provide micro-data on those who have participated in their interventions. Evaluators will in many cases not only require a record for each treated unit (enterprise or person) but also the identities of these units (names, addresses, telephone numbers, etc.) in order that they can be sampled for surveys. Unique identifiers for each individual unit are also required to facilitate the linking of records across data sources.
2.9.2. What factors need to be considered in identifying a control group
In order to obtain an estimate of the counterfactual, a control group will usually need to be identified. At a high level, the choice of a control group will usually be constrained by whether the intervention is mandatory or non-mandatory for participants, as well as whether the intervention is implemented universally within a jurisdiction, or limited to a particular area or over a limited time span. Choice of an appropriate control group has three aspects: 1) analytical; 2) policy-related; and 3) practical.
Defining a control group from an analytical perspective
The purpose of CIE is to obtain unbiased estimates of the impacts of an intervention on a range of results. To achieve this goal, estimates of counterfactual results are required. Counterfactual result estimates are obtained from a control group (see Section 1.1). As Figure 1 and Figure 2 show, an impact is estimated by subtracting an estimate of the counterfactual result from an observed result for the ‘treated’ group. The extent to which an impact is biased depends on the degree to which the counterfactual result computed from the control group represents the result which would have materialised for the treated group had they not been treated, all else remaining equal.
A control group (in the absence of randomisation) that is equivalent to the treatment group on average in all important respects, both in observable and unobservable dimensions, is required.
Because almost all ESF interventions are either a) voluntary (the target group are not compelled to participate in an intervention), and/or b) limited
Finding data sources for treated
persons
Finding an equivalent control
group
Options for the choice of control
groups
59
Chapter 2: Practical considerations in preparing a CIE
in some other way – they are pilot interventions or instruments restricted to a particular region or jurisdiction, evaluators will be confronted with a pool of units that could be selected for use as controls. Some process of sifting this potential pool in order to refine the final choice of controls such they are well matched to participants (the treated group) will be required. In many circumstances, four options are potentially available for the choice of control group:35
• Location - controls that are similar to those participating in an intervention but located in areas of the MS where the intervention is unavailable (should such areas exist). Difference-in-differences is often the favoured approach in the case where such control groups and the right data are available. Populations in different locations can be very similar to each other and such groups will not have had the chance to participate in the intervention and declined to do so, and therefore this importance source of potential bias will be absent. However, populations in different locations will be subject to different labour market conditions. Difference-in-differences controls for such variation quite well as differences in local labour market conditions tend to be reasonably fixed over time. It is less advisable, however, to draw control samples from different local labour markets in the case where matching is being used to estimate impacts. It has been shown that the bias associated with selecting control samples from different labour markets can be greater than selection bias;36
• Time - controls that are similar to participants but that are observed at different points in time, either before or after the intervention. Control groups selected in this way are often required where an intervention is universal and mandatory – in other words, where all target group members are compelled to take part and the programme is implemented across an entire jurisdiction. Control groups formed in such a way possess a significant disadvantage, namely that their results will be measured at different time points to those of the treatment group thus being susceptible to cyclical fluctuations, compositional changes and shifting macroeconomic trends that may confound the capacity to identify an unbiased counterfactual result. Such controls should only be considered where there is limited variation in results over time and where a contemporaneous control group is unavailable;
• Eligibility - here controls are selected from groups at the same location and point in time but who were ineligible to participate. Such controls are often sought where an intervention is universal, participation rates are high, or participation is mandatory and where there are clear eligibility rules, such that, for example, those ‘just ineligible’ provide a potential source of controls. The objective is to find groups who are similar to those treated but that for well-known and fixed reasons (which can be quantified in the data) were not eligible for treatment. Access to interventions under ESF-funds are seldom based on distinct eligibility rules that can be readily
35 This section draws on Card, D., Ibarraran, P. and Villa, J. M. (2011) Building in an evaluation component for active labour market programs: a practitioner’s guide, Discussion Paper No. 6085, Bonn, German: IZA
36 Heckman, J. J., Ichimura, H., Smith, J. and Todd, P. (1998) Characterizing selection bias using experimental data, National Bureau of Economic Research Working Paper 6699, Cambridge Massachusetts: NBER
60
Practical guidance for CIEs
measured and not open to manipulation; therefore, the selection of controls under these circumstances may be quite rare;
• Choice/awareness - controls can be selected from among those who were eligible but either failed to participate. In essence, both treatment and control groups (rather than just the treatment group) are subject to selection processes based on choice motivated by potentially unobserved factors.37 The advantage of selecting controls from among those eligible but who failed to participate is that they are usually drawn from the same labour market as those who were treated. Such controls may therefore be considered with care, where a matching CIE design is being used and where there are rich data that can be drawn upon to characterise the selection decision. In other circumstances, for example where difference-in-differences is being implemented, choice/awareness controls will be less attractive.
One further point is worthy of note. Where pre-treatment result measures are available for both the treatment group and controls, it is important to inspect pre-intervention trends in result measures for both treatment and potential control groups. Checking the so called ‘common trends’ assumption addresses the problem of transitory pre-intervention dips in employment rates and wages that will have occurred for some of those eligible for ALMPs (otherwise they would not be eligible for support - the so called ‘Ashenfelter’s Dip’ discussed in footnote4). The evaluator is looking for similar time trends in result measures for both treatment and control groups so that recovery from short-term job or wage loss will not be confused with the long-term relative gains CIE attempts to detect.
The appropriate selection of control groups is a technical and methodological complex exercise. At the time evaluation schemes are being developed, it is recommended that officials make themselves familiar with the main concepts and take early steps to identify potential controls. It is important, however, that commissioners of an evaluation engage experts early in the process of designing an evaluation to provide support and advice in this task.
What are the relevant policy-related considerations?
The selection of an appropriate control group isn’t simply a technical or analytical process. Though analytical aspects of identifying appropriate controls are fundamental, it is also important that a control group represents a relevant alternative to the intervention being considered from the perspective of policymaking.
CIEs can take a number of forms: for example they can compare the results of a treatment group or a number of treatment groups to a control group receiving no treatment; or they can compare one treatment to another without a no-treatment control group. The choice of control group will be informed by which type of comparison is most policy relevant, and whether it is possible to find a ‘no treatment’ control group. Box 14 below provides an example of a comparison of one treatment to another without a ‘no
37 This is what Card et al (2011) refer to as ‘two sided selection’ bias.
Analysing pre-intervention
trends ntervention trends
Defining an alternative to an
intervention
Comparing treatment to no treatment or to an alternative

61
Chapter 2: Practical considerations in preparing a CIE
treatment’ control group – the objective being to assess whether to continue with one intervention rather than another. It should also be noted that comparison of one programme with another can give rise to ambiguity without the benefit of a no treatment control group (this is discussed further in Box 15).
Note that difference-in-differences cannot be used to compare multiple treatments in the absence of a no-treatment control group.
What practical considerations are required for selecting the control group?
Alongside analytical and policy considerations, the practical aspects of selecting control groups needs to be taken into account. Selecting or sampling units (persons or enterprises) to act as controls requires that a suitable sampling frame can be found. Furthermore, sampling frames should contain individual units that conform to analytical and policy requirements. Precisely
A study may find no difference in wages between participants in Intervention A and participants in Intervention B. The policy response to this information may not be clear if for example Intervention B was highly effective relative to receiving no treatment. This would mean that both interventions are highly effective. However, in some cases it might be that there is no evidence of the effectiveness of Intervention B relative to no treatment. Alternatively, interventions A and B could be both ineffective, though one intervention may appear relatively more effective than the other. In circumstances where certain groups in the population might be targeted by more than one intervention, it might still be more informative to attempt to find an appropriate group of untreated units to act as a comparison.
Box 15. Interpreting net effects
Consider an example where the policymaker intends to introduce a new training intervention which is to be funded through the ESF - call this Intervention A. Further, suppose that the MS already has a training scheme targeted at the same persons but financed through national funds. In such a case a policy question might be: are the levels of employment and wages for participants in intervention A greater than those for participants in Intervention B subsequent to participation? And by extension, does Intervention A represent better value for money? If wages are higher for participants in Intervention A, then the obvious policy response is to discontinue Intervention B in favour of Intervention A, if it also proves cost-effective to deliver.
Box 14. Policy questions related to a training programme
62
Practical guidance for CIEs
how this is best done will vary from evaluation to evaluation depending on the specific context of the intervention being tested.
In many cases two sources of data are often exploited in identifying suitable control groups. Both require that the identity of the treatment group is known.
First, population registers of various kinds can be used to find controls. For example, an active labour market intervention targets 18 - 24 years old persons on unemployment benefit. Unemployment benefit records can therefore be used to identify the target population. Further, if the treated group are known and can be matched to the benefits data, those 18-24 year olds who are untreated and therefore potential controls can be found. Alternatively, suppose an intervention is targeted at small and medium sized enterprises. National company’s records (should they be available) could be used to define the target population, and with information available on which enterprises are treated, potential control groups found.
Second, applicant records can be used where take-up of the intervention is not universal; for example, where not all those who apply to a training programme are accepted (a choice/awareness control group). Similarly, not all those enterprises that apply for financing will be successful and those not accepted for training or finance can in some cases be used as controls (though see previous discussion in this section regarding the caution that should be exercised in selecting control groups under these circumstances).
2.9.3. What kinds of data issues need to be raised in the evaluation scheme?
What types of data are required and how will they be collected?
As it has been noted, CIEs usually require access to considerable quantities of micro-data (in some cases grouped data might be used – for example regional data). These data need to be collected, collated and documented; data from various sources need to be linked together on the basis of shared identifying fields; they need to be stored and transferred securely between those managing and undertaking the CIE; and analytical data sets need to be constructed from these data sources in order to facilitate estimation of impacts.
In developing an evaluation scheme it is important to consider the following data related questions:
• What sources can be used to obtain these various types of micro/grouped-data?
• How can the sources be accessed and data retrieved from them?
• Are the sources consistent with one another?
• Is it necessary to identify individuals or enterprises? What is the appropriate
Population registers and company tax
records
Applicant records
Managing data sources
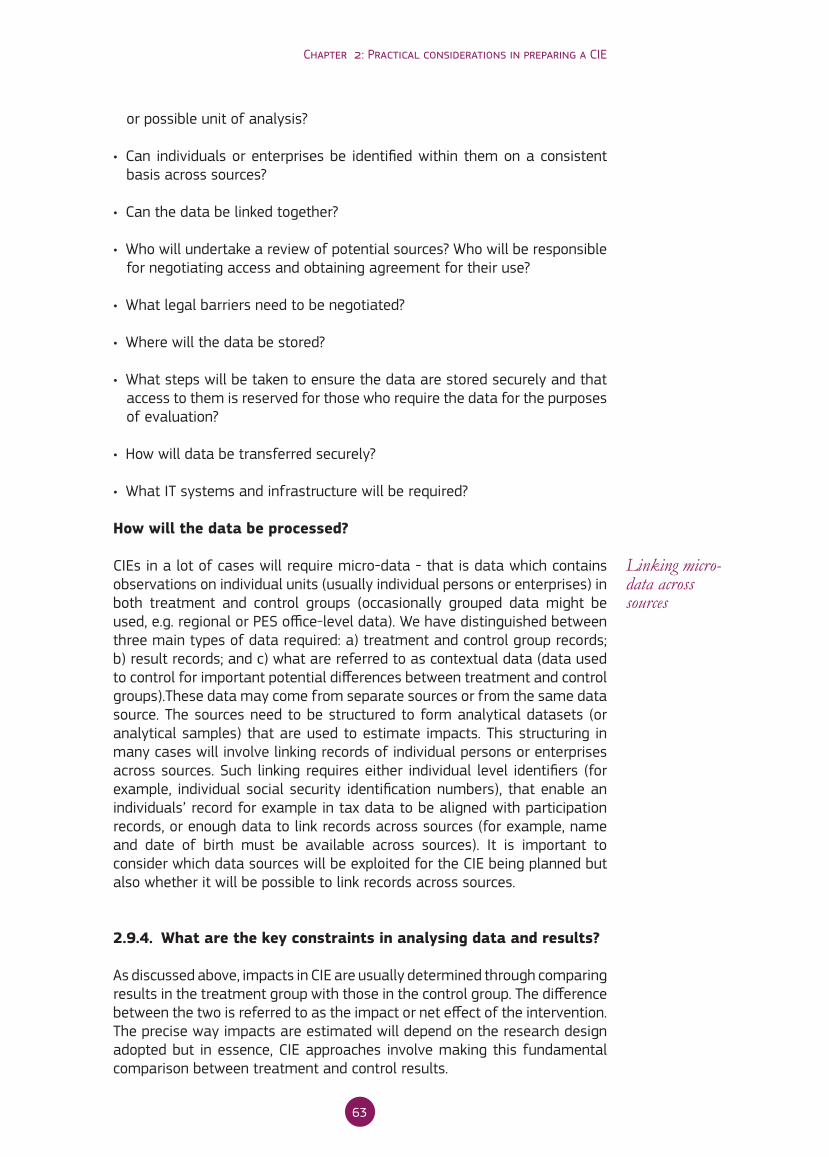
63
Chapter 2: Practical considerations in preparing a CIE
or possible unit of analysis?
• Can individuals or enterprises be identified within them on a consistent basis across sources?
• Can the data be linked together?
• Who will undertake a review of potential sources? Who will be responsible for negotiating access and obtaining agreement for their use?
• What legal barriers need to be negotiated?
• Where will the data be stored?
• What steps will be taken to ensure the data are stored securely and that access to them is reserved for those who require the data for the purposes of evaluation?
• How will data be transferred securely?
• What IT systems and infrastructure will be required?
How will the data be processed?
CIEs in a lot of cases will require micro-data - that is data which contains observations on individual units (usually individual persons or enterprises) in both treatment and control groups (occasionally grouped data might be used, e.g. regional or PES office-level data). We have distinguished between three main types of data required: a) treatment and control group records; b) result records; and c) what are referred to as contextual data (data used to control for important potential differences between treatment and control groups).These data may come from separate sources or from the same data source. The sources need to be structured to form analytical datasets (or analytical samples) that are used to estimate impacts. This structuring in many cases will involve linking records of individual persons or enterprises across sources. Such linking requires either individual level identifiers (for example, individual social security identification numbers), that enable an individuals’ record for example in tax data to be aligned with participation records, or enough data to link records across sources (for example, name and date of birth must be available across sources). It is important to consider which data sources will be exploited for the CIE being planned but also whether it will be possible to link records across sources.
2.9.4. What are the key constraints in analysing data and results?
As discussed above, impacts in CIE are usually determined through comparing results in the treatment group with those in the control group. The difference between the two is referred to as the impact or net effect of the intervention. The precise way impacts are estimated will depend on the research design adopted but in essence, CIE approaches involve making this fundamental comparison between treatment and control results.
Linking micro-data across sources
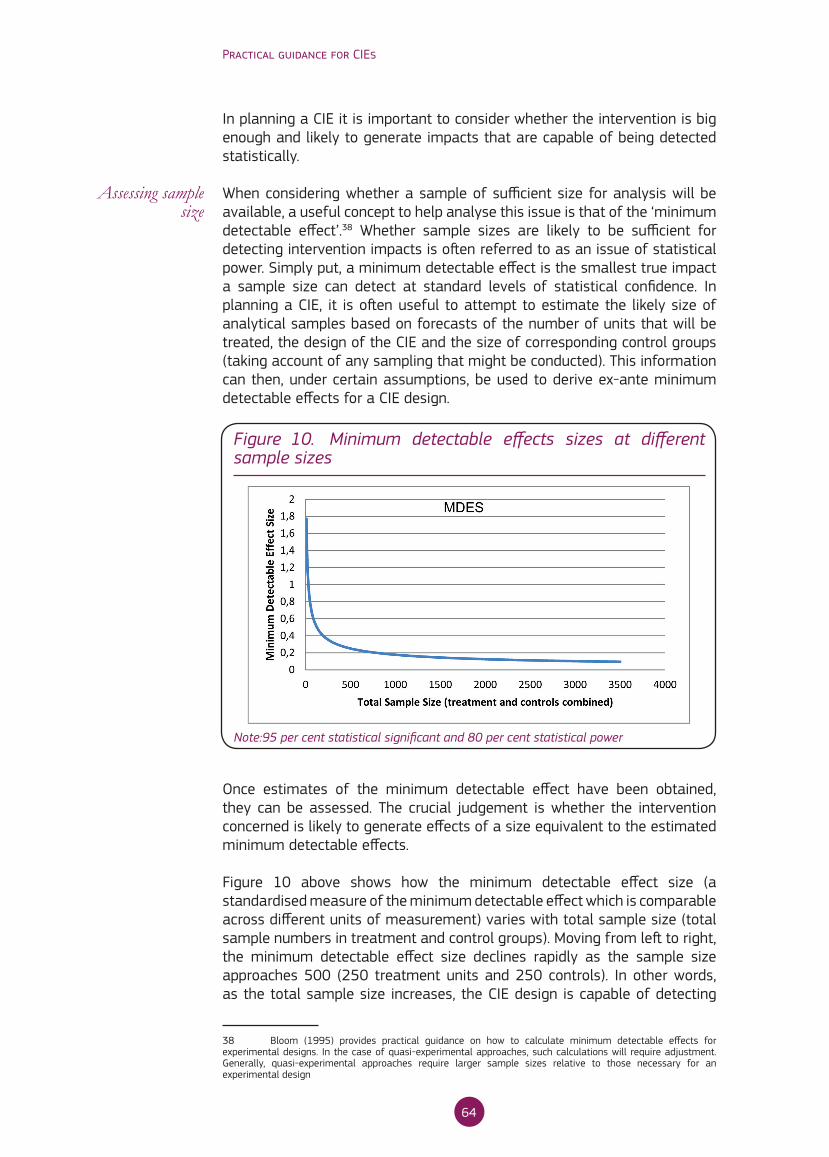
64
Practical guidance for CIEs
In planning a CIE it is important to consider whether the intervention is big enough and likely to generate impacts that are capable of being detected statistically.
When considering whether a sample of sufficient size for analysis will be available, a useful concept to help analyse this issue is that of the ‘minimum detectable effect’.38 Whether sample sizes are likely to be sufficient for detecting intervention impacts is often referred to as an issue of statistical power. Simply put, a minimum detectable effect is the smallest true impact a sample size can detect at standard levels of statistical confidence. In planning a CIE, it is often useful to attempt to estimate the likely size of analytical samples based on forecasts of the number of units that will be treated, the design of the CIE and the size of corresponding control groups (taking account of any sampling that might be conducted). This information can then, under certain assumptions, be used to derive ex-ante minimum detectable effects for a CIE design.
Once estimates of the minimum detectable effect have been obtained, they can be assessed. The crucial judgement is whether the intervention concerned is likely to generate effects of a size equivalent to the estimated minimum detectable effects.
Figure 10 above shows how the minimum detectable effect size (a standardised measure of the minimum detectable effect which is comparable across different units of measurement) varies with total sample size (total sample numbers in treatment and control groups). Moving from left to right, the minimum detectable effect size declines rapidly as the sample size approaches 500 (250 treatment units and 250 controls). In other words, as the total sample size increases, the CIE design is capable of detecting
38 Bloom (1995) provides practical guidance on how to calculate minimum detectable effects for experimental designs. In the case of quasi-experimental approaches, such calculations will require adjustment. Generally, quasi-experimental approaches require larger sample sizes relative to those necessary for an experimental design
Assessing sample size
Figure 10. Minimum detectable effects sizes at different sample sizes
Note:95 per cent statistical significant and 80 per cent statistical power

65
Chapter 2: Practical considerations in preparing a CIE
statistically smaller impacts. The data presented in Figure 10 assume a randomised design and are presented merely to illustrate this key point.
Part of the planning process for a CIE should involve forecasting the numbers of persons or enterprises that might be treated by the intervention concerned, the numbers that might be sampled for the evaluation and the size of the corresponding control group. Combined with information on how it is intended to estimate impacts, minimum detectable effects can be computed and judgements formed as to whether these are sufficient given the magnitude of impacts that might be expected. In order to perform such tasks, however, some provisional view as to the likely research design to be adopted will be required and it is advisable to seek the support of expert statisticians. In some cases, it may be possible to compare MDES with break-even effect sizes based on pre-intervention economic appraisals.
When analysing the results, it is important to keep in mind the intervention logic and the entire design of an intervention. Effects of some interventions may take time to materialize (see Box 14 and Figure 9). Some of the uncertainties in interpreting the results are explained in Box 16.
Forecasting the numbers treated
Among examples of evaluations of ESF-funded interventions, an evaluation of a training voucher in Lombardy found that initially it reduced the probability of employment. This is a typical finding for programmes that aim to enhance human capital, as they tend to divert participants away from job search in the short run (referred to as a ‘lock in’ period). However, this also suggests that care should be exercised in selecting time periods over which to measure results.
The Welsh evaluation, which looked at the impacts of ESF-funded interventions on leavers, revealed slightly positive impacts for some measures: 40 per cent of ESF leavers moved into employment within a period of 12 months after treatment, whereas the transition rate in the wider population was 38 per cent. However, it is not clear how to interpret these results. The control group against which ESF leavers were compared could have also received services, but no information about service receipt among the control group was available.
Examples of CIEs conducted in Italy have raised the issue of independence and objectivity in the measurement of programme results. In some contexts, this may be an important consideration in terms of the reliance that can be placed in findings. For CIEs to maintain their influence, they must be seen to be impartial, objective and independent. As a result, transparency in methodology and procedure are of critical importance, as is the public availability of anonymised micro-data in order to facilitate replication.
Box 16. Uncertainties in interpreting the results
66
Practical guidance for CIEs
2.10.1. How will the results be reported?
At the evaluation planning stage it is worth giving some early thought to how results from the evaluation might be disseminated. This is important because unless results are disseminated effectively and reach their intended audience, the evaluation will have little impact.
Dissemination of findings and evaluation outputs usually involves:
• At least one written evaluation report;
• At least one verbal presentation of findings;
• A technical report providing a thorough account of the methodology deployed, key assumptions made and the approach to statistical analyses adopted.
All evaluation reports need to be made public. This is a stipulation in the Common Provisions Regulation for the programming period 2014-2020.39 Therefore, it is important to think through a publication strategy, and particularly how to make sure stakeholders beyond the MA and MS learn of the findings. There will be other MS and MA with an interest in what has been found. Moreover, the European Commission will also want to see the results. It is also worth considering how difficult or unwelcome results will be handled. Policy makers often assume that interventions they are responsible for ‘work’ and that an evaluation will merely confirm this. Those commissioning a CIE must retain an open mind and be prepared for results which show that their intervention does not work and may not provide value for money.
39 Draft CPR; Art 47 (4)
Consider how results will be
reported

67
This guidance seeks to encourage and support MA in conducting more CIEs. To achieve this, it provides guidance to those who are responsible for planning and commissioning impact evaluations of ESF co-financed interventions. Thus far, the focus has been on planning a CIE and a number of key questions that require consideration have been discussed. There are, however, a number of other, ‘wider issues’ and challenges. Achieving the vision of more and better evaluation of ESF interventions requires, to some extent, a shift in culture. Although there are a number of MS where CIEs are undertaken and encouraged, it is also possible to detect a default position in other MS that CIEs are too complex and difficult to undertake from a practical perspective.
This section of the guidance puts forward some suggestions for tackling these ‘wider issues’. Specifically, steps to address the following are discussed:
• Lack of knowledge of CIE approaches within MA and among the wider MS policy making community;
• A lack of external, suitably qualified and experienced contractors within MS able to undertake CIEs;
• Addressing legal barriers that need to be confronted generically across CIEs; and
• Moving toward greater planning of CIE prospectively.
3.1. Improving levels of understanding among stakeholdersFor the programming period 2014 - 2020, the CPR40 stipulates that ‘Member States shall ensure that appropriate evaluation capacity is available’. Concern about a lack of capacity for conducting CIEs was raised at an Expert Hearing 40 Draft CPR Regulation; Art 49 (2)
Chapter 3
Moving the CIE agenda forward
68
Practical guidance for CIEs
that explored the use of CIE in evaluating ESF-interventions.41 Delegates at the Hearing identified a lack of understanding of CIE methods in many MA, despite some examples of good practice. This lack of capacity made it difficult for evaluators to conduct CIEs because sufficient, well-informed planning had not been carried out in advance.
There is a requirement to stimulate demand for CIE as well as supply, especially given the draft Regulations for the 2014 - 2020 period. Supply may respond as MA and MS start to commission CIEs, or make known their requirements to conduct such studies. The speed of response to increased demand for CIEs will depend on pre-existing skills, experience and the existence of institutions within the MS capable of implementing such approaches. However, in part, stimulating demand can be achieved by improving the knowledge and understanding of CIE methods among those working in MA.
One solution to this problem is for MA to run training courses in CIE methods for their staff. Training should focus on the benefits to MA of adopting CIE methods. Moreover, issues of accountability and learning what works should be stressed. A suggested course outline is provided at Annex 3.
3.2. Capacity developmentOne other issue raised during the Expert Hearing, and mentioned in the section above, was the need to develop capacity to conduct CIEs within MS research/academic/consultant communities. In some cases, it was apparent that the skills required to conduct CIEs were available within MS, but that those with the skills had faced barriers (such as limited access to useable data or problems in identifying a reasonable control group) to applying them within the context of evaluation.
There are a number of steps that can be taken to develop supply for evaluation services. Many of the issues raised applied equally to CIEs as to evaluations more generally. Three steps are commonly taken to improve evaluation supply:
• Build-up relationships with educational institutions, in particular universities;
• Develop and strengthen an independent community of consultants; and
• Support the development of a professional evaluation community.
Universities
Developing links with universities is important for two reasons. First, academic staff at universities may possess the skills and knowledge required to conduct CIEs. For example, many micro-economists, econometricians, quantitative sociologists or psychologists have the types of skills necessary 41 At an Expert Hearing organised by the European Commission and held on 25thOctober 2011, representatives from eight Member States (MS) and evaluation experts presented examples of counterfactual impact evaluations (CIEs) of ESF co-financed interventions.
Stimulate demand and
supply of CIE
Developing training in CIE
methods
Strengthening institutions
and building communities
Developing academic skills
69
Chapter 3: Moving the CIE agenda forward
to conduct CIEs. In many MS the skills required may be available but those with the skills have not previously thought to apply them to the evaluation of interventions. There may be a lack of incentive for them to do so that will need to be addressed.
In some MS there is a tradition of academic researchers actively engaging in applied policy research. In this setting, academics will be familiar with working with government and MA. In other MS where universities and academics are not as engaged in applied work, a culture change may be required. One successful method of developing a supplier base within the university sector, is for MS authorities and MA to core-fund the costs of dedicated research centres in CIE methods.
Second, universities and academics can also play a role in training the next generation of evaluators whom they are educating. When working closely with universities, it may be possible to encourage them to include programme evaluation methods within their curricula, and as part of this development, ensure CIE methods are covered within teaching programmes. In some MS, universities may also have a role in running continued professional development courses on impact evaluation and CIE methods. This can be aimed at policymakers, technical specialists within MA, as well as other potential suppliers such as independent consultants. MS might consider providing funding for such training.
Independent consultants
For some forms of evaluation, large in scale, there is an international market. This is certainly the case for large CIEs. However, many MS will want to develop domestic capacity to conduct CIEs. One strategy toward achieving this can be through establishing strategic alliances between potential domestic suppliers and international consultancies.
Several suggestions for developing a domestic supplier base to undertake CIEs are set out below, that may be applied by MA (or other bodies) commissioning CIE:
• Insisting on consortia or partnership bids that always include some local consultants;
• Scaling evaluation contracts in ways that relatively small, low-risk evaluations can be undertaken by new, national entrants to the evaluation market;
• Ensuring that technical and financial requirements associated with bidding for evaluations are not too restrictive;
• Emphasising technical and know-how criteria rather than complex administrative procedures with which less experienced consultants may not be familiar;
• Holding briefing meetings with potential consultants to answer questions and encourage bids in a competitive environment;
Training the next generation
Developing the market
70
Practical guidance for CIEs
• Support for networking among relatively isolated evaluation consultants so as to encourage team-building, consortia formation and other professional networks and associations, and
• Acknowledgement by evaluation commissioners that they may need to take a more hands-on management of new contractors to speed up their acquisition of knowledge and experienced.
Professional community
It is important to develop a professional evaluation community within MS. Within MS’s evaluation communities, there should be explicit space for the discussion of CIE methods and for the sharing of experience. The development of professional communities is important for mutual support and learning but also for the maintenance of quality standards. A useful strategy could be to develop links with the relevant national evaluation societies and encourage them to promote CIEs through either training events, specific conferences or seminars, or awareness raising sessions.
Sharing experience
The EC is keen for more rigorous ESF impact evaluations to be conducted,42 and CIE has been widely recommended. However, at present, there are only a limited number of examples available across Member States. Thus, sharing experience on the application of CIE methods is one of the foremost means to develop capacities and support and spread the use of CIE throughout EU 27. Existing forums of mutual learning in labour market policies and social inclusion such as peer reviews of employment and social inclusion policies and communities of practice within ESF should be utilised for this purpose.
3.3. Confronting legal barriersOne of the most significant and substantial problems encountered by researchers conducting CIEs across MS is gaining access to data. In particular, researchers regularly encounter legal barriers that aim to protect the confidentiality of persons represented in data sets. The answer to addressing these issues lies not in tackling them on a case by case basis, but by undertaking wider reforms that enables the relevant data to be made available to evaluators in a controlled manner, on an on-going basis.
For example, analytical versions of administrative data sets could be constructed on a regular basis from data that are held by MS authorities, documented and deposited in an archive with controlled access. Approved contractors can extract data from such holdings under licence. Data would be fully anonymised with encrypted personal identifiers. Data holdings like this were created in Austria for the ESF programming period 2000-2006. The Danish MA has also constructed a data base of intervention participant data for the programming period 2007-2013.
42 Annex IV of the draft CPR Regulation for the 2014 – 2020 period asks for an „effective system of result indicators necessary to monitor progress towards results and to undertake impact evaluations. Furthermore the draft guidelines for ESF in the 2014-2020 programming period strongly advocate the use of impact evaluation
Developing professional communities
Utilizing existing fora
Removing legal barriers to data
access
Creating analytical
datasets
71
Chapter 3: Moving the CIE agenda forward
If concerns over confidentiality of personal data persist, consideration might be given to the establishment of data labs. Here evaluators working on administrative data sets would be given access to records only at secure locations, where access to data is strictly monitored and controlled. Data would have to be processed and analysed at these locations, and only results of any analyses could be taken-away.
3.4. Moving toward more prospective approachesA common feature of the small number of CIEs conducted of ESF-financed interventions to date is that they have been retrospective in nature rather than prospective. What is meant by this is that expert evaluators have been commissioned to conduct evaluations of interventions that have been developed without any consideration of evaluation, and in some circumstances where little or no planning for an impact evaluation has taken place. This means that evaluators have had to construct data sources in time-consuming, expensive and sub-optimal ways, responding to the data that happen to be available, rather than data sources constructed with impact evaluation in mind.
In contrast, a prospective approach would comprise involving evaluators in planning for a CIE at the earliest opportunity and would enable interventions (either new or existing) to be influenced, in often quite subtle ways, making them more amenable to CIE. Planning in advance for a CIE can mean the difference between being able to conduct a rigorous evaluation and not being able to do so at all. Involving either appropriately trained internal staff or engaging external expert contractors early in the life of an intervention or when funding decisions are being made means that:
• Appropriate recordkeeping can be integrated into the delivery of programmes and interventions;
• Requisite data sources can be identified early and access and data protection issues dealt with in good time;
• Baseline data collection can be specified and surveys administered if required;
• Practical issues relating to how participants are recruited into interventions can be addressed in ways which mean that recruitment processes are more consistent with rigorous evaluation.
The involvement of evaluators trained in CIE methods (be they internal MA evaluators or externally commissioned experts) in the process of developing new interventions, or in decisions concerning which existing interventions might be funded through ESF, can reap significant benefits, as well as enable planning for impact evaluation to commence at the earliest opportunity.
Creating data labs
Prospective approaches


73
4.1. AcronymsALMP Active labour market policy
CAV Community Added Value
CBA Cost-benefit analysis
CIE Counterfactual impact evaluation
CPR Common Provision Regulation
DG EMPL Directorate-General for Employment, Social Affairs and Inclusion
DG REGIO Directorate General for Regional Policy
DiD Difference in difference/s
EC European Commission
EES European Employment Strategy
ESF European Social Fund
ERA UK Employment Retention and Advancement demonstration project
EU European Union
IB Intermediate body/ies
IV Instrument variable
LFS Labour Force Survey
Glossaries

74
Practical guidance for CIEs
LLE Lithuanian Labour Exchange
MA Managing Authority/ies
MS Member State/s
NGOs Non-governmental Organisations
OP Operational programme/s
PES Public Employment Service/s
PLO Poviat Labour Offices
PSM Propensity score matching
RCT Randomised control trial
RDD Regression discontinuity design
SF Structural Funds
SME Small and medium sized enterprises
SODRA The State Social Insurance Fund Board under the Ministry of Social Security and
Labour of the Republic of Lithuania
75
Glossaries
4.2. DefinitionsTerm Definition
Baseline indicator Indicator measured prior to a unit (individual or enterprise) being exposed to an intervention. In many cases pre-treatment measures of intervention results will be collected for both treatment and control groups.
Beneficiary According to Art. 2(4) of Council Reg. (EC) No 1083/20061 "an operator, body or firm, whether public or private, responsible for initiating or initiating and implementing operations. In the context of aid schemes under Article 87 of the Treaty, beneficiaries are public or private firms carrying out an individual project and receiving public aid". Beneficiary can e.g. be an NGO implementing an ESF-funded project providing services for final recipients (participants).
Control group A group of persons, enterprises or other units, that is as similar as possible to the treatment group, but who remain untreated, and from which counterfactual estimates of results are obtained.
Counterfactual analysis A comparison between what actually happened and what would have happened in the absence of the intervention. It encompasses all approaches aiming to assess the proportion of observed change which can be attributed to the evaluated intervention.
Difference-in-differences (DiD)
In its simplest form the difference in a result before and after treatment in a control group is subtracted from the same difference observed among a treated group in order to obtain an estimate of an intervention’s impact. Impacts calculated on the basis of difference-in-differences are usually derived within a regression framework.
(1) COUNCIL REGULATION (EC) No 1083/2006 of 11 July 2006 laying down general provisions on the European Regional Development Fund, the European Social Fund and the Cohesion Fund and repealing Regulation (EC) No 1260/1999
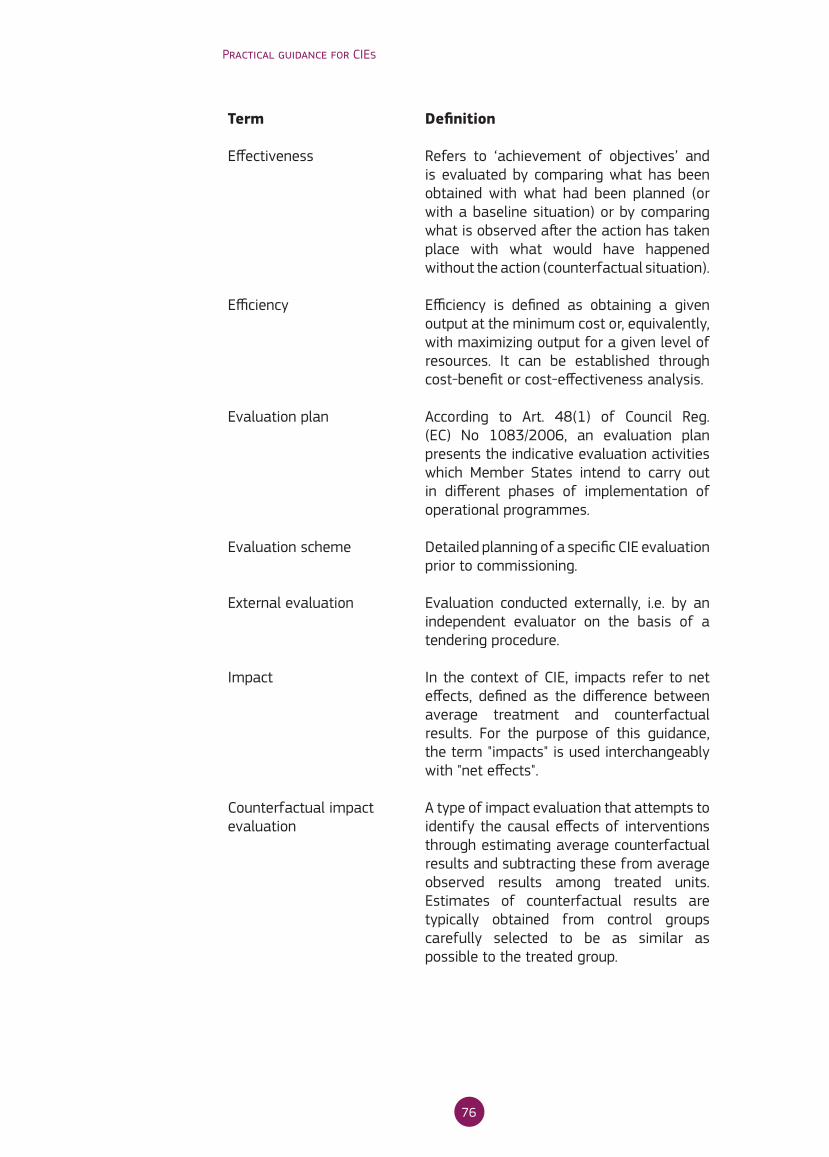
76
Practical guidance for CIEs
Term Definition
Effectiveness Refers to ‘achievement of objectives’ and is evaluated by comparing what has been obtained with what had been planned (or with a baseline situation) or by comparing what is observed after the action has taken place with what would have happened without the action (counterfactual situation).
Efficiency Efficiency is defined as obtaining a given output at the minimum cost or, equivalently, with maximizing output for a given level of resources. It can be established through cost-benefit or cost-effectiveness analysis.
Evaluation plan According to Art. 48(1) of Council Reg. (EC) No 1083/2006, an evaluation plan presents the indicative evaluation activities which Member States intend to carry out in different phases of implementation of operational programmes.
Evaluation scheme Detailed planning of a specific CIE evaluation prior to commissioning.
External evaluation Evaluation conducted externally, i.e. by an independent evaluator on the basis of a tendering procedure.
Impact In the context of CIE, impacts refer to net effects, defined as the difference between average treatment and counterfactual results. For the purpose of this guidance, the term "impacts" is used interchangeably with "net effects".
Counterfactual impact evaluation
A type of impact evaluation that attempts to identify the causal effects of interventions through estimating average counterfactual results and subtracting these from average observed results among treated units. Estimates of counterfactual results are typically obtained from control groups carefully selected to be as similar as possible to the treated group.

77
Glossaries
Term Definition
Instrument variable approach (IV)
The selection into treatment should be at least partially determined by an exogenous factor (or instrument) which is unrelated to results other than through the treatment. Thus, the exogenous factor influences participation, but not directly the results.
Internal evaluation Evaluation conducted internally, i.e. directly commissioned from an independent public institution or unit (from the MA or IB) without a tendering process or in the form of an extended monitoring and analysis process.
Interventions Refer generally to operations in ESF Operational programmes or to projects co-financed by ESF.
Matching Intervention and control samples are matched to each other on the basis of their observed characteristics.
Non-randomized or quasi-experimental design
Approaches to counterfactual impact evaluation where control groups are constructed using methods other than randomisation.
Output Relates to operations supported by ESF. An output is considered everything that is obtained in exchange for an operation supported by public expenditures. Outputs can be measured at the level of people, as well as entities.
Participants Refer to 'Final recipients' (i.e people) in supported ESF interventions.2
Process evaluation Process evaluation focuses on programme implementation, including, but not limited to how services are delivered, differences between the intended population and the population served, access to the programme and management practices.
(2) European Commission (2012): Monitoring and Evaluation of European Cohesion Policy. European Social Funds. Programming Period 2014 - 2020.Guidance document. Draft (March 2012)
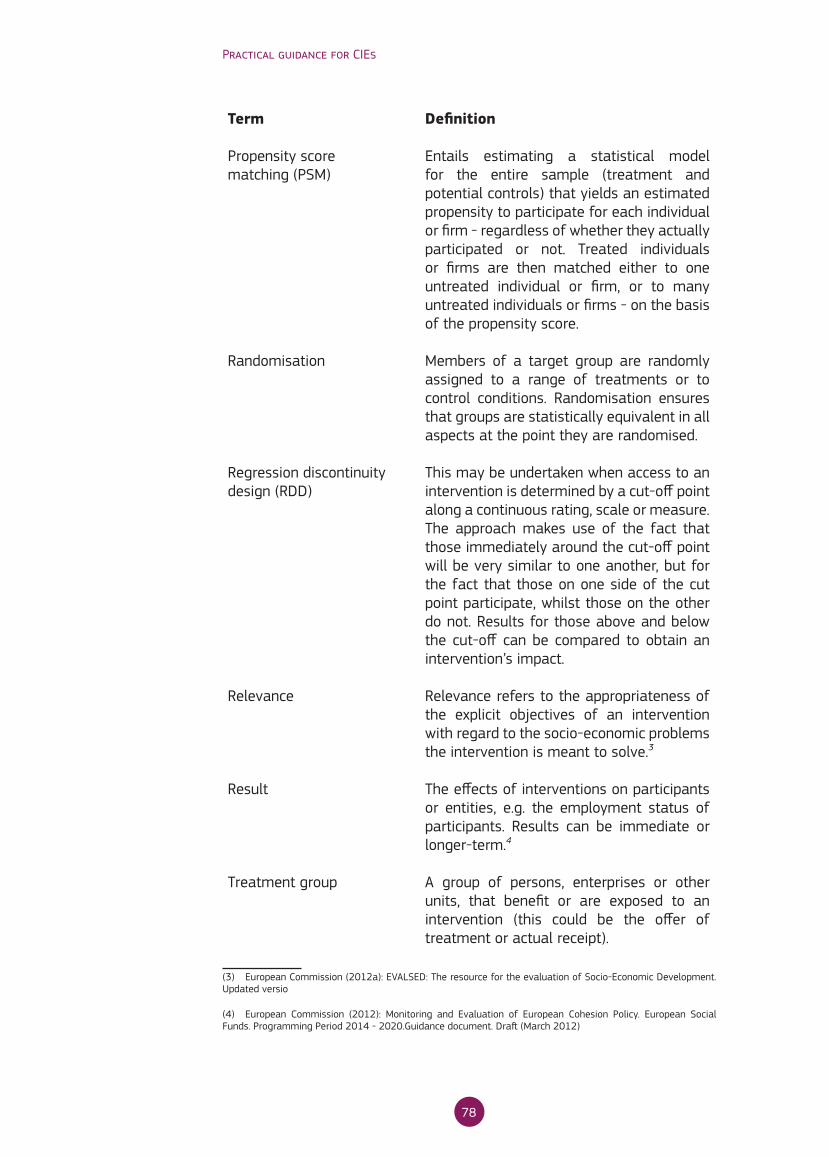
78
Practical guidance for CIEs
Term Definition
Propensity score matching (PSM)
Entails estimating a statistical model for the entire sample (treatment and potential controls) that yields an estimated propensity to participate for each individual or firm - regardless of whether they actually participated or not. Treated individuals or firms are then matched either to one untreated individual or firm, or to many untreated individuals or firms - on the basis of the propensity score.
Randomisation Members of a target group are randomly assigned to a range of treatments or to control conditions. Randomisation ensures that groups are statistically equivalent in all aspects at the point they are randomised.
Regression discontinuity design (RDD)
This may be undertaken when access to an intervention is determined by a cut-off point along a continuous rating, scale or measure. The approach makes use of the fact that those immediately around the cut-off point will be very similar to one another, but for the fact that those on one side of the cut point participate, whilst those on the other do not. Results for those above and below the cut-off can be compared to obtain an intervention’s impact.
Relevance Relevance refers to the appropriateness of the explicit objectives of an intervention with regard to the socio-economic problems the intervention is meant to solve.3
Result The effects of interventions on participants or entities, e.g. the employment status of participants. Results can be immediate or longer-term.4
Treatment group A group of persons, enterprises or other units, that benefit or are exposed to an intervention (this could be the offer of treatment or actual receipt).
(3) European Commission (2012a): EVALSED: The resource for the evaluation of Socio-Economic Development. Updated versio
(4) European Commission (2012): Monitoring and Evaluation of European Cohesion Policy. European Social Funds. Programming Period 2014 - 2020.Guidance document. Draft (March 2012)

79
Ashenfelter, O (1978) Estimating the effect of training programmes on earnings, Review of Economics and Statistics, 6, pages 47-57
Bloom, H. S. (2009) Modern regression discontinuity analysis, MDRC Working Papers on Research Methodology, New York: MDRC, (http://www.mdrc.org/publications/539/full.pdf)
Bloom, H. S. (1995) Minimum detectable effects: A simple way to report the statistical power of experimental designs, Evaluation Review, 8(2), 225-246
Bloom, H. S. (1984) Accounting for no-shows in experimental evaluation designs, Evaluation Review, 8, 225-246
Bryson, A., Dorsett, R. and Purdon, S. (2002) The use of propensity score matching in the evaluation of active labour market policies, Department for Work and Pensions, Working Paper Number 4.
Caliendo, M. and Kopeinig, S. (2005) Some practical guidance for the implementation of propensity score matching, Discussion Paper No. 1588, Bonn: IZA
Card, D., Ibarraran, P. and Villa, J. M. (2011) Building in an evaluation component for active labour market programs: a practitioner’s guide, Discussion Paper No. 6085, Bonn, German: IZA
European Commission (2006) Council Regulation No 1828/2006 of 8 December 2006 setting out rules for the implementation of Council Regulation (EC) No 1083/2006 laying down general provisions on the European Regional Development Fund, the European Social Fund and the Cohesion Fund and of Regulation (EC) No 1080/2006 of the European Parliament and of the Council on the European Regional Development Fund
Bibliography

80
Practical guidance for CIEs
European Commission (2006): Council Regulation (EC) no 1083/2006 laying down general provisions on the European Regional Development Fund, the European Social Fund, the Cohesion Fund and repealing Regulation (EC) No 1260/1999
European Commission (2007): Indicative Guidelines on evaluation methods: evaluation during the programming period. Working paper no. 5. DG Regional Policy
European Commission (2008): ‘Indicative Guidance on ESF Evaluation Quality Standards. DG EMPL, Evaluation Unit
European Commission (2009) EVALSED: The resource for the evaluation of socio-economic development: (http://ec.europa.eu/regional_policy/sources/docgener/evaluation/evalsed/guide/index_en.htm)
European Commission (2010): Fifth Report on Economic, Social and Territorial Cohesion
European Commission, (2011) COM 2011. 615 final: Proposal for a Regulation of the European Parliament and of the Council laying down common provisions on the European Regional Development Fund, the European Social Fund, the Cohesion Fund, the European Agricultural Fund for Rural Development and the European Maritime and Fisheries Fund covered by the Common Strategic Framework and laying down general provisions on the European Regional Development Fund, the European Social Fund and the Cohesion Fund and repealing Regulation (EC) No 1083/2006; Brussels, 6.10.2011
European Commission (2011a): The Programming Period 2014 - 2020: Monitoring and Evaluation of European Cohesion Policy - ERDF and Cohesion funds. Concepts and recommendations. Draft guidance document. October 2011
European Commission (2012): Monitoring and Evaluation of European Cohesion Policy. European Social Funds. Programming Period 2014 - 2020.Guidance document. Draft (March 2012)
European Commission (2012a): EVALSED: The resource for the evaluation of Socio-Economic Development. Updated version
Frolich, M (2004) Programme evaluation with multiple treatments, Journal of Economic Surveys, 18(2), pages 181-224
Hagglund, P (2006) A description of three randomised experiments in Swedish labour market policy, Institute for Labour Market Policy Evaluation, Report 2006: 4 http://ifauweb.webhotel.qd.se/Upload/pdf/se/2006/r06-04.pdf
Heckman, J. J., Ichimura, H., Smith, J. and Todd, P. (1998) Characterizing selection bias using experimental data, National Bureau of Economic Research Working Paper 6699, Cambridge Massachusetts: NBER

81
Bibliography
HM Treasury (2011) The Magenta Book: Guidance for Evaluation, London: HM Treasury
Holland, P (1986) Statistics and Causal Inference, Journal of the American Statistical Association, 81 (396), 945-960
Krug, G and Stephan, G. (2011) Is contracting-out intensified placement services more effective than in-house production? Evidence from a randomized field experiment, LASER Discussion Papers - Paper No. 5, http://doku.iab.de/externe/2011/k110912303.pdf
Kuhn, Andreas, Jean-Philippe Wuellrich, and Josef Zweimüller. 2010. Fatal Attraction? Access to Early Retirement and Mortality. IZA Discussion Paper No. 5160. Bonn: Forschungsinstitut zur Zukunft der Arbeit
Martini, A. (2009) Counterfactual impact evaluation: what it can (and cannot) do for cohesion policy, prepared for the 6th European Conference on Evaluation of Cohesion Policy, Warsaw, November 30th.
Morgan, S. L. and Winship, C. (2007) Counterfactual and causal inference: Methods and principles for social research, New York: Cambridge University Press.
Naylon et al (2011): ESF Expert Evaluation Network. Synthesis Report. Final Report to Contract No VC/2010/0153Pawson, Metis GmbH, Vienna
Pawson R, and Tilley, N. (1997) Realistic evaluation, London: Sage Publications
Public Policy and Management Institute (2012): Evaluation of social integration services for socially vulnerable and socially excluded individuals for the effective use of the EU structural assistance for the period of 2007-2013
Rossi, P. H., Lipsey, M. W. and Freeman, H. E. (2004) Evaluation: A systematic approach, (7th edition), Thousand Oaks: Sage Publications
Riccio J, Friedlander, D. And Freedman S. (1994) GAIN: Benefits, Costs, and Three-Year Impacts of a Welfare-to-Work Program, MDRC, NYC http://www.mdrc.org/publications/175/full.pdf
Shadish, W. R., Cook, T. D. and Campbell, D. T. (2002) Experimental and quasi-experimental designs for generalised causal inference, Boston, US: Houghton Mifflin Company
WK Kellog Foundation (2004) Logic Model Development Guide


83
Annexes
Annex 1. Further readingsThe following are suggested readings for Managing Authority personnel interested in more detail around issues touched upon in this Guidance. The literature on evaluation is vast. This list is intended to point to reliable major discussions that provide immediately useful information for CIE planning. After each citation a short description of most sources is provided.
General Evaluation
• Gertler, Paul J., Sebastian Martinez, Patrick Premand, Laura B. Rawlings, and Christel M. J. Vermeersch. 2011. Impact Evaluation in Practice. Washington: The World Bank. (Available in English, French, and Spanish.)
Like the present Guidance, this handbook begins with classical (RCT) evaluation and then considers alternatives. While written for programme managers in lower-income countries, the discussion is relevant and readily applicable in EU Member State context.
• HM Treasury (United Kingdom). 2006. The Green Book: Appraisal and Evaluation in Central Government. London: The Agency. URL: http://www.hm-treasury.gov.uk/d/green_book_complete.pdf.
• HM Treasury (United Kingdom). 2011. The Magenta Book: Guidance for evaluation. London:
The Agency. URL: http://www.hm-treasury.gov.uk/d/magenta_book_combined.pdf.
The “Green” book discusses the place of evaluation in what the Treasury calls the “policy cycle”. The “Magenta” book provides detail on evaluation methodology. These documents are interesting as examples of within-government evaluation perspective.
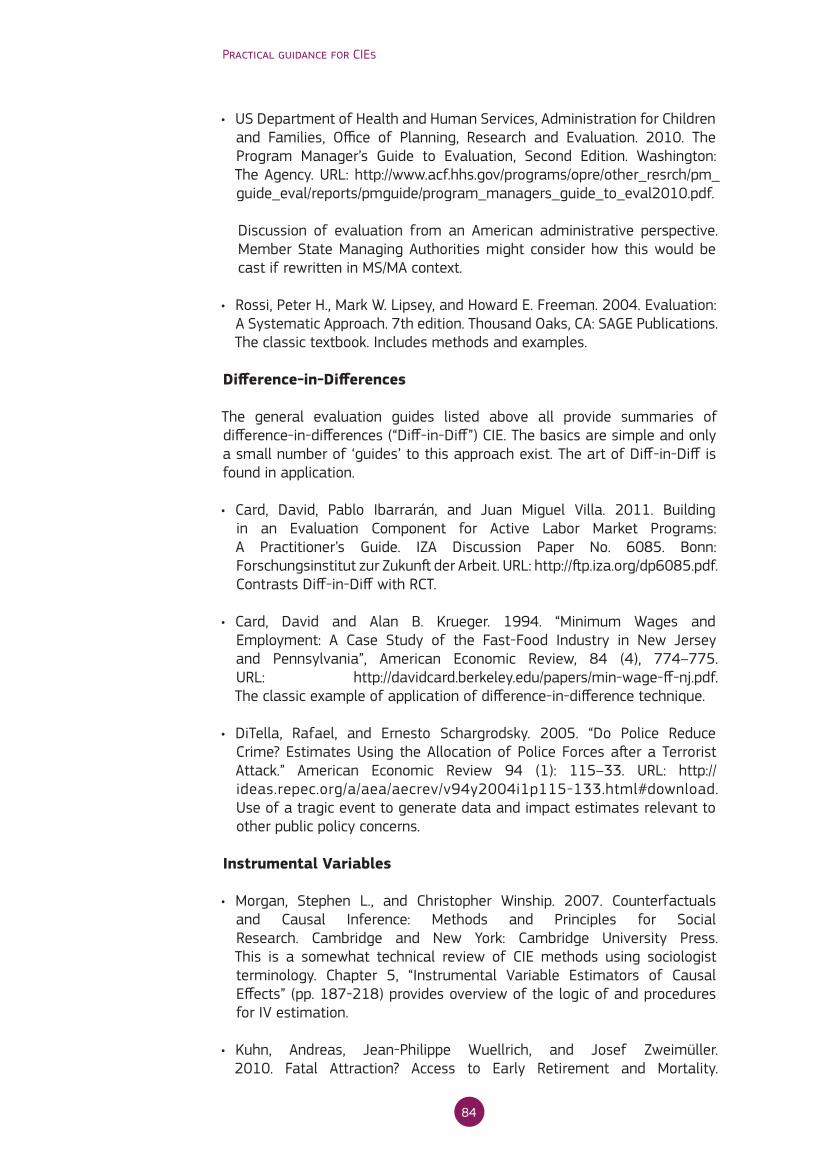
84
Practical guidance for CIEs
• US Department of Health and Human Services, Administration for Children and Families, Office of Planning, Research and Evaluation. 2010. The Program Manager’s Guide to Evaluation, Second Edition. Washington: The Agency. URL: http://www.acf.hhs.gov/programs/opre/other_resrch/pm_guide_eval/reports/pmguide/program_managers_guide_to_eval2010.pdf.
Discussion of evaluation from an American administrative perspective. Member State Managing Authorities might consider how this would be cast if rewritten in MS/MA context.
• Rossi, Peter H., Mark W. Lipsey, and Howard E. Freeman. 2004. Evaluation: A Systematic Approach. 7th edition. Thousand Oaks, CA: SAGE Publications. The classic textbook. Includes methods and examples.
Difference-in-Differences
The general evaluation guides listed above all provide summaries of difference-in-differences (“Diff-in-Diff”) CIE. The basics are simple and only a small number of ‘guides’ to this approach exist. The art of Diff-in-Diff is found in application.
• Card, David, Pablo Ibarrarán, and Juan Miguel Villa. 2011. Building in an Evaluation Component for Active Labor Market Programs: A Practitioner’s Guide. IZA Discussion Paper No. 6085. Bonn: Forschungsinstitut zur Zukunft der Arbeit. URL: http://ftp.iza.org/dp6085.pdf. Contrasts Diff-in-Diff with RCT.
• Card, David and Alan B. Krueger. 1994. “Minimum Wages and Employment: A Case Study of the Fast-Food Industry in New Jersey and Pennsylvania”, American Economic Review, 84 (4), 774–775. URL: http://davidcard.berkeley.edu/papers/min-wage-ff-nj.pdf. The classic example of application of difference-in-difference technique.
• DiTella, Rafael, and Ernesto Schargrodsky. 2005. “Do Police Reduce Crime? Estimates Using the Allocation of Police Forces after a Terrorist Attack.” American Economic Review 94 (1): 115–33. URL: http://ideas.repec.org/a/aea/aecrev/v94y2004i1p115-133.html#download. Use of a tragic event to generate data and impact estimates relevant to other public policy concerns.
Instrumental Variables
• Morgan, Stephen L., and Christopher Winship. 2007. Counterfactuals and Causal Inference: Methods and Principles for Social Research. Cambridge and New York: Cambridge University Press. This is a somewhat technical review of CIE methods using sociologist terminology. Chapter 5, “Instrumental Variable Estimators of Causal Effects” (pp. 187-218) provides overview of the logic of and procedures for IV estimation.
• Kuhn, Andreas, Jean-Philippe Wuellrich, and Josef Zweimüller. 2010. Fatal Attraction? Access to Early Retirement and Mortality.

85
Annex
IZA Discussion Paper No. 5160. Bonn: Forschungsinstitut zur Zukunft der Arbeit. URL: http://ftp.iza.org/dp5160.pdf. Uses regional variation in change in retirement age in Austria as instrumental variable in study of the effect of early retirement on worker health.
Matching
• Heinrich, Carolyn, Alessandro Maffioli, and Gonzalo Vázquez. 2010. A Primer for Applying Propensity-Score Matching. Impact-Evaluation Guidelines Technical Notes No. IDB-TN-161. Washington: Inter-American Development Bank. http://idbdocs.iadb.org/wsdocs/getdocument.aspx?docnum=35320229. Like the regression discontinuity guide below, this is written to benefit knowledgeable evaluation managers.
Randomised Controlled Trials
• Haynes, Laura, Owain Service, Ben Goldacre, and David Torgerson. 2012. Test, Learn, Adapt: Developing Public Policy with Randomised Controlled Trials. London: Cabinet Office. URL: http://www.cabinetoffice.gov.uk/sites/default/files/resources/TLA-1906126.pdf. The case for small RCTs as an essential instrument of management—for once, not by economists!
Regression Discontinuity Analysis
• Jacob, Robin, Pei Zhu, Marie-Andrée Somers, and Howard Bloom. 2012. A Practical Guide to Regression Discontinuity. New York: MDRC. URL: http://www.mdrc.org/publications/644/full.pdf. Exceptionally accessible and thorough discussion of recession discontinuity methodology that includes a carefully selected bibliography

86
Practical guidance for CIEs
Annex 2. UK Treasury guidelines for expenditure on evaluation
The UK HM Treasury (2011) provides a useful checklist of factors to consider in drawing up a budget for an evaluation. This advice does not relate to CIEs specifically but is still relevant in determining how much to set aside. These factors are:
• Innovation and risk - where interventions are innovative and/or high risk a large scale evaluation will be appropriate and therefore costs will be higher than in the case where the intervention being evaluated is more routine.
• Scale, value and profile - large scale expensive interventions require wide ranging and rigorous evaluations that again are likely to be more resource intensive than those required for lower profile, small scale activities where less programme resources are being committed.
• Pilots - where interventions are being tested in limited circumstances - restricted to a particular region or group of participants - where the objective is to determine whether the intervention should be rolled-out more widely, CIEs are likely to be more comprehensive and intensive, requiring in turn greater expenditure.
• Generalisability - if a test of the effectiveness of an intervention is likely to have wide applicability and generate interest within the MS and beyond there is clearly scope for a more exhaustive CIE and therefore one which is more expensive to conduct. In such circumstances it may be appropriate to seek partners who can contribute funding.
• Influence - some evaluations will be particularly pertinent in terms of the future development of policy justifying a greater allocation of resources.
• Uncertainty/variability - if the impact of an intervention are a priori uncertain and its effect complex and variable then again greater resources might be justified
Evidence - related to some of the previous points, an evaluation of an intervention for which there is little existing evidence of its effectiveness may be required to be more comprehensive and far reaching than is the case where there are already substantial bodies of evidence as to the effectiveness of similar interventions.

87
Annex
Annex 3. Suggested CIE course outlineAn introductory course in CIEs might cover the following:
• Introduction to evaluation approaches
• What are CIEs? What do they seek to achieve? How do they work?
• Why are CIEs important?
• Overview of methodologies:
• Randomised control trial - Two-group pre/post-test design - Matching - Difference-in-difference
• Overview of implementation steps: - Planning CIEs - Commissioning CIEs - Managing CIEs - Dissemination of findings from CIEs
A course structured as above would last in the region of 2-3 days.
One approach to delivering a course such as this would be to adopt a problem-based learning methodology. Here those attending the course are asked to bring with them examples of CIEs they are working on or in the process of commissioning. They are asked to present details of the CIE. As the course progresses the exemplar CIEs are used to illustrate the issues and challenges covered in course materials.
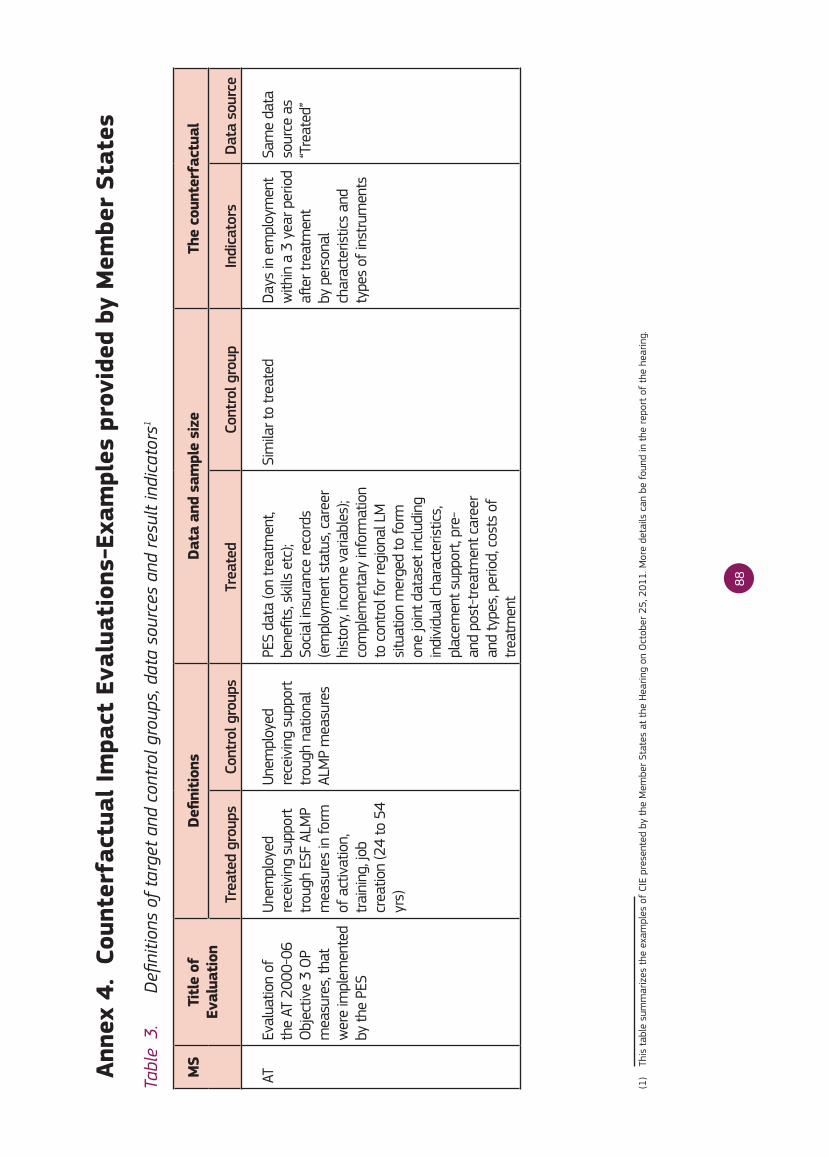
88
Anne
x 4.
Cou
nter
fact
ual I
mpa
ct E
valu
atio
ns-E
xam
ples
pro
vide
d by
Mem
ber
Stat
es
MS
Titl
e of
Ev
alua
tion
Defin
ition
sDa
ta a
nd s
ampl
e si
zeTh
e co
unte
rfac
tual
Trea
ted
grou
psCo
ntro
l gro
ups
Trea
ted
Cont
rol g
roup
Indi
cato
rs
Data
sou
rce
AT
Eval
uatio
n of
th
e AT
200
0-06
O
bjec
tive
3 O
P m
easu
res,
that
w
ere
impl
emen
ted
by th
e PE
S
Unem
ploy
ed
rece
ivin
g su
ppor
t tr
ough
ESF
ALM
P m
easu
res
in fo
rm
of a
ctiv
atio
n,
trai
ning
, job
cr
eatio
n (2
4 to
54
yrs)
Unem
ploy
ed
rece
ivin
g su
ppor
t tr
ough
nat
iona
l AL
MP
mea
sure
s
PES
data
(on
trea
tmen
t, be
nefit
s, sk
ills
etc)
; So
cial i
nsur
ance
reco
rds
(em
ploy
men
t sta
tus,
care
er
hist
ory,
inco
me
varia
bles
); co
mpl
emen
tary
info
rmat
ion
to c
ontr
ol fo
r reg
iona
l LM
si
tuat
ion
mer
ged
to fo
rm
one
join
t dat
aset
incl
udin
g in
divi
dual
cha
ract
eris
tics,
pl
acem
ent s
uppo
rt, p
re-
and
post
-tre
atm
ent c
aree
r an
d ty
pes,
perio
d, c
osts
of
trea
tmen
t
Sim
ilar t
o tr
eate
dDa
ys in
em
ploy
men
t w
ithin
a 3
yea
r per
iod
after
trea
tmen
t by
per
sona
l ch
arac
teris
tics
and
type
s of
inst
rum
ents
Sam
e da
ta
sour
ce a
s “T
reat
ed”
Tabl
e 3.
D
efini
tions
of
targ
et a
nd c
ontr
ol g
roup
s, d
ata
sour
ces
and
resu
lt in
dica
tors
1
(1)
This
tab
le s
umm
ariz
es t
he e
xam
ples
of
CIE
pres
ente
d by
the
Mem
ber
Stat
es a
t th
e H
earin
g on
Oct
ober
25,
201
1. M
ore
deta
ils c
an b
e fo
und
in t
he r
epor
t of
the
hea
ring.
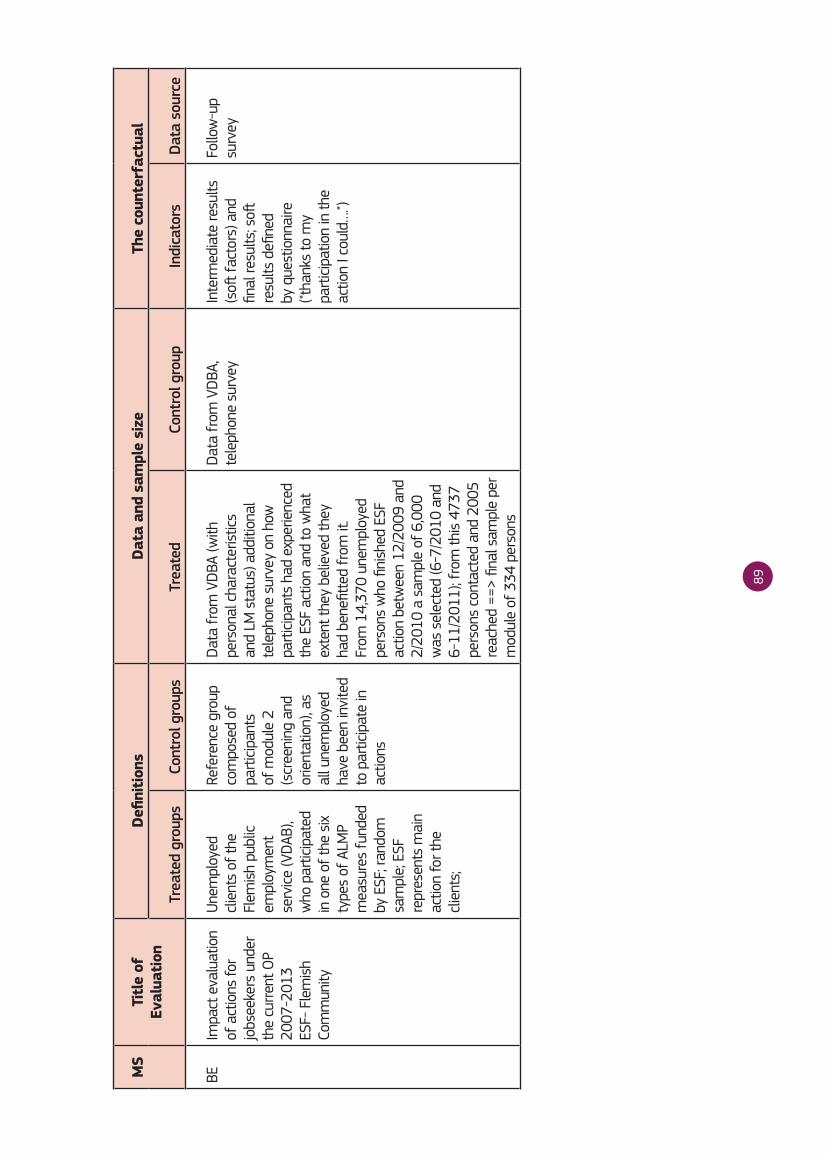
89
MS
Titl
e of
Ev
alua
tion
Defin
ition
sDa
ta a
nd s
ampl
e si
zeTh
e co
unte
rfac
tual
Trea
ted
grou
psCo
ntro
l gro
ups
Trea
ted
Cont
rol g
roup
Indi
cato
rs
Data
sou
rce
BEIm
pact
eva
luat
ion
of a
ctio
ns fo
r jo
bsee
kers
und
er
the
curr
ent O
P 20
07-2
013
ESF-
Fle
mis
h Co
mm
unity
Unem
ploy
ed
clie
nts
of th
e Fl
emis
h pu
blic
em
ploy
men
t se
rvice
(VDA
B),
who
par
ticip
ated
in
one
of t
he s
ix
type
s of
ALM
P m
easu
res
fund
ed
by E
SF; r
ando
m
sam
ple;
ESF
re
pres
ents
mai
n ac
tion
for t
he
clie
nts;
Refe
renc
e gr
oup
com
pose
d of
pa
rtici
pant
s of
mod
ule
2 (s
cree
ning
and
or
ient
atio
n), a
s al
l une
mpl
oyed
ha
ve b
een
invi
ted
to p
artic
ipat
e in
ac
tions
Data
from
VDB
A (w
ith
pers
onal
cha
ract
eris
tics
and
LM s
tatu
s) a
dditi
onal
te
leph
one
surv
ey o
n ho
w
part
icipa
nts
had
expe
rienc
ed
the
ESF
actio
n an
d to
wha
t ex
tent
they
bel
ieve
d th
ey
had
bene
fitte
d fr
om it
. Fr
om 1
4,37
0 un
empl
oyed
pe
rson
s w
ho fi
nish
ed E
SF
actio
n be
twee
n 12
/200
9 an
d 2/
2010
a s
ampl
e of
6,0
00
was
sel
ecte
d (6
-7/2
010
and
6-11
/201
1); f
rom
this
473
7 pe
rson
s co
ntac
ted
and
2005
re
ache
d ==
> fin
al s
ampl
e pe
r m
odul
e of
334
per
sons
Data
from
VDB
A,
tele
phon
e su
rvey
Inte
rmed
iate
resu
lts
(soft
fact
ors)
and
fin
al re
sults
; soft
re
sults
defi
ned
by q
uest
ionn
aire
("t
hank
s to
my
part
icipa
tion
in th
e ac
tion
I cou
ld…
.")
Follo
w-u
p su
rvey
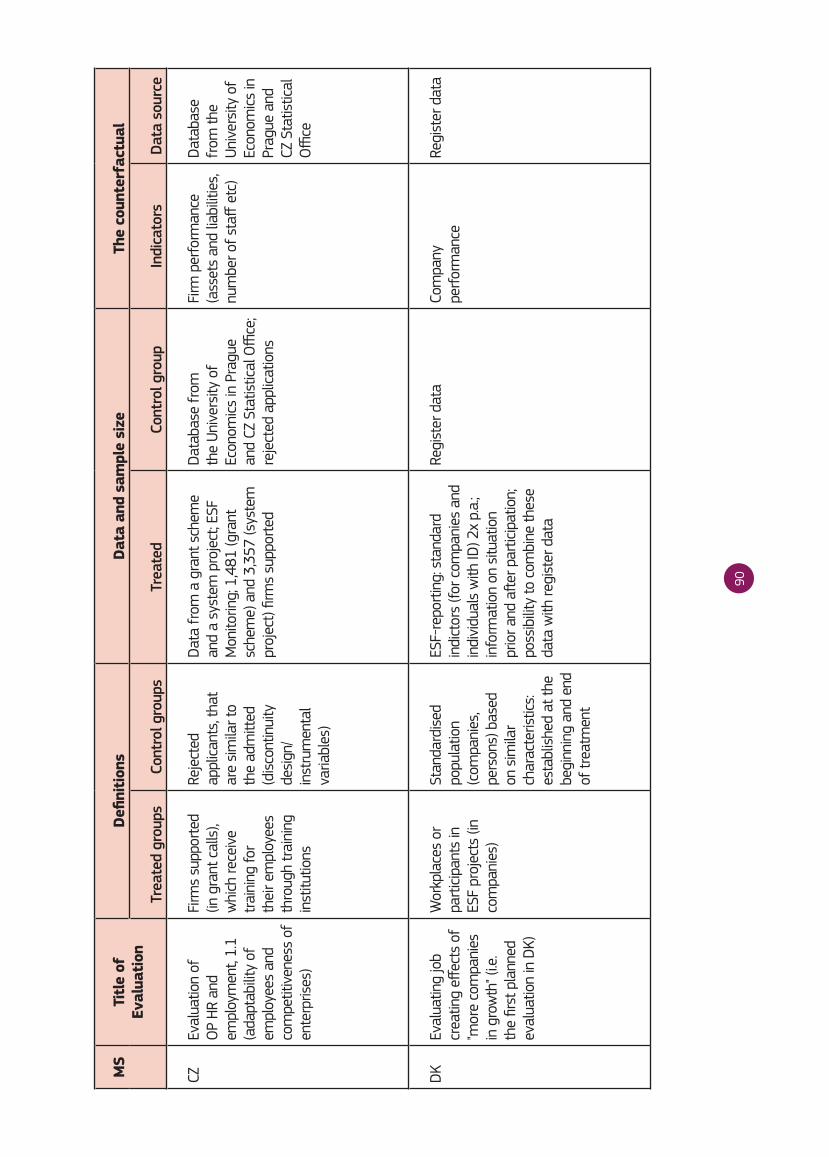
90
MS
Titl
e of
Ev
alua
tion
Defin
ition
sDa
ta a
nd s
ampl
e si
zeTh
e co
unte
rfac
tual
Trea
ted
grou
psCo
ntro
l gro
ups
Trea
ted
Cont
rol g
roup
Indi
cato
rs
Data
sou
rce
CZ
Eval
uatio
n of
O
P HR
and
em
ploy
men
t, 1.
1 (a
dapt
abili
ty o
f em
ploy
ees
and
com
petit
iven
ess
of
ente
rpris
es)
Firm
s su
ppor
ted
(in g
rant
cal
ls),
whi
ch re
ceiv
e tr
aini
ng fo
r th
eir e
mpl
oyee
s th
roug
h tr
aini
ng
inst
itutio
ns
Reje
cted
ap
plica
nts,
that
ar
e si
mila
r to
the
adm
itted
(d
isco
ntin
uity
de
sign
/in
stru
men
tal
varia
bles
)
Data
from
a g
rant
sch
eme
and
a sy
stem
pro
ject
; ESF
M
onito
ring;
1,4
81 (g
rant
sc
hem
e) a
nd 3
,357
(sys
tem
pr
ojec
t) fir
ms
supp
orte
d
Data
base
from
th
e Un
iver
sity
of
Econ
omics
in P
ragu
e an
d CZ
Sta
tistic
al O
ffice
; re
ject
ed a
pplic
atio
ns
Firm
per
form
ance
(a
sset
s an
d lia
bilit
ies,
nu
mbe
r of s
taff
etc
)
Data
base
fr
om th
e Un
iver
sity
of
Econ
omics
in
Prag
ue a
nd
CZ S
tatis
tical
O
ffice
DKEv
alua
ting
job
crea
ting
effec
ts o
f "m
ore
com
pani
es
in g
row
th" (
i.e.
the
first
pla
nned
ev
alua
tion
in D
K)
Wor
kpla
ces
or
part
icipa
nts
in
ESF
proj
ects
(in
com
pani
es)
Stan
dard
ised
po
pula
tion
(com
pani
es,
pers
ons)
bas
ed
on s
imila
r ch
arac
teris
tics:
es
tabl
ishe
d at
the
begi
nnin
g an
d en
d of
trea
tmen
t
ESF-
repo
rtin
g: s
tand
ard
indi
ctor
s (fo
r com
pani
es a
nd
indi
vidu
als
with
ID) 2
x p.
a.;
info
rmat
ion
on s
ituat
ion
prio
r and
afte
r par
ticip
atio
n;
poss
ibili
ty to
com
bine
thes
e da
ta w
ith re
gist
er d
ata
Regi
ster
dat
a Co
mpa
ny
perf
orm
ance
Regi
ster
dat
a
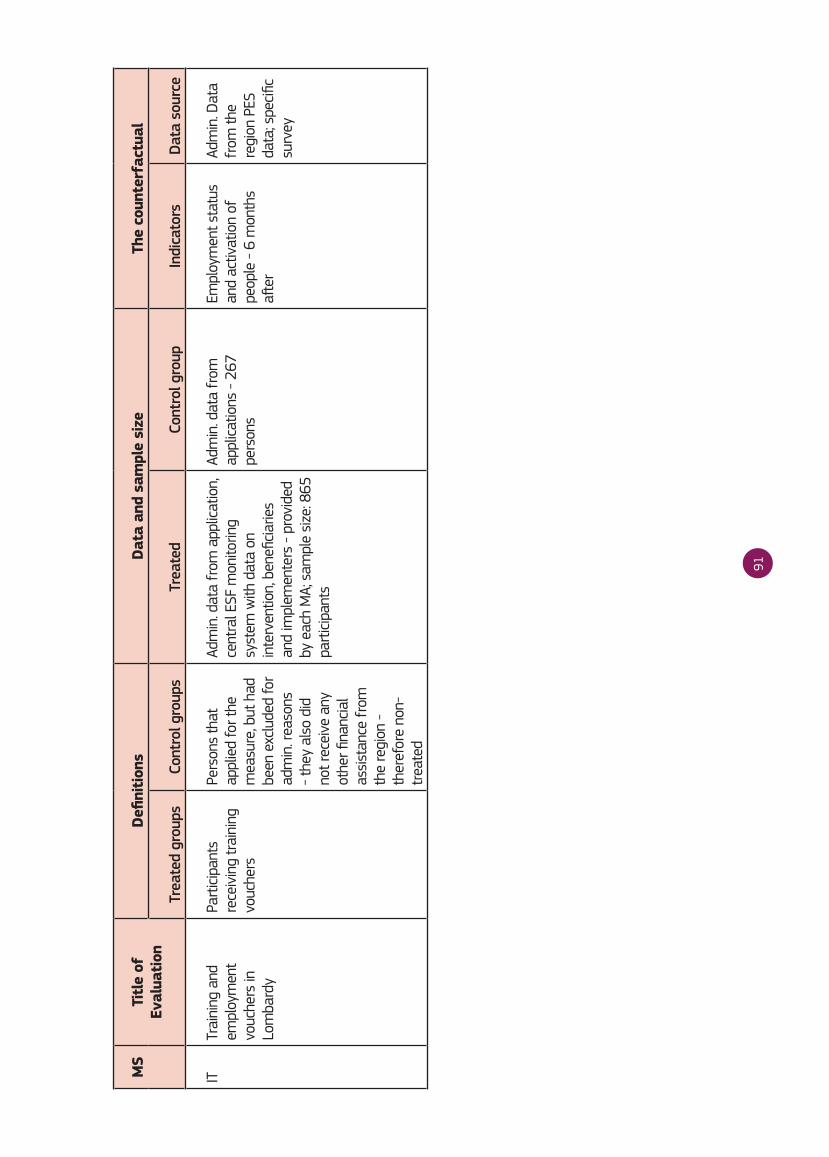
91
MS
Titl
e of
Ev
alua
tion
Defin
ition
sDa
ta a
nd s
ampl
e si
zeTh
e co
unte
rfac
tual
Trea
ted
grou
psCo
ntro
l gro
ups
Trea
ted
Cont
rol g
roup
Indi
cato
rs
Data
sou
rce
IT
Trai
ning
and
em
ploy
men
t vo
uche
rs in
Lo
mba
rdy
Part
icipa
nts
rece
ivin
g tr
aini
ng
vouc
hers
Pers
ons
that
ap
plie
d fo
r the
m
easu
re, b
ut h
ad
been
exc
lude
d fo
r ad
min
. rea
sons
- t
hey
also
did
no
t rec
eive
any
ot
her fi
nanc
ial
assi
stan
ce fr
om
the
regi
on -
th
eref
ore
non-
trea
ted
Adm
in. d
ata
from
app
licat
ion,
ce
ntra
l ESF
mon
itorin
g sy
stem
with
dat
a on
in
terv
entio
n, b
enefi
ciarie
s an
d im
plem
ente
rs -
prov
ided
by
eac
h M
A; s
ampl
e si
ze: 8
65
part
icipa
nts
Adm
in. d
ata
from
ap
plica
tions
- 26
7 pe
rson
s
Empl
oym
ent s
tatu
s an
d ac
tivat
ion
of
peop
le -
6 m
onth
s aft
er
Adm
in. D
ata
from
the
regi
on P
ES
data
; spe
cific
surv
ey
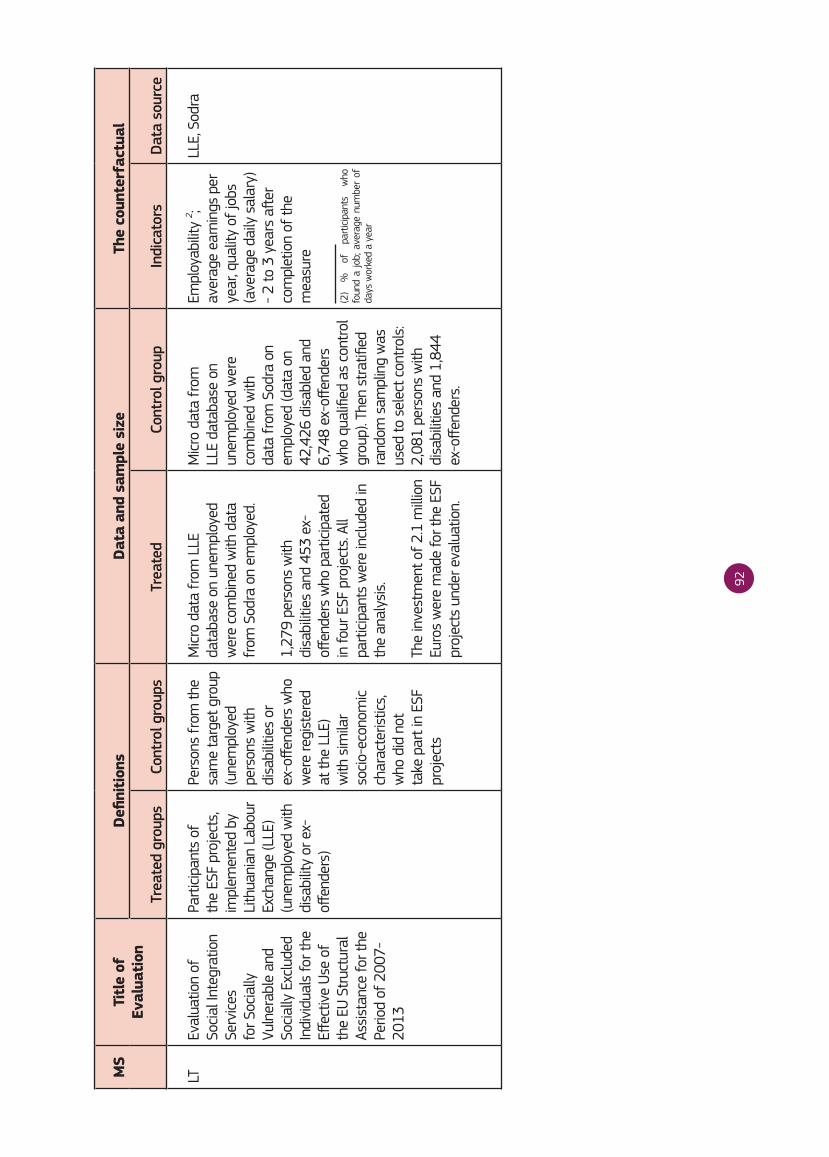
92
MS
Titl
e of
Ev
alua
tion
Defin
ition
sDa
ta a
nd s
ampl
e si
zeTh
e co
unte
rfac
tual
Trea
ted
grou
psCo
ntro
l gro
ups
Trea
ted
Cont
rol g
roup
Indi
cato
rs
Data
sou
rce
LTEv
alua
tion
of
Socia
l Int
egra
tion
Serv
ices
for S
ocia
lly
Vuln
erab
le a
nd
Socia
lly E
xclu
ded
Indi
vidu
als
for t
he
Effec
tive
Use
of
the
EU S
truc
tura
l As
sist
ance
for t
he
Perio
d of
200
7-20
13
Part
icipa
nts
of
the
ESF
proj
ects
, im
plem
ente
d by
Li
thua
nian
Lab
our
Exch
ange
(LLE
) (u
nem
ploy
ed w
ith
disa
bilit
y or
ex-
offen
ders
)
Pers
ons
from
the
sam
e ta
rget
gro
up
(une
mpl
oyed
pe
rson
s w
ith
disa
bilit
ies
or
ex-o
ffend
ers
who
w
ere
regi
ster
ed
at th
e LL
E)
with
sim
ilar
socio
-eco
nom
ic
char
acte
ristic
s,
who
did
not
ta
ke p
art i
n ES
F pr
ojec
ts
Micr
o da
ta fr
om L
LE
data
base
on
unem
ploy
ed
wer
e co
mbi
ned
with
dat
a fr
om S
odra
on
empl
oyed
.
1,27
9 pe
rson
s w
ith
disa
bilit
ies
and
453
ex-
offen
ders
who
par
ticip
ated
in
four
ESF
pro
ject
s. Al
l pa
rtici
pant
s w
ere
incl
uded
in
the
anal
ysis
.
The
inve
stm
ent o
f 2.1
mill
ion
Euro
s w
ere
mad
e fo
r the
ESF
pr
ojec
ts u
nder
eva
luat
ion.
Micr
o da
ta fr
om
LLE
data
base
on
unem
ploy
ed w
ere
com
bine
d w
ith
data
from
Sod
ra o
n em
ploy
ed (d
ata
on
42,4
26 d
isab
led
and
6,74
8 ex
-offe
nder
s w
ho q
ualifi
ed a
s co
ntro
l gr
oup)
. The
n st
ratifi
ed
rand
om s
ampl
ing
was
us
ed to
sel
ect c
ontr
ols:
2,
081
pers
ons
with
di
sabi
litie
s an
d 1,
844
ex-o
ffend
ers.
Empl
oyab
ility
2 ; av
erag
e ea
rnin
gs p
er
year
, qua
lity
of jo
bs
(ave
rage
dai
ly s
alar
y)
- 2 to
3 y
ears
afte
r co
mpl
etio
n of
the
mea
sure
(2)
%
of
part
icipa
nts
who
fo
und
a jo
b; a
vera
ge n
umbe
r of
da
ys w
orke
d a
year
LLE,
Sod
ra
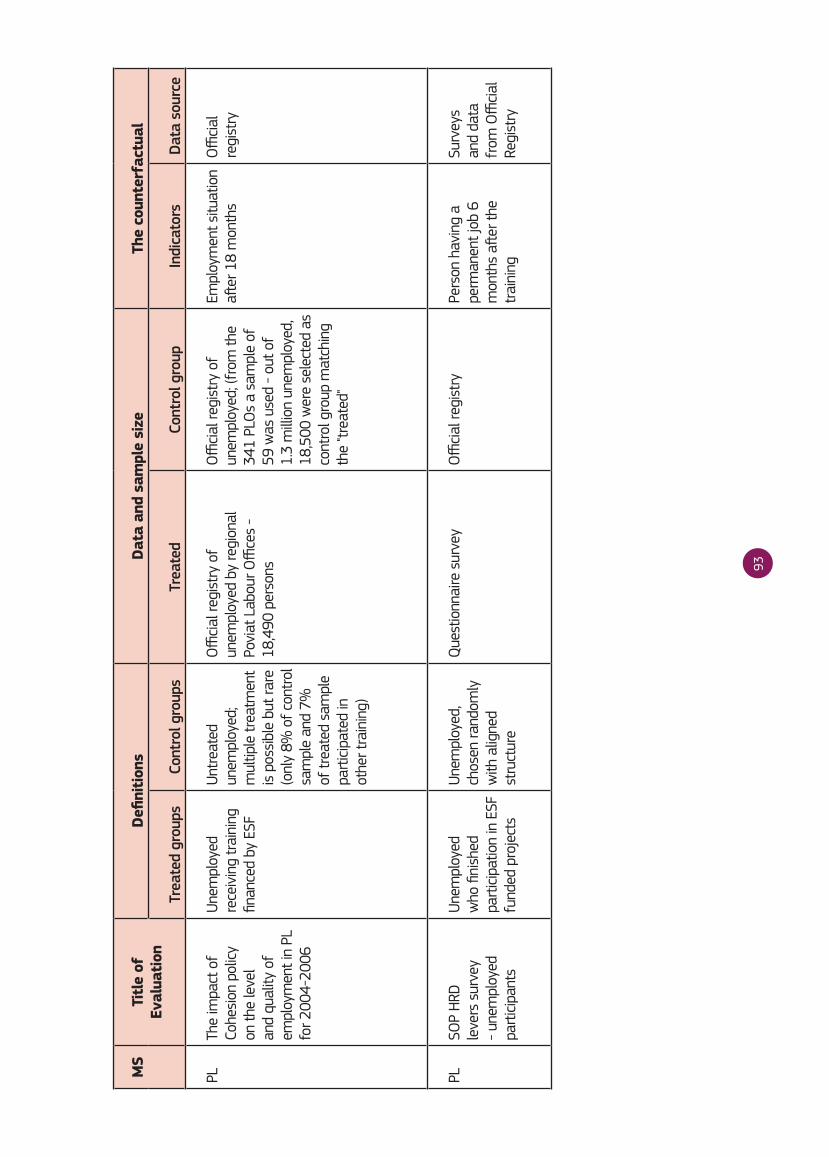
93
MS
Titl
e of
Ev
alua
tion
Defin
ition
sDa
ta a
nd s
ampl
e si
zeTh
e co
unte
rfac
tual
Trea
ted
grou
psCo
ntro
l gro
ups
Trea
ted
Cont
rol g
roup
Indi
cato
rs
Data
sou
rce
PLTh
e im
pact
of
Cohe
sion
pol
icy
on th
e le
vel
and
qual
ity o
f em
ploy
men
t in
PL
for 2
004-
2006
Unem
ploy
ed
rece
ivin
g tr
aini
ng
finan
ced
by E
SF
Untr
eate
d un
empl
oyed
; m
ultip
le tr
eatm
ent
is p
ossi
ble
but r
are
(onl
y 8%
of c
ontr
ol
sam
ple
and
7%
of tr
eate
d sa
mpl
e pa
rtici
pate
d in
ot
her t
rain
ing)
Offi
cial r
egis
try
of
unem
ploy
ed b
y re
gion
al
Povi
at L
abou
r Offi
ces
- 18
,490
per
sons
Offi
cial r
egis
try
of
unem
ploy
ed; (
from
the
341
PLO
s a
sam
ple
of
59 w
as u
sed
- out
of
1.3
mill
ion
unem
ploy
ed,
18,5
00 w
ere
sele
cted
as
cont
rol g
roup
mat
chin
g th
e "tr
eate
d"
Empl
oym
ent s
ituat
ion
after
18
mon
ths
Offi
cial
regi
stry
PLSO
P HR
D
leve
rs s
urve
y - u
nem
ploy
ed
part
icipa
nts
Unem
ploy
ed
who
fini
shed
pa
rtici
patio
n in
ESF
fu
nded
pro
ject
s
Unem
ploy
ed,
chos
en ra
ndom
ly
with
alig
ned
stru
ctur
e
Que
stio
nnai
re s
urve
yO
fficia
l reg
istr
y Pe
rson
hav
ing
a pe
rman
ent j
ob 6
m
onth
s aft
er th
e tr
aini
ng
Surv
eys
and
data
fr
om O
fficia
l Re
gist
ry
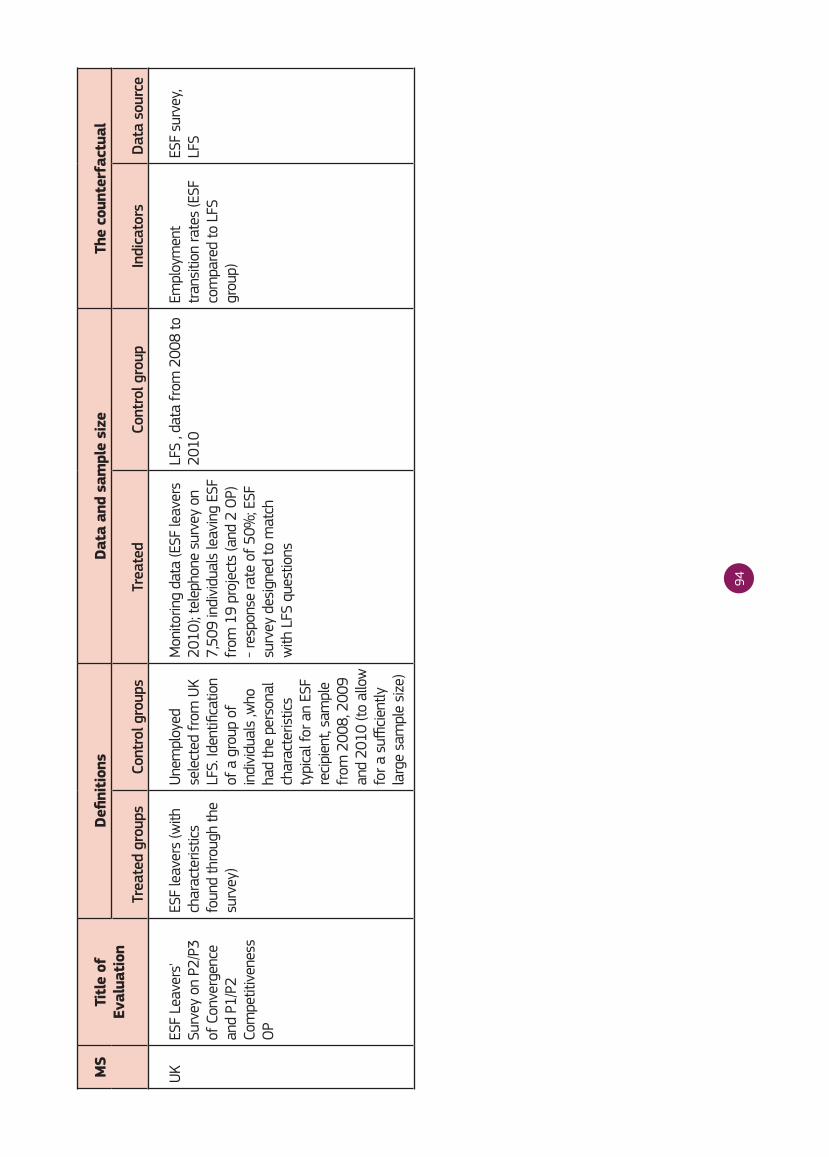
94
MS
Titl
e of
Ev
alua
tion
Defin
ition
sDa
ta a
nd s
ampl
e si
zeTh
e co
unte
rfac
tual
Trea
ted
grou
psCo
ntro
l gro
ups
Trea
ted
Cont
rol g
roup
Indi
cato
rs
Data
sou
rce
UKES
F Le
aver
s'
Surv
ey o
n P2
/P3
of C
onve
rgen
ce
and
P1/P
2 Co
mpe
titiv
enes
s O
P
ESF
leav
ers
(with
ch
arac
teris
tics
foun
d th
roug
h th
e su
rvey
)
Unem
ploy
ed
sele
cted
from
UK
LFS.
Iden
tifica
tion
of a
gro
up o
f in
divi
dual
s ,w
ho
had
the
pers
onal
ch
arac
teris
tics
typi
cal f
or a
n ES
F re
cipie
nt, s
ampl
e fr
om 2
008,
200
9 an
d 20
10 (t
o al
low
fo
r a s
ufficie
ntly
la
rge
sam
ple
size
)
Mon
itorin
g da
ta (E
SF le
aver
s 20
10);
tele
phon
e su
rvey
on
7,50
9 in
divi
dual
s le
avin
g ES
F fr
om 1
9 pr
ojec
ts (a
nd 2
OP)
- r
espo
nse
rate
of 5
0%; E
SF
surv
ey d
esig
ned
to m
atch
w
ith L
FS q
uest
ions
LFS
, dat
a fr
om 2
008
to
2010
Empl
oym
ent
tran
sitio
n ra
tes
(ESF
co
mpa
red
to L
FS
grou
p)
ESF
surv
ey,
LFS

European Commission
Design and Commissioning of Counterfactual Impact Evaluations - A Practical Guidance for ESF Managing Authorities
Luxembourg: Publications Office of the European Union
2013 — 94 pp. — 21 × 29.7 cm
ISBN 978-92-79-28238-6doi: 10.2767/94454
This publication is available in electronic format in English, French and German.
Evaluations of programmes and interventions financed through the European Social Fund (ESF) have proven challenging and have in many cases not allowed policy-makers to draw evidence-based conclusions regarding their effectiveness and efficiency. In order to strengthen future evaluations, the European Commission is encouraging Member States to increase efforts to develop credible evidence of ESF effects beyond what would have been achieved in the absence of ESF support. Such evidence requires counterfactual impact evaluations (CIEs) – i.e. comparison of results to estimates of what would have occurred otherwise.This guidance provides practical advice on some of the key questions that need to be considered when designing, commissioning and conducting CIEs. It is intended for ESF Managing Authorities (MA) and other bodies responsible for the implementation of ESF-funded programmes and interventions. The focus is on practicalities, though through necessity some technical issues are discussed.


KE-30-13-216-EN-N
doi:10.2767/94454
Are you interested in the publications of the Directorate-General for Employment,Social Affairs and Inclusion?
If so, you can download them or take out a free subscription at http://ec.europa.eu/social/publications
You are also welcome to sign up to receive the European Commission’s free Social Europe e-newsletter at http://ec.europa.eu/social/e-newsletter
http://ec.europa.eu/social/