Embed Size (px)
Citation preview

AERB SAFETY GUIDE No. SG/S-6A
DESIGN BASIS FLOOD FOR
NUCLEAR POWER PLANTS ON
INLAND SITES
Issued in December 1998
Atomic Energy Regulatory Board Mumbai-400 094

Price :
Orders for this guide should be submitted to:
Administrative Officer Atomic Energy Regulatory Board
Niyamak Bhavan Anushaktinagar
Mumbai – 400 094

i
FOREWORD Safety of public and occupational workers, and protection of environment should be assured while activities for economic and social progress are pursued. These activities include the establishment and utilisation of nuclear facilities and use of radioactive sources. They have to be carried out in accordance with relevant provisions in the Atomic Energy Act 1962 (33 of 1962). Assuring high safety standards has been of prime importance since the inception of nuclear power programme in the country. Recognising this aspect, the Government of India constituted Atomic Energy Regulatory Board (AERB) in November 1983 vide standing order No. 4772 notified in Gazette of India dated 31.12.1983. The Board has been entrusted with the responsibility of laying down safety standards and to frame rules and regulations in respect of regulatory and safety functions envisaged under the Atomic Energy Act of 1962. Under its programme of developing safety codes and guides, AERB has issued four Codes of practice covering the following topics :
Safety in Nuclear Power Plant Siting
Safety in Nuclear Power Plant Design
Safety in Nuclear Power Plant Operation
Quality Assurance for Safety in Nuclear Power Plants Safety guides are issued to describe and make available methods of implementing specific parts of the relevant codes of practice as acceptable to AERB. Methods and solutions other than those set out in the guides may be acceptable if they provide at least comparable assurance that nuclear power plants can be operated without undue risk to the health and safety of general public and plant personnel. The Codes and Safety Guides may be revised as and when necessary, in the light of experience as well as relevant developments in the field. The appendices included in the document are considered to be an integral part of the document, whereas the annexures, footnotes and bibliography are included to provide information that might be helpful to the user. The emphasis in the codes and guides is on the protection of site personnel and public from undue radiological hazard. However, for aspects not covered in the codes and guides, applicable and acceptable national and international codes and standards shall be followed. Industrial safety shall be assured through good engineering practices and through compliance with the Factories Act 1948 as amended in 1987 and the Atomic Energy (Factories) Rules, 1996. The code of practice on Safety in Nuclear Power Siting states the minimum requirements to be met during the siting of thermal neutron reactor based power plants in India. This safety guide provides guidance for design basis floods for NPPs at inland sites and outlines the methodology and procedures for carrying out analysis as applicable for implementing the relevant parts of the code.

ii
This safety guide has been prepared by the staff of AERB and other professionals. In drafting this guide, they have used extensively the relevant documents developed by the International Atomic Energy Agency (IAEA) under the Nuclear Safety Standards (NUSS) programme, especially the Safety Guide on Design Basis Floods for NPPs at Inland Site (50-SG-S10A,1980). The guide has been reviewed by experts and vetted by the AERB Advisory Committees before issue. AERB wishes to thank all individuals and organisations who reviewed the draft and finalised this safety guide. The list of persons who have participated in the Committee meetings, alongwith their affiliations, is included for information.
(P.Rama Rao) Chairman, AERB

iii
DEFINITIONS Accident Conditions Substantial deviations from Operational States which are expected to be infrequent, and which could lead to release of unacceptable quantities of radioactive materials if the relevant engineered safety features did not function as per design intent. Acceptable Limits Limits acceptable to Regulatory Body. Base Flow The normal flow in the river channel before any additional inflow starts contributing to the channel. Competent Authority A national or state authority designated or otherwise recognised for a specific purpose. Construction The process of manufacturing and assembling the components of a nuclear power plant, the erection of civil works and structures, the installation of components and equipment, and the performance of associated tests. Deep Water Water of a depth greater than L/2, where L is the wavelength of the surface wave under consideration. Design Basis Accidents (DBA) Design basis accidents are a set of hypothesised accidents which are analysed to arrive at conservative limits on pressure, temperature and other quantities that may be expected to cause unacceptable problems under accident conditions. Limiting values of these quantities are used then to set specifications that must be met by plant components, fission product barriers and safety systems. Design Basis for External Events The parameter values associated with, and characterising, an external event (e.g. missile impact, chemical explosion in the vicinity etc.) or combinations of external events selected for design of all or any part of the Nuclear Power Plant. Design Basis Flood (DBF) The flood selected for deriving a design basis for a Nuclear Power Plant. Design Basis Natural Events Natural events (like storm, flood etc.) selected for deriving design bases for a nuclear facility. Deterministic Method A method for which most of the parameters and their values are mathematically definable and may be explained by physical relationships.

iv
Design Basis Storm The storm selected for deriving design basis for a nuclear facility. Flood Water Level The calculated water level at the site under consideration for the selected design basis flood after proper flood routing technique is adopted. Full Reservoir Level (FRL) The maximum level which a reservoir can hold water above which water starts overflowing. High Flood Level Highest possible water level in rivers, streams, etc. which is derived from the historical data on the basis of maximum precipitation, hydrological aspects, and flood run off characteristics of the catchment area. Isohyets A line drawn on a map through places having an equal amount of rainfall. Items Important to Safety The items which comprise are: (1) those structures, systems and components whose malfunction or failure could lead to
undue radiation exposure of the site personnel or members of the public (this includes successive barriers set up against the release of radioactivity from the NPP);
(2) those structures, systems and components which prevent anticipated operational occurrences from leading to accident conditions;
(3) those failures which are provided to mitigate the consequences of malfunction or failure of structures, systems or components.
Liquefaction (of soil) Sudden loss of shear strength and rigidity of saturated and cohesionless soils due to vibratory ground motion. Maximum Draw Down Level (MDDL) The lowest level upto which water can be drawn from a dam. Mean Recurrence Interval (MRI) The mean interval during which the design external event is excepted to occur. Nuclear Power Plant A thermal neutron reactor or reactors together with all structures, systems and components necessary for safety and for the production of power, i.e. heat or electricity. Operation All activities performed to achieve, in a safe manner the purpose for which the plant was constructed, including maintenance, refuelling, in-service inspection and other associated activities.
v
Operating Basis Earthquake (S1) The Operating Basis Earthquake is that earthquake which produces the vibratory ground motion for which those Nuclear Power Plant structures, systems, and components necessary for power generation are designed to remain operable. Postulated Initiating Events (PIE) Events that lead to Anticipated Operational Occurrences and Accident Conditions, their credible casual failure effects and their credible combinations. Potential A possibility worthy of further consideration for safety. Prescribed Limits Limits established or accepted by Atomic Energy Regulatory Board for Operational States. Probable Maximum Flood (PMF) The hypothetical flood (characterised by peak flow, volume, and hydrograph shape) that is considered to be the most severe reasonably possible corresponding to the probable maximum precipitation. Probable Maximum Precipitation (PMP) The estimated depth of precipitation for a given duration, drainage area, and time of year, of which there is virtually no risk of exceedance. The probable maximum precipitation for a given duration and drainage area approaches and approximates to that maximum which is thought to be physically possible within the limits of contemporary hydrometeorological knowledge and techniques. Probable Maximum Storm (PMS) See design basis storm Protection System A system which encompasses all electrical and mechanical devices and circuitry, from sensors to actuation device input terminals, involved in generating those signals associated with the protective function. Region A geographical area, surrounding and including the site, sufficiently large to contain all the features related to a phenomenon or to the effects of a particular event. Regulatory Body Atomic Energy Regulatory Board, India. Residual Heat The sum of the heat originating from radioactive decay and shut down fission and the heat stored in reactor related structures and in heat transport system. Runoff Overland flow of water during precipitation.

vi
Safe Shutdown Earthquake (S2) The safe shutdown earthquake is that earthquake which provides the vibratory ground motion for which nuclear Power Plant structures, systems, and components important to safety are designed to remain functional. These structures, systems and components are those necessary to assure: (1) The integrity of the reactor coolant pressure boundary (2) The capability to shut down the reactor and maintain in a safe shutdown condition, or (3) The capability to prevent or mitigate the consequences of accidents which could result
in potential off site nuclear exposures higher than the permissible limits specified by the Regulatory Body.
Safety Protection of all persons from undue radiological hazard. Safety Limits Limits upon process variables within which the operation of the Nuclear Power Plant has been shown to be safe. Safety Report A document provided by the Applicant or Licensee to the Regulatory Body containing information concerning the Nuclear Power Plant, its design, accident analysis and provisions to minimise the risk to the public and to the site personnel. Shallow Water Water of a depth less than L/25, where L is the wavelength of the surface wave under consideration. Site The area containing the plant, defined by a boundary and under effective control of the plant management. Siting The process of selecting a suitable site for Nuclear Power Plant, including appropriate assessment and definition of the related design bases. Storm Violent disturbance of the atmosphere attended by wind and usually by rain, snow, hail, sleet or thunder and lightning.
1
CONTENTS
Page No. FOREWORD DEFINITIONS 1.0 INTRODUCTION 1.1 General Considerations 1.2 Scope Integrated approach for site consideration 2.0 METHODOLOGIES FOR PMP ESTIMATES 2.1 General 2.2 Deterministic methods 2.3 Probabilistic methods 2.4 Limitations of the Methods 3.0 FLOODS DUE TO SUDDEN RELEASE FROM
NATURAL/ARTIFICIAL STORAGE 3.1 General 3.2 Postulation of Failure 3.3 Failure from Causes Other than Hydrological or Seismic 3.4 Failure Outflow Hydrograph 4.0 METHODOLOGIES OF FLOOD ROUTING 4.1 General 4.2 Distribution of Storm Rainfall 4.3 Flood Routing 4.4 Input/Output conditions 4.5 Base Flow 4.6 Losses 4.7 Precedent Precipitation 5.0 INITIAL CONDITIONS/COMBINATION OF EVENTS 5.1 General 5.2 Initial Conditions 5.3 Combination of Events 6.0 FLOOD PROTECTION ASPECTS OF NPP SITING 6.1 General 6.2 Types of Protection 6.3 Analysis of Protection Structures 6.4 Monitoring and Forecasting for Plant Protection 7.0 DATA BASE 7.1 General 7.2 Data for Probable Maximum Precipitation (PMP) 7.3 Data for Runoff Flood Estimations 7.4 Data for Flood Routing
2
7.5 Data for Dam Failure 7.6 Overview of Data Collection 7.7 Data availability 8.0 RELATIONSHIP BETWEEN FLOW, FLOOD WATER LEVEL AND OTHER PARAMETERS APPENDICES A. Saint Venant Equation B. Reservoir Routing C. Methods for Generation of Outflow Hydrograph ANNEXURES I. Dam Break Analysis II. Extreme Value Distributions III. Muskinghaum Channel Routing Method IV. Method for Generating Flood Hydrograph from Unit Hydrograph BIBLIOGRAPHY LIST OF PARTICIPANTS ADVISORY COMMITTEE ON NUCLEAR SAFETY (ACNS) PROVISIONAL LIST OF SAFETY GUIDES UNDER SITING CODE
1
1. INTRODUCTION 1.1 General Considerations:
The Site characteristics that govern the safety of Nuclear Power Plants (NPPs) are natural events, e.g. floods and tropical storms. The characteristics such as earthquakes, floods and tropical cyclones contribute to the impact of the NPPs on environment.
Safety Guide on "Design Basis Flood for Nuclear Power Plants on Inland Sites" is prepared keeping in view the applicability of various methods and facilities available in the country. An attempt is made to give the requirements and methodologies for estimating water levels reached at the site of interest along the river channel due to flood events in precise terms so that user will have a clear concept of the task that is undertaken and how to address this issue.
NPPs need water for cooling purposes and are in general, situated near water sources like natural or manmade reservoirs, river channels or sea coast. NPPs are to be located such that the finished grade level of the site shall be above the maximum flood water level if engineering solutions are not feasible for ensuring plant safety against flooding and its effects [1]. Hence evaluation of the flooding potential at any NPP site assumes importance.
Flooding can result from following causes:
(i) Precipitation, snow melt (ii) Failure of water control structures, either from seismic or hydrological causes
or from faulty operations of these structures. (iii) Channel obstructions due to land-slides, log or debris jams, etc.
1.2 Scope
At the siting and construction stage, it is essential to have an idea of a potential flood event. The safety of the NPP against this flood can be taken care of at the design stage. This event termed as Design Basis Flood (DBF) shall have a very low probability of exceedance. Mean recurrence interval (MRI) of the event to be used for this analysis is atleast one thousand years [1].
The estimation of design basis flood is dealt in two stages in this Guide:
(i) Estimation of Probable Maximum Precipitation (PMP) (ii) Routing the flood generated due to PMP through the river channel to arrive at
the maximum water level or water velocities at the site.
For evaluation of PMP, two approaches i.e. probabilistic and deterministic are discussed in this Guide:
2
In addition to the floods caused by the precipitation, floods may be caused by the failure of upstream dams also. While estimating the floods caused by upstream dam failure one has to use appropriate routing methods. Basic parameters like the reason for dam failure: seismic activity or hydrological activity, type of dam-break, duration for complete break, its present condition and the type of postulated failure play an important role in final estimation of flood.
Apart from these two main flooding events given above, other events like land slides, temporary choking of channel due to debris can also lead to floods.
The effect of flooding will increase if the above individual events occur simultaneously. The probability of two unrelated extreme events occurring simultaneously will be very small and hence will not be considered. However, two events with one of them having a higher probability can occur simultaneously. Recommended combinations of such events are also given in this Guide.
In case of floods, one is interested in the highest water level reached as well as peak discharge past the site. While considering this aspect one must keep in mind that even the transient phenomenon such as travelling flood wave generated due to upstream dam failure shall also be considered. This guide gives details of various numerical computational formulations involved in flood routing procedure in the Appendices while some typical examples are worked out in the Annexures.
While considering the flood due to precipitation, the process of analysis goes through identifying an appropriate storm, Design Basis Storm (DBS) or Probable Maximum Storm (PMS), then arrive at the amount and duration of precipitation due to the storm, Probable Maximum Precipitation (PMP) and then estimate the surface runoff and its transport along the river channel and arrive at associated high water level or high flow or Probable Maximum Flood (PMF). Various terminologies mentioned above are referred to in the course of this Guide. Interdependence of these terms is brought out in this para.
1.3 Integrated approach for site consideration
In practice for applying the probabilistic method for identification of PMS having a return period of 1000 years, it is necessary to have annual extreme data of around 100 years. Even if the storms occurring within 250 Km radius of the site are considered it is difficult to have the required historical data. Under such circumstances deterministic method is to be resorted to. This involves choosing of a typical storm which is likely to occur in the area and maximising its impact for proper combination of parameters responsible for the maximisation of the impact as described in the text. Choosing the storm which can occur at the site is subjective. To reduce this subjectivity it is better that this is done by an expert in this field. India Meteorological Department (IMD) may be approached in this regard.
It is stated that upstream dam failure scenario is to be considered unless the stability of dam is established by engineering considerations. The sites are normally chosen where the upstream/ downstream dams are already existing. The design basis of seismicity used for them may not be as stringent as per requirement of the NPP. For

3
upstream dam failure scenario, the seismic and flood events are not combined. However, the possibility of dam failure due to the water storage is being talked of. In practice generally dam overtopping is to be taken as the criteria for the failure of the concrete dam structures. Under these circumstances, the failure scenario will result in severity which will be comparable even if the above possibilities are considered.
In this respect it is important to note that the dam authorities are equally concerned about the possibility of dam failure. In order to avoid the overtopping scenario it is often a practice to generate a gate opening schedule for the dam, based on the rainfall intensity in the catchment area. The rainfall intensity data in the catchment area is conveyed to the dam authorities through VHF stations. In view of this it is necessary to have an understanding reached with the concerned authorities in this respect. The station authorities should establish a channel of communication with the dam authorities such that they will come to know the gate opening schedule details as well as information about the gate opening during the period of the storm. Though it is understood that the station authorities cannot interfere in this matter it will be prudent to establish relations with the authorities to ascertain the safety of the dams. This can be done by proposing augmentation of VHF transmission and co-operation in maintenance of the facilities.
4
2. METHODOLOGIES FOR PROBABLE MAXIMUM PRECIPITATION (PMP) ESTIMATES 2.1 General
Both probabilistic and deterministic methods as applied to estimation of PMP are discussed. The two types of methods are not to be seen as competitive but as complementary. The DBF shall be established either by deterministic approach or by probabilistic approach. However, at the present state of art, adoption of deterministic approach is appropriate till sufficient data base is established to make probabilistic method reliable. The method chosen shall satisfy the requirement of MRI for DBF specified in the Code [1].
2.2 Deterministic Methods
Deterministic methods are normally based on using a maximum actual event which has occurred in the basin under consideration or a similar nearby basin (similarity between basins is decided by expert judgement) and which can occur at the place under consideration. However realistic values of parameters based on data, like dew point etc. which influence the precipitation should be considered to optimise the effect. Thus one can arrive at the limit of PMP likely to occur at the basin under consideration.
Deterministic methods are based on the use of the models to describe the meteorological system. The models could be empirical or based on physical relationships. For a given input or a set of initial and boundary conditions, the model will generate parameter values to describe the state of the system.
These (deterministic) methods are aimed at determining the potential upper limit to PMP, irrespective of the probability of its occurrence. Conservative estimates of the parameters of interest can be generated using appropriate values of the input parameters.
Deterministic methods require consideration of specific features of the region around the site and the application of engineering judgement.
2.2.1 Storm Transposition Technique:
The deterministic method is one of the approaches for estimating the PMP. The most often used deterministic method is the Storm Transposition Technique (STT). It consists of the following steps:
(i) Study the travel path of all the major storms (those leading to maximum
precipitation) which have occurred in and around the region of interest. Pick up the strongest storm of the region which is likely to occur in the basin of interest. This involves a lot of expert judgement. Normally data of storm tracks in the area can be had from India Meteorology Department (IMD) or Central Water Commission (CWC). These organisations have the necessary
5
expertise. Choice of an appropriate storm for the region of interest should preferably be done is consultation with them.
(ii) Plot the isohyets of the selected storm over the region where it has occurred. (iii) Transpose this storm bodily, i.e. with all its characteristics (the isohyet pattern)
over the region of interest keeping the general orientation the same as it was in the area of origin.
(iv) Adjust the orientation of the major axis of the storm by rotating it so as to give maximum effect on the basin of interest. The maximum orientation change should not be > 20o. Locate the storm over the basin to generate the maximum effect of flooding.
(v) Apply moisture adjustment procedure to the actual transposed storm. This involves introducing maximum available moisture source in the region under consideration as compared to the situation existing for the transposed storm [2].
(vi) If the historical storm data of the site shows possibility of two or more storms occurring separated by small time gap (based on expert judgement), then sequential maximisation should also be adopted. This amounts to arrangement of two storms time wise to occur one after the other which could lead to significant enhancement of the effect of flooding.
(vii) In situations where the basin is large and is likely to be under the influence of two different meteorological systems, possibility of simultaneous occurrence of two storms generated by the two meteorological systems in the same area, so as to cover the entire region under study should be considered.
There are other methods like Depth-Area-Duration (DAD) analysis and Depth-Duration Analysis (DDA) which make use of the envelope curve approach for the estimation of PMP. This approach considers only those storm events which have occurred in the basin of interest. This approach is very rarely used as it covers only a limited maximisation approach [3].
2.3 Probabilistic Methods
Two types of probabilistic methods used for PMP evaluation are:
i) Frequency Curves Method ii) Stochastic Technique based on Time Series Analysis and Synthesis.
Simple probabilistic methods for such a low exceedance probability event as referred earlier, can lead to higher uncertainties due to paucity of data and can be used only at site selection stage. When data available is not sufficient as to give reliable estimates of low exceedance probability event, the deterministic method is to be used. The reliability of the estimates will be judged from the measure of spread parameter of the fit.
6
2.3.1 Frequency Curves Method:
This method is based on a series of maximum annual precipitation. Use of extrapolated frequency curves for estimating extreme events such as flood is well known. However, these methods cannot be used where data predictions are to be carried out over large time period, as an essential requirement for estimating low probability events.
If data are treated in a more detailed way by taking into account random components, trends, jumps and outliers, the method falls into category of stochastic method.
2.3.2 Stochastic Method:
Stochastic method as applied in hydrology combine deterministic and statistical analysis and synthesizing of a time series of stochastically variable data. It is assumed that the series represents the effect of a limited number of definable causes and an unknown number of stochastic causes. With such stochastic causes, there is no confirmed relationship involved. It is emphasised that the data used in stochastic evaluations are based on actual measurements of variables.
Probable Maximum Flood (PMF) arrived at using PMPs generated through the use of above methods shall be compared critically with recorded and historical data. The DBFs shall be set at a value not less than the maximum observed occurrence provided that there has been no significant change in the basin both upstream or downstream of the site to alter the same.
Statistical analysis will generally depend on arriving at the distribution function either based on theoretical consideration or on empirical formulations. The most preferred method used for arriving at Maximum Probable Storm (PMS) is the extreme value analysis. Details of the methodology for this analysis is given in another Guide [4].
In the extreme value approach annual series of extreme values are used for trying the fit for various extreme value distributions. Reliability of the parameter estimates arrived at using a particular distribution will be dependent on the quality and quantity of data available. It is therefore of importance that degree of fit for all the known distributions be done and the distribution giving the best fit be chosen. In addition, estimation of variance of various distributions be compared using standard procedures [5].
Values of the parameter of interest corresponding to various MRIs in turn can be arrived at by using the above technique. The storm which has a MRI of alteast 1000 years is used for generating PMF.
In case of lack of sufficient data even partial duration series is used. While using partial duration series the values of parameters corresponding to a return period will be over estimated and appropriate correction needs to be incorporated. Different types of distribution like Fisher-Tippet Type I, Fisher-Tippet Type II and others exist [4]. Though Fisher-Tippet Type I distribution which is also known as Gumbel's Distribution is normally used, the degree of fitting of various distributions should be

7
checked and the best of fitting distribution should be used to arrive at the value of the parameter for required return period.
2.4 Limitations of the Method
Both deterministic and probabilistic methods suffer from some constraints which limit their applicability. Deterministic method does not provide an idea of the degree of safety achieved as it does not give the value of the mean recurrence period of the selected event. The probabilistic method on the other hand may suffer from inadequacy of data. It is desirable that alteast 100 years data is available to generate a meaningful and reliable estimate with an MRI of one thousand years.
Both the methods depend on the regional or site data and ultimate choice of method and accuracy of the method will be dictated by the availability and quantity of the data.
8
3. FLOODS DUE TO SUDDEN RELEASE FROM NATURAL OR ARTIFICIAL STORAGE
3.1 General:
Failure of water control structures upstream of the plant site due to hydrological, seismic or other causes, such as landslides into reservoir or dam deterioration are likely to cause floods at the sites downstream. Safety of the site from flooding due to the above causes should also be analysed.
In case of the postulated dam failure due to hydrological or seismic causes, three cases should be considered:
(i) Failure of the structure due to impounded storage (ii) Failure of the structure due to overtopping during excessive precipitation
runoff (iii) Failure due to the seismic causes as per Sec. 4.1.1.10 of the Code [1], and (iv) Appropriate combinations of the above if necessary.
Major volume of the water released due to the dam failure is from the water impounded behind the dam at the time of failure. It is therefore important to give a guideline as to the level of water storage to be considered during any flood causing event.
For computational purposes the water level behind the dam is taken to be at Full Reservoir Level (FRL)initially. In case of flood routing in the reservoir, the water level in the reservoir at the start of the storm is taken as at FRL.
Dam failure shall be postulated unless non-failure of the dam can be demonstrated by engineering computations. It is also important to consider the sequence of the dam failure i.e. whether it is a block by block opening, sudden failure of the entire structure or gradual collapse of the structure. This aspect assumes importance in PMF computation as one is interested in knowing the highest water level at the site even if it is a transient phenomenon. Sudden wave generated is translated down-stream and the height of the wave will depend on the type of failure. A typical example is shown in Fig. 3.1.
The effect due to dam failure will be when the dam failure is considered as due to overtopping of the dam as a result of the PMP or PMF event upstream of the dam, and appropriate failure scenario is considered.
An analysis of the safety of all the dams along the river course to the site is performed and unless non-failure can be established, failure should be postulated. Floods resulting from the upstream dam failure are routed downstream and sequential failure of dams along a channel are presumed, unless otherwise shown to be safe. If dams are situated on the tributaries and non-failure of these dams for the PMF under consideration is not established, failure of these dams should also be considered and when appropriate, probability and the consequences of flood waves arriving at the site simultaneously with the flood wave in the main channel should be considered.
9
3.2 Postulation of failure
In case dam failure scenario is to be considered then the mode and degree of the failure (partial or complete) must be established by carrying out stability analysis. Postulation of dam failure mode takes into account the types of dam construction, topography of the river channel immediately down stream of the dam as well as the cause of failure.
Concrete gravity dams are to be analysed for overturning and sliding. Size of breached section and its location should be computed consistent with the type of dam and other relevant parameters. If not, the opening shape and size of failure should be limited by a rectangular shape with the full height as one side and the bottom width of the dam structure as the other side.
Arch dam failure due to flooding is likely to be instantaneous and the destruction is complete. In case non-failure cannot be demonstrated then total failure is to be considered.
In case of rock or earth filled dams, the failure is not instantaneous and it develops slowly. Periods for total failures can be as large as several hours also. The rock filled dams will take more time for complete failure as compared to the earth-filled dams. The period and process of failure should be estimated to decide the failure mode.
Mode and degree of failure should be postulated using conservative judgement based as far as possible on stability analysis carried out.
Possibility of failure of downstream dams due to flood wave resulting from the seismic failure of the upstream dam should also be considered [6]. In addition effect of failure of gates (maximum 10%) operation on the down stream flood wave should also be included. Credit for any flood warning system or administrative control for flood regulation should be considered on a case by case basis.
3.3 Failures from causes other than Hydrological and Seismic
Some more causes for failure of water retaining structures are given below:
- Deterioration of concrete or embankment protection, - Excessive or uneven settlement with resultant cracking, - Leakage through foundations, embankment rim or passages, - Functional failures (Jamming of gates) - Accumulation of silt or debris against the upstream face and Landslides into
reservoir. Normally all the above causes might develop over a long period of time and regular inspection of the structures of the dam as well as the surrounding areas will help in avoiding all the above causes.

10
Apart from above causes, floods can also be induced due to other causes such as
- Natural channel changes (meandering) - Man induced events (restriction to flow) - Mining and Quarrying - In-channel and Off-channel structures - Direct rainfall at the site for local flooding. All these effects will assume importance only when the storage structure failure is not postulated.
3.4 Failure Outflow Hydrograph1
Outflow from a partially/fully failed dam depends on the degree and mode of failure and resulting stage-discharge relationship and the geometry and volume of the reservoir. Unsteady flow methods are the most suitable for down stream routing of this outflow hydrograph resulting from dam failure. Where distances of interest are considerably down stream and intervening channel or reservoir storage can be shown to attenuate flood flows adequately, simple flood routing methods may be used.
1 A simple formula for the evaluation of the breach wave height is h=4/9[Lh-Lt], where Lh and Lt are the
headwater and tailwater levels respectively. For the calculation this wave is taken as being transferred downsteam without attenuation and being continued and being combined there with an appropriate flood due to precipitation [7].

11
12
4. METHODOLOGIES OF FLOOD ROUTING 4.1 General:
Once the knowledge of the PMP or PMS is available it is essential to estimate their impact on generating the flood event. This involves the study of the precipitation in small rivulets; rivulets flowing into bigger channels; flow from these channels running into the main channel and finally into a reservoir. The estimated contribution at the rivulets stage is achieved by using surface runoff techniques while the progress along the channels is achieved by using channel routing techniques. Contribution of precipitation along the main channel is also to be included as inflow to the channel at appropriate stage. The assessment of flow and the absorption in the reservoir is carried out using the reservoir routing technique. Precipitation in the reservoir area and precipitation directly feeding to the reservoir due to land runoff should also be added to the reservoir volume.
4.2 Distribution of Storm Rainfall:
Once the total rainfall in a storm for a particular period (1 day, 2 day, 3 day etc.) is available, it is necessary to know the temporal distribution of the rainfall during the storm period. Effect of the storm in producing floods will depend on the temporal distribution pattern of the rainfall within the storm interval. Actual temporal distribution of the precipitation in the storm which would give maximum flood water levels at a site will depend on the topography, channel geometry and other relevant site specific parameters. It is desirable to have the critical temporal distribution of the storm PMP generated for the basin under study from the past observed records. The temporal distribution of the design basis storm rainfall should be upgraded as per this critical site specific distribution for optimizing the flood potential.
4.3 Flood Routing: 4.3.1 Stages of Flood Routing
Surface runoff due to precipitation will ultimately flow to main river channel and get collected either in the reservoir or flows to the sea. When the river basin is large and has many tributaries feeding the main river channel, area feeding to individual tributary is always different. For ease of handling this complex flood routing problem, the basin should be divided into sub-basins having areas not more than 8000 km2 [1] in such a fashion that each basin is covering a small area and feeds only one tributary channel (Fig. 4.1). Flood routing analysis of water collected due to the rainfall over a basin will flow to ultimate destination through three stages:
13
i) Overland flow will move over the surface and get collected in the tributary. The estimation of this flow can be done using overland flow models. In case of a small sub-basin the flow at the end of the tributary can be estimated using either surface run off or routing along the tributary before it meets the main channel.
ii) The water flood from the tributary to the main channel is to be routed along the channel upto a point where input from the next tributary is coming to the main channel. Channel routing method is to be used for this purpose.
iii) If any storage structure is present over the main channel then the outflow of the main channel will act as the input to the reservoir (storage) and the height of water reached behind this shortage will be found out by using the reservoir routing technique.
4.3.2 Surface Runoff
All the precipitation will not go to the channel. A part of this will be intercepted by the trees, or may be stored in the depressions on the ground. A part will seep through the soil and go to recharge the underground water table. When the amount of precipitation is more than the water losses due to combined effect of the above pathways, water starts flowing overland and this is the runoff which would contribute to the flooding. The overland flow can also be considered as flow through a wide rectangular channel and appropriate overland flow roughness factors can be used depending on the vegetation on the land [8]. Flow at any point in the channel can be computed using Manning's formula Q = (1/N) S 1/2 R 2/3 A ..(4.1) Where Q is the flow in cumecs S is channel bed slope R is hydraulic radius (meters) A is cross-sectional area (Sq.meters) N is Manning's coefficient This relation can be simplified to Q = αAm .. (4.2) where α and m are related to flow geometry and surface roughness. The overflow can be modelled as a rectangular channel for which in SI units α = (1/N) S 1/2 W(-2/3) ..(4.3) where W is the width of the rectangular channel,
14
m = 5/3 and for unit channel width for overland flow (in SI units) α = (1/N) S 1/2 and m=5/3 .. (4.4) where N is effective roughness parameter (for overland) given in Table 4.1
4.3.3. Channel routing methods
Basic hydrodynamic equations are modified for application to the open channel flow to include the parameters of channel geometry by Saint Venant and they assume the following form: (1/g) ∂V/∂t + (V/g).(∂V/∂x) + ∂y/∂x – S0 + Sf + [(V-Ux)q]/gA = 0 ...(4.5) T ∂y/∂t + ∂(VA)/∂x - q = 0 ...(4.6) where g is the acceleration due to gravity, V is the velocity along the channel, Y is the water depth. Ux is the component of velocity of the lateral inflow in the direction of main flow, A cross-sectional area. T = dA/dY is the top width of the channel, q is the lateral rate of inflow for unit length of channel, So longitudinal slope of the channel and Sf is the friction slope. Sf = n 2 V V /R 4/3 in SI units ....(4.7) where R is the hydraulic radius and n Manning's roughness coefficient. These equations are solved for generating the water levels in the open channel for channel routing method [Appendix-A]. This method consists of solving the (Saint Venant's) equations [9] of flow along the channel. The equations are solved numerically using either finite difference method [10], or finite element method or method of characteristics [9]. These techniques are described in literature on numerical methods.
4.3.4 Reservoir Routing Method
When the flood water from the channel starts entering the reservoir, water level starts building up. The analysis of the water level or storage volume can be done using the simple mass balance technique (Appendix-B). The input to the reservoir can be represented by the outflow hydrograph at the end of the channel. Outflow from the reservoir will be through the gates or spillway if the reservoir has a dam at the downstream or overlow from the storage facility. The outflow hydrograph can be generated using the relation of the water level in the reservoir and flow over the weir (Appendix-C). The water level in this reservoir can be obtained from the data of height volume relation generated from the topographical map of the upstream of the
15
dam structure which is also known as capacity curve for the storage facility. The above data together with the initial height of the water level in the reservoir will give the water level in the reservoir and the outflow hydrograph for the reservoir routing during the inflow flood. If the historical records of the stage heights or flood flow hydrographs are available for the site, then these records should be utilised to generate site specific unit hydrographs for generating the outflow hydrograph for the site rather than using a synthetic hydrograph. This technique is however useful for generating the inflow conditions and is described in detail in Section 4.4.2.
4.4 Input/Output conditions 4.4.1 Data Requirements
For running any model it is essential to have the data of the input conditions. In case of the flood routing techniques the input conditions are to be given in terms of the volume rate of flood flow as a function of time. This is normally given in terms of the flood hydrographs which can be generated using the unit hydrograph technique. In case of the channel downstream of the reservoir the outflow hydrograph from the dam structure will act as the inflow hydrograph for the succeeding channel.
4.4.2 Unit hydrograph 4.4.2.1 Method:
Unit hydrograph is a plot of variation of flow rate versus time for a unit net precipitation in an area. The net precipitation is that part of the precipitation which contributes to the surface runoff. Representative unit hydrograph of a basin can be generated either from historical observation or by empirical methods. Though empirical methods [8] of generating unit hydrographs are available, it is desirable to have unit hydrograph generated from the historical data. Flow hydrograph for a quantum of precipitation is generated using unit hydrograph. Once the temporal distribution of the precipitation within a PMS is known, different hydrographs corresponding to the individual quantum of rains are generated. These hydrographs are combined to generate the final flood hydrograph (Annexure-II) taking into consideration the time sequence.
Flood hydrograph so generated at the start of the channel will act as the input to the channel. The channel routing will in turn generate outflow hydrograph. These can be either stage hydrograph or outflow hydrograph, and can be used as input hydrograph for the next channel. Steps to be followed while using Unit Hydrograph method are given below : (i) Select a rainfall event including the duration as representative of the PMP. (ii) Select appropriate base flow in the river. For worst conditions one should
select largest base flow which normally occurs in the monsoon season. In case storage structures are present along the channel then the appropriate water level behind the storage structure is used as the starting condition. However,
16
for maximisation approach the initial water level behind the water control structure is taken as at Full Reservoir Level (FRL).
(iii) Net precipitation which contributes to runoff is obtained by subtracting the losses from the storm PMP. However, if the maximisation of the flooding is to be achieved the losses may be neglected.
(iv) A unit hydrograph for the basin is developed, calibrated and validated. While selecting a representative unit hydrograph, care is taken that the unit hydrograph is valid for the flows comparable to values expected through PMP.
(v) A flood flow hydrograph is generated from the unit hydrograph and incremental rainfall values from the selected PMP data (Annexure-IV).
(vi) Appropriate values of base flow is added to the flood flow to arrive at the total flow past the point of interest.
4.4.2.2 Limitations of the Method:
(i) Assumption of linearity between precipitation and flow rate can be assumed over a small range of precipitation only. It is therefore, necessary that the unit hydrograph used in the formulation are those generated from field observations for a comparable event.
(ii) The unit hydrograph is valid for a drainage basin having an area of not more than 8000 km2 [1].
(iii) PMF resulting from such a unit hydrograph computations can be considered acceptable subject to conditions given below. While using these conditions care should be taken that over the historical period there has not been any significant modification in the basin, in which case conditions (b) and (c) may not be valid.
(a) the PMP used is not lower than any historical or recorded value in the basin or any equivalent value recorded in nearby similar basin.
(b) the resulting water levels are not lower than observed historical levels. (c) Extrapolated values of PMF and resulting high water levels from the observed
historical data can be generated. The values generated from the design basis flood for the water level should not be lower than one arrives at by the above extrapolated values. It should however, be noted that extrapolation to low probability values should be done only to an extent where the extrapolation is meaningful.
4.4.3 Flow Over Structures:
Flow over the structure will be a function not only of the water level over the structure but also of the shape of the structure. For structures such as Ogee Spillway, Trapezoidal spillway, Dam overtopping i.e. level crest, gates in the dam and Dam breach, computational procedure are available [8]. Detailed formulation for these are given in Appendix-C.
17
4.5 Base Flow
The river channels will have a base flow even before the storm runoff starts contributing to the river channel. Contribution of this base flow is also to be added to the runoff flow. Depending on the season the base flow in rivers could vary drastically. It is therefore, essential that proper considerations of the season should be given while computing the base flow value.
4.6 Losses
During the initial rainfall all the precipitation may not contribute to the runoff. Part of the rainfall is lost either due to interception or infiltration and only remaining part of the precipitation contributes to the runoff. Normally losses are expressed as initial loss followed by a continuing loss over a period of time. The initial loss is due to the fact that the period preceeding the storm has been dry and major part of the initial pecipitation is absorbed either in the ground or in other depressions. Once this initial charging of the various routes is complete then only a small loss is observed over the duration of the storm.
Initial losses will depend on the terrain and the type of soil cover. Degree of the loss vis-a-vis the total rainfall in a PMP will thus depend on the conditions of the soil prior to the PMP as well as on the nature of the soil and its physical characteristics. For conservative estimate of flood these losses can be neglected. However, the decision to neglect losses should be taken judiciously considering the nature of the ground/soil i.e. percolation rate in the soil, total rainfall in the PMP, the possibility of antecedent storm to saturate the ground. Methods for calculating losses are given in HEC manual [8].
4.7 Precedent Precipitation
Effect of precedent rainfall on resulting runoff of a storm is to saturate the ground and thus reduce the losses to negligible amount. Effect on the maximum runoff or stage height value will depend on the strength of the precedent rainfall and the time interval between the two events precedent rainfall and PMP under consideration.
For planning purposes a storm resulting in half the PMP is taken as precedent storm separated by 24 hours in case the storms are the result of some convective activity. This approach would lead to higher estimates of flood potential. The sequential storms should be considered when the record of the historical storm events for a site indicate a good probability of the occurrence of consecutive storms. The strength and time duration of separation between the consecutive storms should be arrived at on the basis of the historical data available for the site.

18

19
Table 4.1
Effective Roughness Parameters for Overland Flow
Surface N Dense growth
0.4 - 0.5
Pasture 0.3 – 0.4
Lawns 0.2 - 0.3 Short grass prairi 0.1 - 0.2 Sparse vegetation 0.05 – 0.13 Bare clay - loam soil
0.01 – 0.03
Concrete/Asphat - Very shallow
Depths < 6 mm
- Small depths - > 6 mm to few cms.
0.10 – 0.15 0.05 – 0.10
20
5. INITIAL CONDITIONS AND COMBINED EVENTS
5.1 General
The values of ambient conditions of the soil, moisture, base flow and reservoir level are important parameters while estimating the runoff and floods due to precipitation in the channel. Since a very low probability flood causing event is generally considered, it is not necessary to assume very improbable values of these parameters for maximisation approach. However, care should be taken such that the values selected for these parameters are as realistic as possible for the site consideration from the point of location, season of the year and normal practice.
5.2 Initial conditions
Amount of precipitation water which will be lost through percolation in the soil will depend on the nature of the soil, its moisture content and moisture holding capacity. If the storms are considered to occur during rainy season and if the site has good amount of annual rains then it is always better to assume that the soil is saturated. Following can be the basis for using the parameter values:
(i) Soil Moisture: Median soil moisture for the expected month of the flood (to be
used at the start of the antecedent storm). (ii) Base Flow: Mean flow for the expected month of the flood (to be used at the
start of antecedent storm) (iii) Reservoir Level: Reservoir levels are taken as being at the upper point of the
curve given in the operating rules when the first of the flood producing events occurs. For maximisation approach it is taken as at FRL.
(iv) Coincident Wave Height: Heights of the wind generated wave of an appropriate mean occurrence interval from the critical direction and for the critical duration for maximising the waves (assume to coincide with the peak of the flood). However, attention should be paid to the possibility that the wind is a dependent variable and is related to the meteorological conditions generating the storm responsible for the flood. Normally wind wave effects are not considered when flood routing is being carried out. However, this parameter may assume importance during safety assessment of the integrity of the structure.
5.3 Combination of Events
The individual flood causing events can occur simultaneously. While considering the simultaneous occurrence of these events, it is necessary to consider the combined probability of occurrence of the individual flood causing incidences. This is necessary, as the occurrence of various flood causing events may be connected through the meteorological conditions likely to exist at the time. Events like seismic dam failure and floods due to precipitation as initiating event are not related and the combined probability of these events occurring simultaneously will be very small.

21
Sometimes seismic activity generated as a result of reservoir storage is suspected under such circumstances the failure due to this cause can also be considered and failure scenario be generated based on the relevant data. In such a case also the flood routing on overtopping of the dam would lead to a higher value of flood as compared to one generated due to hydrologically induced seismic failure. Probability of occurrence of a combined event is always smaller than the probability of the indepedent events which are being combined [7]. Code [1] gives guidelines as to the probability of events to be chosen for safety analysis, and any combination leading to probabilities lower than this value is not warranted. Combination of events should therefore, be carried out judiciously considering all aspects. Some typical combination of events that may be used are given in the footnote below2 [7].
2 Following is the list of some of the combinations of the events to be considered [7]:
(i) Dam failure caused by an S2 equivalent earthquake coincident with peak of 25 years flood. (ii) Inadvertent opening of all gates on an upstream dam coincident with peak of flood caused by one half
PMP. (iii) PMF due to precipitation. (iv) Dam failure caused by an S1 equivalent earthquake coincident with peak of flood caused by one-half
PMP. (v) Inadvertent opening of all low-level outlets in an upstream dam coincident with peak of flood caused
by one-half PMP.
22
6. FLOOD PROTECTION ASPECTS OF NUCLEAR POWER PLANT SITING 6.1 General
Effects of flood water on the structures can either be static or dynamic. Flood may carry debris as well as sediments which may cause adverse effects on the safety of the structures. Normally at the site selection stage, care is taken to locate the structures above the highest flood water level. However, sometimes if one cannot select a site above the highest flood water level then safety of the plant can still be achieved by incorporating engineering safety features.
6.2 Types of Protection
(i) Construct all structures important to safety above the level of the DBF. This can be achieved either by taking advantage of existing topographical features or by raising the ground level at the site.
OR (ii) Construct permanent external barriers such as levees, dykes or retaining wall
as per relevant Code [11]. 6.3 Analysis of Protection Structures
Whenever protection is achieved by incorporation of engineered safety features it is essential to carry out detailed studies to ascertain that the desired degree of safety is achieved. In case permanent external barriers are constructed, then integrity of these structures should also be critically examined. Apart from this, any construction near a water body is going to affect the flow and erosion-depositional patterns. Effects of the constructions due to these aspects and the impact of this on the safety of the plant and other structures should also be examined.
6.4 Monitoring and Forecasting for Plant Protection
During analysis of design basis flood for the inland sites, following data are used: (i) Probable Maximum Storm (ii) Unit hydrographs at various points along the channel (iii) Data on the permanent structures within and along the channels. The data on these parameters as available in the past are used during the site selection stage. It is necessary to do reassessment of the PMS periodically (10 year interval) on the basis of data collected subsequent to the site selection stage. This data will normally be available with IMD or CWC, suitably supplemented by observations at the site. The updating of unit hydrographs at various critical points along the channels should be carried out through appropriate agencies especially for all major flood events occurring within the basin. This will help not only to give an idea as to reliability of the data used, but also give effects of any modifications which have taken place either due to natural phenomenon or man made modifications along the channel.
23
Modification of the channel geometry due to human activity can play an important role in the channel flow characteristics. All modifications of such type should be noted and possibility of change in the flow characteristics should be looked into. In case such a change is envisaged, reworking of the flood routing should be undertaken. With accumulation of more data the validity of the DBF used for the safety analysis should be checked. In case the change of DBF is observed a detailed analysis of the effect of the changed DBF should be carried out and necessary safety features be included to ascertain the safety of the Nuclear Power Plant. While carrying out flood water computation due to storm, records of following parameters should be maintained such that only in case of any significant modification in them the exercise of reassessment be carried out. (a) The design basis storm used for the site (b) Flood hydrographs used at various points along the river course, together with
identification of locations of such points. (c) Existing river channel In case the design basis reference storm is changed for the site, the possibility of increase of flood water level should be examined. In case the river channel has changed either due to change of course or other man-made modifications then the hydrographs are likely to be changed and these effects need to be looked into. Apart from the basic parameters, it is essential to keep surveillance through the concerned authorities on the structural safety of various features like upstream and down stream dams, working of the gates of the upstream and downstream dams, flood regulating structures. It is also necessary to have information at the site through appropriate agencies on the incoming of the impending storm in the region of the site and the status of flow in the upstream and downstream storage structures. For this purpose it is essential that a coordination between the dam authorities and station authorities is established. This will help in streamlining the procedures/ instrumentation for early warning systems for floods and gate opening as well as routine checking of gates to avoid the non-operation scenario during high floods.
24
7. DATA BASE 7.1 General
Availability of accurate and reliable data base is a pre-requisite of any model formulation. The accuracy and reliability of the estimates obtained is dependent on the reliability of the data base. In this chapter, data essential for generation of estimates of the maximum water level at the site of interest from the inland flooding is given. The sources of the availability of this data are also identified.
7.2 Data for Probable Maximum Precipitation (PMP)
Data on precipitation required for PMP studies is of the precipitation during storm period. Duration of the storm is to be selected from the data. The duration for individual event is selected from the maximum impact likely to be generated by the event. Normally one day, two day or three day storm events are selected. However, for transposition of storms from other regions, the data of various storms which have occurred in similar regions and storm tracks are to be delineated.
This data is normally available from IMD and CWC.
7.3 Data for Runoff and Flood Estimations :
The runoff depends on the topographical features of the basin and various tributaries and main channel which collect the runoff water from the basin. In case of a large basin, it is essential to subdivide the same into smaller sub-basins appropriate to the tributaries collecting the runoff flood. Data needed for this are
(i) Detailed topographical map of the site showing the tributaries and channels
collecting the runoff water. (ii) Data on the nature of soil, moisture content, moisture holding capacity,
percolation capacity, vegetation and reservoirs in the basin. This data is essential for deciding the losses.
(iii) Base flow characteristics of various channels. All these data can be had from CWC or State Irrigation Department.
7.4 Data for Flood Routing
Data required for flood routing studies are two fold namely Reservoir Routing and Channel Routing.
For flood routing in the reservoir the data needed are as follows: (i) Topographical details of the reservoir area or capacity curve for the reservoir
till few meters above the dam spill-way level. (ii) Details of the spillway and gates (number and size)
25
For channel routing following data are essential; - Channel cross-section at different locations along the channel
- Channel roughness (Manning's coefficient) - Bed slope of the channel The data will be available from CWC or State Irrigation department.
7.5 Data for Dam Failure
Data needed in this case are for two purposes; one is for studying the stability of dam under various loading conditions and the other is for the purpose of modelling the breach shape and dimensions. For the first case the data needed are discussed in the relevant Guide. For the second case the data needed are as follows: (i) likely shape and dimensions of the breach (ii) time duration of the breach development For necessary assessment and anlaysis in this regard help of organisations like CWC or CWPRS can be taken.
7.6 Overview of Data Collection
(i) Rainfall intensity distribution during the storm (ii) Isohyetal pattern of the storm including the major axis of the storm. In case of transposition of the storm additional data needed are: - The track of the storm - Moisture conditions existing during the actual storm - Data of moisture conditions (Dew point) during the period of the actual storm
for the site where the storm is to be transposed. - Special orographical features at the site which can affect the storm rainfall. - Detailed topographical map of the basin involving the site.
In case of channel routing the data needed are: - Cross-sectional data of the entire channel - Unit hydrographs at various points of confluences of various tributaries to the
main channel - The various storage facilities along the channel - The storage facilities like base of the dam, bottom width, top width, type of
structure (Masonary, Rock field, concrete, earthen or arch dam), water levels (Full Reservoir Level, Minimum Drawn Down level) specifications of spillways, details of gate dimensions, overflow sections, capacity etc.

26
7.7 Data Availability
In India the data on rainfall is being routinely collected by IMD as well as by CWC. Data of storms and storm tracks is also available with IMD. Agencies which conduct the flood routing studies in India are Central Water Commission and Central Water and Power Research Station, Khadakwasala, Pune, IITs and some University Departments.

27
8. RELATIONSHIP BETWEEN FLOW AND FLOOD WATER LEVEL AND OTHER FLOOD PARAMETERS
The most important parameter needed for safety of plant from flooding is the flood water level. It is difficult to relate the flood flow level to flood water level as the relation will depend on the channel parameters. In the routing model, both flood level (water level) hydrograph and flood flow (velocity) hydrograph can be generated. While estimating this the existing and proposed structures in the channel and likely channel blockage during the flow must be considered as this will lead to backwater phenomenon and thus modify the water level and water flow relation. Erosion and sedimentation during the flood may be ignored. If the roughness of the channel is likely to be affected during the flood event, it can lead to higher water levels locally and hence this likely change of channel roughness be considered into calculations. In case it is not feasible to consider this effect, the final values of the increase in water level during flood at the site under investigation should be corrected to give credence to the increase due to change of the roughness. The water levels will also be affected due to the wind effects. Normally these effects will be small as compared to the water levels experienced during DBFs. However, in large storage bodies like lakes the effect of the waves generated by wind will be significant and this also should be considered. This will be the case for large storages along the river channel. Other hydrological variables such as maximum rate of increase or decrease of flood flows or levels, water velocity, sedimentation and erosion conditions can affect the water levels at the site. When the above parameters are likely to affect safety of structures, reasonable conservative assumptions should be made in order to arrive at an estimated value. Apart from water level and the flow velocities, sedimentation and erosion characteristics are likely to affect the safety of the structures along the channel as well as by the side of the channel. If the safety features of the plant are likely to be affected, a physical hydraulic model should be built up, to estimate the effects on the structures.
28
APPENDIX A
GRADUALLY VARIED UNSTEADY FLOW EQUATIONS
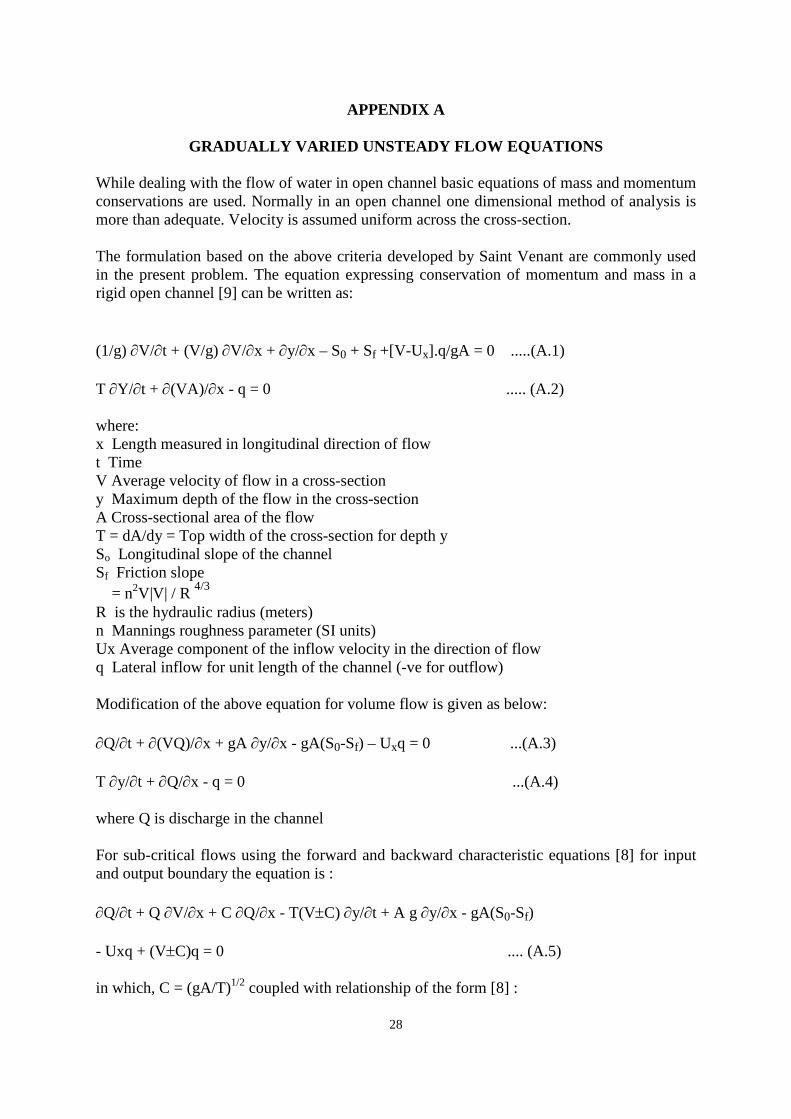
While dealing with the flow of water in open channel basic equations of mass and momentum conservations are used. Normally in an open channel one dimensional method of analysis is more than adequate. Velocity is assumed uniform across the cross-section. The formulation based on the above criteria developed by Saint Venant are commonly used in the present problem. The equation expressing conservation of momentum and mass in a rigid open channel [9] can be written as: (1/g) ∂V/∂t + (V/g) ∂V/∂x + ∂y/∂x – S0 + Sf +[V-Ux].q/gA = 0 .....(A.1) T ∂Y/∂t + ∂(VA)/∂x - q = 0 ..... (A.2) where: x Length measured in longitudinal direction of flow t Time V Average velocity of flow in a cross-section y Maximum depth of the flow in the cross-section A Cross-sectional area of the flow T = dA/dy = Top width of the cross-section for depth y So Longitudinal slope of the channel Sf Friction slope = n2V|V| / R 4/3
R is the hydraulic radius (meters) n Mannings roughness parameter (SI units) Ux Average component of the inflow velocity in the direction of flow q Lateral inflow for unit length of the channel (-ve for outflow) Modification of the above equation for volume flow is given as below: ∂Q/∂t + ∂(VQ)/∂x + gA ∂y/∂x - gA(S0-Sf) – Uxq = 0 ...(A.3) T ∂y/∂t + ∂Q/∂x - q = 0 ...(A.4) where Q is discharge in the channel For sub-critical flows using the forward and backward characteristic equations [8] for input and output boundary the equation is : ∂Q/∂t + Q ∂V/∂x + C ∂Q/∂x - T(V±C) ∂y/∂t + A g ∂y/∂x - gA(S0-Sf) - Uxq + (V±C)q = 0 .... (A.5) in which, C = (gA/T)1/2 coupled with relationship of the form [8] :

29
Ay + BQ = C for the boundary conditions ... (A.6) where A,B and C are known quantities. Usually either A or B is zero at the upper boundary, and A,B and C express segments of rating curve for the lower boundary. These equations can be solved using either finite difference method (explicit or implicit methods) or by finite element method or method of characteristics. Essential Data - Cross-sectional data at various grid points - Input to the channel in terms of inflow hydrograph - Rating curve i.e relation of outflow to height of water at the outflow end - Channel roughness coefficient averaged over the entire region. Normally it is difficult to compute channel roughness. However the program can be run for known situations to arrive at the best value of this parameter.

30
APPENDIX B
RESERVOIR ROUTING
In the reservoir because of the storage the mass conservation equations are sufficient for carrying out the reservoir routing. The law of conservation of mass gives: dS/dt = I (t) - Q(t) .... (B.1) where I is the reservoir inflow at time 't' Q is the reservoir outflow at time 't' dS/dt is the time rate of change of the reservoir volume. S is the storage volume The above equation can be written in finite difference form as: (St+∆t-St)/∆t = (It+∆t +It)/2- (Qt+∆t +Qt)/2 ….(B.2)
(2St+∆t/∆t +Qt+∆t = (It+∆t +It) + (2St/∆t-Qt) ….(B.3) The outflow hydrograph as a function of the height behind the storage structure can be generated using the Appendix C. The inflow hydrograph to the reservoir will be the outflow hydrograph of the routed flood flow from the previous channel and is known and the height of the water level behind the storage can be generated.

31
APPENDIX C
METHODS FOR GENERATION OF OUT-FLOW HYDROGRAPH Spillway outflow from the dam structure will be from the gated spillway as well as from the top of the spillway. The spillway outflow is computed as: Qs = Ls cs(h-hs)
1.5 + Ag cg(h-hg)0.5 + Ld cd(h-hd)1.5 + Qt ...(C.1) where h is the water level behind the storage hs is the uncontrolled spillway crest hg centre line elevation of the gated spillway hd height of the crest of the dam cs uncontrolled spillway discharge coefficient cg gated spillway discharge coefficient cd discharge coefficient for the the flow over the crest of the dam Ls spillway length Ag gate area Ld Length of dam–Ls Qt constant outflow term which is head independent Discharge through a trapezoidal opening section (invariably valid for dam breach) The breach outflow is computed as: Qb = c1(h-hb)1.5 + c2(h-hb)2.5 .... (C.2) where c1 = 3.1 bi cv ks c2 = 2.45 z cv ks bi = b/Tb cv = 1.0 + 0.023 Q2 /(Bd
2 h2(h-hb)) ks = 1.0 if (ht –hb)/(h-hb) < 0.67 = 1.0 - 27.8 {(ht-hb)/(h-hb)-0.67)3
where z is side slope (1 vertical: z horizontal) of breach hb is the elevation of breach bottom (feet) h is the reservoir water level elevation (feet) bi is the instantaneous breach bottom width (feet)

32
cv velocity of approach coefficient Q is the total outflow from the reservoir (CFS) Bd is the width of the reservoir at the dam (feet) Ks is the submergence coefficient for tailwater elevation ht is the tailwater elevation (feet) b is the final bottom width of the breach (feet). Refer[12]
33
ANNEXURE - I
DAM-BREAK ANALYSIS
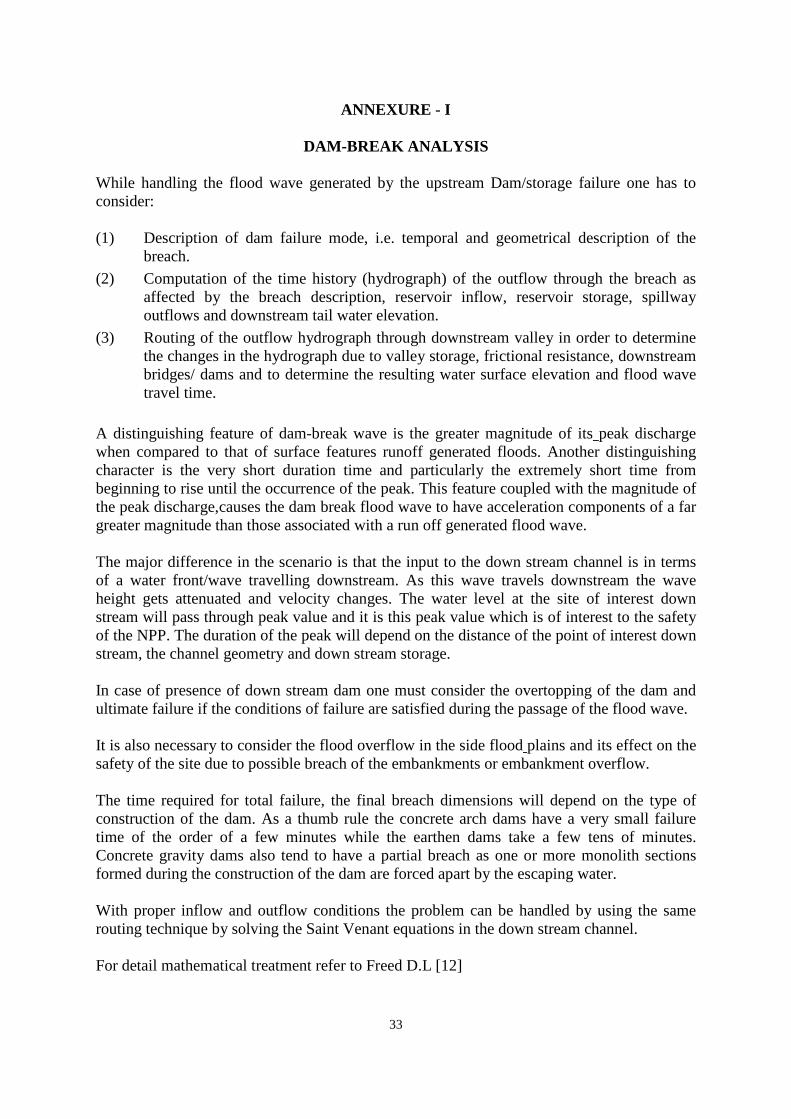
While handling the flood wave generated by the upstream Dam/storage failure one has to consider: (1) Description of dam failure mode, i.e. temporal and geometrical description of the
breach. (2) Computation of the time history (hydrograph) of the outflow through the breach as
affected by the breach description, reservoir inflow, reservoir storage, spillway outflows and downstream tail water elevation.
(3) Routing of the outflow hydrograph through downstream valley in order to determine the changes in the hydrograph due to valley storage, frictional resistance, downstream bridges/ dams and to determine the resulting water surface elevation and flood wave travel time.
A distinguishing feature of dam-break wave is the greater magnitude of its peak discharge when compared to that of surface features runoff generated floods. Another distinguishing character is the very short duration time and particularly the extremely short time from beginning to rise until the occurrence of the peak. This feature coupled with the magnitude of the peak discharge,causes the dam break flood wave to have acceleration components of a far greater magnitude than those associated with a run off generated flood wave. The major difference in the scenario is that the input to the down stream channel is in terms of a water front/wave travelling downstream. As this wave travels downstream the wave height gets attenuated and velocity changes. The water level at the site of interest down stream will pass through peak value and it is this peak value which is of interest to the safety of the NPP. The duration of the peak will depend on the distance of the point of interest down stream, the channel geometry and down stream storage. In case of presence of down stream dam one must consider the overtopping of the dam and ultimate failure if the conditions of failure are satisfied during the passage of the flood wave. It is also necessary to consider the flood overflow in the side flood plains and its effect on the safety of the site due to possible breach of the embankments or embankment overflow. The time required for total failure, the final breach dimensions will depend on the type of construction of the dam. As a thumb rule the concrete arch dams have a very small failure time of the order of a few minutes while the earthen dams take a few tens of minutes. Concrete gravity dams also tend to have a partial breach as one or more monolith sections formed during the construction of the dam are forced apart by the escaping water. With proper inflow and outflow conditions the problem can be handled by using the same routing technique by solving the Saint Venant equations in the down stream channel. For detail mathematical treatment refer to Freed D.L [12]
34
ANNEXURE II
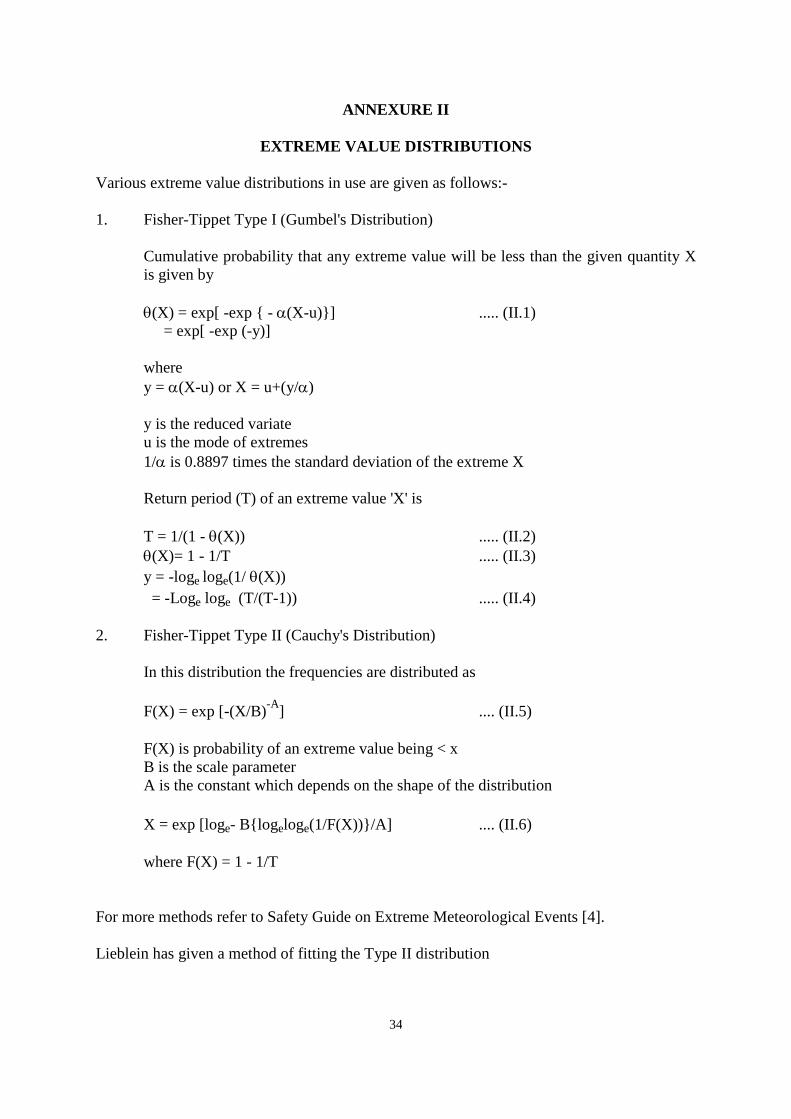
EXTREME VALUE DISTRIBUTIONS Various extreme value distributions in use are given as follows:- 1. Fisher-Tippet Type I (Gumbel's Distribution)
Cumulative probability that any extreme value will be less than the given quantity X is given by θ(X) = exp[ -exp { - α(X-u)}] ..... (II.1) = exp[ -exp (-y)] where y = α(X-u) or X = u+(y/α) y is the reduced variate u is the mode of extremes 1/α is 0.8897 times the standard deviation of the extreme X Return period (T) of an extreme value 'X' is T = 1/(1 - θ(X)) ..... (II.2) θ(X)= 1 - 1/T ..... (II.3) y = -loge loge(1/ θ(X)) = -Loge loge (T/(T-1)) ..... (II.4)
2. Fisher-Tippet Type II (Cauchy's Distribution)
In this distribution the frequencies are distributed as F(X) = exp [-(X/B)-A] .... (II.5) F(X) is probability of an extreme value being < x B is the scale parameter A is the constant which depends on the shape of the distribution X = exp [loge- B{logeloge(1/F(X))}/A] .... (II.6) where F(X) = 1 - 1/T
For more methods refer to Safety Guide on Extreme Meteorological Events [4]. Lieblein has given a method of fitting the Type II distribution

35
Various methods which can be used for fitting the observed distributions are: 1. Methods of Moments 2. Method of Maximum likelyhood 3. Method of Maximum Entropy 4. Method of Probability weighted Moments
36
ANNEXURE III
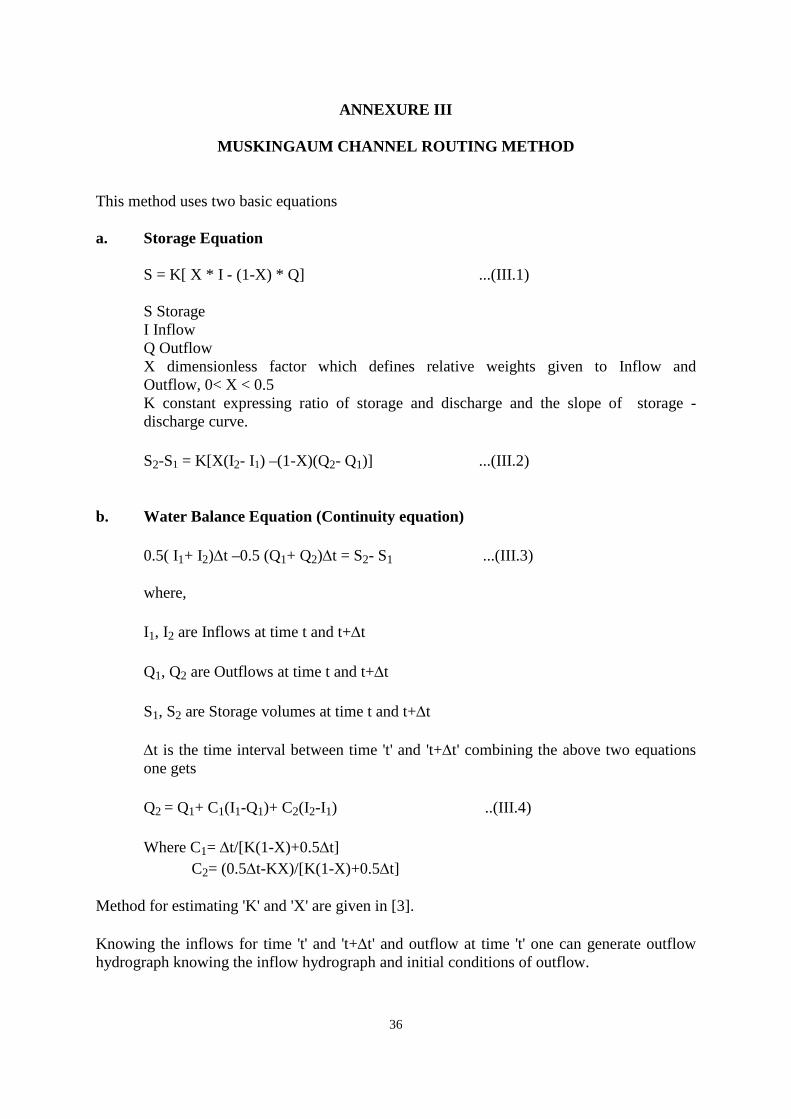
MUSKINGAUM CHANNEL ROUTING METHOD This method uses two basic equations a. Storage Equation
S = K[ X * I - (1-X) * Q] ...(III.1) S Storage I Inflow Q Outflow X dimensionless factor which defines relative weights given to Inflow and Outflow, 0< X < 0.5 K constant expressing ratio of storage and discharge and the slope of storage - discharge curve. S2-S1 = K[X(I2- I1) –(1-X)(Q2- Q1)] ...(III.2)
b. Water Balance Equation (Continuity equation)
0.5( I1+ I2)∆t –0.5 (Q1+ Q2)∆t = S2- S1 ...(III.3) where, I1, I2 are Inflows at time t and t+∆t Q1, Q2 are Outflows at time t and t+∆t S1, S2 are Storage volumes at time t and t+∆t ∆t is the time interval between time 't' and 't+∆t' combining the above two equations one gets Q2 = Q1+ C1(I1-Q1)+ C2(I2-I1) ..(III.4) Where C1= ∆t/[K(1-X)+0.5∆t]
C2= (0.5∆t-KX)/[K(1-X)+0.5∆t] Method for estimating 'K' and 'X' are given in [3]. Knowing the inflows for time 't' and 't+∆t' and outflow at time 't' one can generate outflow hydrograph knowing the inflow hydrograph and initial conditions of outflow.
37
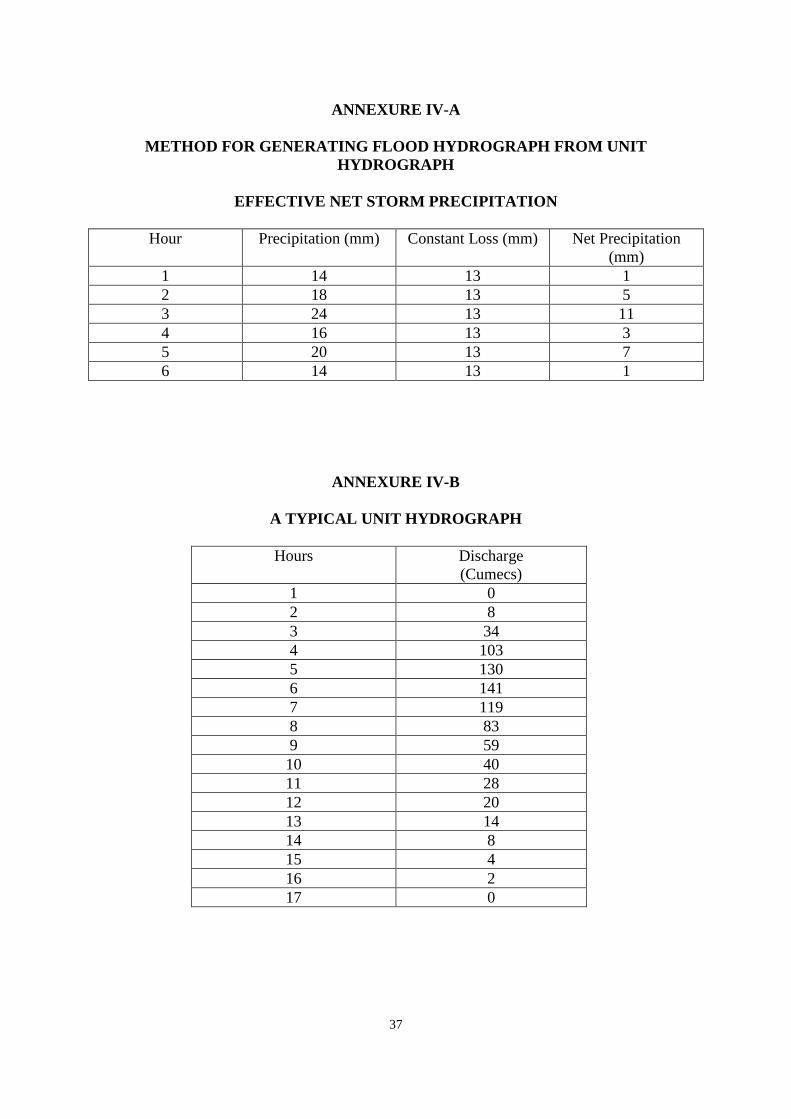
ANNEXURE IV-A
METHOD FOR GENERATING FLOOD HYDROGRAPH FROM UNIT HYDROGRAPH
EFFECTIVE NET STORM PRECIPITATION
Hour Precipitation (mm) Constant Loss (mm) Net Precipitation
(mm) 1 14 13 1 2 18 13 5 3 24 13 11 4 16 13 3 5 20 13 7 6 14 13 1
ANNEXURE IV-B
A TYPICAL UNIT HYDROGRAPH
Hours Discharge (Cumecs)
1 0 2 8 3 34 4 103 5 130 6 141 7 119 8 83 9 59 10 40 11 28 12 20 13 14 14 8 15 4 16 2 17 0
38
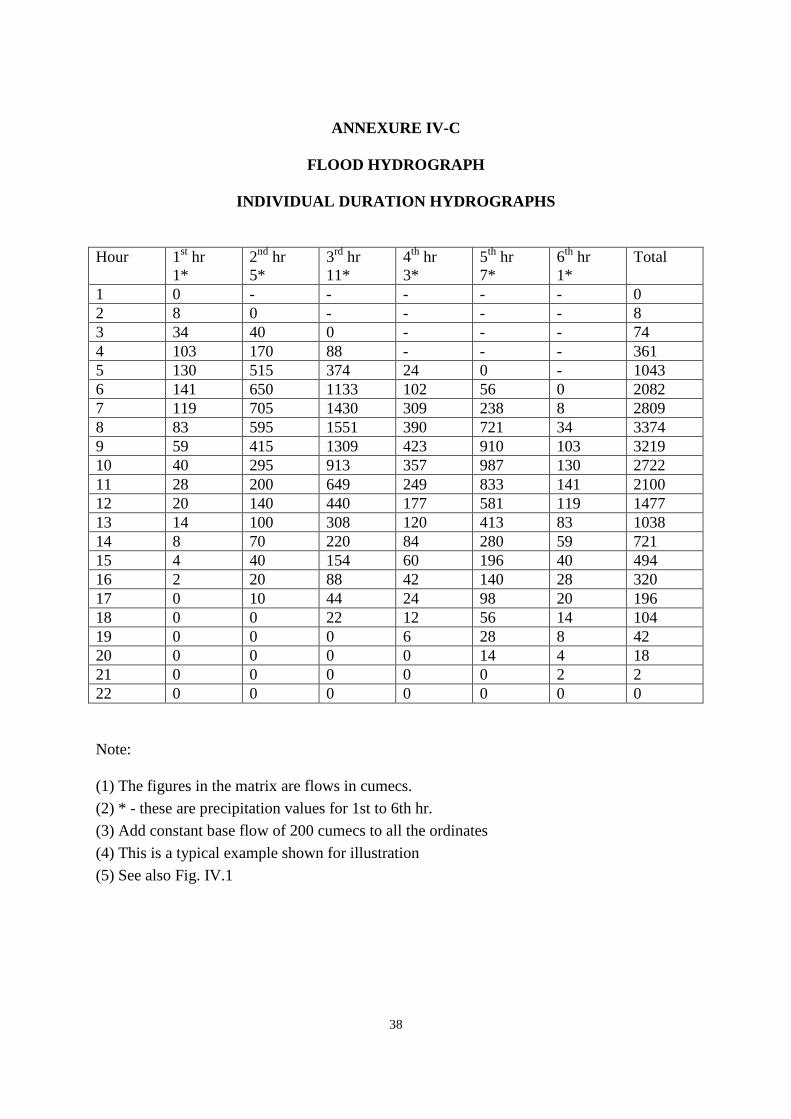
ANNEXURE IV-C
FLOOD HYDROGRAPH
INDIVIDUAL DURATION HYDROGRAPHS
Hour 1st hr
1* 2nd hr 5*
3rd hr 11*
4th hr 3*
5th hr 7*
6th hr 1*
Total
1 0 - - - - - 0 2 8 0 - - - - 8 3 34 40 0 - - - 74 4 103 170 88 - - - 361 5 130 515 374 24 0 - 1043 6 141 650 1133 102 56 0 2082 7 119 705 1430 309 238 8 2809 8 83 595 1551 390 721 34 3374 9 59 415 1309 423 910 103 3219 10 40 295 913 357 987 130 2722 11 28 200 649 249 833 141 2100 12 20 140 440 177 581 119 1477 13 14 100 308 120 413 83 1038 14 8 70 220 84 280 59 721 15 4 40 154 60 196 40 494 16 2 20 88 42 140 28 320 17 0 10 44 24 98 20 196 18 0 0 22 12 56 14 104 19 0 0 0 6 28 8 42 20 0 0 0 0 14 4 18 21 0 0 0 0 0 2 2 22 0 0 0 0 0 0 0 Note: (1) The figures in the matrix are flows in cumecs. (2) * - these are precipitation values for 1st to 6th hr. (3) Add constant base flow of 200 cumecs to all the ordinates (4) This is a typical example shown for illustration (5) See also Fig. IV.1

39
40
BIBLIOGRAPHY
1. AERB Code No. SC/S, 1990 Code of Practice on Safety in Nuclear Power Plant Siting.
2. Manual of Hydrometerological (Part I), India Met. Department 1972. 3. Manual of Flood Forecasting, Central Water Commission, 1989. 4. AERB/SG/S-3 Extreme Values of Meteorological Parameters (Under
preparation). 5. Huynh NGOG PHIEN, 'A Review of methods of parameter estimation for the extreme
value type-1, distribution', Journal of Hydrology, 90 (1987), 251-68 6. AERB/SG/S-11 Seismic Studies and Design Basis Ground Motion for Nuclear Power
Plant Siting. 7. IAEA/SG/S-10A, 1983 Design basis flood for nuclear power plants on river sites. 8. Flood Hydrograph Package Users Manual, HEC-1 (Hydrological Engineering Centre
Water Resources Centre, U.S. Army Corps of Engineer 1981. 9. Richard L. Cooley and Syed Afaq Molu, 'Finite Element Solution of Saint Venant
Equations', Journal of Hydraulics Division, Vol. 102, No. HY 6, June 1976, PP 759-778
10. Theodar Strelkoff, 'Numerical Solution of Saint Venant Equations' Journal of
Hydraulics Division, ASCE Vol.96, No. HY 1, PP 223-252, 1970. 11. AERB Code No. AERB/CSE/SC Code of Practice for Nuclear Power Plant Safety
Related Civil Engineering Structures. 12. Dam break Analysis, The Hydrological Engineering Center, Water resources Support
Center, US Army Corps of Engineers, 1980.

41
LIST OF PARTICIPANTS
Committee to prepare Guides and Manuals for Safety in Nuclear Power Plant Siting
(CPSGS)
Dates of Meeting : August 2, 1991 March 3, 1992 June 26, 1992 July 3,7 1992 August 17,1992 August 5, 1993 Members & Invitees participating in the meetings: Shri S. Krishnan (Chairman) NPC Dr. V.N. Bapat* BARC Dr. A.K. Ghosh BARC Shri T.M. Krishnamoorthy BARC Shri M.M. Tilak NPC Shri G.K. De (Member-Secretary) AERB Shri S.T. Swamy AERB * Author of the first draft of this Guide.

42
Advisory Committee on Nuclear Safety (ACNS) Date of meeting : January 24, 1998 Members and Invitees participating in the meeting Shri S.K.Mehta (Chairman) Ex-Director, RG, BARC Shri S.M.C.Pillai President, Nagarjuna group Prof M.S.Kalra IIT, Kanpur Prof U.N.Gaitonde IIT, Mumbai Shri S.K.Goyal BHEL, Hyderbad Shri Ch.Surendar NPC Shri M.S.Kumra BARC Dr. U.C.Mishra BARC Shri S.K.Sharma BARC Dr. V.Venkat Raj BARC Shri V.K.Chaturvedi NPC Shri S.P.Singh Ex-Head, NSD, AERB Shri G.K.De (Member-Secretary) AERB Shri S.Krishan Invitee, NPC Dr. V.N.Bapat Invitee, Consultant Shri K.Srivasista Invitee, AERB Shri Y.K.Shah Invitee, AERB Smt. Usha A. Menon Permanent Invitee, AERB

43
PROVISIONAL LIST OF SAFETY GUIDES UNDER SITING CODE
Safety Guide Title
SG/S-1 Meteorological Dispersion Modelling
SG/S-2 Hydrological Dispersion in Relation to NPP Siting
SG/S-3 Extreme Value Analysis for Meteorological Parameters
SG/S-4 Hydrogeological Aspects Related to NPP Siting
SG/S-5 Calculational Models for Dose from Concentrations
SG/S-6A Design Basis Floods for Inland NPP Sites
SG/S-6B Design Basis Floods for Coastal NPP Sites
SG/S-7 Man-Induced Events and Establishment of DBFs
SG/S-8 Influence of Site Parameters on Emergency Preparedness
SG/S9 Population Distribution and its Analysis
SG/S-10 Quality Assurance in Siting
SG/S-11 Design Basis Ground Motion for NPP Sites
44
AERB SAFETY GUIDE No. AERB/SG/S-6A
Published by : The Publication Cell Atomic Energy Regulatory Board Niyamak Bhavan Anushaktrinagar Mumbai – 400 094