Embed Size (px)
Citation preview
182 © 2012 Ernst & Sohn Verlag für Architektur und technische Wissenschaften GmbH & Co. KG, Berlin · Structural Concrete 13 (2012), No. 3
Articles
DOI: 10.1002/suco.201100054
Fatigue design according to CEB-FIP Model Code 90 [1] is limitedto concrete grades up to C80. In addition, the design rules includea strength-dependent reduction in the fatigue reference strength,which leads to uneconomical design of high-strength concrete.Considering comprehensive knowledge now available concern-ing the fatigue behaviour of normal-strength and high-strengthconcretes, the amount of this reduction can no longer be justi-fied. A new design model for compressive fatigue loading and itsderivation is presented in this article [2, 3]. A comparison be-tween the new design model and the current standard ones [1]reveals that the new design model ensures safe and economicaldesign of normal-strength, high-strength and ultra-high-strengthconcrete. This new design model is included in the new fib ModelCode 2010 [4].
Keywords: fatigue, design model, high-performance concrete, Model Code 2010
1 Introduction
The design of structures with regard to the material prop-erties of high-strength and ultra-high-strength concretes(UHPC) usually leads to lightweight and slender structuralelements that differ significantly from the traditional bulkystructures. Concurrently, those structures with a reduceddead weight are more susceptible to variable loads, e.g.non-static loading. As a consequence, the influence ofcyclic stresses increases and fatigue becomes relevant forsuch concrete structures. The Woehler curves of CEB-FIPModel Code 90 [1] are based on research conducted byPetkovic [5, 6]. However, types of concrete with compres-sive strengths > 100 MPa were not considered in that re-search work, reflecting the fact that there was no reliableexperience with such types of concrete in those days. Fur-thermore, that research was conducted based on a limitednumber of samples [5, 6].
Hence, one focus of the research work presented inthis paper is an ultra-high-strength concrete (UHPC) withan average compressive strength of 180 MPa [2]. The num-ber of samples used in these fatigue tests was much largerthan Petkovic’s. Additional investigations were conductedon a normal-strength and a high-strength concrete for the
purpose of comparison. Based on these test results, newWoehler curves and a new approach to the fatigue designof normal-strength, high-strength and ultra-high-strengthconcrete under uniaxial compressive fatigue loading was developed in [2], and subsequently developed further [3].Therefore, the fatigue design values of CEB-FIP ModelCode 90 [1] were modified in such a way that they apply tonormal-strength, high-strength and, additionally, ultra-high-strength concrete. The design model and its capabili-ties are presented in this paper. A comparison between thenew design model and the design Model according toCEB-FIP Model Code 90 [1] shows that the new designmodel ensures safe and economical design of concrete un-der fatigue loading. The design model presented is includ-ed in the new fib Model Code 2010 [4].
2 Experimental investigations2.1 Test specimens
The following results were obtained based on experimen-tal investigations on two ultra-high-strength concrete mix-tures, which were the standard mixtures in priority programme 1182 “Sustainable Building with Ultra-High-Performance Concrete” funded by the German ResearchFoundation (DFG).
The ultra-high-strength fine-grained concrete (M2Q),with a maximum grain size of 0.5 mm, and the coarse-grained concrete (B4Q), with a maximum grain size of 8.0 mm, had 28-day compressive strengths offc,cube,100 = 160 MPa and fc,cube,100 = 180 MPa respectively,both after storage underwater [7]. Both mixtures con-tained 2.5 % by vol. of high-strength smooth steel fibreswith a length of 9.0 mm and an l/d ratio of 60. The exper-imental investigations were carried out using cylindricaltest specimens with dimensions d x h = 60 × 180 mm. Theformwork was removed after 48 hours and the specimenswere then heat-treated at 120 °C for 2 days. Following theheat treatment, the cylinders were stored in standardizedconditions (20 °C, 65 % RH) until testing. Before testing,the loaded surfaces of the specimens were ground paralleland then polished.
2.2 Testing machines
Most of the fatigue tests, with expected numbers of cyclesto failure of up to N = 2.0 · 106, were conducted using a
Design model for the fatigue behaviour of normal-strength, high-strength andultra-high-strength concrete
Ludger LohausNadja Oneschkow*Maik Wefer
* Corresponding author: [email protected]
Submitted for review: 18 November 2011Revised: 22 March 2012Accepted for publication: 29 April 2012
183
L. Lohaus/N. Oneschkow/M. Wefer · Design model for the fatigue behaviour of normal-strength, high-strength and ultra-high-strength concrete
Structural Concrete 13 (2012), No. 3
servo-hydraulic universal testing machine with a test fre-quency of fP = 10 Hz. A 1 MN actuator was used for thesetests. In cases where the expected numbers of cycles tofailure were higher than N = 2.0 · 106, the tests were car-ried out using a resonance testing machine with a test fre-quency of approx. fP ≈ 60 Hz. Both testing machines wereused for expected numbers of cycles to failure of betweenN = 5.0 · 105 and N = 2.0 · 106. The test results show thatcompared with the servo-hydraulic testing machine, thecharacteristics of the resonance testing machine led tolower numbers of cycles to failure [2]. Thus, the considera-tion of these test results is on the safe side.
2.3 Fatigue tests and evaluation of test results
Sufficient data are required for determining reliable re-gression lines in the finite life fatigue strength range.Therefore, single-level Woehler fatigue tests were carriedout on the two types of ultra-high-strength concrete withconstant minimum compressive stress levels ofSc,min = 0.05, Sc,min = 0.20 and Sc,min = 0.40. The mean val-ues of static compressive strengths fcm,i were determinedusing at least three specimens from the same batch andwith the same geometry. These mean values were used asreference strengths for calculating Sc,min and Sc,max. Theregression lines shown in Fig. 1 were established based on88 tests with a minimum compressive stress level ofSc,min = 0.05, 21 tests with Sc,min = 0.20 and 12 tests withSc,min = 0.40.
No significant differences in the regression lineswere found in the test results for UHPCs with differentgrain compositions. This confirms the findings in [8] and[9] that different grain compositions have no significant ef-fect on the fatigue behaviour. Thus, the two UHPC mix-tures were not considered separately. Taking into accountthe assumptions mentioned above, the regression analysisbased on single values of the logarithmic number of cyclesto failure results in the following regression lines for ultra-high-strength concrete (see also Fig. 1):
log N = –12.4 · Sc,max + 14.1; B = 0,87 for Sc,min = 0.05 (1)
log N = –18.7 · Sc,max + 19.2; B = 0.96 for Sc,min = 0.20 (2)
log N = –24.9 · Sc,max + 25.4; B = 0.78for Sc,min = 0.40 (3)
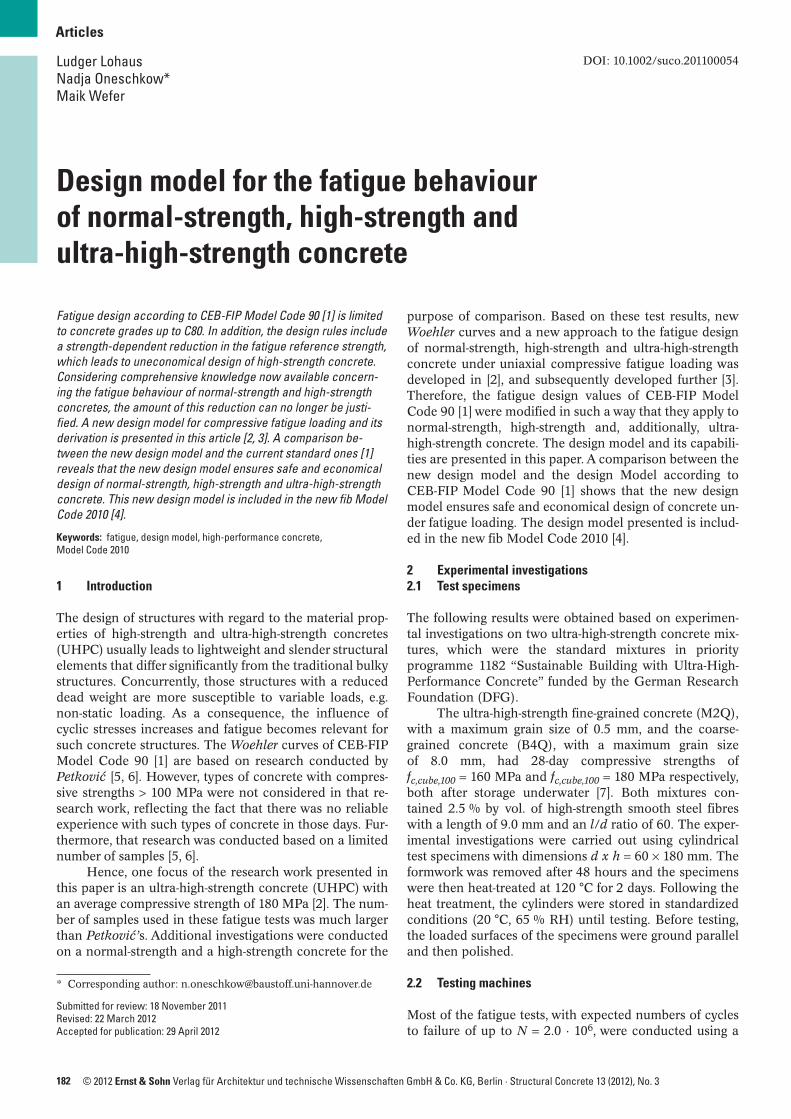
In accordance with [10], an investigation was carried outto discover whether the variances in the number of cyclesto failure in the fatigue tests can be traced back to the vari-ances in static compressive strength. Therefore, a normaldistribution was used to describe the static compressivestrength and the logarithmic numbers of cycles to failure.The tolerance range, which results from the variances inthe static compressive strength, can be determined for the95 % level of confidence. The tolerance range is exemplar-ily calculated for a maximum compressive stress level ofSc,max = 0.70 according to [11] as follows [2]:
(4)
whereTst
U; TstO lower and upper bounds of tolerance range,
which results from variances in the static com-pressive strength
x–st static compressive strengthkT value for determining the tolerance range
As an example, Fig. 2 compares the tolerance range (TstU;
TstO) resulting from the variances in static compressive
strength (x–st) with the tolerance range resulting from thevariances in number of cycles to failure for Sc,max = 0.70and Sc,min = 0.05.
It is obvious that the range of variation (TstU ≤
x–st ≤ TstO) resulting from the variances in the static com-
pressive strength, and thus included in the fatigue tests,completely covers the tolerance range of the regressionlines. Accordingly, for ultra-high-strength concrete underfatigue loading, similarly to normal and lightweight con-crete [10], no additional variances could be observed dueto fatigue loading.
The influence of the minimum stress level Sc,minmust be taken into account for a complete description of
=⋅
≈ < =
= < ≈ +⋅
=
T S –(k s)S
0.61 S
0.70 0.79 S(k s)S
T
stU
c,maxT
c,maxc,max
c,maxT
c,maxstO
0.0 1.0 2.0 3.0 4.0 5.0 6.0 7.0 8.0number of cycles to failure log N [-]
0.5
0.6
0.7
0.8
0.9
1.0
Sc,
max
= σ
c,m
ax /
f cm,i [
-]
Sc,min = 0.05Sc,min = 0.20Sc,min = 0.40
Fig. 1. Experimental test results and regression lines
0.0 1.0 2.0 3.0 4.0 5.0 6.0 7.0 8.0
number of cycles to failure log N [-]
0.4
0.5
0.6
0.7
0.8
0.9
1.0
Sc,
max
= σ
c,m
ax /
f cm,i [
-]
single valueregression linerange of tolerance Sc,min = 0.05
TstO = xst + kT * s
xst
TstU = xst - kT * s
∆ log N
Fig. 2. Comparison between range of variation in static strength and toler-ance range for number of cycles to failure
184
L. Lohaus/N. Oneschkow/M. Wefer · Design model for the fatigue behaviour of normal-strength, high-strength and ultra-high-strength concrete
Structural Concrete 13 (2012), No. 3
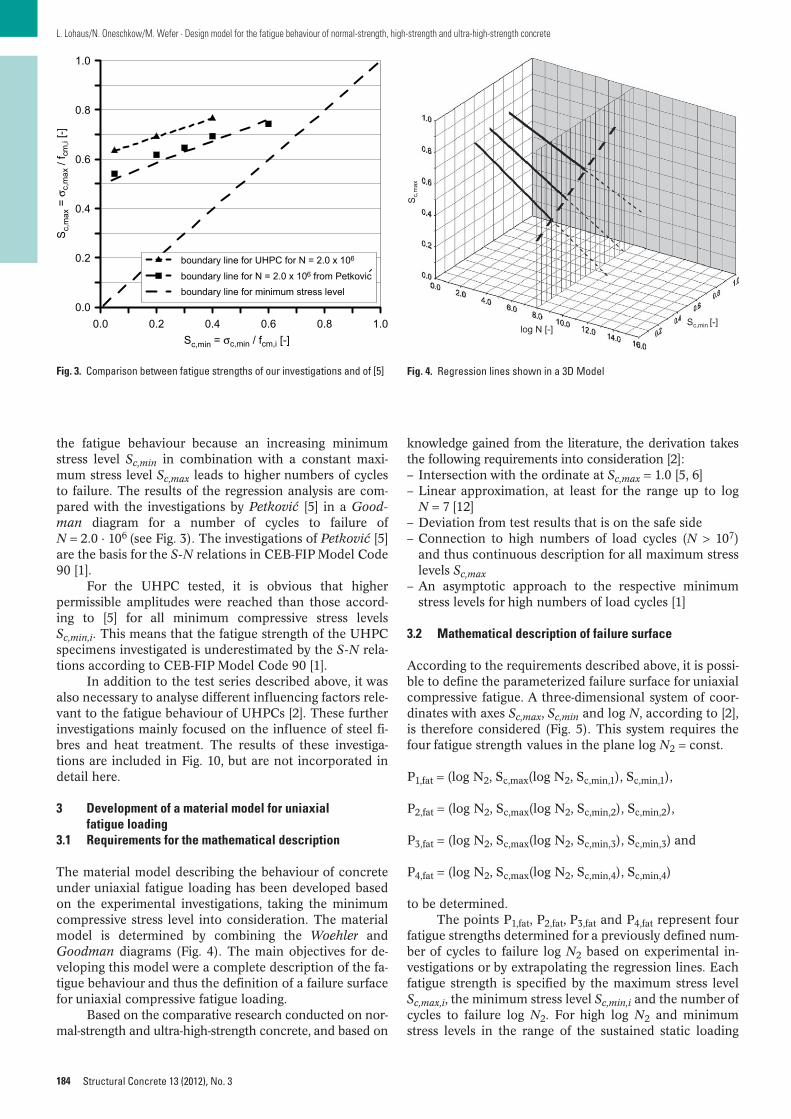
the fatigue behaviour because an increasing minimumstress level Sc,min in combination with a constant maxi-mum stress level Sc,max leads to higher numbers of cyclesto failure. The results of the regression analysis are com-pared with the investigations by Petkovic [5] in a Good-man diagram for a number of cycles to failure ofN = 2.0 · 106 (see Fig. 3). The investigations of Petkovic [5]are the basis for the S-N relations in CEB-FIP Model Code90 [1].
For the UHPC tested, it is obvious that higher permissible amplitudes were reached than those accord-ing to [5] for all minimum compressive stress levels Sc,min,i. This means that the fatigue strength of the UHPCspecimens investigated is underestimated by the S-N rela-tions according to CEB-FIP Model Code 90 [1].
In addition to the test series described above, it wasalso necessary to analyse different influencing factors rele-vant to the fatigue behaviour of UHPCs [2]. These furtherinvestigations mainly focused on the influence of steel fi-bres and heat treatment. The results of these investiga-tions are included in Fig. 10, but are not incorporated indetail here.
3 Development of a material model for uniaxial fatigue loading
3.1 Requirements for the mathematical description
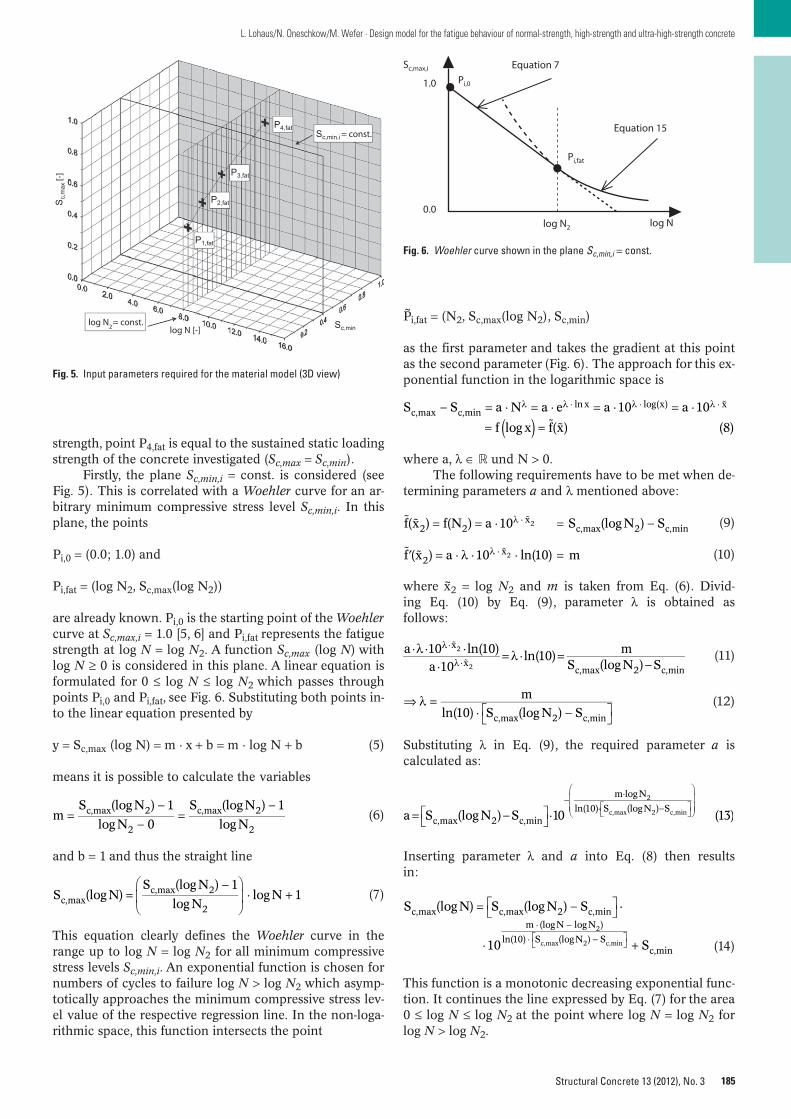
The material model describing the behaviour of concreteunder uniaxial fatigue loading has been developed basedon the experimental investigations, taking the minimumcompressive stress level into consideration. The materialmodel is determined by combining the Woehler andGoodman diagrams (Fig. 4). The main objectives for de-veloping this model were a complete description of the fa-tigue behaviour and thus the definition of a failure surfacefor uniaxial compressive fatigue loading.
Based on the comparative research conducted on nor-mal-strength and ultra-high-strength concrete, and based on
knowledge gained from the literature, the derivation takesthe following requirements into consideration [2]:– Intersection with the ordinate at Sc,max = 1.0 [5, 6]– Linear approximation, at least for the range up to log
N = 7 [12]– Deviation from test results that is on the safe side– Connection to high numbers of load cycles (N > 107)
and thus continuous description for all maximum stresslevels Sc,max
– An asymptotic approach to the respective minimumstress levels for high numbers of load cycles [1]
3.2 Mathematical description of failure surface
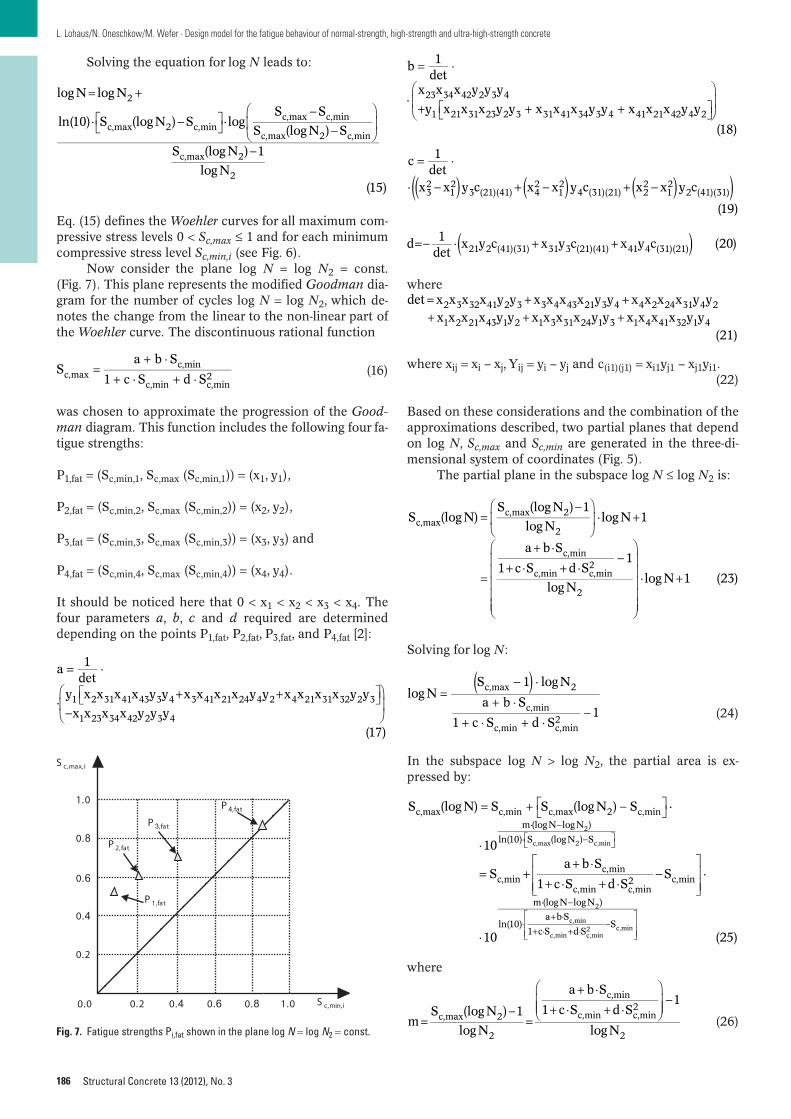
According to the requirements described above, it is possi-ble to define the parameterized failure surface for uniaxialcompressive fatigue. A three-dimensional system of coor-dinates with axes Sc,max, Sc,min and log N, according to [2],is therefore considered (Fig. 5). This system requires thefour fatigue strength values in the plane log N2 = const.
P1,fat = (log N2, Sc,max(log N2, Sc,min,1), Sc,min,1),
P2,fat = (log N2, Sc,max(log N2, Sc,min,2), Sc,min,2),
P3,fat = (log N2, Sc,max(log N2, Sc,min,3), Sc,min,3) and
P4,fat = (log N2, Sc,max(log N2, Sc,min,4), Sc,min,4)
to be determined.The points P1,fat, P2,fat, P3,fat and P4,fat represent four
fatigue strengths determined for a previously defined num-ber of cycles to failure log N2 based on experimental in-vestigations or by extrapolating the regression lines. Eachfatigue strength is specified by the maximum stress levelSc,max,i, the minimum stress level Sc,min,i and the number ofcycles to failure log N2. For high log N2 and minimumstress levels in the range of the sustained static loading
0.0 0.2 0.4 0.6 0.8 1.0Sc,min = σc,min / fcm,i [-]
0.0
0.2
0.4
0.6
0.8
1.0S
c,m
ax =
σc,
max
/ f cm
,i [-]
boundary line for UHPC for N = 2.0 x 10⁶
boundary line for N = 2.0 x 10⁶ from Petkovicboundary line for minimum stress level
Fig. 3. Comparison between fatigue strengths of our investigations and of [5]
Sc,
max
Sc,min [-]log N [-]
Fig. 4. Regression lines shown in a 3D Model
185
L. Lohaus/N. Oneschkow/M. Wefer · Design model for the fatigue behaviour of normal-strength, high-strength and ultra-high-strength concrete
Structural Concrete 13 (2012), No. 3
strength, point P4,fat is equal to the sustained static loadingstrength of the concrete investigated (Sc,max = Sc,min).
Firstly, the plane Sc,min,i = const. is considered (seeFig. 5). This is correlated with a Woehler curve for an ar-bitrary minimum compressive stress level Sc,min,i. In thisplane, the points
Pi,0 = (0.0; 1.0) and
Pi,fat = (log N2, Sc,max(log N2))
are already known. Pi,0 is the starting point of the Woehlercurve at Sc,max,i = 1.0 [5, 6] and Pi,fat represents the fatiguestrength at log N = log N2. A function Sc,max (log N) withlog N ≥ 0 is considered in this plane. A linear equation isformulated for 0 ≤ log N ≤ log N2 which passes throughpoints Pi,0 and Pi,fat, see Fig. 6. Substituting both points in-to the linear equation presented by
y = Sc,max (log N) = m · x + b = m · log N + b (5)
means it is possible to calculate the variables
(6)
and b = 1 and thus the straight line
(7)
This equation clearly defines the Woehler curve in therange up to log N = log N2 for all minimum compressivestress levels Sc,min,i. An exponential function is chosen fornumbers of cycles to failure log N > log N2 which asymp-totically approaches the minimum compressive stress lev-el value of the respective regression line. In the non-loga-rithmic space, this function intersects the point
=−
⋅ +S (logN)
S (logN ) 1
logNlogN 1c,max
c,max 2
2
=−
−=
−m
S (logN ) 1
logN 0
S (logN ) 1
logNc,max 2
2
c,max 2
2
Pi,fat = (N2, Sc,max(log N2), Sc,min)
as the first parameter and takes the gradient at this pointas the second parameter (Fig. 6). The approach for this ex-ponential function in the logarithmic space is
where a, λ ∈ � und N > 0.The following requirements have to be met when de-
termining parameters a and λ mentioned above:
(9)
(10)
where x2 = log N2 and m is taken from Eq. (6). Divid-ing Eq. (10) by Eq. (9), parameter λ is obtained as follows:
(11)
(12)
Substituting λ in Eq. (9), the required parameter a is calculated as:
Inserting parameter λ and a into Eq. (8) then results in:
(14)
This function is a monotonic decreasing exponential func-tion. It continues the line expressed by Eq. (7) for the area0 ≤ log N ≤ log N2 at the point where log N = log N2 forlog N > log N2.
⋅λ ⋅ ⋅
⋅= λ ⋅ =
−
λ⋅
λ⋅a 10 ln(10)
a 10ln(10) m
S (logN ) S
x
xc,max 2 c,min
2
2
= = ⋅ = −λ ⋅f(x ) f(N ) a 10 S (logN ) S2 2x
c,max 2 c,min2
′ = ⋅ λ ⋅ ⋅ =λ ⋅f (x ) a 10 ln(10) m2x2
( )− = ⋅ = ⋅ = ⋅ = ⋅
= =
λ λ ⋅ λ ⋅ λ ⋅S S a N a e a 10 a 10
f log x f(x) (8)c,max c,min
ln x log(x) x
⇒ λ =⋅ −
m
ln(10) S (logN ) Sc,max 2 c,min
= −
⋅
−⋅
⋅ −
a S (logN ) S 10 (13)c,max 2 c,min
m logN
ln(10) S (logN ) S2
c,max 2 c,min
= −
⋅ +
⋅ −⋅ −
S (logN) S (logN ) S ·
10 S
c,max c,max 2 c,minm (logN logN )
ln(10) S (logN ) Sc,min
2
c,max 2 c,min
P3,fat
P2,fat
P1,fat
P4,fat
Sc,
max
[-]
Sc,min
Sc,min,i = const.
log N2= const.log N [-]
Fig. 5. Input parameters required for the material model (3D view)
Sc,max,i
Pi,fat
log N2 log N
1.0
0.0
Equation 7
Equation 15
Pi,0
Fig. 6. Woehler curve shown in the plane Sc,min,i = const.
186
L. Lohaus/N. Oneschkow/M. Wefer · Design model for the fatigue behaviour of normal-strength, high-strength and ultra-high-strength concrete
Structural Concrete 13 (2012), No. 3
Solving the equation for log N leads to:
Eq. (15) defines the Woehler curves for all maximum com-pressive stress levels 0 < Sc,max ≤ 1 and for each minimumcompressive stress level Sc,min,i (see Fig. 6).
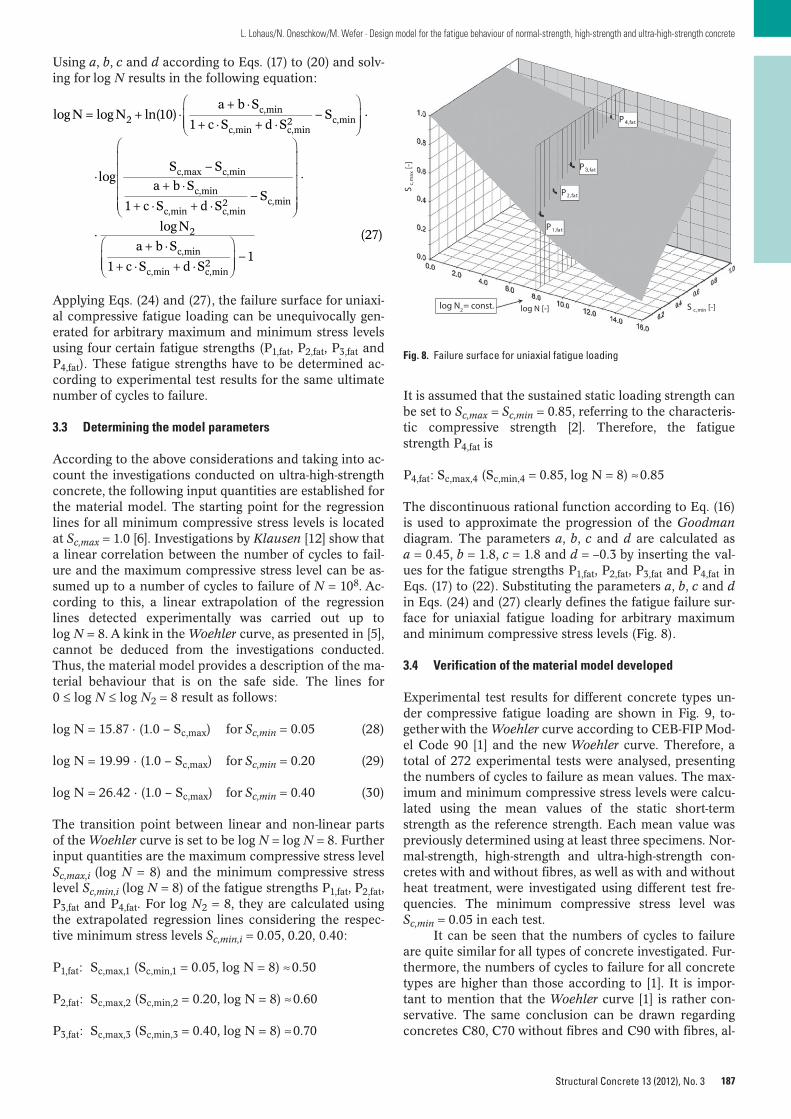
Now consider the plane log N = log N2 = const.(Fig. 7). This plane represents the modified Goodman dia-gram for the number of cycles log N = log N2, which de-notes the change from the linear to the non-linear part ofthe Woehler curve. The discontinuous rational function
(16)
was chosen to approximate the progression of the Good-man diagram. This function includes the following four fa-tigue strengths:
P1,fat = (Sc,min,1, Sc,max (Sc,min,1)) = (x1, y1),
P2,fat = (Sc,min,2, Sc,max (Sc,min,2)) = (x2, y2),
P3,fat = (Sc,min,3, Sc,max (Sc,min,3)) = (x3, y3) and
P4,fat = (Sc,min,4, Sc,max (Sc,min,4)) = (x4, y4).
It should be noticed here that 0 < x1 < x2 < x3 < x4. Thefour parameters a, b, c and d required are determined depending on the points P1,fat, P2,fat, P3,fat, and P4,fat [2]:
=+ ⋅
+ ⋅ + ⋅S
a b S
1 c S d Sc,maxc,min
c,min c,min2
= +
⋅ −
⋅
−−
−
logN logN
ln(10) S (logN ) S logS S
S (logN ) S
S (logN ) 1
logN(15)
2
c,max 2 c,minc,max c,min
c,max 2 c,min
c,max 2
2
= ⋅
+ + −
a 1det
·y x x x x y y x x x x y y x x x x y y
x x x x y y y
(17)
1 2 31 41 43 3 4 3 41 21 24 4 2 4 21 31 32 2 3
1 23 34 42 2 3 4
where
where xij = xi – xj, Yij = yi – yj and c(i1)(j1) = xi1yj1 – xj1yi1.(22)
Based on these considerations and the combination of theapproximations described, two partial planes that dependon log N, Sc,max and Sc,min are generated in the three-di-mensional system of coordinates (Fig. 5).
The partial plane in the subspace log N ≤ log N2 is:
Solving for log N:
(24)
In the subspace log N > log N2, the partial area is ex-pressed by:
where
(26)
=−
⋅ +
=
+ ⋅+ ⋅ + ⋅
−
⋅ +
S (logN)S (logN ) 1
logNlogN 1
a b S
1 c S d S1
logNlogN 1 (23)
c,maxc,max 2
2
c,min
c,min c,min2
2
( )=
− ⋅+ ⋅
+ ⋅ + ⋅−
logNS 1 logN
a b S
1 c S d S1
c,max 2
c,min
c,min c,min2
= + ++ + +
det x x x x y y x x x x y y x x x x y yx x x x y y x x x x y y x x x x y y
(21)
2 3 32 41 2 3 3 4 43 21 3 4 4 2 24 31 4 2
1 2 21 43 1 2 1 3 31 24 1 3 1 4 41 32 1 4
= ⋅
+ + +
b 1det
·x x x y y y
y x x x y y x x x y y x x x y y
(18)
23 34 42 2 3 4
1 21 31 23 2 3 31 41 34 3 4 41 21 42 4 2
( )( ) ( ) ( )= ⋅
− + − + −
c 1det
· x x y c x x y c x x y c
(19)32
12
3 (21)(41) 42
12
4 (31)(21) 22
12
2 (41)(31)
( )=− ⋅ + +d 1det
x y c x y c x y c (20)21 2 (41)(31) 31 3 (21)(41) 41 4 (31)(21)
= + −
⋅
= ++ ⋅
+ ⋅ + ⋅−
⋅
⋅ −⋅ −
⋅ −
⋅+ ⋅
+ ⋅ + ⋅−
S (logN) S S (logN ) S ·
10
Sa b S
1 c S d SS ·
10 (25)
c,max c,min c,max 2 c,minm (logN logN )
ln(10) S (logN ) S
c,minc,min
c,min c,min2 c,min
m (logN logN )
ln(10)a b S
1 c S d SS
2
c,max 2 c,min
2
c,min
c,min c,min2 c,min
=−
=
+ ⋅+ ⋅ + ⋅
−
mS (logN ) 1
logN
a b S
1 c S d S1
logNc,max 2
2
c,min
c,min c,min2
2
S c,max,i
P 3,fat
P 2,fat
P 1,fat
P 4,fat
S c,min,i
1.0
0.8
0.6
0.4
0.2
0.0 0.2 0.4 0.6 0.8 1.0
Fig. 7. Fatigue strengths Pi,fat shown in the plane log N = log N2 = const.
187
L. Lohaus/N. Oneschkow/M. Wefer · Design model for the fatigue behaviour of normal-strength, high-strength and ultra-high-strength concrete
Structural Concrete 13 (2012), No. 3
Using a, b, c and d according to Eqs. (17) to (20) and solv-ing for log N results in the following equation:
Applying Eqs. (24) and (27), the failure surface for uniaxi-al compressive fatigue loading can be unequivocally gen-erated for arbitrary maximum and minimum stress levelsusing four certain fatigue strengths (P1,fat, P2,fat, P3,fat andP4,fat). These fatigue strengths have to be determined ac-cording to experimental test results for the same ultimatenumber of cycles to failure.
3.3 Determining the model parameters
According to the above considerations and taking into ac-count the investigations conducted on ultra-high-strengthconcrete, the following input quantities are established forthe material model. The starting point for the regressionlines for all minimum compressive stress levels is locatedat Sc,max = 1.0 [6]. Investigations by Klausen [12] show thata linear correlation between the number of cycles to fail-ure and the maximum compressive stress level can be as-sumed up to a number of cycles to failure of N = 108. Ac-cording to this, a linear extrapolation of the regressionlines detected experimentally was carried out up tolog N = 8. A kink in the Woehler curve, as presented in [5],cannot be deduced from the investigations conducted.Thus, the material model provides a description of the ma-terial behaviour that is on the safe side. The lines for0 ≤ log N ≤ log N2 = 8 result as follows:
log N = 15.87 · (1.0 – Sc,max) for Sc,min = 0.05 (28)
log N = 19.99 · (1.0 – Sc,max) for Sc,min = 0.20 (29)
log N = 26.42 · (1.0 – Sc,max) for Sc,min = 0.40 (30)
The transition point between linear and non-linear partsof the Woehler curve is set to be log N = log N = 8. Furtherinput quantities are the maximum compressive stress levelSc,max,i (log N = 8) and the minimum compressive stresslevel Sc,min,i (log N = 8) of the fatigue strengths P1,fat, P2,fat,P3,fat and P4,fat. For log N2 = 8, they are calculated usingthe extrapolated regression lines considering the respec-tive minimum stress levels Sc,min,i = 0.05, 0.20, 0.40:
P1,fat: Sc,max,1 (Sc,min,1 = 0.05, log N = 8) ≈ 0.50
P2,fat: Sc,max,2 (Sc,min,2 = 0.20, log N = 8) ≈ 0.60
P3,fat: Sc,max,3 (Sc,min,3 = 0.40, log N = 8) ≈ 0.70
= + ⋅+ ⋅
+ ⋅ + ⋅−
⋅−
+ ⋅+ ⋅ + ⋅
−
⋅
+ ⋅+ ⋅ + ⋅
−
logN logN ln(10)a b S
1 c S d SS ·
logS S
a b S
1 c S d SS
·logN
a b S
1 c S d S1
(27)
2c,min
c,min c,min2 c,min
c,max c,min
c,min
c,min c,min2 c,min
2
c,min
c,min c,min2
It is assumed that the sustained static loading strength canbe set to Sc,max = Sc,min = 0.85, referring to the characteris-tic compressive strength [2]. Therefore, the fatiguestrength P4,fat is
P4,fat: Sc,max,4 (Sc,min,4 = 0.85, log N = 8) ≈ 0.85
The discontinuous rational function according to Eq. (16)is used to approximate the progression of the Goodmandiagram. The parameters a, b, c and d are calculated asa = 0.45, b = 1.8, c = 1.8 and d = –0.3 by inserting the val-ues for the fatigue strengths P1,fat, P2,fat, P3,fat and P4,fat inEqs. (17) to (22). Substituting the parameters a, b, c and din Eqs. (24) and (27) clearly defines the fatigue failure sur-face for uniaxial fatigue loading for arbitrary maximumand minimum compressive stress levels (Fig. 8).
3.4 Verification of the material model developed
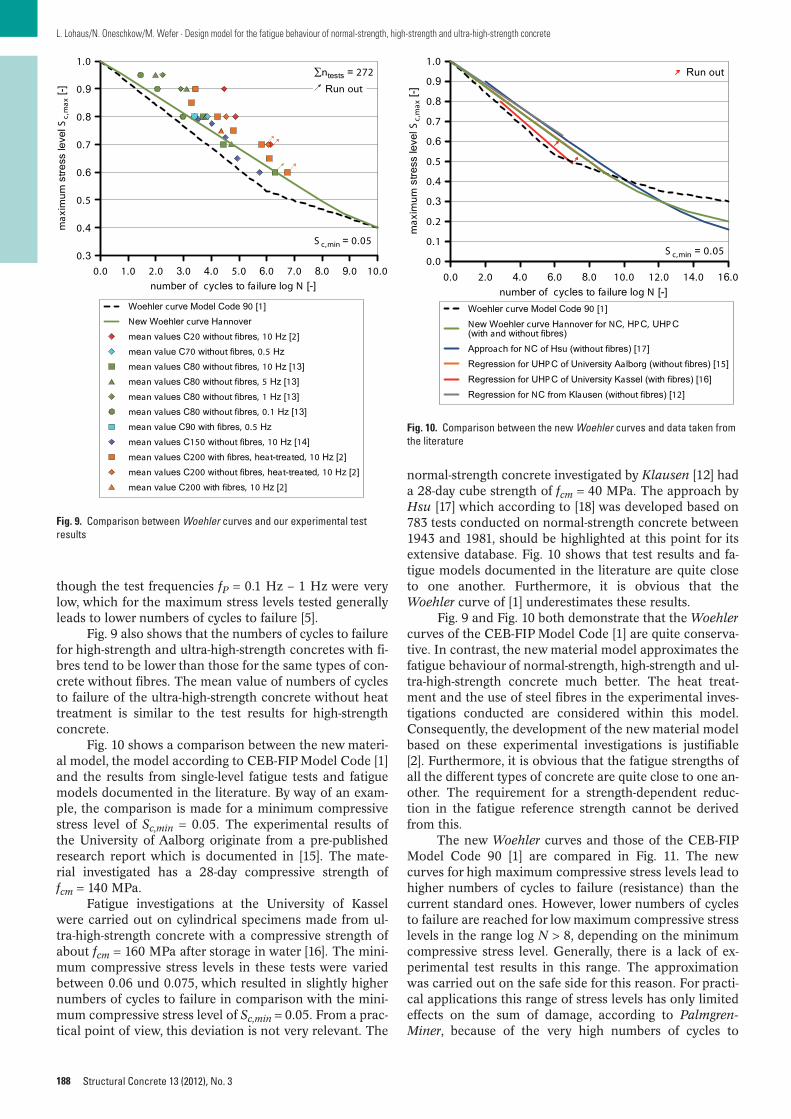
Experimental test results for different concrete types un-der compressive fatigue loading are shown in Fig. 9, to-gether with the Woehler curve according to CEB-FIP Mod-el Code 90 [1] and the new Woehler curve. Therefore, atotal of 272 experimental tests were analysed, presentingthe numbers of cycles to failure as mean values. The max-imum and minimum compressive stress levels were calcu-lated using the mean values of the static short-termstrength as the reference strength. Each mean value waspreviously determined using at least three specimens. Nor-mal-strength, high-strength and ultra-high-strength con-cretes with and without fibres, as well as with and withoutheat treatment, were investigated using different test fre-quencies. The minimum compressive stress level wasSc,min = 0.05 in each test.
It can be seen that the numbers of cycles to failureare quite similar for all types of concrete investigated. Fur-thermore, the numbers of cycles to failure for all concretetypes are higher than those according to [1]. It is impor-tant to mention that the Woehler curve [1] is rather con-servative. The same conclusion can be drawn regardingconcretes C80, C70 without fibres and C90 with fibres, al-
P 4,fat
P3,fat
P2,fat
P1,fat
log N2= const. log N [-]
Sc,
max
[-]
S c,min [-]
Fig. 8. Failure surface for uniaxial fatigue loading
188
L. Lohaus/N. Oneschkow/M. Wefer · Design model for the fatigue behaviour of normal-strength, high-strength and ultra-high-strength concrete
Structural Concrete 13 (2012), No. 3
though the test frequencies fP = 0.1 Hz – 1 Hz were verylow, which for the maximum stress levels tested generallyleads to lower numbers of cycles to failure [5].
Fig. 9 also shows that the numbers of cycles to failurefor high-strength and ultra-high-strength concretes with fi-bres tend to be lower than those for the same types of con-crete without fibres. The mean value of numbers of cyclesto failure of the ultra-high-strength concrete without heattreatment is similar to the test results for high-strengthconcrete.
Fig. 10 shows a comparison between the new materi-al model, the model according to CEB-FIP Model Code [1]and the results from single-level fatigue tests and fatiguemodels documented in the literature. By way of an exam-ple, the comparison is made for a minimum compressivestress level of Sc,min = 0.05. The experimental results of the University of Aalborg originate from a pre-publishedresearch report which is documented in [15]. The mate-rial investigated has a 28-day compressive strength offcm = 140 MPa.
Fatigue investigations at the University of Kasselwere carried out on cylindrical specimens made from ul-tra-high-strength concrete with a compressive strength ofabout fcm = 160 MPa after storage in water [16]. The mini-mum compressive stress levels in these tests were variedbetween 0.06 und 0.075, which resulted in slightly highernumbers of cycles to failure in comparison with the mini-mum compressive stress level of Sc,min = 0.05. From a prac-tical point of view, this deviation is not very relevant. The
normal-strength concrete investigated by Klausen [12] hada 28-day cube strength of fcm = 40 MPa. The approach byHsu [17] which according to [18] was developed based on783 tests conducted on normal-strength concrete between1943 and 1981, should be highlighted at this point for itsextensive database. Fig. 10 shows that test results and fa-tigue models documented in the literature are quite closeto one another. Furthermore, it is obvious that theWoehler curve of [1] underestimates these results.
Fig. 9 and Fig. 10 both demonstrate that the Woehlercurves of the CEB-FIP Model Code [1] are quite conserva-tive. In contrast, the new material model approximates thefatigue behaviour of normal-strength, high-strength and ul-tra-high-strength concrete much better. The heat treat-ment and the use of steel fibres in the experimental inves-tigations conducted are considered within this model.Consequently, the development of the new material modelbased on these experimental investigations is justifiable[2]. Furthermore, it is obvious that the fatigue strengths ofall the different types of concrete are quite close to one an-other. The requirement for a strength-dependent reduc-tion in the fatigue reference strength cannot be derivedfrom this.
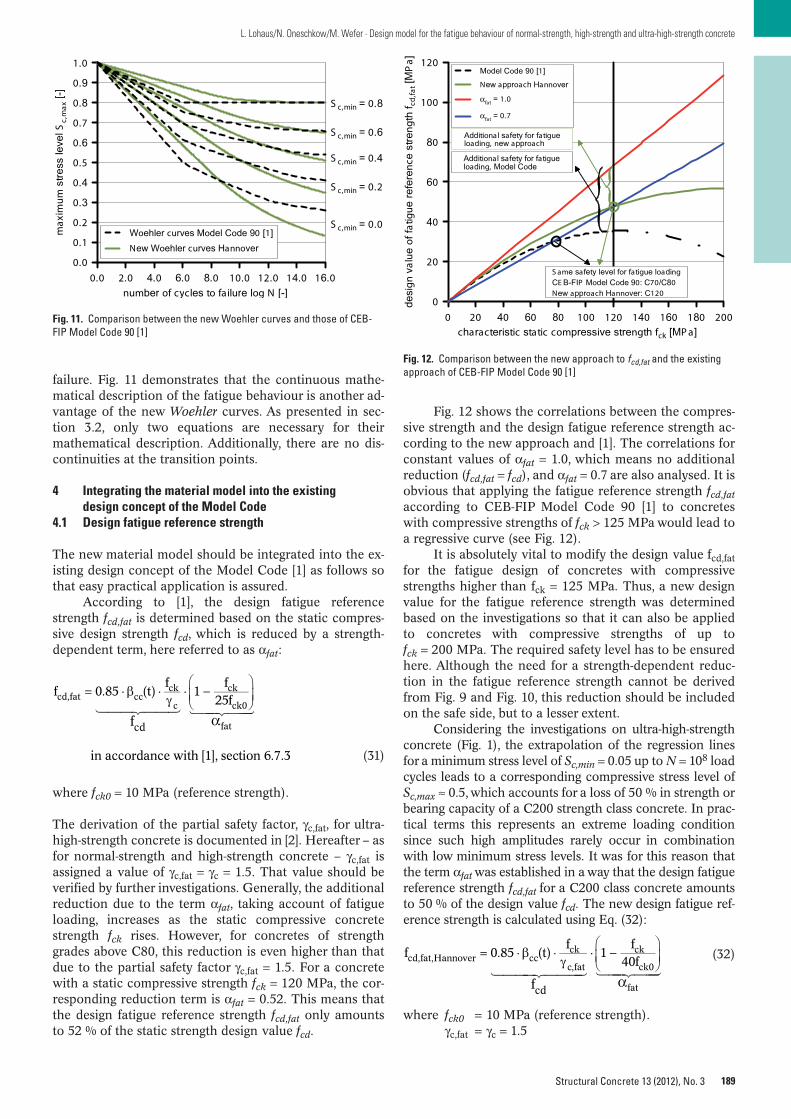
The new Woehler curves and those of the CEB-FIPModel Code 90 [1] are compared in Fig. 11. The newcurves for high maximum compressive stress levels lead tohigher numbers of cycles to failure (resistance) than thecurrent standard ones. However, lower numbers of cyclesto failure are reached for low maximum compressive stresslevels in the range log N > 8, depending on the minimumcompressive stress level. Generally, there is a lack of ex-perimental test results in this range. The approximationwas carried out on the safe side for this reason. For practi-cal applications this range of stress levels has only limitedeffects on the sum of damage, according to Palmgren-Miner, because of the very high numbers of cycles to
0.0 1.0 2.0 3.0 4.0 5.0 6.0 7.0 8.0 9.0 10.0number of cycles to failure log N [-]
0.3
0.4
0.5
0.6
0.7
0.8
0.9
1.0m
axim
um s
tres
s le
vel S
c,m
ax [-
]
Woehler curve Model Code 90 [1]
New Woehler curve Hannover
mean values C20 without fibres, 10 Hz [2]
mean value C70 without fibres, 0.5 Hz
mean values C80 without fibres, 10 Hz [13]
mean values C80 without fibres, 5 Hz [13]
mean values C80 without fibres, 1 Hz [13]
mean values C80 without fibres, 0.1 Hz [13]
mean value C90 with fibres, 0.5 Hz
mean values C150 without fibres, 10 Hz [14]
mean values C200 with fibres, heat-treated, 10 Hz [2]
mean values C200 without fibres, heat-treated, 10 Hz [2]
mean value C200 with fibres, 10 Hz [2]
∑ntests = 272
S c,min = 0.05
Run out
Fig. 9. Comparison between Woehler curves and our experimental test results
0.0 2.0 4.0 6.0 8.0 10.0 12.0 14.0 16.0number of cycles to failure log N [-]
0.0
0.1
0.2
0.3
0.4
0.5
0.6
0.7
0.8
0.9
1.0
max
imum
str
ess
leve
l Sc,
max
[-]
Woehler curve Model Code 90 [1]
New Woehler curve Hannover for NC, HP C, UHP C (with and without fibres)
Approach for NC of Hsu (without fibres) [17]
Regression for UHP C of University Aalborg (without fibres) [15]
Regression for UHP C of University Kassel (with fibres) [16]
Regression for NC from Klausen (without fibres) [12]
Run out
S c,min = 0.05
Fig. 10. Comparison between the new Woehler curves and data taken fromthe literature
189
L. Lohaus/N. Oneschkow/M. Wefer · Design model for the fatigue behaviour of normal-strength, high-strength and ultra-high-strength concrete
Structural Concrete 13 (2012), No. 3
failure. Fig. 11 demonstrates that the continuous mathe-matical description of the fatigue behaviour is another ad-vantage of the new Woehler curves. As presented in sec-tion 3.2, only two equations are necessary for theirmathematical description. Additionally, there are no dis-continuities at the transition points.
4 Integrating the material model into the existing design concept of the Model Code
4.1 Design fatigue reference strength
The new material model should be integrated into the ex-isting design concept of the Model Code [1] as follows sothat easy practical application is assured.
According to [1], the design fatigue referencestrength fcd,fat is determined based on the static compres-sive design strength fcd, which is reduced by a strength-dependent term, here referred to as αfat:
(31)
where fck0 = 10 MPa (reference strength).
The derivation of the partial safety factor, γc,fat, for ultra-high-strength concrete is documented in [2]. Hereafter – asfor normal-strength and high-strength concrete – γc,fat isassigned a value of γc,fat = γc = 1.5. That value should beverified by further investigations. Generally, the additionalreduction due to the term αfat, taking account of fatigueloading, increases as the static compressive concretestrength fck rises. However, for concretes of strengthgrades above C80, this reduction is even higher than thatdue to the partial safety factor γc,fat = 1.5. For a concretewith a static compressive strength fck = 120 MPa, the cor-responding reduction term is αfat = 0.52. This means thatthe design fatigue reference strength fcd,fat only amountsto 52 % of the static strength design value fcd.
α
= ⋅ β ⋅γ
⋅ −
f
f 0.85 (t)f
1f
25f
in accordance with [1], section 6.7.3
cd
cd,fat ccck
c
ck
ck0
fat
Fig. 12 shows the correlations between the compres-sive strength and the design fatigue reference strength ac-cording to the new approach and [1]. The correlations forconstant values of αfat = 1.0, which means no additionalreduction (fcd,fat = fcd), and αfat = 0.7 are also analysed. It isobvious that applying the fatigue reference strength fcd,fataccording to CEB-FIP Model Code 90 [1] to concreteswith compressive strengths of fck > 125 MPa would lead toa regressive curve (see Fig. 12).
It is absolutely vital to modify the design value fcd,fatfor the fatigue design of concretes with compressivestrengths higher than fck = 125 MPa. Thus, a new designvalue for the fatigue reference strength was determinedbased on the investigations so that it can also be appliedto concretes with compressive strengths of up tofck = 200 MPa. The required safety level has to be ensuredhere. Although the need for a strength-dependent reduc-tion in the fatigue reference strength cannot be derivedfrom Fig. 9 and Fig. 10, this reduction should be includedon the safe side, but to a lesser extent.
Considering the investigations on ultra-high-strengthconcrete (Fig. 1), the extrapolation of the regression linesfor a minimum stress level of Sc,min = 0.05 up to N = 108 loadcycles leads to a corresponding compressive stress level ofSc,max ≈ 0.5, which accounts for a loss of 50 % in strength orbearing capacity of a C200 strength class concrete. In prac-tical terms this represents an extreme loading conditionsince such high amplitudes rarely occur in combinationwith low minimum stress levels. It was for this reason thatthe term αfat was established in a way that the design fatiguereference strength fcd,fat for a C200 class concrete amountsto 50 % of the design value fcd. The new design fatigue ref-erence strength is calculated using Eq. (32):
(32)
where fck0 = 10 MPa (reference strength).γc,fat = γc = 1.5
α
= ⋅ β ⋅γ
⋅ −
f
f 0.85 (t)f
1f
40f
cd
cd,fat,Hannover ccck
c,fat
ck
ck0
fat
0.0 2.0 4.0 6.0 8.0 10.0 12.0 14.0 16.0number of cycles to failure log N [-]
0.0
0.1
0.2
0.3
0.4
0.5
0.6
0.7
0.8
0.9
1.0m
axim
um s
tres
s le
vel S
c,m
ax [-
]
Woehler curves Model Code 90 [1]
New Woehler curves Hannover
S c,min = 0.0
S c,min = 0.2
S c,min = 0.4
S c,min = 0.6
S c,min = 0.8
Fig. 11. Comparison between the new Woehler curves and those of CEB-FIP Model Code 90 [1]
0 20 40 60 80 100 120 140 160 180 200characteristic static compressive strength fck [MP a]
0
20
40
60
80
100
120
desi
gn v
alue
of f
atig
ue r
efer
ence
str
engt
h f c
d,fa
t [M
Pa]
Model Code 90 [1]
New approach Hannover
αfat = 1.0
αfat = 0.7
S ame safety level for fatigue loadingCE B-FIP Model Code 90: C70/C80New approach Hannover: C120
Additional safety for fatigue loading, new approach
Additional safety for fatigue loading, Model Code
Fig. 12. Comparison between the new approach to fcd,fat and the existingapproach of CEB-FIP Model Code 90 [1]
190
L. Lohaus/N. Oneschkow/M. Wefer · Design model for the fatigue behaviour of normal-strength, high-strength and ultra-high-strength concrete
Structural Concrete 13 (2012), No. 3
The curve of the modified design value is also shown inFig. 12. It is obvious that the function applies up to a com-pressive strength of fck = 200 MPa. Furthermore, fatiguereference strength values higher than those according to[1] are permitted. Applying the modified fatigue referencestrength leads to αfat = 0.70 for a C120 concrete. The samesafety level is thus assured for a C120 concrete as wasspecified for a concrete in the range between C70 and C80according to the CEB-FIP Model Code 90 [1] in the early1990s. Meanwhile, the extensive scientific research avail-able regarding high-strength concrete (see section 3.4) jus-tifies this adjustment to the safety level. Thus, the requiredsafety level is ensured for all concrete grades up tofck = 200 MPa. At the same time, economical fatigue design of concrete with characteristic static strengths upto fck = 200 MPa is possible.
4.2 Design concept
The material model and the proposed design value for the fatigue reference strength will now be integrated into the design concept of CEB-FIP Model Code 90 [1].
Level 1:Detailed fatigue design is not necessary provided the fol-lowing requirement for concrete under compressive fa-tigue loading is met:
γSd · σc,max · ηc ≤ 0.45 · fcd,fat, Hannover (33)
fck0 = 10 MPa (reference strength)
In such cases, a number of cycles to failure of N ≈ 108 isreached for a minimum stress level of Scd,min = 0.
Level 2:If the level 1 requirement is not met, the verification refersto a single load level including the dominant fatigue load-ing. The requirements are fulfilled if the number of loadcycles occurring n is equal to or less than the number ofresisting cycles N:
n ≤ N (34)
The number of resisting cycles N is calculated for0 ≤ Scd,min ≤ 0.80 using the following equations. In thecase of Scd,min > 0.80, the minimum stress level design val-ue is taken as Scd,min = 0.80.
For log N ≤ 8:
(35)
For log N > 8:
= ⋅ β ⋅γ
⋅ −
where f 0.85 (t )
f1
f40fcd,fat,Hannover cc 0
ck
c,fat
ck
ck0
( )=−
⋅ −logN 8Y 1
(S 1)cd,max
( )= + ⋅−
⋅ − ⋅−
−
logN 8 8 ln(10)
Y 1(Y S ) log
S S
Y S
(36)
cd,mincd,max cd,min
cd,min
whereScd,min = γSd · σc,min · ηc/fcd,fat,HannoverScd,max = γSd · σc,max · ηc/fcd,fat,HannoverγSd = 1.1 or 1.0 in accordance with [1], section 1.6.4.4ηc in accordance with [1], Eq. (6.7-2)
Level 3:If the level 2 requirement is not met, the whole spectrumof load levels has to be known. As explained in CEB-FIPModel Code 90 [1], verifying the fatigue requirements inaccordance with the Palmgren–Miner summation [19, 20]is recommended. The limiting fatigue damage has to bemet.
The numbers of resisting cycles to failure NRi are calculat-ed using Eqs. (35) and (36).
The new design model comprising the new Woehlercurves and the modified value for fatigue is included inthe new fib Model Code 2010 [4].
4.3 Verification of the design model developed with respect to safety requirements
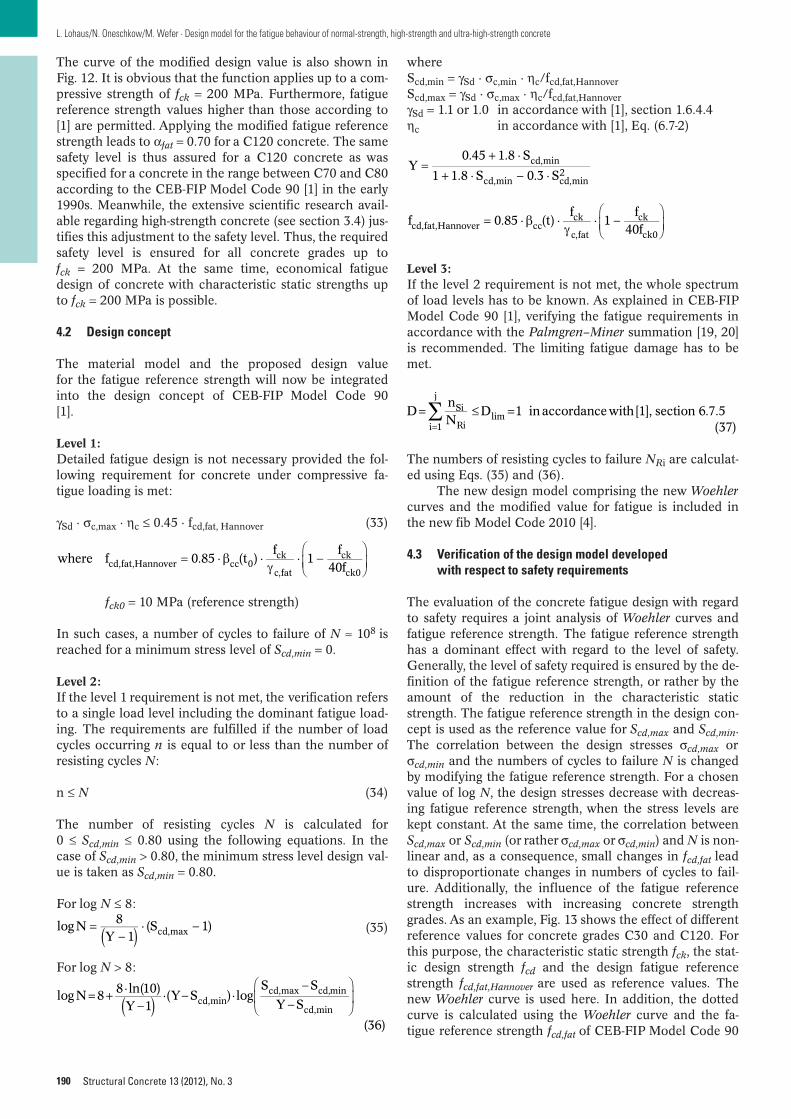
The evaluation of the concrete fatigue design with regardto safety requires a joint analysis of Woehler curves and fatigue reference strength. The fatigue reference strengthhas a dominant effect with regard to the level of safety.Generally, the level of safety required is ensured by the de-finition of the fatigue reference strength, or rather by theamount of the reduction in the characteristic staticstrength. The fatigue reference strength in the design con-cept is used as the reference value for Scd,max and Scd,min.The correlation between the design stresses σcd,max orσcd,min and the numbers of cycles to failure N is changedby modifying the fatigue reference strength. For a chosenvalue of log N, the design stresses decrease with decreas-ing fatigue reference strength, when the stress levels arekept constant. At the same time, the correlation betweenScd,max or Scd,min (or rather σcd,max or σcd,min) and N is non-linear and, as a consequence, small changes in fcd,fat leadto disproportionate changes in numbers of cycles to fail-ure. Additionally, the influence of the fatigue referencestrength increases with increasing concrete strengthgrades. As an example, Fig. 13 shows the effect of differentreference values for concrete grades C30 and C120. Forthis purpose, the characteristic static strength fck, the stat-ic design strength fcd and the design fatigue referencestrength fcd,fat,Hannover are used as reference values. Thenew Woehler curve is used here. In addition, the dottedcurve is calculated using the Woehler curve and the fa-tigue reference strength fcd,fat of CEB-FIP Model Code 90
∑= ≤ ==
DnN
D 1 inaccordance with[1], section 6.7.5(37)
Si
Rii 1
j
lim
=+ ⋅
+ ⋅ − ⋅
= ⋅ β ⋅γ
⋅ −
Y0.45 1.8 S
1 1.8 S 0.3 S
f 0.85 (t)f
1f
40f
cd,min
cd,min cd,min2
cd,fat,Hannover ccck
c,fat
ck
ck0
191
L. Lohaus/N. Oneschkow/M. Wefer · Design model for the fatigue behaviour of normal-strength, high-strength and ultra-high-strength concrete
Structural Concrete 13 (2012), No. 3
[1]. For simplicity, the minimum stress level Sc,min = 0.05 iskept constant.
It is obvious in Fig. 13 that the effect of the new de-sign model is greater for high-strength concrete than forlower concrete grades because of the modified fatigue ref-erence strength (see also Fig. 12). For a normal-strengthconcrete C30, both approaches lead to quite similar maxi-mum compressive stresses σcd,max (fcd,fat or fcd,fat,Hannover asreference strength). Additionally, it can be seen that thenew approach permits higher numbers of cycles to failurethan [1] for the same maximum compressive stress, espe-cially for C120. At the same time, the differences in loadcycles between the new and the current standard curvesare significantly smaller than the total difference when fckis used as the reference strength. Comparing the curvesfor reference values fcd,fat,Hannover and fck, it is obvious thata huge reduction in numbers of cycles to failure still exists.This reduction represents the degree of safety ensured.The effect of the fatigue reference strength decreases forhigher numbers of cycles to failure.
Further aspects have to be considered when evaluat-ing concrete fatigue design with regard to safety. General-ly, and differently from both design approaches, the deter-mination of the stress levels in experimental tests refers tomean values of the static strength. This means that – evenwithout any safety factors and additional reduction termstaking account of fatigue loading – additional safety isgenerally included in the design concept since fck refers tothe 5 % quantile and not to the mean value of staticstrength. This additional reduction in number of cycles tofailure is not included in Fig. 13. Another aspect is that thefatigue reference strength refers to 28-day strengths. How-
ever, subsequent concrete hardening, which is not consid-ered in the design concept, leads to decreasing stress lev-els during the concrete’s lifetime and thus to a better fa-tigue capacity. That means additional safety. Two furtherpositive influences regarding fatigue strength are the redis-tribution of stresses in damaged zones and the combinedbearing capacity of reinforced concrete. On the contrary,there are influences – such as preliminary damage, over-loads and the combination of different load levels – thatmight reduce the calculated fatigue strength of structures.As yet, the effect of redistribution, preliminary damageand overloads can hardly be quantified in a way that isgenerally valid for all concrete structures.
Altogether, the new approach does not lead to signif-icant changes in the fatigue design results for normal-strength concrete. For higher-strength concrete, there isstill a huge reduction in numbers of cycles to failure. Tak-ing this into account, and considering the “hidden” safetyfactors described previously, it is ensured that the new de-sign approach complies with the level of safety required.
5 Conclusions
The design concept according to CEB-FIP Model-Code 90[1] is limited to types of concrete with compressivestrengths up to fck = 80 MPa. Furthermore, the fatigue de-sign concept includes a reduction in the fatigue referencestrength, which for high-strength concrete leads to uneco-nomical design at the ultimate fatigue limit state. This pa-per presents the results of experimental and theoretical in-vestigations of the compressive fatigue behaviour ofhigh-performance concrete with concrete strengths up tofck = 200 MPa. A material model for concrete under uniax-ial compressive fatigue loading was developed based onthese extensive experimental investigations. The new ma-terial model approximates the fatigue behaviour of nor-mal-strength, high-strength and ultra-high-strength con-crete. Another advantage is the continuous mathematicaldescription of the Woehler curves, which ensures easierpractical application. The new design model was devel-oped considering the design concept according to CEB-FIP Model Code 90 [1]. The required partial safety factor, γc,fat = 1.5, was confirmed to be applicable for ultra-high-strength concrete, too. The characteristic compressive ref-erence strength fck,fat and the design value of the fatiguereference strength fcd,fat were modified. The modified fa-tigue reference strength ensures the same level of safetyfor a C120 as for a concrete in the range of C70/C80 ac-cording to [1]. The analysis of the assured safety showsthat the new design model leads to higher numbers of re-sisting cycles to failure, especially for high-strength con-crete. These improvements are absolutely crucial for prac-tical applications taking into consideration the increase infatigue-relevant loads. This modification is justified ac-cording to the experimental test results currently availablefor high-strength concrete. At the same time, and most im-portantly, it was demonstrated that the level of safety re-quired is still assured. Altogether, the new design modelleads to safe and economical design. Furthermore, it en-ables the prospect of extending the application to ultra-high-strength concrete with compressive strengths up tofck = 200 MPa. The design model presented is included in
number of cycles to failure log N [-]
max
imum
com
pres
sive
str
ess
σ cd,
max
[MP
a]
C120: fcd,fat,Hannover and Woehler curve Hannover
C120: fcd,fat and Woehler curve Model Code 90
C120: fcd, Woehler curve Hannover
C120: fck, Woehler curve Hannover
C30: fcd,fat,Hannover and Woehler curve Hannover
C30: fcd,fat and Woehler curve Model Code 90
C30: fcd, Woehler curve Hannover
C30: fck, Woehler curve Hannover
S c,min = 0.05
Fig. 13. Analysis of the effect of reference values fck, fcd, fcd,fat andfcd,fat,Hannover (C30 and C120)
192
L. Lohaus/N. Oneschkow/M. Wefer · Design model for the fatigue behaviour of normal-strength, high-strength and ultra-high-strength concrete
Structural Concrete 13 (2012), No. 3
the new fib Model Code 2010 [4], although the concretegrades are limited to C120.
Acknowledgements
This research project was supported by the German Re-search Foundation (DFG) within the scope of priority pro-gramme 1182 “Sustainable Building with Ultra-High-Per-formance Concrete (UHPC)”. The authors would like toexpress their gratitude for the financial support.
References
1. CEB – Comité Euro-international du Béton: “CEB-FIP Mod-el Code 90”. Bulletin d’Information, No. 213/214, ThomasTelford Ltd., London, 1993.
2. Wefer, M.: Materialverhalten und Bemessungswerte von ultrahochfestem Beton unter einaxialer Ermüdungsbean-spruchung. Dissertation, Leibniz University of Hannover, In-stitute of Building Materials Science, 2010.
3. Lohaus, L., Wefer, M., Oneschkow, N.: Ermüdungsbemes-sungsmodell für normal-, hoch- und ultra-hochfeste Betone.In: Beton- und Stahlbetonbau, vol. 106, No. 12, 2011, pp.836–846.
4. fib – International Federation for Structural Concrete: Mod-el Code 2010, final draft, Volume 1 and 2, March 2012.
5. Petkovic, G., Stemland, H., Rosseland, S.: High StrengthConcrete SP 3 – Fatigue, Report 3.2 Fatigue of High StrengthConcrete. SINTEF Structures and Concrete, Trondheim,Aug 1992.
6. Petkovic, G., Lenschow, R., Stemland, H., Rosseland, S.: Fa-tigue of High-Strength Concrete. In: High-strength concrete:Second International Symposium, American Concrete Insti-tute (ACI Special Publication 121), Detroit, 1990, pp.505–525.
7. Grünberg, J., Lohaus, L., Ertel, C., Wefer, M.: Mehraxialesmechanisches Ermüdungsmodell von Ultra-Hochfestem Be-ton (Experimentelle und analytische Untersuchungen). In:Beton- und Stahlbetonbau, vol. 102, No. 6, 2007, pp. 388–398.
8. Bennett, E., Muir, S.: Some Fatigue tests of high-strengthconcrete in axial compression. In: Magazine of Concrete Re-search, vol. 19, No. 59, June 1967.
9. Hohberg, R.: Zum Ermüdungsverhalten von Beton. Disserta-tion, TU Berlin, 2004.
10. Weigler, H., Freitag, W.: Dauerschwell- und Betriebsfestigkeitvon Konstruktionsleichtbeton. Deutscher Ausschuss fürStahlbeton, No. 247, 1975.
11. Wilrich, P.-T., Henning, H.-J.: Formeln und Tabellen der an-gewandten mathematischen Statistik. Springer Verlag, Ber-lin, 2003.
12. Klausen, D.: Festigkeit und Schädigung von Beton bei häu-fig wiederholter Beanspruchung. Dissertation, TU Darm-stadt, 1978.
13. Grünberg, J., Oneschkow, N.: Gründung von Offshore-Windenergieanlagen aus filigranen Betonkonstruktionenunter besonderer Beachtung des Ermüdungsverhaltens vonhochfestem Beton. Final report for BMU joint research pro-ject, Leibniz University of Hannover, 2011.
14. Anders, S., Lohaus, L.: Polymer- und fasermodifizierteHochleistungsbetone für hochdynamisch beanspruchte Ver-bindungen wie “Grouted Joints” bei Windenergieanlagen. Final report for research scholarship T 4/2002, Stiftung In-dustrieforschung, Hannover, 2007.
15. Lohaus, L., Anders, S.: High-cycle Fatigue of Ultra-high Per-formance Concrete – Fatigue Strength and Damage Devel-opment. Fédération Internationale du Béton, Proceedings of2nd International Congress, Naples, 2006.
16. Fehling, E., Schmidt, M., Teichmann, T., Bunje, K., Borne-mann, R., Middendorf, M.: Entwicklung, Dauerhaftigkeitund Berechnung Ultra-Hochfester Betone (UHPC). Schrif-tenreihe Baustoffe und Massivbau, University of Kassel, No.1, 2004.
17. Hsu, T.: Fatigue of Plain Concrete. In: ACI Journal, Jul–Aug1981, pp. 292–305.
18. Pfanner, D.: Zur Degradation von Stahlbetonbauteilen unterErmüdungsbeanspruchung. Research reports, VDI Reihe 4,No. 189. VDI Verlag, Düsseldorf, 2003.
19. Palmgren, A.: Die Lebensdauer von Kugellagern. ZeitschriftVDI, 68, 1924, pp. 339–341.
20. Miner, A. M.: Cumulative Damage in Fatigue. Journal of Applied Mechanics, No. 12, 1945.
Leibniz Universität HannoverInstitute of Building Materials ScienceAppelstraße 9A30167 Hannover
Dipl.-Ing. Nadja [email protected]
Prof. Dr.-Ing. Ludger [email protected]
Dr.-Ing. Maik WeferLeibniz Universität HannoverForWind – Center for Wind Energy ResearchAppelstraße 9A30167 [email protected]