Embed Size (px)
Citation preview
Design of Vineyard Irrigation System and Reservoir Enlargement
By
Matthew M. Moore
BioResource and Agricultural Engineering
BioResource and Agricultural Engineering Department
California Polytechnic State University
San Luis Obispo
2013
ii
TITLE : Design of Vineyard Irrigation System and Reservoir
Enlargement
AUTHOR : Matthew M. Moore
DATE SUBMITTED : June 7, 2013
Dr. Daniel Howes _____________________________
Senior Project Advisor Signature
_____________________________
Date
Dr. Ken Solomon ______________________________
Department Head Signature
_____________________________
Date

iii
ACKNOWLEDGEMENTS
First, I would like to thank my family and friends. They never let me stray from my goal
of a higher education and because of them, I’m finishing up this December. Second, I
would like to thank every BioResource and Agricultural Engineering professor in the
department. They made me feel right at home from the minute I arrived and continuously
confirmed that this major was the right place for me. Third, I would like to thank Dr.
Howes, my advisor, for helping me along the way with this project.

iv
ABSTRACT
The goal of this project is to design a drip irrigation system for a 25 acre vineyard in
Potter Valley, Ca. This allows water to be efficiently delivered to the plants in a timely
manner in order to maximize yield or fruit quality. This design will also include the
resizing of the current reservoir in order to accommodate for the new water requirements;
however this design will not include the overhead sprinkler system needed for frost
protection.
v
DISCLAIMER STATEMENT
The university makes it clear that the information forwarded herewith is a project
resulting from a class assignment and has been graded and accepted only as a fulfillment
of a course requirement. Acceptance by the university does not imply technical accuracy
or reliability. Any use of the information in this report is made by the user(s) at his/her
own risk, which may include catastrophic failure of the device or infringement of patent
or copyright laws.
Therefore, the recipient and/or user of the information contained in this report agrees to
indemnify, defend and save harmless the State its officers, agents and employees from
any and all claims and losses accruing or resulting to any person, firm, or corporation
who may be injured or damaged as a result of the use of this report.
vi
TABLE OF CONTENTS
Page
SIGNATURE PAGE ………………………………………………………………..…... ii
ACKNOWLEDGEMENTS …………………………………………………………….. iii
ABSTRACT ……………………………………………………………………………. iv
DISCLAIMER STATEMENT …………………………………………………………. v
TABLE OF CONTENTS ……………………………………………………………….. vi
LIST OF FIGURES ……………………………………………………………………. vii
LIST OF TABLES ……………………………………………………………………. viii
INTRODUCTION ………………………………………………………………………. 1
LITERATURE REVIEW ……………………………………………………………….. 3
PROCEDURE AND METHODS ……………………………………………………… 12
RESULTS …………………………………………………………………………….... 23
DISCUSSION ………………………………………………………………………..… 25
RECOMMENDATIONS ……………………………………………………………..... 26
REFERENCES ……………………………………………………………………..….. 27
APPENDIX A ……………………………………………………………………..…… 28
APPENDIX B ………………………………………………………………………….. 31
APPENDIX C ………………………………………………………………………….. 32
APPENDIX D ………………………………………………………………………….. 33
APPENDIX E ………………………………………………………………………….. 34
vii
LIST OF FIGURES
Page
Figure 1: Field picture with reference to my parent’s house. ............................................. 1 Figure 2: Map of field with different soils mapped (NRCS) .............................................. 7 Figure 3: Soils report data (NRCS) ..................................................................................... 7 Figure 4: Current field waiting for irrigation system. ....................................................... 12 Figure 5: Field layout and dimensions supplied by grower. ............................................. 13
Figure 6: Schematic of how the mainline is oriented in the field. .................................... 17 Figure 7: Current reservoir with pumping station on left. ................................................ 21 Figure 8: Final irrigation design for Todd Farms. ............................................................ 23 Figure 9: The beginning of the reservoir enlargement. ..................................................... 24
viii
LIST OF TABLES
Page
Table 1: Potential DU values for various irrigation systems (Burt, 2012). ........................ 4 Table 2: Classification of Brand New Emitter Manufacturer Quality (Burt and Styles,
2011) ................................................................................................................................... 5 Table 3: Monthly grape vine ET values for Zone 8 in a typical California year (ITRC.org)
............................................................................................................................................. 6
Table 4: Air temperatures at which irrigation system should be started for proper
protection. ......................................................................................................................... 10 Table 5: Vines per acre needed based on spacing. ............................................................ 11 Table 6: ITRC PLACEM4 outputs with varying hose ID. ............................................... 16
Table 7: Mainline sizing table. .......................................................................................... 18 Table 8: Opening and mesh size used in sand media tanks. ............................................. 18
Table 9: Media selection table for filters. ......................................................................... 19 Table 10: Filtration specifications .................................................................................... 19
Table 11: Total dynamic head (TDH) calculations........................................................... 20 Table 12: Reservoir sizing calculations. ........................................................................... 22
1
INTRODUCTION
A huge issue that agricultural engineers will face in their careers is the decline in
available water for both municipal use and agricultural use. This affects just about
everyone because we need water for both in house use and for growing the huge
percentages of the nation’s crops here in California. This sets the table for a much more
efficient use of the water that we can get our hands on and having to deal with less. On a
farmer’s standpoint, these rising water costs and power costs encourage them to put in
better or more efficient irrigation systems and invest in more efficient pumps with
variable frequency drives. These newer more efficient irrigation systems allow the farmer
to do more with less. They have less labor costs/needs, pumping costs and some even
have the capability of being run automatically or over the internet. Not only does this
translate into water savings but energy savings as well.
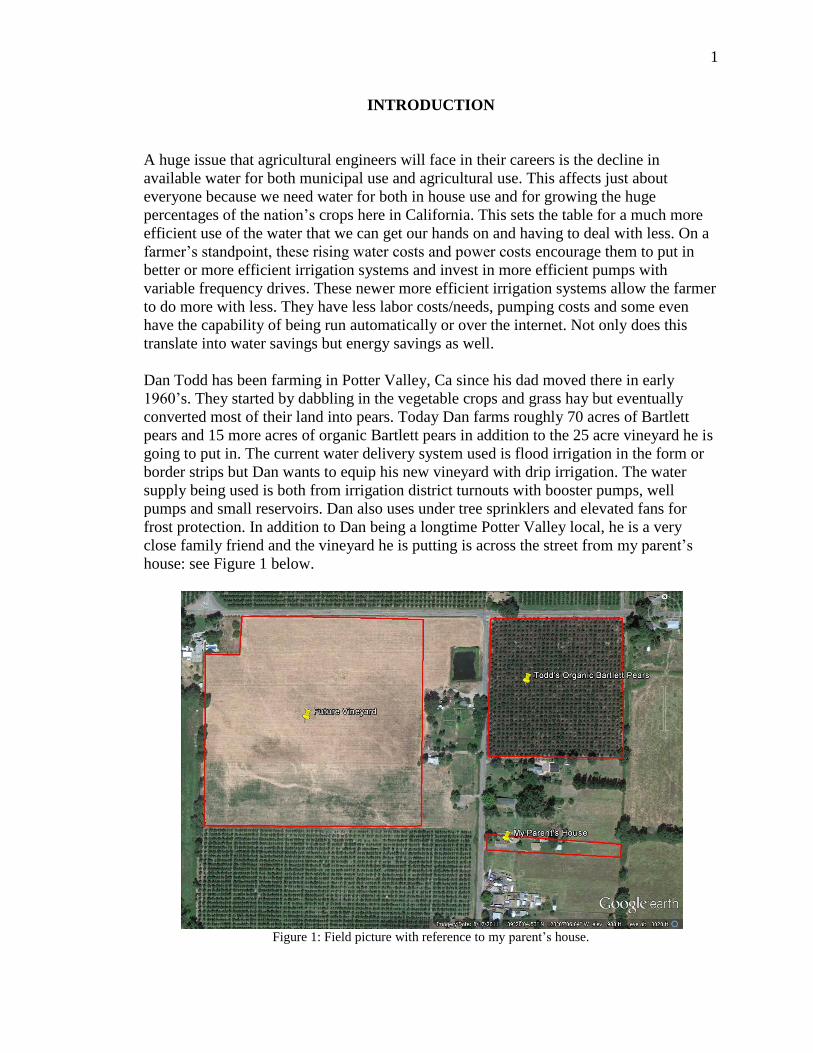
Dan Todd has been farming in Potter Valley, Ca since his dad moved there in early
1960’s. They started by dabbling in the vegetable crops and grass hay but eventually
converted most of their land into pears. Today Dan farms roughly 70 acres of Bartlett
pears and 15 more acres of organic Bartlett pears in addition to the 25 acre vineyard he is
going to put in. The current water delivery system used is flood irrigation in the form or
border strips but Dan wants to equip his new vineyard with drip irrigation. The water
supply being used is both from irrigation district turnouts with booster pumps, well
pumps and small reservoirs. Dan also uses under tree sprinklers and elevated fans for
frost protection. In addition to Dan being a longtime Potter Valley local, he is a very
close family friend and the vineyard he is putting is across the street from my parent’s
house: see Figure 1 below.
Figure 1: Field picture with reference to my parent’s house.

2
The scope of this project is to supply Dan Todd with a well planned and designed drip
irrigation system for his future vineyard. In addition to the irrigation design, the reservoir
seen in Figure 1 will also need to be enlarged and will be covered in this project. On the
other hand the solid set sprinkler system needed for frost protection will not be included
in this project. The main components of the design will be underground to allow for
machinery access and some protection from freezing pipes. A filter station at the head of
the system will be incorporated and properly sized along with the pumping requirement
for the whole field’s irrigation need. This will not however include the pumping
requirement for the frost protection system. Once the design is completed it will be
analyzed and then presented to the client, Dan Todd.
3
LITERATURE REVIEW
Due to the unfamiliarity with most people and the terms often used in the irrigation
industry, a literature review has been performed to define certain terms, see what
information was already out there and what needs to be taken into account for this
project.
Efficiency
Efficiency can be looked at in two different ways: irrigation efficiency (IE) and
application efficiency (AE).
Irrigation efficiency, the more popular of the two terms, is defined as the “irrigation water
beneficially used” divided by the “irrigation water applied minus the irrigation water
stored” (Burt, 2012). More frequently the equation is simplified to the “irrigation water
beneficially used” divided by “the irrigation water applied.” In equation form:
This “irrigation water stored” part of the first equation can be taken out for the
simplification because in most cases the efficiency is being analyzed on an on-farm basis
and there is typically no change in storage. The tricky term in the above equations is the
word “beneficial.” Beneficial use of the water is referring to crop evapotranspiration
(evaporation and transpiration), salt leaching or other special purposes such as pre-
irrigation, soil preparation, weed germination and climate control (Burt, 1995). Water can
be stored in the root zone but if it is not used by the plant in time, it will evaporate from
the soil and be of no benefit to the crop. Some non-beneficial uses of water are weed
transpiration, excess deep percolation, excess tailwater and canal/pipe seepage (Burt and
Styles, 2011).
Application efficiency is typically used for a quick estimate of what the IE might be or
evaluate one irrigation event. It is defined as the “average depth of irrigation water
contributing to target” divided by the “average depth of irrigation water applied” (Burt,
2012). In equation form:
Once again, there is another tricky term in the equation, “target.” The target could be the
soil moisture depletion (SMD), the leaching requirement or just a target irrigation depth
(Burt and Styles, 2011). This only works if there is assumed uniformity and does not take
4
into account beneficial uses discussed above. AE can also be used for evaluating a single
irrigation event, whereas IE can be used for a variety of time intervals (Burt et al. 1999).
Distribution Uniformity
Distribution uniformity (DU) relates to the evenness of how the water is applied over the
field. This means it is field dependent and cannot be displayed in terms of a farm,
irrigation district, or basin. DU is defined as the “average low quarter depth of water”
divided by the “average depth of water accumulated in all elements” (Burt and Styles,
2011). In equation form:
Unlike efficiency, these values are expressed as decimals instead of percent’s. DU can be
calculated for as little as one row of trees or vines to as much as the whole field. Due to
the pressure differences, each tree/vine will see different amounts of water and thereby
affect the DU. Differences in DU depend on the irrigation system present. See table
below for potential DU values for various irrigation systems:
Table 1: Potential DU values for various irrigation systems (Burt, 2012).
Irrigation Method Potential DU
Permanent Under Tree Sprinkler 0.94
Orchard Drip 0.92
Row Crop Drip 0.90
Border Strip 0.85
Hand Move Sprinklers without alternate
sets
0.75
Although the above table lists “potential DU” values, the actual values are almost always
lower due to each irrigation design, the suitability of the design, and the management of
the system (Burt, 1995).
Another term that affects DU in the drip/micro industry is the coefficient of variance (cv)
which is the manufacturing variability of new emitters and sprayers (Burt and Styles,
2011). If there is a “cv” greater than 0.0, the plants will see some variability in the water
that they will receive. Using this term DU can be rewritten mathematically:
√
Where n = the number of emitters supplying each plant
5
Table 2: Classification of Brand New Emitter Manufacturer Quality (Burt and Styles, 2011)
Classification Manufacturing cv
Excellent < 0.03
Average 0.03 – 0.07
Marginal 0.07– 0.10
Very Poor > 0.10
Evapotranspiration
Evapotranspiration (ET) is the sum of the plant transpiration and the evaporation of water
from the wet soil or plant surfaces (Burt, 2012a); both of which are crucial for plant
health and growth. ET does not take into account spray losses from the sprinkler or from
moderate to high wind levels. This water that the plant uses in its ET is the requirement
that each irrigation system needs to be able to provide on a monthly or yearly basis.
Typically, the peak ET rate/month is found and the system is designed to be able to
provide that amount of water.
Transpiration is the water that passes from the soil into the plant roots, through the plants,
and out the leaves into the air (Burt, 2012a). This means that the majority of water
movement from the roots to the leaves is mostly in the liquid form and finally water
vapor once it leaves the stomata. As talked about before in the efficiency term, this
transpired water is typically the main use of the “beneficially used” water (Burt, 2012a).
The temperature and humidity of the soil and air also have an effect of transpiration.
Hotter, drier air results in a higher transpiration rate (Burt, 2012a) which is why the peak
ET month occurs during the hotter, drier summer months of June and July; vice versa for
the temperature and humidity of the soil.
Evaporation is the water that is converted from liquid to gas in the plant atmosphere but
does not pass through the plant like the transpiration water (Burt, 2012a). Some examples
of this could be variations of soil evaporation, wet foliage evaporation or sprinkler spray
losses. Soil evaporation represents the majority of the annual evaporation for a crop
(Allen et al., 1998) and even though drip systems have less of an area wet, they still have
the same amount of evaporation as sprinklers. This is because the drip systems keep a
small portion of the soil wet for a long period whereas a sprinkler system gets a large area
wet for a short time (Burt, 2012a). Wet foliage evaporation is highly dependent on the
crop but not prevalent in a drip system for a vineyard. The foliage in a vineyard only gets
wet during a frost protection event and evaporation doesn’t matter in that situation. Lastly
spray loss from sprinklers is usually in a range of 1-4% for typical sprinkler systems
(Burt, 2012a). Once again, spray losses will not affect the design of the drip system for
the vineyard.
6
Table 3: Monthly grape vine ET values for Zone 8 in a typical California year (ITRC.org)
1997 Zone 8 Grape Vines Monthly ET (in) - Typical Year
Month Precipitation Reference ETo 40% Canopy 60% Canopy
No Cover Cover Crop No Cover
January 6.76 0.75 0.84 0.86 0.84
February 0.36 2.30 0.99 1.79 0.99
March 1.27 3.64 1.49 2.36 1.49
April 1.37 5.19 2.66 3.51 3.09
May 1.15 6.72 3.75 4.66 4.95
June 0.41 7.03 3.23 4.13 4.56
July 0.22 6.92 2.74 3.70 4.02
August 0.72 5.88 2.48 3.39 3.25
September 0.02 5.17 1.03 2.11 1.43
October 1.11 3.33 0.92 2.00 0.93
November 8.44 1.06 0.55 0.73 0.55
December 3.29 1.22 1.13 1.32 1.13
Total: 25.11 49.20 21.82 30.56 27.23
As seen in Table 3 above, these are the values for grape vines grown in CIMIS Zone 8
(Northern Ca) during a typical year of rainfall. These values were collected off of the
ITRC.org website after selecting the proper CIMIS Zone. From this table one can see that
the critical times for ET are in the earlier months of fruit production, May and June. Also,
the more canopy cover the vines have the less ET it will experience on a yearly basis.
When looking at this data, the irrigation design will be designed to supply enough water
to satisfy the peak ET/month rate.
Soils
In order to get soils information for the particular area of the design, the Natural
Resources Conservation Service (NRCS) website was used. On the website NRCS has
Web Soil Survey (WSS) and if one knows the location of any field in the country, a free
soils report will be provided for that area. For example, the field was outlined on the
website, then a report was generated by the shape of the field, the location of the field and
the soils involved with that field. Below in Figure 2 and Figure 3 are some of the results
from the report.
7
Figure 2: Map of field with different soils mapped (NRCS)
Figure 3: Soils report data (NRCS)
From this report, an estimate of the size of the field is given before being surveyed, the
soil types and the percent slopes are all given. From these tables, the field in question has
relatively low percent slopes, and very loamy soils; in this location Russian loam or Cole
clay loam dominate. It is important to get soil data because the soil characteristics
determine a lot of the irrigation design restraints. For example, the Russian loam with
gravelly substratum has a available water holding capacity (AWHC) of approximately 6.6
inches per foot whereas the Russian loam can hold approximately 9.6 inches.
Characteristics like these affect the amount of water available to the plant in the soil, the
infiltration rate and how often to irrigate.
Pipeline Hydraulics
Water moves from a point of higher energy to a point of lower energy and friction
happens between those two points (Burt, 2011). This is important to recognize because
there is also a decrease in energy that goes along with water moving from one point to
another whether it is flowing by gravity or being pumped. In order to account for
115
190
128
188
8
pressures, elevations, and velocities of water in a pipe Bernoulli’s equation is used. From
the BRAE 312 textbook, Basic Hydraulics, the Bernoulli equation goes as follows:
[(
) ] [(
) ]
Where,
V = the velocity of the water
Elev = the elevation of the point in question
P = the pressure at the point in question
Hf = the friction loss that occurs from the u/s point to the d/s point
Hp = the added energy from a pump
The left side of the equation refers to the upstream point (u/s) and the right side refers to
the downstream point (d/s).
Other equations used to calculate the friction loss between two points in a pipe are the
Darcy-Weisbach and Hazen-Williams.
Darcy Weisbach is the most correct form of a hose friction loss equation and is used in
most computer programs (Burt and Styles, 2011). The equation is seen below:
Where,
Hf = friction loss
V = velocity of water
L = pipe length in question
D = inside diameter of pipe
g = gravitational constant
f = friction factor depending on Reynolds number (Re)
μ = kinematic viscosity of water
The Reynolds number is a dimensionless number defined below (Burt and Styles, 2011):
μ
The Moody Diagram is frequently used to find the correct friction factor if given the
Reynolds number and the relative roughness of the pipe in question (Burt and Styles,
2011).
Hazen-Williams is the friction computation equation used by most irrigation designers
due to the complexity of the Moody Diagram and the Darcy-Weisbach equation. This is
9
an empirical equation used with a variety of materials such as PVC, aluminum, etc. (Burt,
2011). The equation goes as follows:
Where,
K = a constant of 10.5 for English units
Q = flow rate of pipe
ID = inside diameter of pipe
C = friction factor depending on the type of pipe material and size
Pipe “C” values can be found in the BRAE 312 Basic Hydraulics textbook on page 1-25
in Table 1-7. For example, the “C” value of PVC pipe is 150 whereas the “C” value of
old cast iron is 100. Now looking at the equation above, the lower “C” value results in
higher friction losses over that segment of pipe.
Frost Protection
Frost protection is the act of protecting a crop from freezing and irrigation has been
proven to be very effective/widely used in California with orchards and vineyards (Burt,
2012a). There are five major terms that drastically affect freezing and frost protection.
Below are the definitions of the terms according to the BRAE 331 Ag-Irrigation
Management Textbook (Burt, 2012a):
1. Dew-Point Temperature: The temperature at which vapor in the air will condense.
Dew will form on a cold surface, at or below the dew point temperature, as
moisture laden air passes over that surface.
2. Relative Humidity: The ratio of the actual vapor pressure in the air to the satration
vapor pressure, times one hundred. At a relative humidity of 100%, the air can
hold no more water vapor at that temperature.
3. Wet Bulb Temperature: The temperature recorded by a thermometer that is swung
around through the air, with a wet wick over the bulb. This is also the temperature
to which the air will drop when the sprinklers are turned on. If the air has a low
relative humidity, the wet bulb temperature is much lower than the dry bulb
temperature.
4. Dry Bulb Temperature: The air temperature.
5. Inversion Layer: A later of cold air is near the ground surface, while air several
tens or hundreds of feet higher is warmer.
There are two types of freezes that affect vineyards in California: advective freezes and
radiation freezes (Minton et al, 2011). Advective freezes deal with the wind taking the
heat away from the orchard or vineyard, then blowing cold air in (Burt, 2012a). It is very
hard if not impossible to protect against advective freezes with sprinklers. Radiation
freezes on the other hand occurs when the heat from the ground radiates upward in the
form of long wave radiation (Minton et al, 2011). Radiant freezes are often accompanied
by an inversion layer (Burt, 2012a). When the temperature drops below the dew point
10
temperature, frost will appear. Sprinklers and other irrigation have been proven to be very
effective against radiant freezes.
Vines are more or less susceptible to freezes depending on the time of year. For example,
in the heart of winter, the vines are dormant and the freezing temperatures have no effect
on the vines. However during bud break and blossom in the spring, the vines are very
sensitive to freezes (Burt, 2012a). In order to protect from freezes, farmers can store heat
in the soil in the form of water during the day, they can keep grass levels well maintained
in the vineyard and they can avoid border barriers that will make cold air pool and
intensify the freezing situation (Minton et al, 2011). If the above techniques aren’t
enough, one can use active techniques such as wind machines or irrigation to protect
against frost. Ironically, when water freezes heat is released. This is the most effective
type of frost protection (Burt, 2012a) and can be used to protect the vines up to 10-15oF
below freezing.
As far as general recommendations for frost protection the BRAE 331 textbook offers
some basic guidelines (Burt, 2012a):
Size the reservoir supplying the water for frost protection for three to four nights
in a row of ten hours of operation. Therefore, make sure the reservoir should be
large enough to handle 30-40 hours of continuous irrigation from the overhead
sprinklers.
The overhead sprinklers in the vineyard must have a good catch can distribution
uniformity (CCDU) because frost protection relies on direct water contact with
the plant.
Wind speed, humidity and temperature affect the application rate of water needed.
Lower temperatures require more water along with higher wind speeds.
See Table 4 below for freeze protection system starting temperatures. Note: After
sunrise with no wind, sprinklers can be turned off at 32oF and if wind 34
oF.
Table 4: Air temperatures at which irrigation system should be started for proper protection.
Dew Point Temperature, deg F System Starting Temperature, deg F
26+ 34
24-25 35
22-23 36
20-21 37
17-19 38
15-16 39
Spacing
When designing the vineyard two different spacing terms will have an effect: row
spacing and vine spacing. According to Kurtural (2007), one common fallacy with
designing vineyards is to design to the current equipment owned by the farmer. This
should not be the case because proper row spacing is needed for optimal production.
Instead, equipment should be procured to fit the designed spacing. Vine spacing can
predict how many vines there will be per acre but once again, the designer can’t use any
11
arbitrary value. The vine spacing needs to match the vine type and the desired fruit
quality. The highest yields have typically come from vineyards containing 600 or more
vines per acre however ideal spacings are found to be about 600 vines per acre (Kurtural,
2007). According to the table below this translates to a spacing of 8’ by 9’.
Table 5: Vines per acre needed based on spacing.
Vines per Acre
Vine Spacing (ft) Row Spacing (ft)
7.5 8 8.5 9 9.5 10
5 1162 1089 1025 968 917 871
6 968 908 854 807 764 726
7 830 778 732 691 655 622
8 726 681 641 605 873 545
12
PROCEDURES AND METHODS
Irrigation Design Procedures
This section will go over the design and calculations of the irrigation system.
Preliminary Data Supplied by Grower
Before every irrigation system can be designed a lot of given information needs to be
supplied by the grower or collected by the designer. More information that is given to the
designer will result in a better final product. Major factors that need to be considered
include: field location, field size, field shape, crop, row orientation, ET values, water
source, field slope, soil type, crop spacing, and hours of operation. These are just the bare
minimum needed to design a proper irrigation system; more information, like stated
above, will result in a better design. If any of these are not supplied by the grower, they
need to be pursued by the designer.
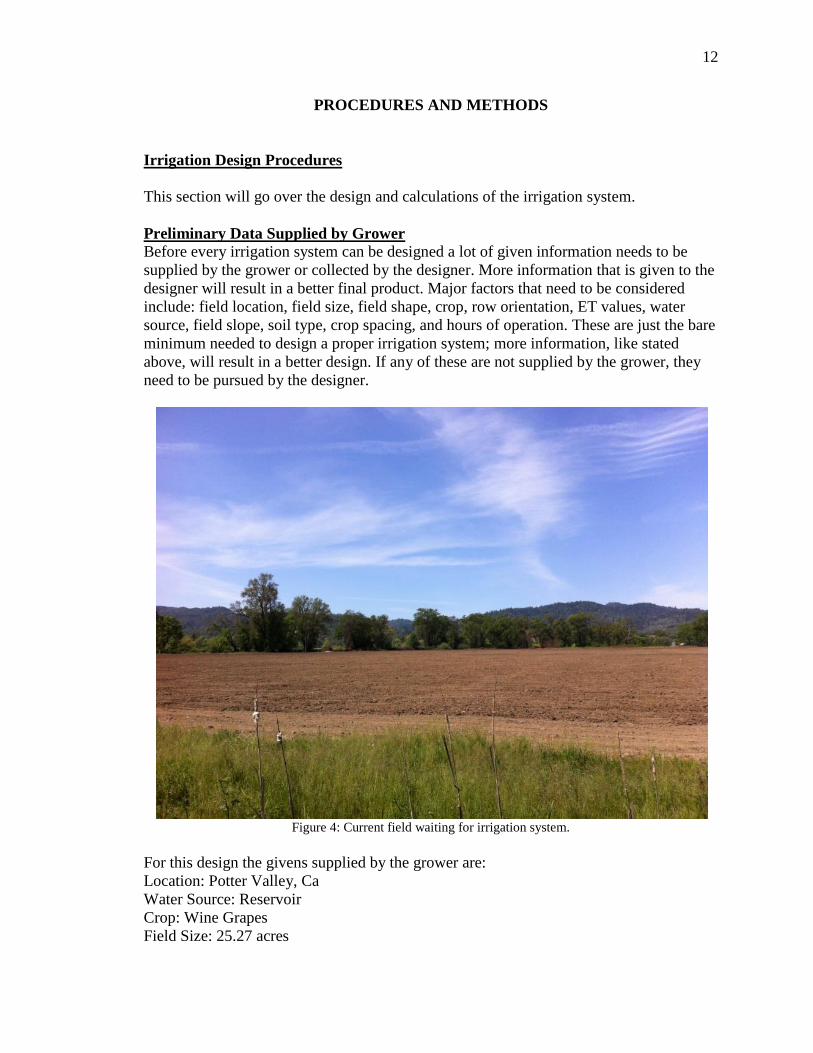
Figure 4: Current field waiting for irrigation system.
For this design the givens supplied by the grower are:
Location: Potter Valley, Ca
Water Source: Reservoir
Crop: Wine Grapes
Field Size: 25.27 acres
13
Row Orientation: East to West
Vine Spacing: 8’ by 6’
Soil Type: Russian Loam
Peak ETc: 4.95 in/month
Peak ETc Month: May
Slope West to East: 0.02%
Slope North to South: 0.03%
Along with the given information come the constraints or restrictions that are placed on
the field due to the area or the grower. Some restrictions include: existing pipelines and
equipment, salinity problems, infiltration problems, specific equipment desired, water
supply and hours of operation.
For this design some of the constraints are:
Max Hours of Operation: 18 hours/day
Drip Hose: Netafim Uniram
System DU: 0.92
Existing Pipeline: 10” PVC coming from pumping station
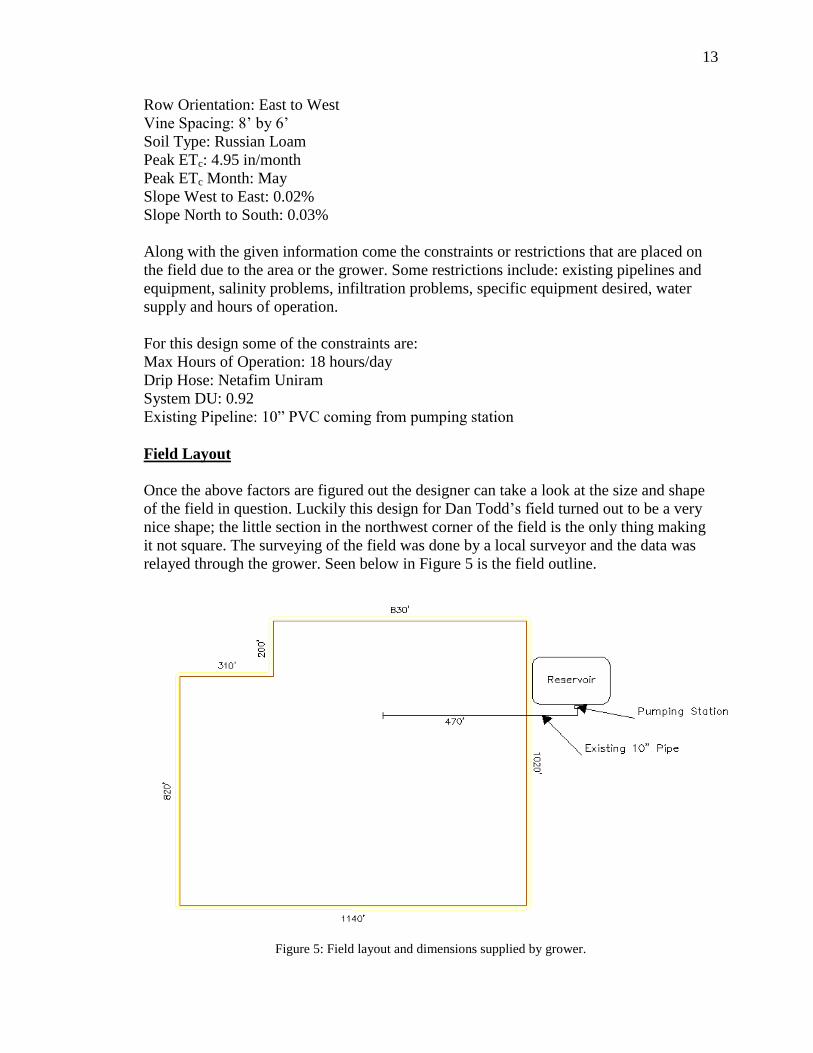
Field Layout
Once the above factors are figured out the designer can take a look at the size and shape
of the field in question. Luckily this design for Dan Todd’s field turned out to be a very
nice shape; the little section in the northwest corner of the field is the only thing making
it not square. The surveying of the field was done by a local surveyor and the data was
relayed through the grower. Seen below in Figure 5 is the field outline.
Figure 5: Field layout and dimensions supplied by grower.

14
Also in Figure 5, one can see the existing 10” pipe that Dan wants to incorporate into the
mainline of the irrigation design.
Peak ET Calculation
In order to properly supply the crop with enough water the peak ET rate needs to be
found. Peak ET values can be found on itrc.org website and are then categorized by the
crop being evaluated, the zone it will be grown in and the yearly rainfall characteristic
(dry, typical or wet). For this design with wine grapes in Zone 8, the peak ET value for a
typical year was 4.95 inches/month in the month of May. This translates to 0.16
inches/day which is more helpful than the monthly value.
Gross Application Rate Determination
The net required flow rate per vine is the amount of water needed by the plants per day.
This is based off of the vine spacing, the peak ET rate and the hours of available
operation. This equation looks like:
GPMnet/Vine = (inches/day * vine spacing)/(96.3 * hours of operation)
For this design, the givens are:
Inches/day: 0.18
Vine Spacing: 8’ by 6’
Hours of Operation: 18 hrs/day
Design DU: 0.92
Future DU: 0.86
This results in a net flow rate of 0.0049 GPM/vine or 0.292 GPH/vine. This however
doesn’t give us the total amount needed. In order to get that, the DU of the system has to
be taken into account. The equation for the gross GPH/vine is:
GPHgross/Vine = (GPHnet/vine)/(Future DU)
The reason the DU is taken into account is because not every vine will be getting the
same amount of water. Dividing by the DU will make sure all the vines get at least all the
water they need if not more. In this design the future DU will be used instead of the
design DU because even though the system will operate at the design DU for a while,
after a few years the DU will go down. This way, the design is ready for the worst case
scenario. This results in a gross flow rate of 0.340 GPH/vine.
Emitters per Vine Estimation
For a good irrigation system, the designer should make sure there is at least 60% wetted
area. For this design, there should be at least 48 ft2 of wetted area. According to Burt and
Styles (2007) water will also travel laterally through the soil meaning water will travel
15
beyond where the dripper drops. This additional lateral movement due to a loamy soil
will add 3.75’ to the wetted diameter calculation. Drip already has a wetted diameter of
2’ so this will result in a total diameter of 7.5’. In order to get the percent wetted area, one
just has to divide the wetted area by the vine spacing. For this design, the wetted area
percentage comes out to be 92%, which means one dripper per vine would be adequate.
Although one dripper per vine would work, the drip hose desired by the farmer, Netafim
Uniram, doesn’t come with 72” emitter spacings. This means 36” emitter spacing will
need to be used and two emitters per vine.
Hours of Operation Correction
The calculations done above about the gross flow rate needed per vine assumed one
emitter per vine but since there are two emitters per vine, the hours of operation need to
be corrected. The drip hose has 0.260 GPH/emitters which will result in 0.520 GPH/vine.
This 0.520 GPH/vine is greater than the 0.340 GPH/vine required, so our hours of
operation will be decreased. An equation from above will be manipulated to give hours of
operation required.
GPMgross/Vine = (in/day * vine spacing * DU * emitters/vine)/(96.3 * hours of operation)
The reduced hours of operation required are 11.76 hours/day or 82.29 hours/week. This
means Dan can irrigate however long he wants per day as long as the weekly total is
greater than 82.29 hours.
Hose Lateral Inlet Pressure Calculations
Netafim Uniram drip hose is a pressure compensating (PC) drip hose. This means that as
long as the pressure at each emitter is greater than the threshold pressure, each emitter
will distribute the same amount of water. The threshold pressure for Netafim Uniram is 7
psi. This means the absolute minimum pressure at the end of each lateral must be at least
7 psi. As water is flowing through a lateral, energy is being lost and therefore going down
in pressure. This means, as the laterals get longer and depending on the size of the hose,
the required inlet pressures are different. The Irrigation Training and Research Center
(ITRC) has a DOSBox program called PLACEM4.exe that will do this for the designer.
The inputs to the program are: desired flow rates, nominal flow rates, emitters per vine,
emitter spacing, additional length for expansion/contraction, total length of lateral,
manufacturing coefficient of variance (CV), water temperature, slope and the emitter
discharge exponent.
For this design, the inputs are:
GPH/Emitter: 0.260 GPH
Avg Emitter Pressure: 13 psi
Nominal Flow Rate: 0.260 GPH
Emitters/Vine: 2
Emitter Spacing: 36”
Additional % for Snaking: 2.5%
16
Manufacturing CV: 0.025
Total Length of Field: 1140’
Water Temperature: 70oF
Slope: 0.02%
Discharge Exponent: 0.0001
These givens were determined by steps done earlier in the design. The 13 psi was chosen
because it is high enough above the 7 psi threshold pressure. As a designer, the lowest
pressure in the line should be nowhere near the threshold pressure. Also, the
manufacturing data claims a discharge exponent of zero (because of the pressure
compensating emitters), but the program can’t handle that; an exponent of 0.0001 was
used to circumvent that. All the possible hose sizes were used but each resulted in the
same DUlq. Therefore, the smallest hose diameter (0.540) was chosen because it is
cheaper and easier to deal with. This program also tells where to put the manifold due to
the constraints entered. PLACEM4 said to put the mainline 559’ uphill and 581’
downhill. The inlet pressure required was 14.6 psi and the DU was 0.97.
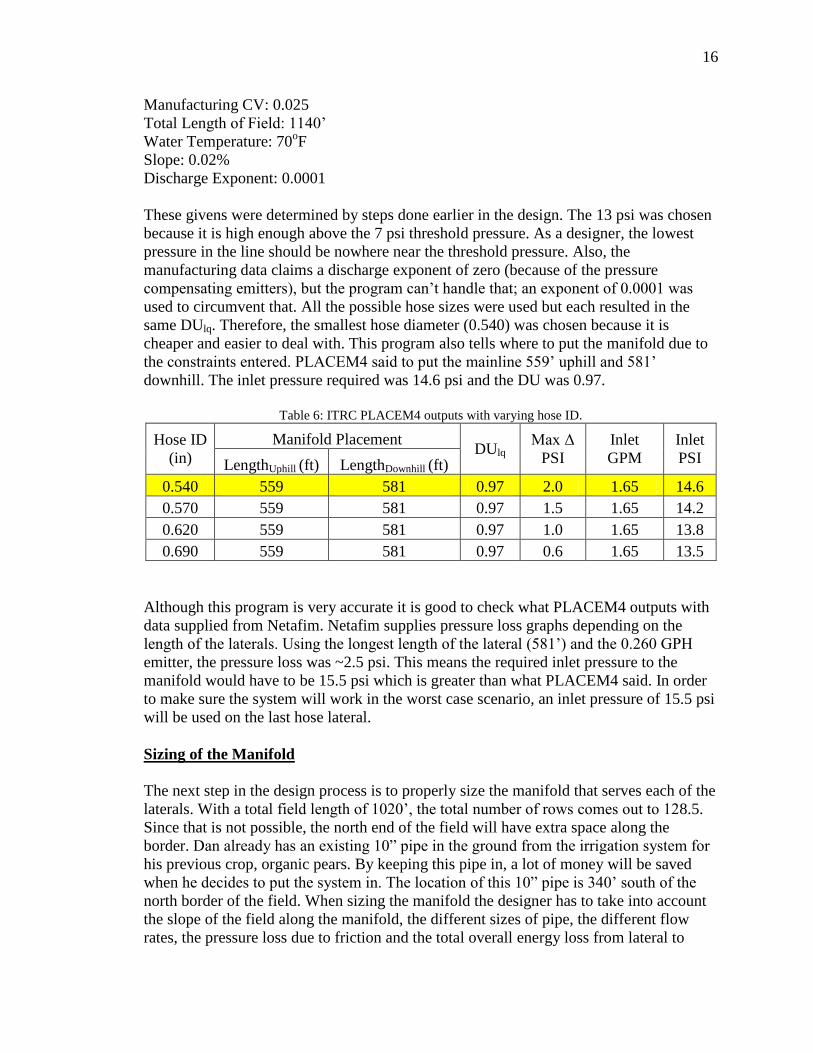
Table 6: ITRC PLACEM4 outputs with varying hose ID.
Hose ID
(in)
Manifold Placement DUlq
Max Δ
PSI
Inlet
GPM
Inlet
PSI LengthUphill (ft) LengthDownhill (ft)
0.540 559 581 0.97 2.0 1.65 14.6
0.570 559 581 0.97 1.5 1.65 14.2
0.620 559 581 0.97 1.0 1.65 13.8
0.690 559 581 0.97 0.6 1.65 13.5
Although this program is very accurate it is good to check what PLACEM4 outputs with
data supplied from Netafim. Netafim supplies pressure loss graphs depending on the
length of the laterals. Using the longest length of the lateral (581’) and the 0.260 GPH
emitter, the pressure loss was ~2.5 psi. This means the required inlet pressure to the
manifold would have to be 15.5 psi which is greater than what PLACEM4 said. In order
to make sure the system will work in the worst case scenario, an inlet pressure of 15.5 psi
will be used on the last hose lateral.
Sizing of the Manifold
The next step in the design process is to properly size the manifold that serves each of the
laterals. With a total field length of 1020’, the total number of rows comes out to 128.5.
Since that is not possible, the north end of the field will have extra space along the
border. Dan already has an existing 10” pipe in the ground from the irrigation system for
his previous crop, organic pears. By keeping this pipe in, a lot of money will be saved
when he decides to put the system in. The location of this 10” pipe is 340’ south of the
north border of the field. When sizing the manifold the designer has to take into account
the slope of the field along the manifold, the different sizes of pipe, the different flow
rates, the pressure loss due to friction and the total overall energy loss from lateral to
17
lateral. In this particular design the pressure regulating point, the pressure compensating
emitters, is downstream of the manifold. This creates a situation where the manifold is
sized due to economics instead of DU. A maximum water velocity of 4.5 feet per second
was used and when that value was hit, a change in pipe size occurred. The manifold to
the south was analyzed first and resulted in an inlet pressure of 19.55 psi and a flow rate
of 141.9 GPM, where the manifold meets the mainline. The manifold north of the
mainline resulted in an inlet pressure of 17.52 psi and a flow rate of 69.3 GPM. This
means that at least 19.55 psi is required where the manifold and the mainline meet.
Flushing Requirements
Another DOSBox program developed by the ITRC is SINGLE4.exe. This program can
do three different tasks but in this design it was used to find the flushing requirements.
The inputs for this program are hose diameter, emitter spacing, total lateral length and
flushing velocity. A flushing velocity of 1.5 ft per second was used resulting in a flushing
flow rate of 1.91 GPM per lateral. Since this is greater than the flow rate used for
irrigation, only a fraction of the laterals can be flushed at one time. Of the total laterals,
only 110 can be flushed at the same time with the flow rate coming from the pump.
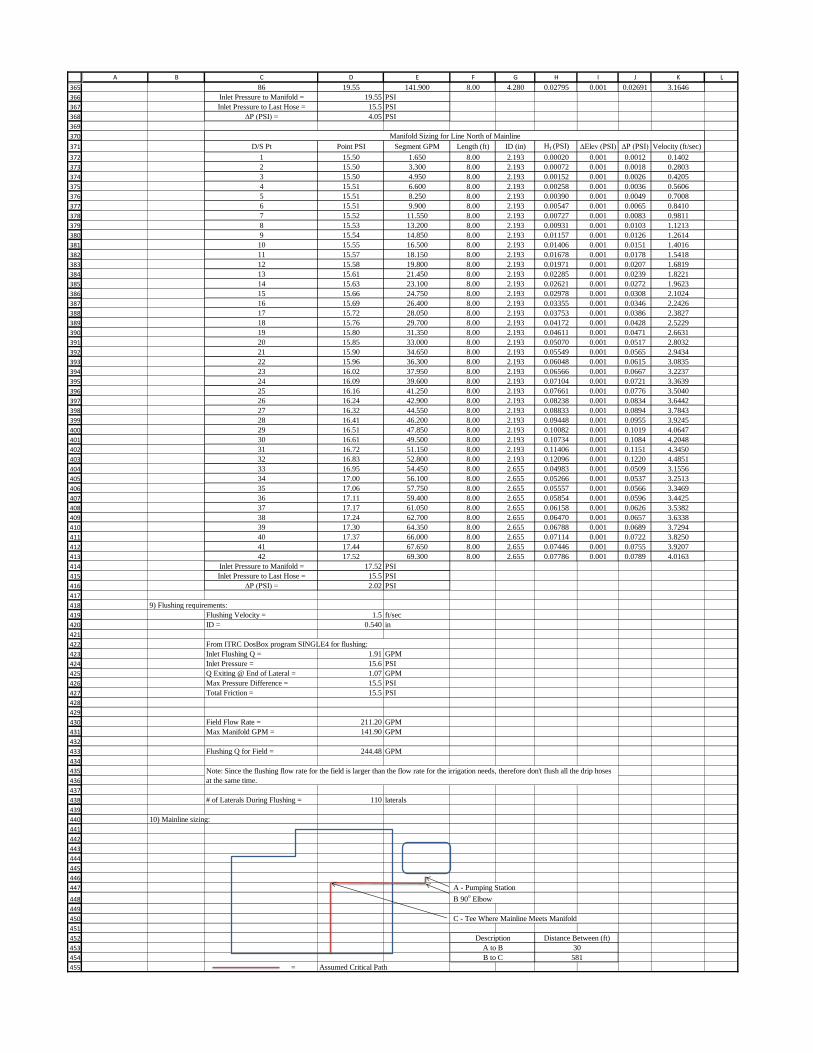
Mainline Sizing
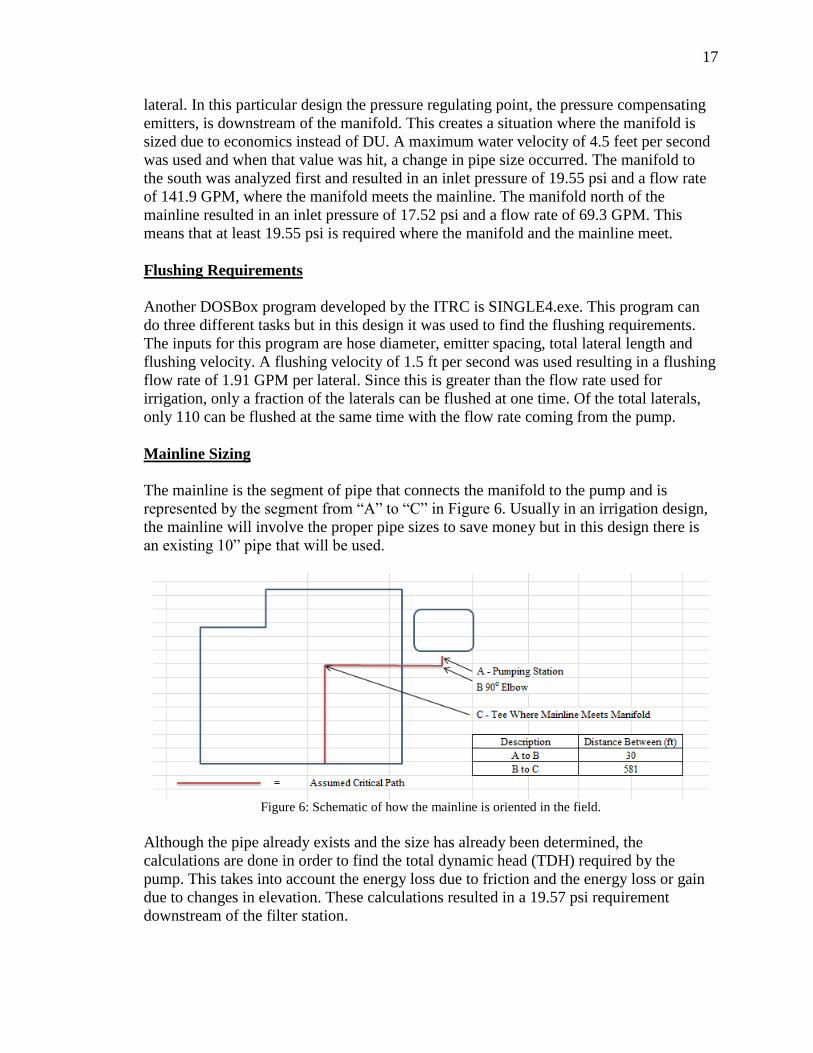
The mainline is the segment of pipe that connects the manifold to the pump and is
represented by the segment from “A” to “C” in Figure 6. Usually in an irrigation design,
the mainline will involve the proper pipe sizes to save money but in this design there is
an existing 10” pipe that will be used.
Figure 6: Schematic of how the mainline is oriented in the field.
Although the pipe already exists and the size has already been determined, the
calculations are done in order to find the total dynamic head (TDH) required by the
pump. This takes into account the energy loss due to friction and the energy loss or gain
due to changes in elevation. These calculations resulted in a 19.57 psi requirement
downstream of the filter station.
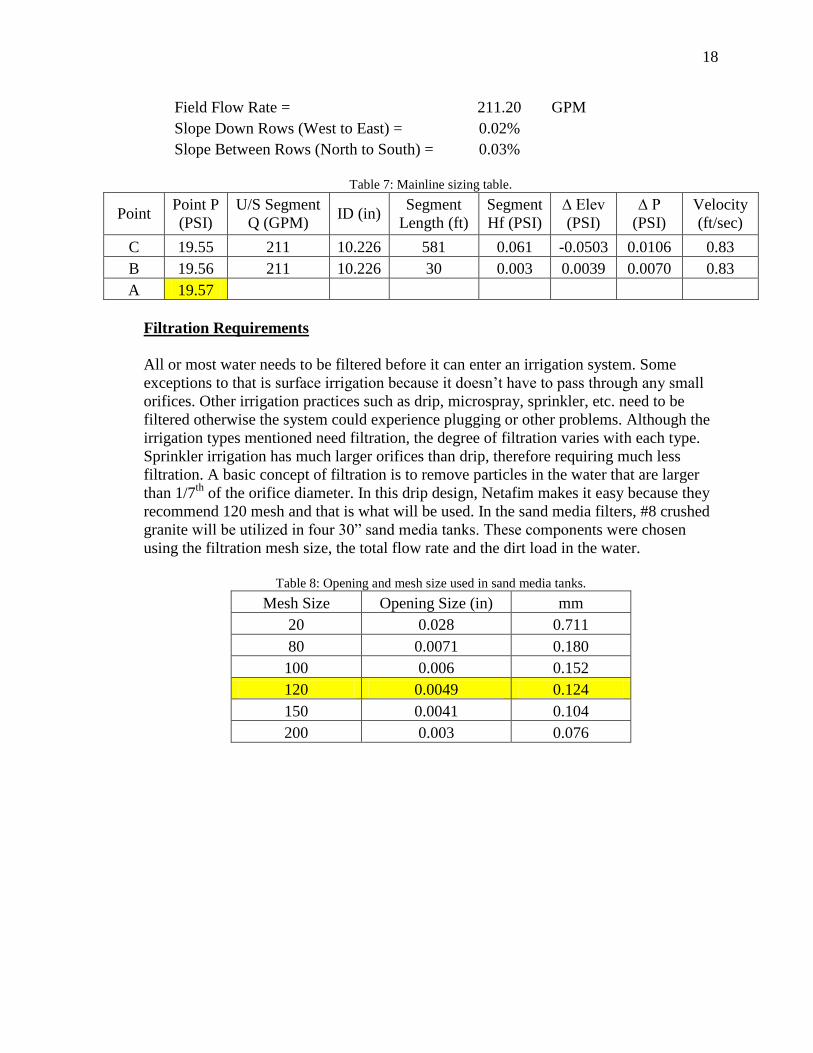
18
Field Flow Rate = 211.20 GPM
Slope Down Rows (West to East) = 0.02%
Slope Between Rows (North to South) = 0.03%
Table 7: Mainline sizing table.
Point Point P
(PSI)
U/S Segment
Q (GPM) ID (in)
Segment
Length (ft)
Segment
Hf (PSI)
∆ Elev
(PSI)
∆ P
(PSI)
Velocity
(ft/sec)
C 19.55 211 10.226 581 0.061 -0.0503 0.0106 0.83
B 19.56 211 10.226 30 0.003 0.0039 0.0070 0.83
A 19.57
Filtration Requirements
All or most water needs to be filtered before it can enter an irrigation system. Some
exceptions to that is surface irrigation because it doesn’t have to pass through any small
orifices. Other irrigation practices such as drip, microspray, sprinkler, etc. need to be
filtered otherwise the system could experience plugging or other problems. Although the
irrigation types mentioned need filtration, the degree of filtration varies with each type.
Sprinkler irrigation has much larger orifices than drip, therefore requiring much less
filtration. A basic concept of filtration is to remove particles in the water that are larger
than 1/7th
of the orifice diameter. In this drip design, Netafim makes it easy because they
recommend 120 mesh and that is what will be used. In the sand media filters, #8 crushed
granite will be utilized in four 30” sand media tanks. These components were chosen
using the filtration mesh size, the total flow rate and the dirt load in the water.
Table 8: Opening and mesh size used in sand media tanks.
Mesh Size Opening Size (in) mm
20 0.028 0.711
80 0.0071 0.180
100 0.006 0.152
120 0.0049 0.124
150 0.0041 0.104
200 0.003 0.076
19
Table 9: Media selection table for filters.
Media Selection Table
Media # Media Type Mean Effective
Media Size
Mean Filtration
Capacity (mm) (@
15-25 GPM/ft^2)
12 Round Monterey Sand 1.30 0.16 - 0.15
16 Round Monterey Sand 0.65 0.12 - 0.15
8 Crushed Granite 1.50 0.11 - 0.15
12 Crushed Silica 1.20 0.11
20 Round Monterey Sand 0.50 0.11
11 Crushed Granite 0.78 0.08 - 0.11
16 Crushed Silica 0.70 0.08 - 0.10
20 Crushed Silica 0.47 0.06 - 0.08
Table 10: Filtration specifications
Flowrate (GPM) Number and Size
of Media Tanks Moderate Dirt
Load
Heavy Dirt
Load
50 35 Two 18"
100 70 Three 18"
150 105 Three 24"
275 192 Three 30"
425 299 Four 30"
575 399 Four 36"
775 539 Three 48"
1025 719 Four 48"
1275 899 Five 48"
The water used to backflush the sand media tanks will be put back into the reservoir in
order to be used later. It is important to put this outlet a distance away from the pump
inlet so that the dirty water that was just taken out of the filters doesn’t immediately go
back into the filters. See the filter station detail in Appendix E for layout and details.
Total Dynamic Head
The total dynamic head (TDH) is the amount of energy the pump or series of pumps
needs to put into the water to properly supply the irrigation system. As discussed earlier
in the report, a threshold pressure needs to be maintained otherwise the Netafim Uniram
emitters won’t work properly. This would then result in the vines not getting the required
water they need for survival. From the design of the mainline, the pressure needed at the
discharge of the pump was 19.57 psi. Other losses that will occur in the system will come
from dirty sand media filters, preliminary screen filters, minor losses and the height from
20
the manifold to the vine. This TDH totals up to 32.89 psi or 75.97 ft of pressure. Using
this TDH value and the flow rate the pump can be properly chosen and supplied to Todd
Farms.
Table 11: Total dynamic head (TDH) calculations.
Pressure Required Downstream of Filters = 19.57 PSI
Dirty Media Filter Loss = 7.00 PSI
Emergency Screen Loss = 0.50 PSI
Manifold to Vine Height = 6.50 ft
Manifold to Vine Height = 2.81 PSI
Minor Losses = 3.00 PSI
Required Pump TDH = 32.89 PSI
Required Pump TDH = 75.97 ft
Air/Vacuum Release Vents
Air vents are a very important part of every drip design and are used to let air in or out of
the system at startup, while the system is running, and when the system turns off.
According to Burt and Styles (2012b) an air vent should be placed every quarter of a
mile, at all high points and downstream of every air entrance to the system. Just as
important as air vents is vacuum relief valves. They should also be placed at all high
points and downstream of shutoff valves. Since this design is relatively small with short
pipe runs air vents will be placed at the end of each manifold (North and South) and
downstream of the pump. Vacuum relief valves will be placed at the high point along
with the air vent but also downstream of the shutoff valve so water can recede back into
the reservoir. See the drawing in Appendix E for more detail on where the air vents will
be placed.
Reservoir Enlargement Design Procedures
This section will go over the design and calculations of the reservoir enlargement.
Preliminary Data Supplied From Grower
Once again, in order to make sure the reservoir has enough storage for both irrigation
needs and frost protection needs, proper data needs to be relayed to the designer. In this
case a lot of those givens are the same bits of data. For this part of the design some of the
givens include: field size, vine spacing, sprinkler spacing, catch can DU (CCDU), flow
rate DU (GPMDU), wind speed, days of frost and hours of operation.
For this design those givens are:
Field Size: 25.27 acres
Vine Spacing: 8’ by 6’
Sprinkler Spacing: 48’ by 36’
21
GPMDU: 0.82
Low Temperature: 22 oF
Wind Speed: 1 mph
Consecutive Days of Frost: 4 days
Hours of Operation: 11 hours/night
Sprinkler Type: Nelson R33 Rotator
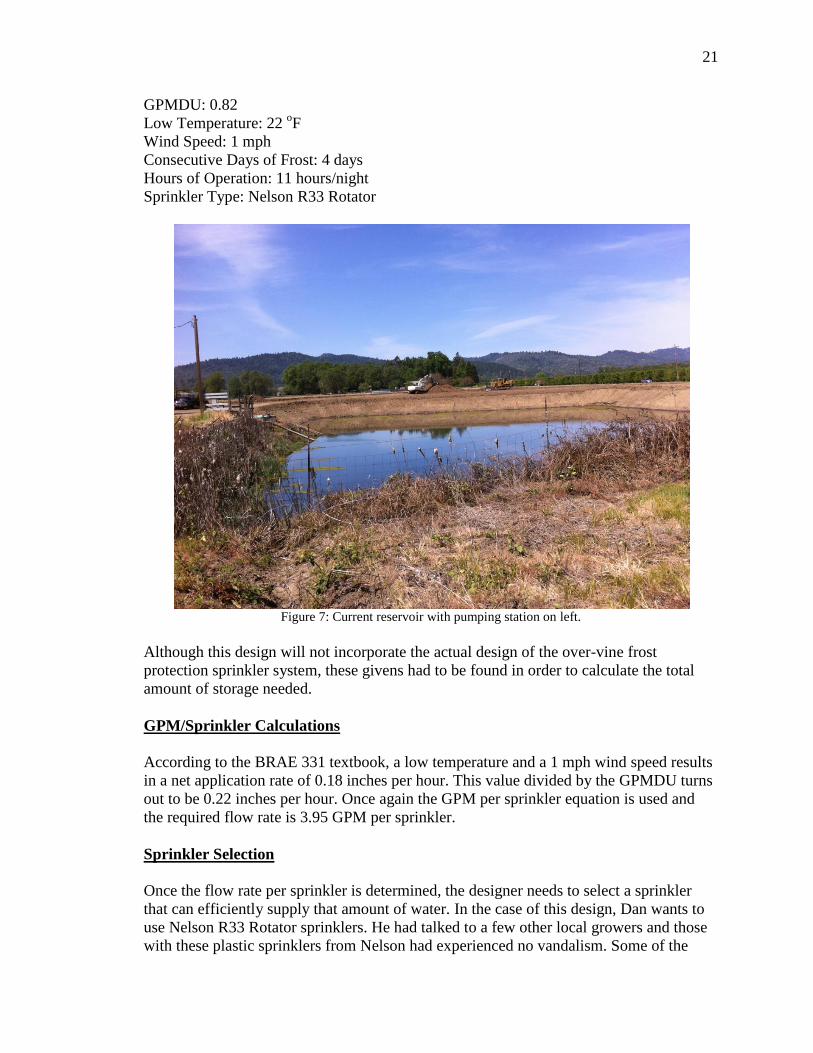
Figure 7: Current reservoir with pumping station on left.
Although this design will not incorporate the actual design of the over-vine frost
protection sprinkler system, these givens had to be found in order to calculate the total
amount of storage needed.
GPM/Sprinkler Calculations
According to the BRAE 331 textbook, a low temperature and a 1 mph wind speed results
in a net application rate of 0.18 inches per hour. This value divided by the GPMDU turns
out to be 0.22 inches per hour. Once again the GPM per sprinkler equation is used and
the required flow rate is 3.95 GPM per sprinkler.
Sprinkler Selection
Once the flow rate per sprinkler is determined, the designer needs to select a sprinkler
that can efficiently supply that amount of water. In the case of this design, Dan wants to
use Nelson R33 Rotator sprinklers. He had talked to a few other local growers and those
with these plastic sprinklers from Nelson had experienced no vandalism. Some of the
22
growers with the traditional metal sprinklers had a few areas cleaned out and probably
sold for scrap metal. The Nelson R33 Rotators are also very easy to disassemble and put
back together if one of their parts fails. Due to the required 0.22 inches per hour
application rate determined in the previous steps, the Gold 18 sprinkler with a nozzle size
of 9/64” was chosen. When used with the average K-Value the operating pressure turns
out to be 47.14 psi. Since the actual over the vine frost protection system will not be
designed in this project, this value is somewhat irrelevant for the design. Although the
operating pressure is not used, it is interesting to see the much higher pressures that the
sprinkler systems work at compared to drip irrigation.
GPM/Acre Determination
This was a fairly easy calculation to go through with. Since the flow rate per sprinkler
was defined above the only thing left was to find the number of sprinklers per acre and
multiply them together. It turns out that there are approximately 25.2 sprinklers per acre
resulting in 99.6 GPM per acre.
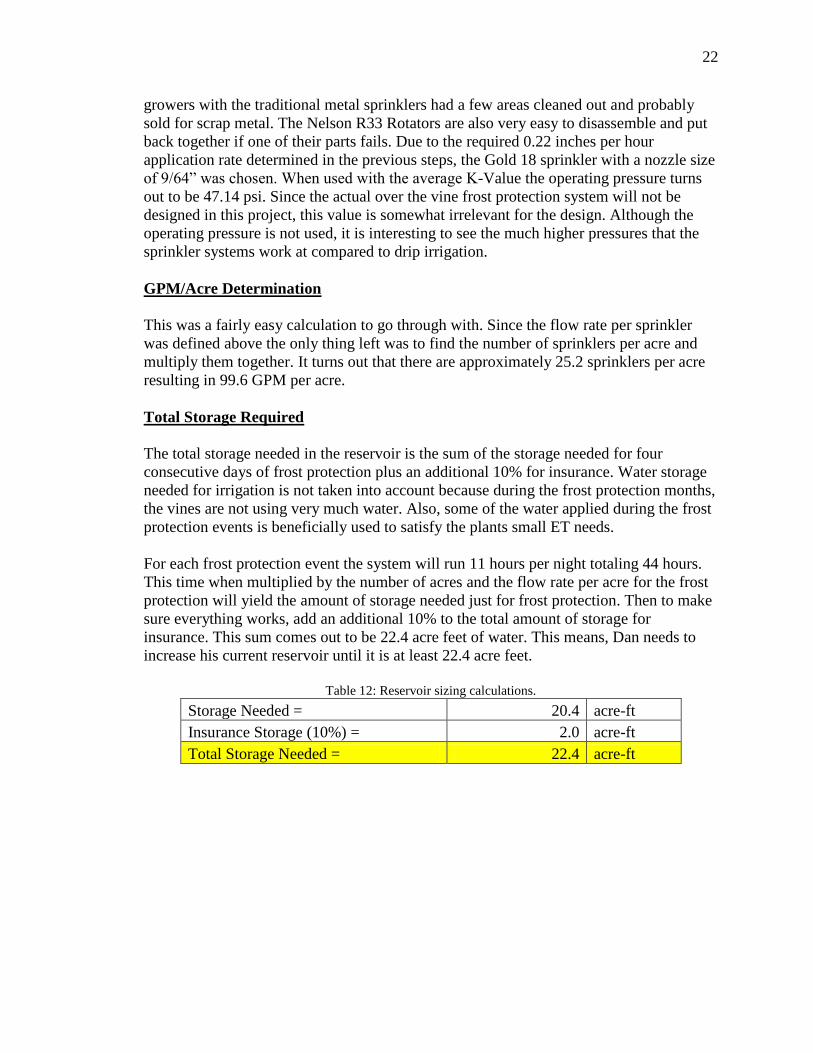
Total Storage Required
The total storage needed in the reservoir is the sum of the storage needed for four
consecutive days of frost protection plus an additional 10% for insurance. Water storage
needed for irrigation is not taken into account because during the frost protection months,
the vines are not using very much water. Also, some of the water applied during the frost
protection events is beneficially used to satisfy the plants small ET needs.
For each frost protection event the system will run 11 hours per night totaling 44 hours.
This time when multiplied by the number of acres and the flow rate per acre for the frost
protection will yield the amount of storage needed just for frost protection. Then to make
sure everything works, add an additional 10% to the total amount of storage for
insurance. This sum comes out to be 22.4 acre feet of water. This means, Dan needs to
increase his current reservoir until it is at least 22.4 acre feet.
Table 12: Reservoir sizing calculations.
Storage Needed = 20.4 acre-ft
Insurance Storage (10%) = 2.0 acre-ft
Total Storage Needed = 22.4 acre-ft
23
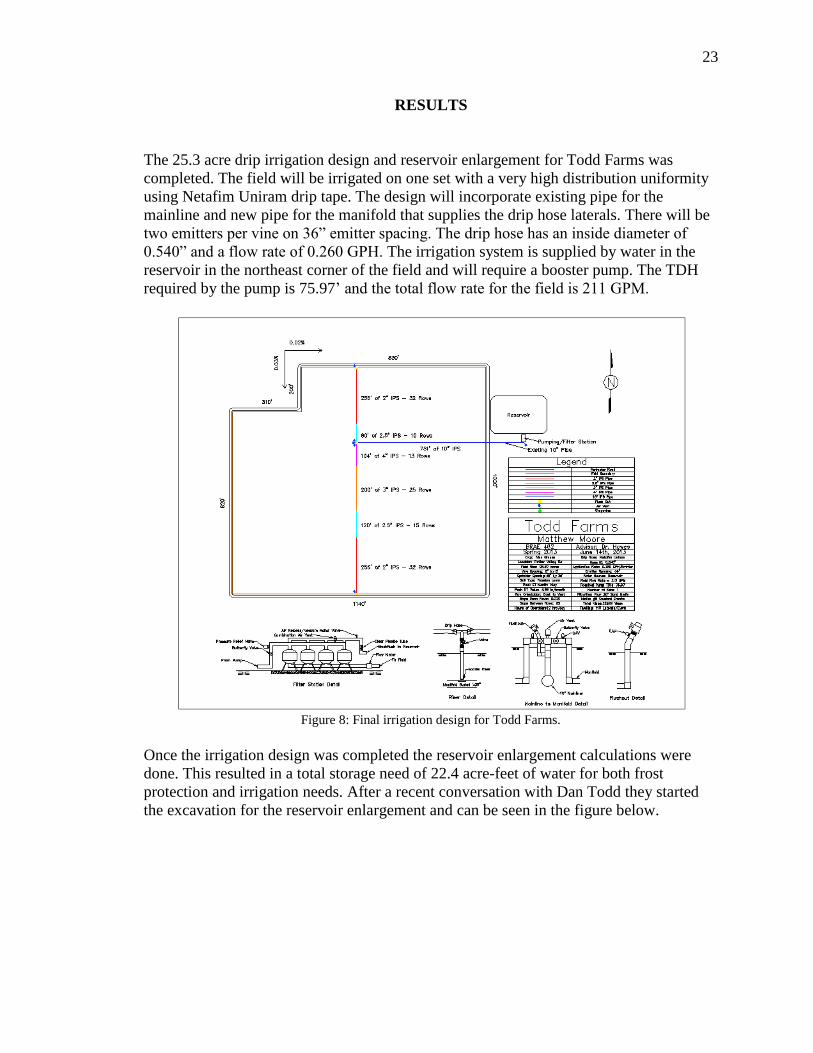
RESULTS
The 25.3 acre drip irrigation design and reservoir enlargement for Todd Farms was
completed. The field will be irrigated on one set with a very high distribution uniformity
using Netafim Uniram drip tape. The design will incorporate existing pipe for the
mainline and new pipe for the manifold that supplies the drip hose laterals. There will be
two emitters per vine on 36” emitter spacing. The drip hose has an inside diameter of
0.540” and a flow rate of 0.260 GPH. The irrigation system is supplied by water in the
reservoir in the northeast corner of the field and will require a booster pump. The TDH
required by the pump is 75.97’ and the total flow rate for the field is 211 GPM.
Figure 8: Final irrigation design for Todd Farms.
Once the irrigation design was completed the reservoir enlargement calculations were
done. This resulted in a total storage need of 22.4 acre-feet of water for both frost
protection and irrigation needs. After a recent conversation with Dan Todd they started
the excavation for the reservoir enlargement and can be seen in the figure below.
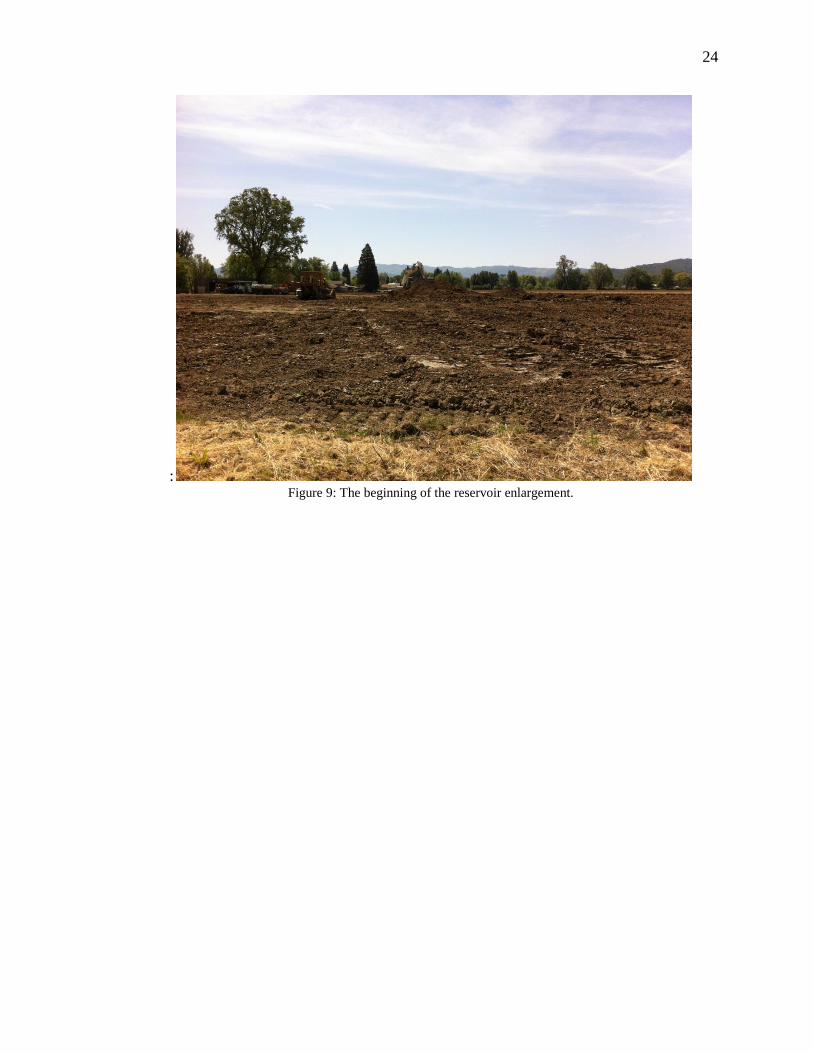
24
: Figure 9: The beginning of the reservoir enlargement.
25
DISCUSSION
The most difficult part of the design was to design the manifold that supplied the drip
hose laterals. This was due to the variation in pipe sizing that occurred along the manifold
and the small changes in elevation. The reason the pipe sizes changed along the manifold
was because as the manifold got longer, less flow was traveling through the pipe. A
designer could simply use one large pipe size for the whole manifold but that would
affect the DU of the system and cost the grower a lot more money to install. This also
took some finesse by the designer to know when to change to a smaller or larger diameter
pipe; thankfully the experience from BRAE 414 really helped out.
Although the reservoir enlargement was accurately estimated, the values used to come up
with the total storage needed should not be final. The actual designer that completes the
over vine sprinkler system should also do an analysis on how much water is needed for
the actual design that will be protecting the crop. This frost protection design will also
use some of the same segments of pipe which will increase the size of pipe required.
This design, like all other irrigation systems, was designed specifically for the plot of
land in Potter Valley, Ca. Unfortunately, this is the only place that can utilize it and still
allow it to work properly. Also, every component of the design acts as one smaller part of
the larger picture. This means that if only bits and pieces of the design are utilized, the
performance would greatly decrease.
In the past Dan Todd has only surface irrigated his pear orchards which cost barely
anything at all to run. All surface irrigation is gravity fed using dirt or concrete lined
ditches to bring the water to the head of the field. Dan doesn’t have a tailwater recovery
system which can collect and recirculate water more efficiently. This drip design for his
vines is a permanent irrigation system and could lead to more up to date systems in the
future. This could eliminate some of the labor involved with surface irrigation along with
some of the other costs. Although the existing surface irrigation practices are working for
Dan, the benefits of switching to drip or microspray would be worth it, especially
considering the age of his systems.
26
RECOMMENDATIONS
If any changes were to happen to this design it would probably be focused on the hours of
operation. The only constraint on that matter was to not operate on peak usage hours
which are from noon to six, Monday through Friday. If Dan didn’t want to irrigate every
day for 12 hours then he could run the system for any combination of hours per day as
long as the minimum hours per week were met. If he drastically wanted to change the
hours of operation to something was less, a new drip hose could be used. The new drip
hose could have a larger inside diameter allowing more flow and would need emitters
with a higher flow rate. This may be something Dan would want to look into because
having to irrigate 84 hours per week is a huge time commitment.
Another issue that could come up would be with the filtration system. After talking to
Steve Shepard, the local irrigation designer, he highly recommends using disc or screen
filters instead of sand media tanks. This is because disc filters are cheaper and have a
much smaller footprint on the land. An easier to maintain filter is more advantageous to
the grower because it eliminates the possibility of negligence. Negligence of sand media
tanks can cause a decline in performance of the whole system which would cost the
grower more money and make the system run less efficiently.
Also due to recent flow measurement laws, Dan would need to install and use a flow
meter for his vineyard. This however was not covered in the design but would be easy for
him to do on his own; depending on how much Todd Farms wanted to pay there is a
variety of options available. Some of those options are magnetic meters, propeller meters,
etc. with the best option being to put in a McCrometer Mag Meter. The McCrometer
Mag Meter also happens to be the most expensive option. This flow meter would be
placed after the pump discharge but before the filtration station.
As for the reservoir enlargement, the 22.4 acre feet presented in the calculations and
analysis earlier in the report is only a minimum value. Just to be safe it is recommended
to increase the reservoir storage capacity to 25 acre feet or more. This may cost more
initially but a farmer has never complained about having too much water at their disposal.
Also, if silt or other solids collect in the bottom of the reservoir, storage capacity will
slowly be decreased.

27
REFERENCES
Allen, R.G., L.S. Periera, D. Raes, and M. Smith. 1998. Crop Evapotranspiration –
Guidelines for Computing Crop Water Requirements. FAO Irrigation and Drainage
Paper 56. Food and Agriculture Organization of the United Nations. Rome.
Burt, C.M. 1995. The Surface Irrigation Manual. Waterman Industries Inc.
Burt, C.M. 2011. Basic Hydraulics. Cal Poly Irrigation Training and Research Center,
San Luis Obispo, Ca.
Burt, C.M. 2012a. Ag-Irrigation Management. Cal Poly Irrigation Training and
Research Center, San Luis Obispo, Ca.
Burt, C.M. 2012b. Irrigation Design Manual. Cal Poly Irrigation Training and Research
Center, San Luis Obispo, Ca.
Burt, C.M., A.J. Clemens, R. Bliesner, J.L. Merriam and L. Hardy. 1999. Selection of
Irrigation Methods for Agriculture. On-Farm Irrigation Committee report. Water
Resources Division. American Society of Civil Engineers.
Burt, C.M. and S.W. Styles. 2011. Drip and Micro Irrigation Design and Management
for Trees, Vines, and Field Crops: Practice plus Theory. Cal Poly Irrigation Training and
Research Center, San Luis Obispo, Ca.
Kurtural, S.K., 2007. Vineyard Design. University of Kentucky. University of
Kentucky College of Agriculture Cooperative Extension. Lexington, Ky. HortFact 3103
Minton, V., H. Howerton and B Cole. 2011. Vineyard Frost Protection a Guide for
Northern Coastal California. Sotoyome RCD, Santa Rosa, Ca and USDA-NRCS,
Petaluma, Ca.

28
APPENDIX A
HOW PROJECT MEETS REQUIREMENTS FOR THE BRAE MAJOR
29
Major Design Experience
The senior project is required to include major design experience garnered from classes
while at Cal Poly. Design is the process of creating a system or component used to meet a
set of given requirements.
Establishment of Objectives and Criteria
The objective of this project is to supply the grower with an efficient drip irrigation
system that will work with minimal maintenance. Also, the storage needs for frost
protection will be analyzed and a reservoir enlargement will be recommended.
Synthesis and Analysis
The project included an analysis of the following: soils represented in the field, hydraulic
calculations and total volume required for four days of frost protection. This caused
different trials or variations until the final and correct design was found.
Construction, Testing and Evaluation
The project will have no construction or testing involved. However, the irrigation system
will be evaluated using calculations only.
Incorporation of Applicable Engineering Standards
The project will utilize and abide by Potter Valley Irrigation District, ASABE and ITRC
standards.
Capstone Project Experience
The project will incorporate many concepts introduced in previous engineering classes
including: BRAE 133 Engineering Graphics, BRAE 151 AutoCAD, BRAE 236
Principles of Irrigation, BRAE 312 Hydraulics, BRAE 331 Irrigation Theory, BRAE 414
Irrigation Engineering, SS 121 Introductory Soil Science and ENGL 149 Technical
Writing.
Design Parameters and Constraints
The project will address a significant number of categories and constraints listed below.
Physical
The irrigation design must be sufficient for the vineyard in Potter Valley, Ca and the
reservoir needs to be large enough o handle crop needs and frost protection.
30
Economic
N/A
Environmental
The irrigation design will minimize potentially harmful runoff and conserve as much
water as possible through efficiency.
Ergonomics
N/A
Manufacturability
This design is specifically for Todd Farms in Potter Valley, Ca.
Health and Safety
Proper filtration will be utilized to distribute clean water to the crop and proper safety
equipment will be used to protect the workers.
Ethical
N/A
Political
N/A
Productivity
The irrigation design will need to be productive and take care of the crops needs. The
reservoir needs to be large enough to ensure proper frost protection.

31
APPENDIX B
Irrigation Design Calculations
1
2
3
4
5
6
7
8
9
10
11
12
13
14
15
16
17
18
19
20
21
22
23
24
25
26
27
28
29
30
31
32
33
34
35
36
37
38
39
40
41
42
43
44
45
46
47
48
49
50
51
52
53
54
55
56
57
58
59
60
61
62
63
64
65
66
67
68
69
70
71
72
73
74
75
76
77
78
79
80
81
82
83
84
85
86
87
88
89
90
A B C D E F G H I J K L
Matthew Moore
BRAE 462
Senior Project
Spring 2013
Given:
1100800 ft2
25.27 acres
1020 ft
1140 ft
8 ft
6 ft
6.6 in/ft
4 ft
4.95 in/month
0.16 in/day
0.02%
0.03%
0.92
18 hrs/day
7 days/week
Design:
Peak ET Rate = 4.95 in/month
Peak ET Rate = 0.16 in/day
0.18 in/day
in/day = 0.18 in/day
Vine Spacing = 8 ft
6 ft
Hours of Operation = 18 hrs/day
7 days/week
GPMnet/Vine = 0.0049 GPM/Vine
GPHnet/Vine = 0.2918 GPH/Vine
Design DU = 0.92
Future DU = 0.86
GPHgross/Vine = 0.340 GPH/Vine
3) Estimate number of emitters/vine:
Soil Type = Russian Loam
(ft) (m)
Loam 3.75 1.15
Wetted Area = 2 ft
Slope Between Rows (North to South) =
Assume 10% increase with drip irrigation
Therefore, Peak ET Rate =
Additional Lateral Movement for DripSoil Type
GPHgross/Vine = (GPHnet/Emitter)/(Future DU)
GPMnet/Vine = (inches/day * spacing)/(96.3 * hrs)
Crop =
Location =
Field Size:
Field Length (N/S) =
Field Length (E/W) =
Drip Hose =
Wine Grapes
East to West
Peak ETc Month = May
Spacing:
Potter Valley, Ca
Field Size:
Netafim Uniram
Peak ETc =
Row Orientation =
Spacing Between Vines in a Row =
Spacing Between Rows =
Russian LoamSoil Type =
Soil AWHC =
Root Zone Depth =
2) Find gross application rate:
Max Hours of Operation =
1) Determine peak ET rate:
Peak ETc =
Slope Down Rows (West to East) =
Desired System DU =
91
92
93
94
95
96
97
98
99
100
101
102
103
104
105
106
107
108
109
110
111
112
113
114
115
116
117
118
119
120
121
122
123
124
125
126
127
128
129
130
131
132
133
134
135
136
137
138
139
140
141
142
143
144
145
146
147
148
149
150
151
152
153
154
155
156
157
158
159
160
161
162
163
164
165
166
167
168
169
170
171
172
173
174
175
176
177
178
179
180
181
A B C D E F G H I J K L
Total Wetted Area Diameter = 7.5 ft
Wetted Area = 44.2 ft2
Wetted Area % = 92%
Emitters/Vine = 2
Drip Hose =
Regulating Pressure = 7 to 58 PSI
Minimum Pressure = 7 PSI
Filtration Requirement = 120 mesh
ID Options
(in)
0.540
0.570
0.620
0.690
(GPH) Constant (K) Exponent Kd 540 Kd 570 Kd 620 Kd 690
0.26 0.26 0 1.60 1.20 0.85 0.40
0.42 0.42 0 1.60 1.20 0.85 0.40
0.53 0.53 0 1.60 1.20 0.85 0.40
0.61 0.61 0 1.60 1.20 0.85 0.40
0.92 0.92 0 1.60 1.20 0.85 0.40
1.00 1.00 0 1.60 1.20 0.85 0.40
# Sets GPH/Emitter Possible?
1 0.340 Yes
2 0.679 Yes
3 1.019 No
4 1.358 No
# Sets = 1 set
GPH/Emitter = 0.260 GPH/Emitter
GPH/Emitter = 0.260 GPH/Emitter
GPM/Emitter = 0.004 GPM/Emitter
Emitters/Vine = 2
Vine Spacing = 8 ft
6 ft
in/day = 0.18 in/day
Corrected Hrs/day = 11.76 hrs/day
Corrected Hrs/week = 82.29 hrs/week
5) Summary:
Number of Sets = 1 set
GPH/Emitter = 0.260 GPH
Avg Emitter Pressure = 13 PSI
GPM/100 ft = 0.0722 GPM/100 ft
Nominal Flow = 0.260 GPH
Nominal GPM/100 ft = 0.0722 GPM/100 ft
Emitters/Vine = 2
Vine Spacing = 6 ft
Emitter Spacing = 3 ft
Emitter Spacing = 36 in
Additional % for Snaking = 2.5%
Manufacturing CV = 0.025
Total Length of Field = 1140 ft
Water Temperature = 70oF
Slope (W to E) = 0.02%
Discharge Exponent = 0
LengthUphill (ft) LengthDownhill (ft)
0.540 559 581 0.97 2.0 1.65 14.6
0.570 559 581 0.97 1.5 1.65 14.2
0.620 559 581 0.97 1.0 1.65 13.8
0.690 559 581 0.97 0.6 1.65 13.5
Notes:
Netafim Uniram is a pressure compensating (PC) drip
line.
Dripper Options Data
* All of dripper and hose data was taken off of netafimusa.com on the
Netafim Uniram technical page.
4) Select number of sets:
Netafim Uniram
Therefore, one emitter per vine will work but due to manufacturing constraints two emitters at 36" spacing will need to be used.
Hose ID (in)Manifold Placement
DUlq Max Δ PSI Inlet GPM
** Since PC emitters, any pressure above 7 PSI will produce the desired GPH.
Desired Wetted Area = 60% of Spacing
Therefore, since none of the set options results in a GPH close to a manufacturer GPH it doesn't matter which to choose from.
Note: Since one set and two 0.260 GPH/Emitter is being used, the hours of operation will need to be corrected.
GPMgross/Vine = [(inches/day * spacing)/(96.3 * hrs)]/(DU)
By manipulating the above equation,
Min Operating PSI **
7
7
7
7
6) Inlet pressure calculations:
Inlet PSI
182
183
184
185
186
187
188
189
190
191
192
193
194
195
196
197
198
199
200
201
202
203
204
205
206
207
208
209
210
211
212
213
214
215
216
217
218
219
220
221
222
223
224
225
226
227
228
229
230
231
232
233
234
235
236
237
238
239
240
241
242
243
244
245
246
247
248
249
250
251
252
253
254
255
256
257
258
259
260
261
262
263
264
265
266
267
268
269
270
271
272
A B C D E F G H I J K L
Hose ID = 0.540 in
Emitter Spacing = 36 in
Longest Hose Length = 581 ft
GPH/Emitter = 0.260 GPH
Desired End Line Pressure = 13 PSI
Pressure Loss from Chart = 2.5 PSI
Required Inlet Pressure = 15.5 PSI
14.6 PSI
15.5 PSI
15.5 PSI
Design DU = 0.92
Hose DU = 0.97
Average Emitter Pressure = 13.0 PSI
Allowable Pmin = 8.5 PSI
Allowable ∆P =
Total Field Allowable ∆P = 9.1 PSI
Pressure Change Hose = 5.0 PSI
Manifold Allowable Change = 4.1 PSI
GPH/Emitter = 0.260 GPH
GPM/Emitter = 0.0043 GPM
Length of Field (E-W) = 1140 ft
Spacing Between Vines = 6
Hose LengthUphill = 559 ft
Hose LengthDownhill = 581 ft
Length of Field (N-S) = 1020 ft
Spacing Between Rows = 8 ft
Total # of Rows = 128.5 rows
Manifold North of Mainline = 340 ft
Manifold South of Mainline = 680 ft
# Rows to the North = 42.5 rows
# Rows to the South = 86 rows
Corrected # of Rows to North = 42
Individual Hose Inlet GPM = 1.65 GPM
Total Field Flow Rate = 211.2 GPM
Manifold Sizing Inputs:
Nominal Dia (in) Actual ID (in) PSI Rating C-Value Type
1.5 1.720 200 145 IPS
2 2.193 160 146 IPS
2.5 2.655 160 147 IPS
3 3.284 125 148 IPS
4 4.280 100 149 IPS
5 5.291 100 150 IPS
6 6.301 100 150 IPS
8 8.205 100 150 IPS
10 10.226 100 150 IPS
Spacing Between Rows = 8 ft
Slope Between Rows = 0.03%
Individual Hose Inlet GPM = 1.65 GPM
Minimum Hose Inlet Pressure = 15.5 PSI
Note: The 43.5 rows North of the mainline is not possible so round down to 43 rows. This just means an extra four feet will be on the
North border of the field.
2 * (Pavg - Pmin)
8) Manifold sizing:
7) Determine the allowable pressure change along the manifold:
* This data was taken from the ITRC PLACEM4 DosBox Program in the Basic Hydraulics folder.
Therefore, use the larger of the two scenarios in order to make sure you have enough pressure.
Minimum Inlet Pressure on Last Drip Hose =
Note: Therefore, choose the smallest diameter drip hose because it still maintains the same DU and the pressure increase is not
significant.
Now, check the pressure loss data with the data provided from the Netafim website:
Now compare the two different required inlet pressures:
From ITRC PLACEM4 DosBox Program =
From Netafim Uniram Technical Data =
273
274
275
276
277
278
279
280
281
282
283
284
285
286
287
288
289
290
291
292
293
294
295
296
297
298
299
300
301
302
303
304
305
306
307
308
309
310
311
312
313
314
315
316
317
318
319
320
321
322
323
324
325
326
327
328
329
330
331
332
333
334
335
336
337
338
339
340
341
342
343
344
345
346
347
348
349
350
351
352
353
354
355
356
357
358
359
360
361
362
363
364
A B C D E F G H I J K L
D/S Pt Point PSI Segment GPM Length (ft) ID (in) Hf (PSI) ∆Elev (PSI) ∆P (PSI) Velocity (ft/sec)
1 15.50 1.650 8.00 2.193 0.00020 0.001 -0.00084 0.1402
2 15.50 3.300 8.00 2.193 0.00072 0.001 -0.00032 0.2803
3 15.50 4.950 8.00 2.193 0.00152 0.001 0.00048 0.4205
4 15.50 6.600 8.00 2.193 0.00258 0.001 0.00154 0.5606
5 15.50 8.250 8.00 2.193 0.00390 0.001 0.00286 0.7008
6 15.50 9.900 8.00 2.193 0.00547 0.001 0.00443 0.8410
7 15.51 11.550 8.00 2.193 0.00727 0.001 0.00623 0.9811
8 15.51 13.200 8.00 2.193 0.00931 0.001 0.00827 1.1213
9 15.52 14.850 8.00 2.193 0.01157 0.001 0.01053 1.2614
10 15.53 16.500 8.00 2.193 0.01406 0.001 0.01302 1.4016
11 15.55 18.150 8.00 2.193 0.01678 0.001 0.01574 1.5418
12 15.56 19.800 8.00 2.193 0.01971 0.001 0.01867 1.6819
13 15.58 21.450 8.00 2.193 0.02285 0.001 0.02181 1.8221
14 15.60 23.100 8.00 2.193 0.02621 0.001 0.02517 1.9623
15 15.63 24.750 8.00 2.193 0.02978 0.001 0.02874 2.1024
16 15.66 26.400 8.00 2.193 0.03355 0.001 0.03251 2.2426
17 15.69 28.050 8.00 2.193 0.03753 0.001 0.03650 2.3827
18 15.73 29.700 8.00 2.193 0.04172 0.001 0.04068 2.5229
19 15.77 31.350 8.00 2.193 0.04611 0.001 0.04507 2.6631
20 15.81 33.000 8.00 2.193 0.05070 0.001 0.04966 2.8032
21 15.86 34.650 8.00 2.193 0.05549 0.001 0.05445 2.9434
22 15.92 36.300 8.00 2.193 0.06048 0.001 0.05944 3.0835
23 15.97 37.950 8.00 2.193 0.06566 0.001 0.06462 3.2237
24 16.04 39.600 8.00 2.193 0.07104 0.001 0.07000 3.3639
25 16.11 41.250 8.00 2.193 0.07661 0.001 0.07557 3.5040
26 16.18 42.900 8.00 2.193 0.08238 0.001 0.08134 3.6442
27 16.27 44.550 8.00 2.193 0.08833 0.001 0.08729 3.7843
28 16.35 46.200 8.00 2.193 0.09448 0.001 0.09344 3.9245
29 16.45 47.850 8.00 2.193 0.10082 0.001 0.09978 4.0647
30 16.55 49.500 8.00 2.193 0.10734 0.001 0.10630 4.2048
31 16.65 51.150 8.00 2.193 0.11406 0.001 0.11302 4.3450
32 16.77 52.800 8.00 2.193 0.12096 0.001 0.11992 4.4851
33 16.89 54.450 8.00 2.655 0.04983 0.001 0.04880 3.1556
34 16.93 56.100 8.00 2.655 0.05266 0.001 0.05163 3.2513
35 16.99 57.750 8.00 2.655 0.05557 0.001 0.05453 3.3469
36 17.04 59.400 8.00 2.655 0.05854 0.001 0.05750 3.4425
37 17.10 61.050 8.00 2.655 0.06158 0.001 0.06054 3.5382
38 17.16 62.700 8.00 2.655 0.06470 0.001 0.06366 3.6338
39 17.22 64.350 8.00 2.655 0.06788 0.001 0.06684 3.7294
40 17.29 66.000 8.00 2.655 0.07114 0.001 0.07010 3.8250
41 17.36 67.650 8.00 2.655 0.07446 0.001 0.07342 3.9207
42 17.43 69.300 8.00 2.655 0.07786 0.001 0.07682 4.0163
43 17.51 70.950 8.00 2.655 0.08132 0.001 0.08028 4.1119
44 17.59 72.600 8.00 2.655 0.08485 0.001 0.08381 4.2075
45 17.67 74.250 8.00 2.655 0.08846 0.001 0.08742 4.3032
46 17.76 75.900 8.00 2.655 0.09213 0.001 0.09109 4.3988
47 17.85 77.550 8.00 2.655 0.09587 0.001 0.09483 4.4944
48 17.95 79.200 8.00 3.284 0.03495 0.001 0.03391 3.0001
49 17.98 80.850 8.00 3.284 0.03631 0.001 0.03527 3.0626
50 18.02 82.500 8.00 3.284 0.03769 0.001 0.03665 3.1251
51 18.05 84.150 8.00 3.284 0.03910 0.001 0.03806 3.1876
52 18.09 85.800 8.00 3.284 0.04053 0.001 0.03949 3.2501
53 18.13 87.450 8.00 3.284 0.04198 0.001 0.04094 3.3126
54 18.17 89.100 8.00 3.284 0.04346 0.001 0.04242 3.3751
55 18.21 90.750 8.00 3.284 0.04496 0.001 0.04392 3.4376
56 18.26 92.400 8.00 3.284 0.04648 0.001 0.04544 3.5001
57 18.30 94.050 8.00 3.284 0.04803 0.001 0.04699 3.5626
58 18.35 95.700 8.00 3.284 0.04960 0.001 0.04856 3.6251
59 18.40 97.350 8.00 3.284 0.05119 0.001 0.05016 3.6876
60 18.45 99.000 8.00 3.284 0.05281 0.001 0.05177 3.7502
61 18.50 100.650 8.00 3.284 0.05445 0.001 0.05341 3.8127
62 18.55 102.300 8.00 3.284 0.05611 0.001 0.05507 3.8752
63 18.61 103.950 8.00 3.284 0.05780 0.001 0.05676 3.9377
64 18.67 105.600 8.00 3.284 0.05951 0.001 0.05847 4.0002
65 18.72 107.250 8.00 3.284 0.06124 0.001 0.06020 4.0627
66 18.78 108.900 8.00 3.284 0.06299 0.001 0.06196 4.1252
67 18.85 110.550 8.00 3.284 0.06477 0.001 0.06373 4.1877
68 18.91 112.200 8.00 3.284 0.06657 0.001 0.06553 4.2502
69 18.98 113.850 8.00 3.284 0.06839 0.001 0.06735 4.3127
70 19.04 115.500 8.00 3.284 0.07024 0.001 0.06920 4.3752
71 19.11 117.150 8.00 3.284 0.07211 0.001 0.07107 4.4377
72 19.18 118.800 8.00 3.284 0.07400 0.001 0.07296 4.5002
73 19.26 120.450 8.00 4.280 0.02064 0.001 0.01960 2.6862
74 19.28 122.100 8.00 4.280 0.02116 0.001 0.02012 2.7230
75 19.30 123.750 8.00 4.280 0.02169 0.001 0.02066 2.7598
76 19.32 125.400 8.00 4.280 0.02223 0.001 0.02119 2.7966
77 19.34 127.050 8.00 4.280 0.02278 0.001 0.02174 2.8334
78 19.36 128.700 8.00 4.280 0.02333 0.001 0.02229 2.8702
79 19.38 130.350 8.00 4.280 0.02388 0.001 0.02284 2.9070
80 19.40 132.000 8.00 4.280 0.02445 0.001 0.02341 2.9438
81 19.43 133.650 8.00 4.280 0.02501 0.001 0.02398 2.9806
82 19.45 135.300 8.00 4.280 0.02559 0.001 0.02455 3.0174
83 19.48 136.950 8.00 4.280 0.02617 0.001 0.02513 3.0542
84 19.50 138.600 8.00 4.280 0.02675 0.001 0.02572 3.0910
85 19.53 140.250 8.00 4.280 0.02735 0.001 0.02631 3.1278
Manifold Sizing for Line South of Mainline
Since the pressure regulating point (the pressure compensating emitters) is downstream of the manifold, the manifold will be designed using
economics. This means the velocity of the water in the pipe is important and should not exceed 4.5 ft/sec. If it gets near that, an increase in pipe
size will occur.
365
366
367
368
369
370
371
372
373
374
375
376
377
378
379
380
381
382
383
384
385
386
387
388
389
390
391
392
393
394
395
396
397
398
399
400
401
402
403
404
405
406
407
408
409
410
411
412
413
414
415
416
417
418
419
420
421
422
423
424
425
426
427
428
429
430
431
432
433
434
435
436
437
438
439
440
441
442
443
444
445
446
447
448
449
450
451
452
453
454
455
A B C D E F G H I J K L
86 19.55 141.900 8.00 4.280 0.02795 0.001 0.02691 3.1646
Inlet Pressure to Manifold = 19.55 PSI
Inlet Pressure to Last Hose = 15.5 PSI
∆P (PSI) = 4.05 PSI
D/S Pt Point PSI Segment GPM Length (ft) ID (in) Hf (PSI) ∆Elev (PSI) ∆P (PSI) Velocity (ft/sec)
1 15.50 1.650 8.00 2.193 0.00020 0.001 0.0012 0.1402
2 15.50 3.300 8.00 2.193 0.00072 0.001 0.0018 0.2803
3 15.50 4.950 8.00 2.193 0.00152 0.001 0.0026 0.4205
4 15.51 6.600 8.00 2.193 0.00258 0.001 0.0036 0.5606
5 15.51 8.250 8.00 2.193 0.00390 0.001 0.0049 0.7008
6 15.51 9.900 8.00 2.193 0.00547 0.001 0.0065 0.8410
7 15.52 11.550 8.00 2.193 0.00727 0.001 0.0083 0.9811
8 15.53 13.200 8.00 2.193 0.00931 0.001 0.0103 1.1213
9 15.54 14.850 8.00 2.193 0.01157 0.001 0.0126 1.2614
10 15.55 16.500 8.00 2.193 0.01406 0.001 0.0151 1.4016
11 15.57 18.150 8.00 2.193 0.01678 0.001 0.0178 1.5418
12 15.58 19.800 8.00 2.193 0.01971 0.001 0.0207 1.6819
13 15.61 21.450 8.00 2.193 0.02285 0.001 0.0239 1.8221
14 15.63 23.100 8.00 2.193 0.02621 0.001 0.0272 1.9623
15 15.66 24.750 8.00 2.193 0.02978 0.001 0.0308 2.1024
16 15.69 26.400 8.00 2.193 0.03355 0.001 0.0346 2.2426
17 15.72 28.050 8.00 2.193 0.03753 0.001 0.0386 2.3827
18 15.76 29.700 8.00 2.193 0.04172 0.001 0.0428 2.5229
19 15.80 31.350 8.00 2.193 0.04611 0.001 0.0471 2.6631
20 15.85 33.000 8.00 2.193 0.05070 0.001 0.0517 2.8032
21 15.90 34.650 8.00 2.193 0.05549 0.001 0.0565 2.9434
22 15.96 36.300 8.00 2.193 0.06048 0.001 0.0615 3.0835
23 16.02 37.950 8.00 2.193 0.06566 0.001 0.0667 3.2237
24 16.09 39.600 8.00 2.193 0.07104 0.001 0.0721 3.3639
25 16.16 41.250 8.00 2.193 0.07661 0.001 0.0776 3.5040
26 16.24 42.900 8.00 2.193 0.08238 0.001 0.0834 3.6442
27 16.32 44.550 8.00 2.193 0.08833 0.001 0.0894 3.7843
28 16.41 46.200 8.00 2.193 0.09448 0.001 0.0955 3.9245
29 16.51 47.850 8.00 2.193 0.10082 0.001 0.1019 4.0647
30 16.61 49.500 8.00 2.193 0.10734 0.001 0.1084 4.2048
31 16.72 51.150 8.00 2.193 0.11406 0.001 0.1151 4.3450
32 16.83 52.800 8.00 2.193 0.12096 0.001 0.1220 4.4851
33 16.95 54.450 8.00 2.655 0.04983 0.001 0.0509 3.1556
34 17.00 56.100 8.00 2.655 0.05266 0.001 0.0537 3.2513
35 17.06 57.750 8.00 2.655 0.05557 0.001 0.0566 3.3469
36 17.11 59.400 8.00 2.655 0.05854 0.001 0.0596 3.4425
37 17.17 61.050 8.00 2.655 0.06158 0.001 0.0626 3.5382
38 17.24 62.700 8.00 2.655 0.06470 0.001 0.0657 3.6338
39 17.30 64.350 8.00 2.655 0.06788 0.001 0.0689 3.7294
40 17.37 66.000 8.00 2.655 0.07114 0.001 0.0722 3.8250
41 17.44 67.650 8.00 2.655 0.07446 0.001 0.0755 3.9207
42 17.52 69.300 8.00 2.655 0.07786 0.001 0.0789 4.0163
Inlet Pressure to Manifold = 17.52 PSI
Inlet Pressure to Last Hose = 15.5 PSI
∆P (PSI) = 2.02 PSI
Flushing Velocity = 1.5 ft/sec
ID = 0.540 in
Inlet Flushing Q = 1.91 GPM
Inlet Pressure = 15.6 PSI
Q Exiting @ End of Lateral = 1.07 GPM
Max Pressure Difference = 15.5 PSI
Total Friction = 15.5 PSI
Field Flow Rate = 211.20 GPM
Max Manifold GPM = 141.90 GPM
Flushing Q for Field = 244.48 GPM
# of Laterals During Flushing = 110 laterals
= Assumed Critical Path
A - Pumping Station
B 90o Elbow
C - Tee Where Mainline Meets Manifold
Description
A to B
B to C
Distance Between (ft)
30
581
Manifold Sizing for Line North of Mainline
9) Flushing requirements:
From ITRC DosBox program SINGLE4 for flushing:
Note: Since the flushing flow rate for the field is larger than the flow rate for the irrigation needs, therefore don't flush all the drip hoses
at the same time.
10) Mainline sizing:
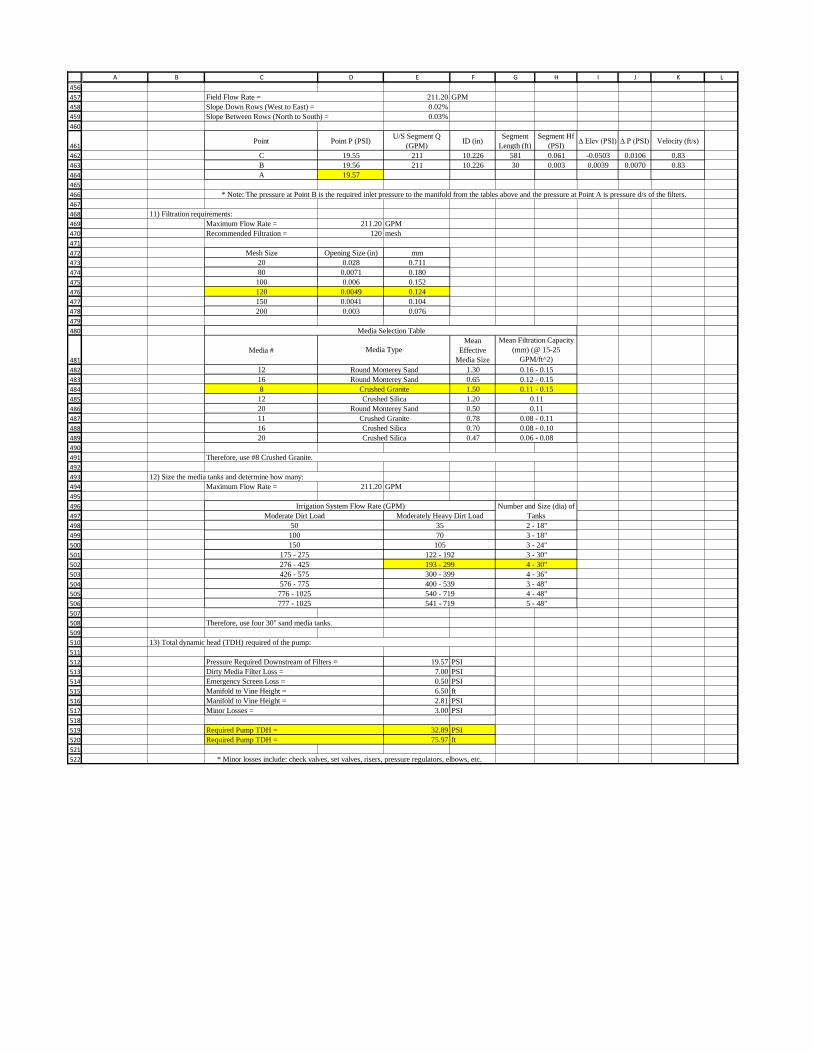
456
457
458
459
460
461
462
463
464
465
466
467
468
469
470
471
472
473
474
475
476
477
478
479
480
481
482
483
484
485
486
487
488
489
490
491
492
493
494
495
496
497
498
499
500
501
502
503
504
505
506
507
508
509
510
511
512
513
514
515
516
517
518
519
520
521
522
A B C D E F G H I J K L
211.20 GPM
0.02%
0.03%
Point Point P (PSI)U/S Segment Q
(GPM)ID (in)
Segment
Length (ft)
Segment Hf
(PSI)∆ Elev (PSI) ∆ P (PSI) Velocity (ft/s)
C 19.55 211 10.226 581 0.061 -0.0503 0.0106 0.83
B 19.56 211 10.226 30 0.003 0.0039 0.0070 0.83
A 19.57
Maximum Flow Rate = 211.20 GPM
Recommended Filtration = 120 mesh
Mesh Size Opening Size (in) mm
20 0.028 0.711
80 0.0071 0.180
100 0.006 0.152
120 0.0049 0.124
150 0.0041 0.104
200 0.003 0.076
Media #
Mean
Effective
Media Size
12 1.30
16 0.65
8 1.50
12 1.20
20 0.50
11 0.78
16 0.70
20 0.47
Maximum Flow Rate = 211.20 GPM
19.57 PSI
7.00 PSI
0.50 PSI
6.50 ft
2.81 PSI
3.00 PSI
32.89 PSI
75.97 ft
Therefore, use four 30" sand media tanks.
776 - 1025 540 - 719 4 - 48"
777 - 1025 541 - 719 5 - 48"
426 - 575 300 - 399 4 - 36"
576 - 775 400 - 539 3 - 48"
175 - 275 122 - 192 3 - 30"
276 - 425 193 - 299 4 - 30"
100 70 3 - 18"
150 105 3 - 24"
Irrigation System Flow Rate (GPM) Number and Size (dia) of
TanksModerate Dirt Load Moderately Heavy Dirt Load
50 35 2 - 18"
Crushed Silica 0.06 - 0.08
Media Selection Table
Therefore, use #8 Crushed Granite.
12) Size the media tanks and determine how many:
Round Monterey Sand 0.11
Crushed Granite 0.08 - 0.11
Crushed Silica 0.08 - 0.10
Round Monterey Sand 0.12 - 0.15
Crushed Granite 0.11 - 0.15
Crushed Silica 0.11
Media Type
Mean Filtration Capacity
(mm) (@ 15-25
GPM/ft^2)
Round Monterey Sand 0.16 - 0.15
* Minor losses include: check valves, set valves, risers, pressure regulators, elbows, etc.
Manifold to Vine Height =
Required Pump TDH =
13) Total dynamic head (TDH) required of the pump:
Pressure Required Downstream of Filters =
Dirty Media Filter Loss =
Emergency Screen Loss =
Minor Losses =
Manifold to Vine Height =
Required Pump TDH =
Slope Down Rows (West to East) =
Slope Between Rows (North to South) =
Field Flow Rate =
* Note: The pressure at Point B is the required inlet pressure to the manifold from the tables above and the pressure at Point A is pressure d/s of the filters.
11) Filtration requirements:

1
APPENDIX C
Reservoir Enlargement Calculations
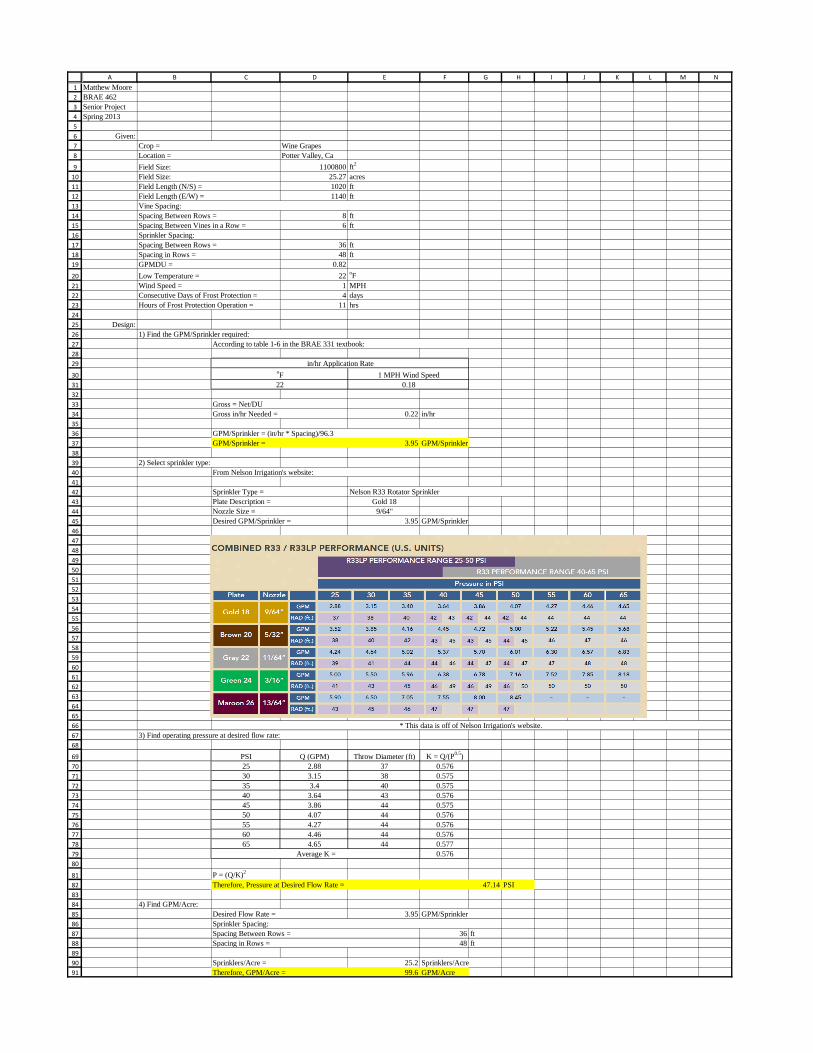
1
2
3
4
5
6
7
8
9
10
11
12
13
14
15
16
17
18
19
20
21
22
23
24
25
26
27
28
29
30
31
32
33
34
35
36
37
38
39
40
41
42
43
44
45
46
47
48
49
50
51
52
53
54
55
56
57
58
59
60
61
62
63
64
65
66
67
68
69
70
71
72
73
74
75
76
77
78
79
80
81
82
83
84
85
86
87
88
89
90
91
A B C D E F G H I J K L M N
Matthew Moore
BRAE 462
Senior Project
Spring 2013
Given:
Wine Grapes
Potter Valley, Ca
1100800 ft2
25.27 acres
1020 ft
1140 ft
8 ft
6 ft
36 ft
48 ft
0.82
22oF
1 MPH
4 days
11 hrs
Design:
0.22 in/hr
3.95 GPM/Sprinkler
Gold 18
9/64"
3.95 GPM/Sprinkler
PSI Q (GPM) Throw Diameter (ft) K = Q/(P0.5
)
25 2.88 37 0.576
30 3.15 38 0.575
35 3.4 40 0.575
40 3.64 43 0.576
45 3.86 44 0.575
50 4.07 44 0.576
55 4.27 44 0.576
60 4.46 44 0.576
65 4.65 44 0.577
0.576
P = (Q/K)2
47.14 PSI
4) Find GPM/Acre:
3.95
36 ft
48 ft
25.2
99.6 GPM/Acre
GPM/Sprinkler = (in/hr * Spacing)/96.3
Gross in/hr Needed =
22
oF
1) Find the GPM/Sprinkler required:
Gross = Net/DU
According to table 1-6 in the BRAE 331 textbook:
1 MPH Wind Speed
0.18
in/hr Application Rate
GPM/Sprinkler
Sprinkler Spacing:
GPM/Sprinkler =
* This data is off of Nelson Irrigation's website.
Therefore, Pressure at Desired Flow Rate =
Desired GPM/Sprinkler =
Nozzle Size =
Plate Description =
From Nelson Irrigation's website:
Sprinkler Type = Nelson R33 Rotator Sprinkler
2) Select sprinkler type:
3) Find operating pressure at desired flow rate:
Average K =
Sprinklers/Acre
Therefore, GPM/Acre =
Spacing in Rows =
Sprinklers/Acre =
Field Length (E/W) =
Desired Flow Rate =
Spacing Between Rows =
Crop =
Location =
Field Size:
Field Size:
Field Length (N/S) =
Hours of Frost Protection Operation =
Vine Spacing:
Spacing Between Rows =
Spacing Between Vines in a Row =
Sprinkler Spacing:
Spacing Between Rows =
Spacing in Rows =
GPMDU =
Low Temperature =
Wind Speed =
Consecutive Days of Frost Protection =

92
93
94
95
96
97
98
99
100
101
102
103
104
105
106
107
108
109
110
111
112
113
114
115
116
117
118
119
120
A B C D E F G H I J K L M N
4 days
11 hrs/night
44 hrs
99.6 GPM/Acre
44 hrs
25.27 acres
7.48 ft3
6646459 gallons
888505 ft3
20.4 acre-ft
20.4 acre-ft
2.0 acre-ft
22.4 acre-ft
Data from Grower:
Total Storage Needed =
Frost Protection Storage Needed =
1 Cubic Foot =
Frost Protection Storage Needed =
6) Find size of reservoir needed for frost protection:
Consecutive Days of Frost Protection =
Hours of Operation =
5) Find hours of operation and successive days of frost:
Therefore, Total Frost Protection Hours =
Frost Protection Storage Needed =
GPM/Acre =
Total Hours of Frost Protection =
Field Size =
This analysis doesn't include water storage needed for irrigation because the vines don't transpire that much during
frost season. When frost protection is occurring some of the water that is applied to the soil during the frost
Insurance Storage (10%) =
Note: This analysis has been done assuming water cannot be delivered to the reservoir during the four days of
consecutive frost protection. In conclusion, Todd Farms should enlarge their current reservoir to the size specified
above highlighted in yellow.
8) Find size of reservoir needed with frost protection and irrigation needs:
Storage Needed =

1
APPENDIX D
NRCS Soils Report
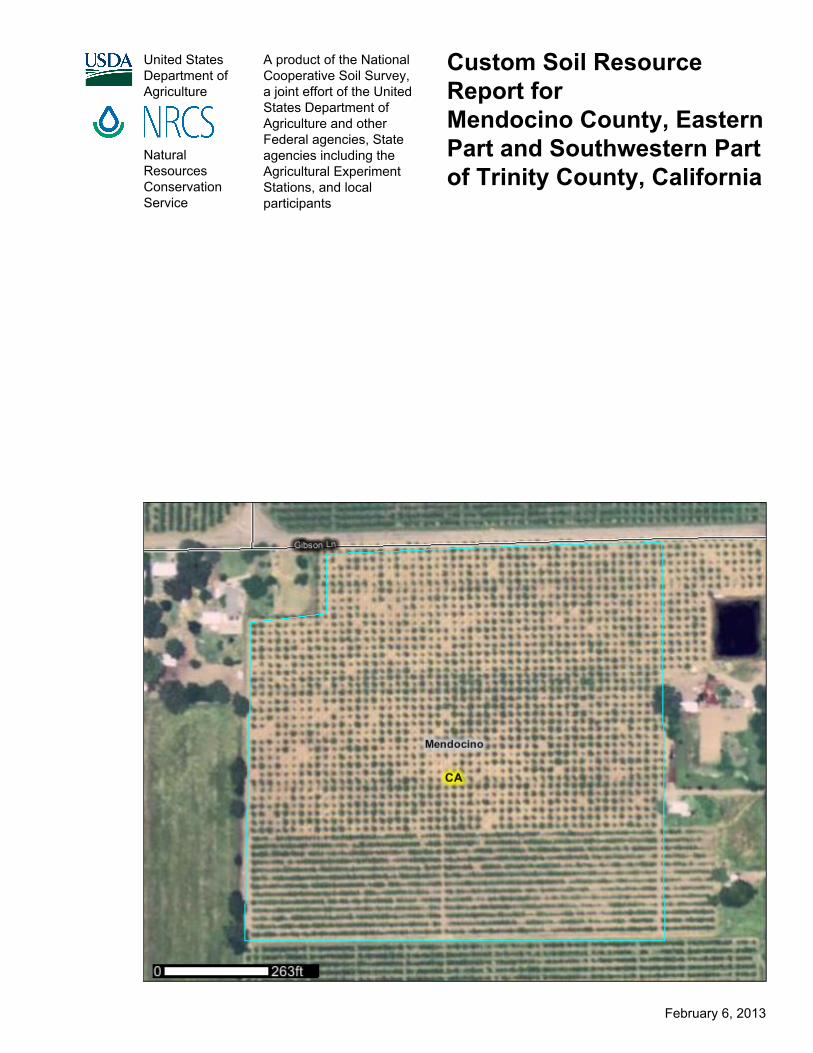
United StatesDepartment ofAgriculture
A product of the NationalCooperative Soil Survey,a joint effort of the UnitedStates Department ofAgriculture and otherFederal agencies, Stateagencies including theAgricultural ExperimentStations, and localparticipants
Custom Soil ResourceReport forMendocino County, EasternPart and Southwestern Partof Trinity County, California
NaturalResourcesConservationService
February 6, 2013
PrefaceSoil surveys contain information that affects land use planning in survey areas. Theyhighlight soil limitations that affect various land uses and provide information aboutthe properties of the soils in the survey areas. Soil surveys are designed for manydifferent users, including farmers, ranchers, foresters, agronomists, urban planners,community officials, engineers, developers, builders, and home buyers. Also,conservationists, teachers, students, and specialists in recreation, waste disposal,and pollution control can use the surveys to help them understand, protect, or enhancethe environment.
Various land use regulations of Federal, State, and local governments may imposespecial restrictions on land use or land treatment. Soil surveys identify soil propertiesthat are used in making various land use or land treatment decisions. The informationis intended to help the land users identify and reduce the effects of soil limitations onvarious land uses. The landowner or user is responsible for identifying and complyingwith existing laws and regulations.
Although soil survey information can be used for general farm, local, and wider areaplanning, onsite investigation is needed to supplement this information in some cases.Examples include soil quality assessments (http://soils.usda.gov/sqi/) and certainconservation and engineering applications. For more detailed information, contactyour local USDA Service Center (http://offices.sc.egov.usda.gov/locator/app?agency=nrcs) or your NRCS State Soil Scientist (http://soils.usda.gov/contact/state_offices/).
Great differences in soil properties can occur within short distances. Some soils areseasonally wet or subject to flooding. Some are too unstable to be used as afoundation for buildings or roads. Clayey or wet soils are poorly suited to use as septictank absorption fields. A high water table makes a soil poorly suited to basements orunderground installations.
The National Cooperative Soil Survey is a joint effort of the United States Departmentof Agriculture and other Federal agencies, State agencies including the AgriculturalExperiment Stations, and local agencies. The Natural Resources ConservationService (NRCS) has leadership for the Federal part of the National Cooperative SoilSurvey.
Information about soils is updated periodically. Updated information is availablethrough the NRCS Soil Data Mart Web site or the NRCS Web Soil Survey. The SoilData Mart is the data storage site for the official soil survey information.
The U.S. Department of Agriculture (USDA) prohibits discrimination in all its programsand activities on the basis of race, color, national origin, age, disability, and whereapplicable, sex, marital status, familial status, parental status, religion, sexualorientation, genetic information, political beliefs, reprisal, or because all or a part of anindividual's income is derived from any public assistance program. (Not all prohibitedbases apply to all programs.) Persons with disabilities who require alternative means
2

for communication of program information (Braille, large print, audiotape, etc.) shouldcontact USDA's TARGET Center at (202) 720-2600 (voice and TDD). To file acomplaint of discrimination, write to USDA, Director, Office of Civil Rights, 1400Independence Avenue, S.W., Washington, D.C. 20250-9410 or call (800) 795-3272(voice) or (202) 720-6382 (TDD). USDA is an equal opportunity provider andemployer.
3
ContentsPreface....................................................................................................................2How Soil Surveys Are Made..................................................................................5Soil Map..................................................................................................................7
Soil Map................................................................................................................8Legend..................................................................................................................9Map Unit Legend................................................................................................10Map Unit Descriptions........................................................................................10
Mendocino County, Eastern Part and Southwestern Part of Trinity County,California..................................................................................................12
115—Cole clay loam, 0 to 2 percent slopes................................................12128—Gielow sandy loam, 0 to 5 percent slopes.........................................13188—Russian loam, 0 to 2 percent slopes..................................................14190—Russian loam, gravelly substratum, 0 to 2 percent slopes................15
References............................................................................................................17Glossary................................................................................................................19
4
How Soil Surveys Are MadeSoil surveys are made to provide information about the soils and miscellaneous areasin a specific area. They include a description of the soils and miscellaneous areas andtheir location on the landscape and tables that show soil properties and limitationsaffecting various uses. Soil scientists observed the steepness, length, and shape ofthe slopes; the general pattern of drainage; the kinds of crops and native plants; andthe kinds of bedrock. They observed and described many soil profiles. A soil profile isthe sequence of natural layers, or horizons, in a soil. The profile extends from thesurface down into the unconsolidated material in which the soil formed or from thesurface down to bedrock. The unconsolidated material is devoid of roots and otherliving organisms and has not been changed by other biological activity.
Currently, soils are mapped according to the boundaries of major land resource areas(MLRAs). MLRAs are geographically associated land resource units that sharecommon characteristics related to physiography, geology, climate, water resources,soils, biological resources, and land uses (USDA, 2006). Soil survey areas typicallyconsist of parts of one or more MLRA.
The soils and miscellaneous areas in a survey area occur in an orderly pattern that isrelated to the geology, landforms, relief, climate, and natural vegetation of the area.Each kind of soil and miscellaneous area is associated with a particular kind oflandform or with a segment of the landform. By observing the soils and miscellaneousareas in the survey area and relating their position to specific segments of thelandform, a soil scientist develops a concept, or model, of how they were formed. Thus,during mapping, this model enables the soil scientist to predict with a considerabledegree of accuracy the kind of soil or miscellaneous area at a specific location on thelandscape.
Commonly, individual soils on the landscape merge into one another as theircharacteristics gradually change. To construct an accurate soil map, however, soilscientists must determine the boundaries between the soils. They can observe onlya limited number of soil profiles. Nevertheless, these observations, supplemented byan understanding of the soil-vegetation-landscape relationship, are sufficient to verifypredictions of the kinds of soil in an area and to determine the boundaries.
Soil scientists recorded the characteristics of the soil profiles that they studied. Theynoted soil color, texture, size and shape of soil aggregates, kind and amount of rockfragments, distribution of plant roots, reaction, and other features that enable them toidentify soils. After describing the soils in the survey area and determining theirproperties, the soil scientists assigned the soils to taxonomic classes (units).Taxonomic classes are concepts. Each taxonomic class has a set of soilcharacteristics with precisely defined limits. The classes are used as a basis forcomparison to classify soils systematically. Soil taxonomy, the system of taxonomicclassification used in the United States, is based mainly on the kind and character ofsoil properties and the arrangement of horizons within the profile. After the soilscientists classified and named the soils in the survey area, they compared the
5
individual soils with similar soils in the same taxonomic class in other areas so thatthey could confirm data and assemble additional data based on experience andresearch.
The objective of soil mapping is not to delineate pure map unit components; theobjective is to separate the landscape into landforms or landform segments that havesimilar use and management requirements. Each map unit is defined by a uniquecombination of soil components and/or miscellaneous areas in predictableproportions. Some components may be highly contrasting to the other components ofthe map unit. The presence of minor components in a map unit in no way diminishesthe usefulness or accuracy of the data. The delineation of such landforms andlandform segments on the map provides sufficient information for the development ofresource plans. If intensive use of small areas is planned, onsite investigation isneeded to define and locate the soils and miscellaneous areas.
Soil scientists make many field observations in the process of producing a soil map.The frequency of observation is dependent upon several factors, including scale ofmapping, intensity of mapping, design of map units, complexity of the landscape, andexperience of the soil scientist. Observations are made to test and refine the soil-landscape model and predictions and to verify the classification of the soils at specificlocations. Once the soil-landscape model is refined, a significantly smaller number ofmeasurements of individual soil properties are made and recorded. Thesemeasurements may include field measurements, such as those for color, depth tobedrock, and texture, and laboratory measurements, such as those for content ofsand, silt, clay, salt, and other components. Properties of each soil typically vary fromone point to another across the landscape.
Observations for map unit components are aggregated to develop ranges ofcharacteristics for the components. The aggregated values are presented. Directmeasurements do not exist for every property presented for every map unitcomponent. Values for some properties are estimated from combinations of otherproperties.
While a soil survey is in progress, samples of some of the soils in the area generallyare collected for laboratory analyses and for engineering tests. Soil scientists interpretthe data from these analyses and tests as well as the field-observed characteristicsand the soil properties to determine the expected behavior of the soils under differentuses. Interpretations for all of the soils are field tested through observation of the soilsin different uses and under different levels of management. Some interpretations aremodified to fit local conditions, and some new interpretations are developed to meetlocal needs. Data are assembled from other sources, such as research information,production records, and field experience of specialists. For example, data on cropyields under defined levels of management are assembled from farm records and fromfield or plot experiments on the same kinds of soil.
Predictions about soil behavior are based not only on soil properties but also on suchvariables as climate and biological activity. Soil conditions are predictable over longperiods of time, but they are not predictable from year to year. For example, soilscientists can predict with a fairly high degree of accuracy that a given soil will havea high water table within certain depths in most years, but they cannot predict that ahigh water table will always be at a specific level in the soil on a specific date.
After soil scientists located and identified the significant natural bodies of soil in thesurvey area, they drew the boundaries of these bodies on aerial photographs andidentified each as a specific map unit. Aerial photographs show trees, buildings, fields,roads, and rivers, all of which help in locating boundaries accurately.
Custom Soil Resource Report
6
Soil MapThe soil map section includes the soil map for the defined area of interest, a list of soilmap units on the map and extent of each map unit, and cartographic symbolsdisplayed on the map. Also presented are various metadata about data used toproduce the map, and a description of each soil map unit.
7
Gibson Ln
Pow
erho
use
Rd
190
115
188
128
489360
489360
489420
489420
489480
489480
489540
489540
489600
489600
489660
489660
489720
489720
489780
489780
489840
489840
4353
840
4353
840
4353
900
4353
900
4353
960
4353
960
4354
020
4354
020
4354
080
4354
080
4354
140
4354
140
0 200 400 600100Feet
0 70 140 21035Meters
±
39° 20' 12''
123°
7' 2
''
39° 20' 0''
123°
7' 2
''
39° 20' 0''
39° 20' 12''12
3° 7
' 25'
'12
3° 7
' 25'
'
Map Scale: 1:2,640 if printed on A size (8.5" x 11") sheet.
Custom Soil Resource ReportSoil Map
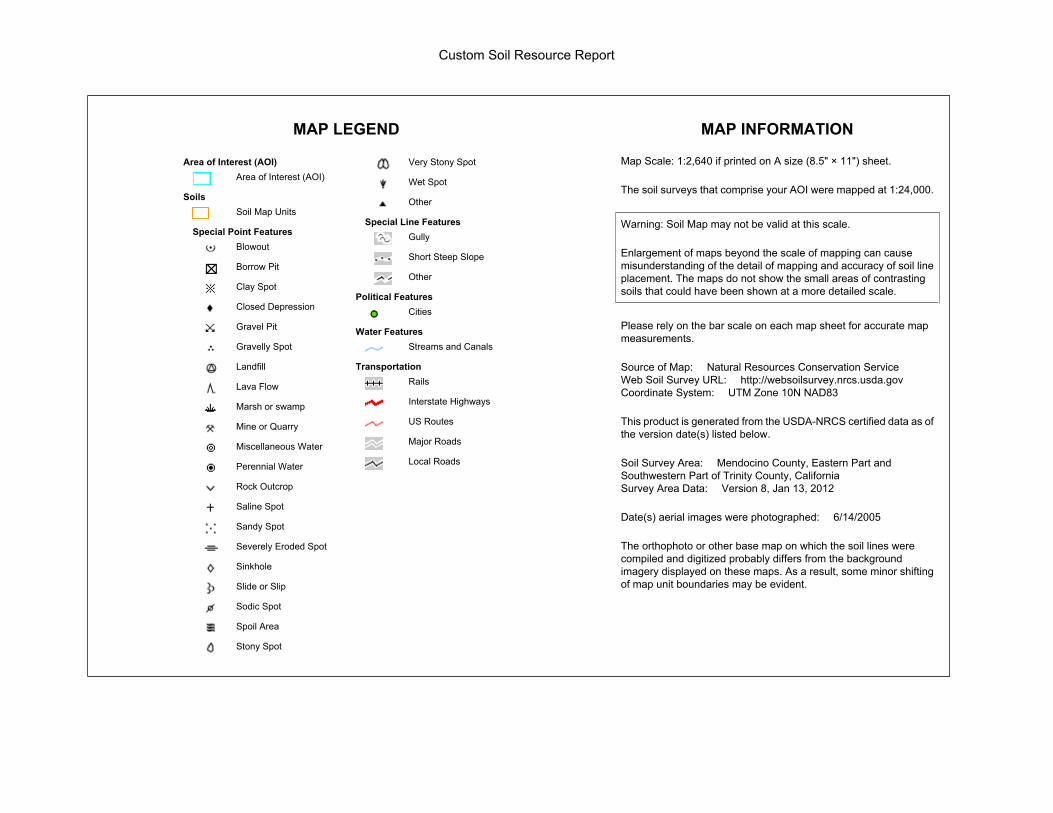
MAP LEGEND MAP INFORMATION
Area of Interest (AOI)Area of Interest (AOI)
SoilsSoil Map Units
Special Point FeaturesBlowout
Borrow Pit
Clay Spot
Closed Depression
Gravel Pit
Gravelly Spot
Landfill
Lava Flow
Marsh or swamp
Mine or Quarry
Miscellaneous Water
Perennial Water
Rock Outcrop
Saline Spot
Sandy Spot
Severely Eroded Spot
Sinkhole
Slide or Slip
Sodic Spot
Spoil Area
Stony Spot
Very Stony Spot
Wet Spot
Other
Special Line FeaturesGully
Short Steep Slope
Other
Political FeaturesCities
Water FeaturesStreams and Canals
TransportationRails
Interstate Highways
US Routes
Major Roads
Local Roads
Map Scale: 1:2,640 if printed on A size (8.5" × 11") sheet.
The soil surveys that comprise your AOI were mapped at 1:24,000.
Warning: Soil Map may not be valid at this scale.
Enlargement of maps beyond the scale of mapping can causemisunderstanding of the detail of mapping and accuracy of soil lineplacement. The maps do not show the small areas of contrastingsoils that could have been shown at a more detailed scale.
Please rely on the bar scale on each map sheet for accurate mapmeasurements.
Source of Map: Natural Resources Conservation ServiceWeb Soil Survey URL: http://websoilsurvey.nrcs.usda.govCoordinate System: UTM Zone 10N NAD83
This product is generated from the USDA-NRCS certified data as ofthe version date(s) listed below.
Soil Survey Area: Mendocino County, Eastern Part andSouthwestern Part of Trinity County, CaliforniaSurvey Area Data: Version 8, Jan 13, 2012
Date(s) aerial images were photographed: 6/14/2005
The orthophoto or other base map on which the soil lines werecompiled and digitized probably differs from the backgroundimagery displayed on these maps. As a result, some minor shiftingof map unit boundaries may be evident.
Custom Soil Resource Report
Map Unit Legend
Mendocino County, Eastern Part and Southwestern Part of Trinity County, California (CA687)
Map Unit Symbol Map Unit Name Acres in AOI Percent of AOI
115 Cole clay loam, 0 to 2 percent slopes 5.5 24.6%
128 Gielow sandy loam, 0 to 5 percent slopes 1.0 4.4%
188 Russian loam, 0 to 2 percent slopes 3.3 14.5%
190 Russian loam, gravelly substratum, 0 to 2 percentslopes
12.7 56.6%
Totals for Area of Interest 22.5 100.0%
Map Unit DescriptionsThe map units delineated on the detailed soil maps in a soil survey represent the soilsor miscellaneous areas in the survey area. The map unit descriptions, along with themaps, can be used to determine the composition and properties of a unit.
A map unit delineation on a soil map represents an area dominated by one or moremajor kinds of soil or miscellaneous areas. A map unit is identified and namedaccording to the taxonomic classification of the dominant soils. Within a taxonomicclass there are precisely defined limits for the properties of the soils. On the landscape,however, the soils are natural phenomena, and they have the characteristic variabilityof all natural phenomena. Thus, the range of some observed properties may extendbeyond the limits defined for a taxonomic class. Areas of soils of a single taxonomicclass rarely, if ever, can be mapped without including areas of other taxonomicclasses. Consequently, every map unit is made up of the soils or miscellaneous areasfor which it is named and some minor components that belong to taxonomic classesother than those of the major soils.
Most minor soils have properties similar to those of the dominant soil or soils in themap unit, and thus they do not affect use and management. These are callednoncontrasting, or similar, components. They may or may not be mentioned in aparticular map unit description. Other minor components, however, have propertiesand behavioral characteristics divergent enough to affect use or to require differentmanagement. These are called contrasting, or dissimilar, components. They generallyare in small areas and could not be mapped separately because of the scale used.Some small areas of strongly contrasting soils or miscellaneous areas are identifiedby a special symbol on the maps. If included in the database for a given area, thecontrasting minor components are identified in the map unit descriptions along withsome characteristics of each. A few areas of minor components may not have beenobserved, and consequently they are not mentioned in the descriptions, especiallywhere the pattern was so complex that it was impractical to make enough observationsto identify all the soils and miscellaneous areas on the landscape.
The presence of minor components in a map unit in no way diminishes the usefulnessor accuracy of the data. The objective of mapping is not to delineate pure taxonomicclasses but rather to separate the landscape into landforms or landform segments thathave similar use and management requirements. The delineation of such segments
Custom Soil Resource Report
10
on the map provides sufficient information for the development of resource plans. Ifintensive use of small areas is planned, however, onsite investigation is needed todefine and locate the soils and miscellaneous areas.
An identifying symbol precedes the map unit name in the map unit descriptions. Eachdescription includes general facts about the unit and gives important soil propertiesand qualities.
Soils that have profiles that are almost alike make up a soil series. Except fordifferences in texture of the surface layer, all the soils of a series have major horizonsthat are similar in composition, thickness, and arrangement.
Soils of one series can differ in texture of the surface layer, slope, stoniness, salinity,degree of erosion, and other characteristics that affect their use. On the basis of suchdifferences, a soil series is divided into soil phases. Most of the areas shown on thedetailed soil maps are phases of soil series. The name of a soil phase commonlyindicates a feature that affects use or management. For example, Alpha silt loam, 0to 2 percent slopes, is a phase of the Alpha series.
Some map units are made up of two or more major soils or miscellaneous areas.These map units are complexes, associations, or undifferentiated groups.
A complex consists of two or more soils or miscellaneous areas in such an intricatepattern or in such small areas that they cannot be shown separately on the maps. Thepattern and proportion of the soils or miscellaneous areas are somewhat similar in allareas. Alpha-Beta complex, 0 to 6 percent slopes, is an example.
An association is made up of two or more geographically associated soils ormiscellaneous areas that are shown as one unit on the maps. Because of present oranticipated uses of the map units in the survey area, it was not considered practicalor necessary to map the soils or miscellaneous areas separately. The pattern andrelative proportion of the soils or miscellaneous areas are somewhat similar. Alpha-Beta association, 0 to 2 percent slopes, is an example.
An undifferentiated group is made up of two or more soils or miscellaneous areas thatcould be mapped individually but are mapped as one unit because similarinterpretations can be made for use and management. The pattern and proportion ofthe soils or miscellaneous areas in a mapped area are not uniform. An area can bemade up of only one of the major soils or miscellaneous areas, or it can be made upof all of them. Alpha and Beta soils, 0 to 2 percent slopes, is an example.
Some surveys include miscellaneous areas. Such areas have little or no soil materialand support little or no vegetation. Rock outcrop is an example.
Custom Soil Resource Report
11
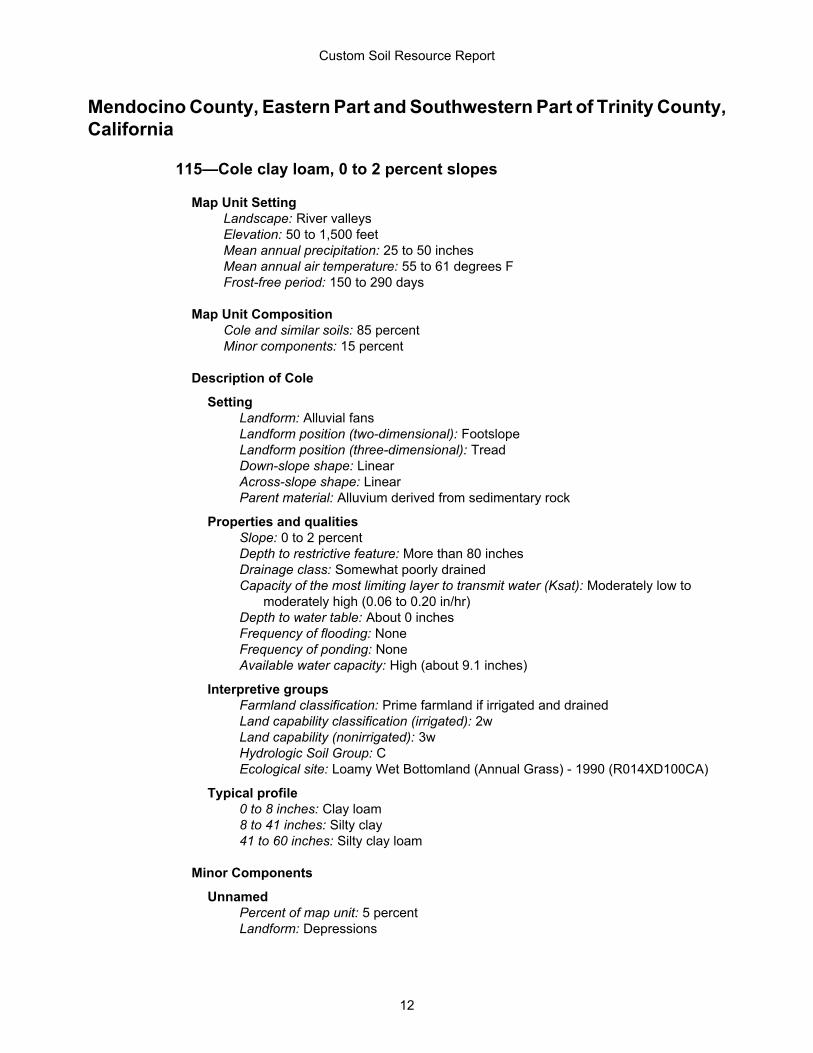
Mendocino County, Eastern Part and Southwestern Part of Trinity County,California
115—Cole clay loam, 0 to 2 percent slopes
Map Unit SettingLandscape: River valleysElevation: 50 to 1,500 feetMean annual precipitation: 25 to 50 inchesMean annual air temperature: 55 to 61 degrees FFrost-free period: 150 to 290 days
Map Unit CompositionCole and similar soils: 85 percentMinor components: 15 percent
Description of Cole
SettingLandform: Alluvial fansLandform position (two-dimensional): FootslopeLandform position (three-dimensional): TreadDown-slope shape: LinearAcross-slope shape: LinearParent material: Alluvium derived from sedimentary rock
Properties and qualitiesSlope: 0 to 2 percentDepth to restrictive feature: More than 80 inchesDrainage class: Somewhat poorly drainedCapacity of the most limiting layer to transmit water (Ksat): Moderately low to
moderately high (0.06 to 0.20 in/hr)Depth to water table: About 0 inchesFrequency of flooding: NoneFrequency of ponding: NoneAvailable water capacity: High (about 9.1 inches)
Interpretive groupsFarmland classification: Prime farmland if irrigated and drainedLand capability classification (irrigated): 2wLand capability (nonirrigated): 3wHydrologic Soil Group: CEcological site: Loamy Wet Bottomland (Annual Grass) - 1990 (R014XD100CA)
Typical profile0 to 8 inches: Clay loam8 to 41 inches: Silty clay41 to 60 inches: Silty clay loam
Minor Components
UnnamedPercent of map unit: 5 percentLandform: Depressions
Custom Soil Resource Report
12
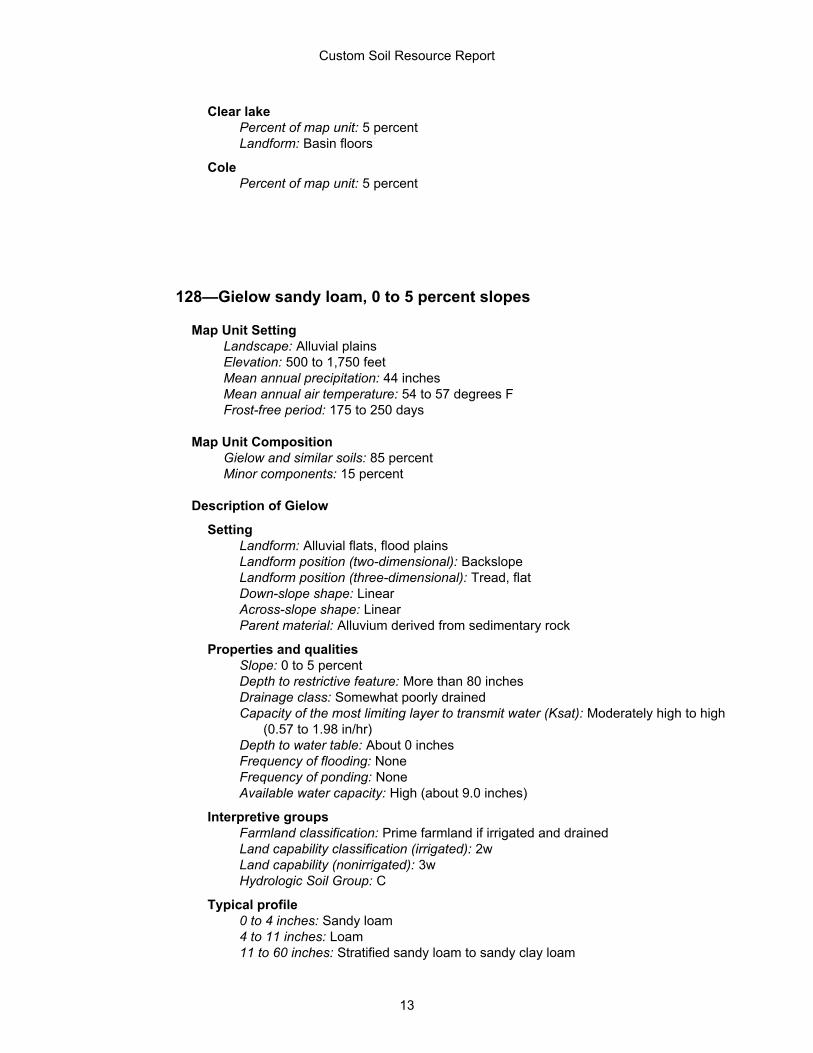
Clear lakePercent of map unit: 5 percentLandform: Basin floors
ColePercent of map unit: 5 percent
128—Gielow sandy loam, 0 to 5 percent slopes
Map Unit SettingLandscape: Alluvial plainsElevation: 500 to 1,750 feetMean annual precipitation: 44 inchesMean annual air temperature: 54 to 57 degrees FFrost-free period: 175 to 250 days
Map Unit CompositionGielow and similar soils: 85 percentMinor components: 15 percent
Description of Gielow
SettingLandform: Alluvial flats, flood plainsLandform position (two-dimensional): BackslopeLandform position (three-dimensional): Tread, flatDown-slope shape: LinearAcross-slope shape: LinearParent material: Alluvium derived from sedimentary rock
Properties and qualitiesSlope: 0 to 5 percentDepth to restrictive feature: More than 80 inchesDrainage class: Somewhat poorly drainedCapacity of the most limiting layer to transmit water (Ksat): Moderately high to high
(0.57 to 1.98 in/hr)Depth to water table: About 0 inchesFrequency of flooding: NoneFrequency of ponding: NoneAvailable water capacity: High (about 9.0 inches)
Interpretive groupsFarmland classification: Prime farmland if irrigated and drainedLand capability classification (irrigated): 2wLand capability (nonirrigated): 3wHydrologic Soil Group: C
Typical profile0 to 4 inches: Sandy loam4 to 11 inches: Loam11 to 60 inches: Stratified sandy loam to sandy clay loam
Custom Soil Resource Report
13
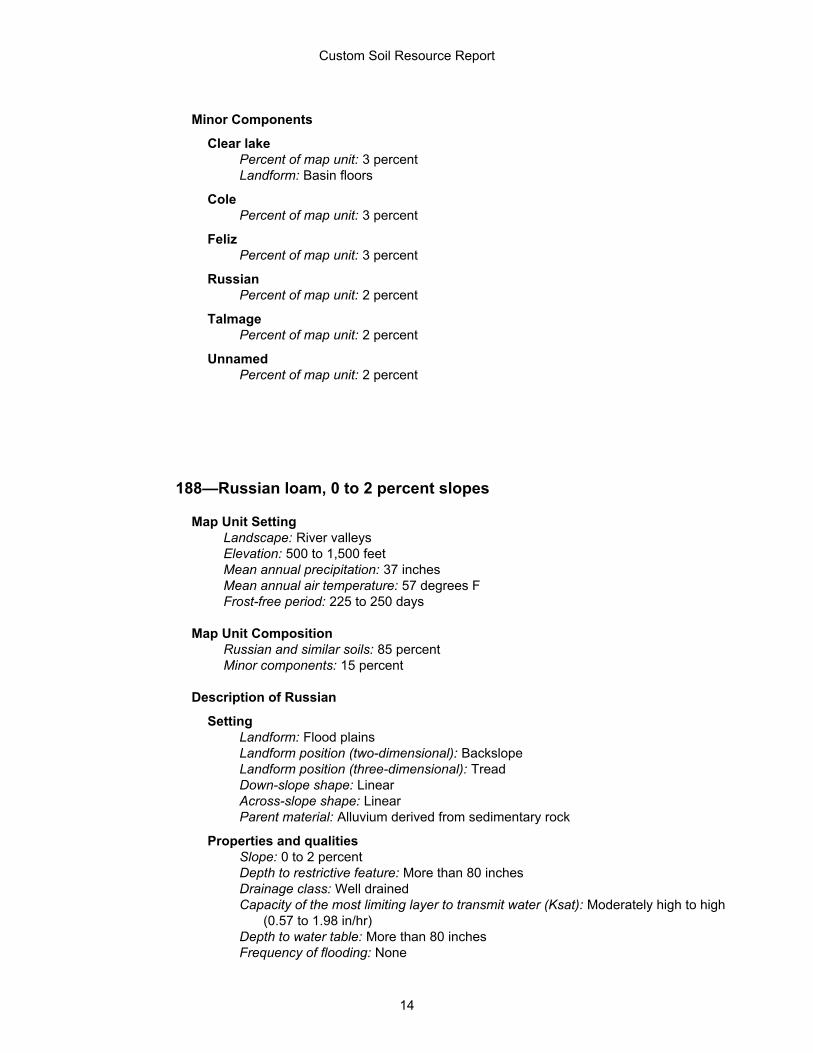
Minor Components
Clear lakePercent of map unit: 3 percentLandform: Basin floors
ColePercent of map unit: 3 percent
FelizPercent of map unit: 3 percent
RussianPercent of map unit: 2 percent
TalmagePercent of map unit: 2 percent
UnnamedPercent of map unit: 2 percent
188—Russian loam, 0 to 2 percent slopes
Map Unit SettingLandscape: River valleysElevation: 500 to 1,500 feetMean annual precipitation: 37 inchesMean annual air temperature: 57 degrees FFrost-free period: 225 to 250 days
Map Unit CompositionRussian and similar soils: 85 percentMinor components: 15 percent
Description of Russian
SettingLandform: Flood plainsLandform position (two-dimensional): BackslopeLandform position (three-dimensional): TreadDown-slope shape: LinearAcross-slope shape: LinearParent material: Alluvium derived from sedimentary rock
Properties and qualitiesSlope: 0 to 2 percentDepth to restrictive feature: More than 80 inchesDrainage class: Well drainedCapacity of the most limiting layer to transmit water (Ksat): Moderately high to high
(0.57 to 1.98 in/hr)Depth to water table: More than 80 inchesFrequency of flooding: None
Custom Soil Resource Report
14
Frequency of ponding: NoneAvailable water capacity: High (about 9.6 inches)
Interpretive groupsFarmland classification: Prime farmland if irrigatedLand capability classification (irrigated): 1Land capability (nonirrigated): 3cHydrologic Soil Group: B
Typical profile0 to 38 inches: Loam38 to 60 inches: Stratified very fine sandy loam to silt loam
Minor Components
UnnamedPercent of map unit: 5 percentLandform: Flood plains
ColePercent of map unit: 3 percent
FelizPercent of map unit: 3 percent
RiverwashPercent of map unit: 2 percentLandform: Channels
XerofluventsPercent of map unit: 2 percentLandform: Fans
190—Russian loam, gravelly substratum, 0 to 2 percent slopes
Map Unit SettingLandscape: River valleysElevation: 400 to 1,500 feetMean annual precipitation: 37 inchesMean annual air temperature: 57 degrees FFrost-free period: 225 to 250 days
Map Unit CompositionRussian and similar soils: 85 percentMinor components: 15 percent
Description of Russian
SettingLandform: Flood plainsLandform position (two-dimensional): BackslopeLandform position (three-dimensional): TreadDown-slope shape: Linear
Custom Soil Resource Report
15
Across-slope shape: LinearParent material: Alluvium derived from sedimentary rock
Properties and qualitiesSlope: 0 to 2 percentDepth to restrictive feature: More than 80 inchesDrainage class: Well drainedCapacity of the most limiting layer to transmit water (Ksat): Moderately high to high
(0.57 to 1.98 in/hr)Depth to water table: More than 80 inchesFrequency of flooding: NoneFrequency of ponding: NoneAvailable water capacity: Moderate (about 6.6 inches)
Interpretive groupsFarmland classification: Prime farmland if irrigatedLand capability classification (irrigated): 2sLand capability (nonirrigated): 3sHydrologic Soil Group: B
Typical profile0 to 30 inches: Loam30 to 51 inches: Stratified gravelly coarse sand to sandy loam51 to 60 inches: Stratified gravelly coarse sand to gravelly sandy loam
Minor Components
Ponded areasPercent of map unit: 5 percentLandform: Flood plains
ColePercent of map unit: 3 percent
FelizPercent of map unit: 3 percent
RiverwashPercent of map unit: 2 percentLandform: Channels
XerofluventsPercent of map unit: 2 percentLandform: Flood plains
Custom Soil Resource Report
16
ReferencesAmerican Association of State Highway and Transportation Officials (AASHTO). 2004.Standard specifications for transportation materials and methods of sampling andtesting. 24th edition.
American Society for Testing and Materials (ASTM). 2005. Standard classification ofsoils for engineering purposes. ASTM Standard D2487-00.
Cowardin, L.M., V. Carter, F.C. Golet, and E.T. LaRoe. 1979. Classification ofwetlands and deep-water habitats of the United States. U.S. Fish and Wildlife ServiceFWS/OBS-79/31.
Federal Register. July 13, 1994. Changes in hydric soils of the United States.
Federal Register. September 18, 2002. Hydric soils of the United States.
Hurt, G.W., and L.M. Vasilas, editors. Version 6.0, 2006. Field indicators of hydric soilsin the United States.
National Research Council. 1995. Wetlands: Characteristics and boundaries.
Soil Survey Division Staff. 1993. Soil survey manual. Soil Conservation Service. U.S.Department of Agriculture Handbook 18. http://soils.usda.gov/
Soil Survey Staff. 1999. Soil taxonomy: A basic system of soil classification for makingand interpreting soil surveys. 2nd edition. Natural Resources Conservation Service,U.S. Department of Agriculture Handbook 436. http://soils.usda.gov/
Soil Survey Staff. 2006. Keys to soil taxonomy. 10th edition. U.S. Department ofAgriculture, Natural Resources Conservation Service. http://soils.usda.gov/
Tiner, R.W., Jr. 1985. Wetlands of Delaware. U.S. Fish and Wildlife Service andDelaware Department of Natural Resources and Environmental Control, WetlandsSection.
United States Army Corps of Engineers, Environmental Laboratory. 1987. Corps ofEngineers wetlands delineation manual. Waterways Experiment Station TechnicalReport Y-87-1.
United States Department of Agriculture, Natural Resources Conservation Service.National forestry manual. http://soils.usda.gov/
United States Department of Agriculture, Natural Resources Conservation Service.National range and pasture handbook. http://www.glti.nrcs.usda.gov/
United States Department of Agriculture, Natural Resources Conservation Service.National soil survey handbook, title 430-VI. http://soils.usda.gov/
United States Department of Agriculture, Natural Resources Conservation Service.2006. Land resource regions and major land resource areas of the United States, theCaribbean, and the Pacific Basin. U.S. Department of Agriculture Handbook 296.http://soils.usda.gov/
17

United States Department of Agriculture, Soil Conservation Service. 1961. Landcapability classification. U.S. Department of Agriculture Handbook 210.
Custom Soil Resource Report
18
GlossaryMany of the terms relating to landforms, geology, and geomorphology are defined inmore detail in the “National Soil Survey Handbook.”
ABC soil
A soil having an A, a B, and a C horizon.
Ablation till
Loose, relatively permeable earthy material deposited during the downwasting ofnearly static glacial ice, either contained within or accumulated on the surface ofthe glacier.
AC soil
A soil having only an A and a C horizon. Commonly, such soil formed in recentalluvium or on steep, rocky slopes.
Aeration, soil
The exchange of air in soil with air from the atmosphere. The air in a well aeratedsoil is similar to that in the atmosphere; the air in a poorly aerated soil isconsiderably higher in carbon dioxide and lower in oxygen.
Aggregate, soil
Many fine particles held in a single mass or cluster. Natural soil aggregates, suchas granules, blocks, or prisms, are called peds. Clods are aggregates producedby tillage or logging.
Alkali (sodic) soil
A soil having so high a degree of alkalinity (pH 8.5 or higher) or so high apercentage of exchangeable sodium (15 percent or more of the totalexchangeable bases), or both, that plant growth is restricted.
Alluvial cone
A semiconical type of alluvial fan having very steep slopes. It is higher, narrower,and steeper than a fan and is composed of coarser and thicker layers of materialdeposited by a combination of alluvial episodes and (to a much lesser degree)landslides (debris flow). The coarsest materials tend to be concentrated at theapex of the cone.
19
Alluvial fan
A low, outspread mass of loose materials and/or rock material, commonly withgentle slopes. It is shaped like an open fan or a segment of a cone. The materialwas deposited by a stream at the place where it issues from a narrow mountainvalley or upland valley or where a tributary stream is near or at its junction withthe main stream. The fan is steepest near its apex, which points upstream, andslopes gently and convexly outward (downstream) with a gradual decrease ingradient.
Alluvium
Unconsolidated material, such as gravel, sand, silt, clay, and various mixtures ofthese, deposited on land by running water.
Alpha,alpha-dipyridyl
A compound that when dissolved in ammonium acetate is used to detect thepresence of reduced iron (Fe II) in the soil. A positive reaction implies reducingconditions and the likely presence of redoximorphic features.
Animal unit month (AUM)
The amount of forage required by one mature cow of approximately 1,000 poundsweight, with or without a calf, for 1 month.
Aquic conditions
Current soil wetness characterized by saturation, reduction, and redoximorphicfeatures.
Argillic horizon
A subsoil horizon characterized by an accumulation of illuvial clay.
Arroyo
The flat-floored channel of an ephemeral stream, commonly with very steep tovertical banks cut in unconsolidated material. It is usually dry but can betransformed into a temporary watercourse or short-lived torrent after heavy rainwithin the watershed.
Aspect
The direction toward which a slope faces. Also called slope aspect.
Association, soil
A group of soils or miscellaneous areas geographically associated in acharacteristic repeating pattern and defined and delineated as a single map unit.
Available water capacity (available moisture capacity)
The capacity of soils to hold water available for use by most plants. It is commonlydefined as the difference between the amount of soil water at field moisturecapacity and the amount at wilting point. It is commonly expressed as inches ofwater per inch of soil. The capacity, in inches, in a 60-inch profile or to a limitinglayer is expressed as:
Custom Soil Resource Report
20
Very low: 0 to 3Low: 3 to 6Moderate: 6 to 9High: 9 to 12Very high: More than 12
Backslope
The position that forms the steepest and generally linear, middle portion of ahillslope. In profile, backslopes are commonly bounded by a convex shoulderabove and a concave footslope below.
Backswamp
A flood-plain landform. Extensive, marshy or swampy, depressed areas of floodplains between natural levees and valley sides or terraces.
Badland
A landscape that is intricately dissected and characterized by a very fine drainagenetwork with high drainage densities and short, steep slopes and narrowinterfluves. Badlands develop on surfaces that have little or no vegetative coveroverlying unconsolidated or poorly cemented materials (clays, silts, orsandstones) with, in some cases, soluble minerals, such as gypsum or halite.
Bajada
A broad, gently inclined alluvial piedmont slope extending from the base of amountain range out into a basin and formed by the lateral coalescence of a seriesof alluvial fans. Typically, it has a broadly undulating transverse profile, parallel tothe mountain front, resulting from the convexities of component fans. The term isgenerally restricted to constructional slopes of intermontane basins.
Basal area
The area of a cross section of a tree, generally referring to the section at breastheight and measured outside the bark. It is a measure of stand density, commonlyexpressed in square feet.
Base saturation
The degree to which material having cation-exchange properties is saturated withexchangeable bases (sum of Ca, Mg, Na, and K), expressed as a percentage ofthe total cation-exchange capacity.
Base slope (geomorphology)
A geomorphic component of hills consisting of the concave to linear(perpendicular to the contour) slope that, regardless of the lateral shape, formsan apron or wedge at the bottom of a hillside dominated by colluvium and slope-wash sediments (for example, slope alluvium).
Bedding plane
A planar or nearly planar bedding surface that visibly separates each successivelayer of stratified sediment or rock (of the same or different lithology) from thepreceding or following layer; a plane of deposition. It commonly marks a change
Custom Soil Resource Report
21
in the circumstances of deposition and may show a parting, a color difference, achange in particle size, or various combinations of these. The term is commonlyapplied to any bedding surface, even one that is conspicuously bent or deformedby folding.
Bedding system
A drainage system made by plowing, grading, or otherwise shaping the surfaceof a flat field. It consists of a series of low ridges separated by shallow, paralleldead furrows.
Bedrock
The solid rock that underlies the soil and other unconsolidated material or that isexposed at the surface.
Bedrock-controlled topography
A landscape where the configuration and relief of the landforms are determinedor strongly influenced by the underlying bedrock.
Bench terrace
A raised, level or nearly level strip of earth constructed on or nearly on a contour,supported by a barrier of rocks or similar material, and designed to make the soilsuitable for tillage and to prevent accelerated erosion.
Bisequum
Two sequences of soil horizons, each of which consists of an illuvial horizon andthe overlying eluvial horizons.
Blowout (map symbol)
A saucer-, cup-, or trough-shaped depression formed by wind erosion on apreexisting dune or other sand deposit, especially in an area of shifting sand orloose soil or where protective vegetation is disturbed or destroyed. The adjoiningaccumulation of sand derived from the depression, where recognizable, iscommonly included. Blowouts are commonly small.
Borrow pit (map symbol)
An open excavation from which soil and underlying material have been removed,usually for construction purposes.
Bottom land
An informal term loosely applied to various portions of a flood plain.
Boulders
Rock fragments larger than 2 feet (60 centimeters) in diameter.
Breaks
A landscape or tract of steep, rough or broken land dissected by ravines andgullies and marking a sudden change in topography.
Custom Soil Resource Report
22
Breast height
An average height of 4.5 feet above the ground surface; the point on a tree wherediameter measurements are ordinarily taken.
Brush management
Use of mechanical, chemical, or biological methods to make conditions favorablefor reseeding or to reduce or eliminate competition from woody vegetation andthus allow understory grasses and forbs to recover. Brush management increasesforage production and thus reduces the hazard of erosion. It can improve thehabitat for some species of wildlife.
Butte
An isolated, generally flat-topped hill or mountain with relatively steep slopes andtalus or precipitous cliffs and characterized by summit width that is less than theheight of bounding escarpments; commonly topped by a caprock of resistantmaterial and representing an erosion remnant carved from flat-lying rocks.
Cable yarding
A method of moving felled trees to a nearby central area for transport to aprocessing facility. Most cable yarding systems involve use of a drum, a pole, andwire cables in an arrangement similar to that of a rod and reel used for fishing. Toreduce friction and soil disturbance, felled trees generally are reeled in while oneend is lifted or the entire log is suspended.
Calcareous soil
A soil containing enough calcium carbonate (commonly combined withmagnesium carbonate) to effervesce visibly when treated with cold, dilutehydrochloric acid.
Caliche
A general term for a prominent zone of secondary carbonate accumulation insurficial materials in warm, subhumid to arid areas. Caliche is formed by bothgeologic and pedologic processes. Finely crystalline calcium carbonate forms anearly continuous surface-coating and void-filling medium in geologic (parent)materials. Cementation ranges from weak in nonindurated forms to very strong inindurated forms. Other minerals (e.g., carbonates, silicate, and sulfate) may occuras accessory cements. Most petrocalcic horizons and some calcic horizons arecaliche.
California bearing ratio (CBR)
The load-supporting capacity of a soil as compared to that of standard crushedlimestone, expressed as a ratio. First standardized in California. A soil having aCBR of 16 supports 16 percent of the load that would be supported by standardcrushed limestone, per unit area, with the same degree of distortion.
Canopy
The leafy crown of trees or shrubs. (See Crown.)
Custom Soil Resource Report
23
Canyon
A long, deep, narrow valley with high, precipitous walls in an area of high localrelief.
Capillary water
Water held as a film around soil particles and in tiny spaces between particles.Surface tension is the adhesive force that holds capillary water in the soil.
Catena
A sequence, or “chain,” of soils on a landscape that formed in similar kinds ofparent material and under similar climatic conditions but that have differentcharacteristics as a result of differences in relief and drainage.
Cation
An ion carrying a positive charge of electricity. The common soil cations arecalcium, potassium, magnesium, sodium, and hydrogen.
Cation-exchange capacity
The total amount of exchangeable cations that can be held by the soil, expressedin terms of milliequivalents per 100 grams of soil at neutrality (pH 7.0) or at someother stated pH value. The term, as applied to soils, is synonymous with base-exchange capacity but is more precise in meaning.
Catsteps
See Terracettes.
Cement rock
Shaly limestone used in the manufacture of cement.
Channery soil material
Soil material that has, by volume, 15 to 35 percent thin, flat fragments ofsandstone, shale, slate, limestone, or schist as much as 6 inches (15 centimeters)along the longest axis. A single piece is called a channer.
Chemical treatment
Control of unwanted vegetation through the use of chemicals.
Chiseling
Tillage with an implement having one or more soil-penetrating points that shatteror loosen hard, compacted layers to a depth below normal plow depth.
Cirque
A steep-walled, semicircular or crescent-shaped, half-bowl-like recess or hollow,commonly situated at the head of a glaciated mountain valley or high on the sideof a mountain. It was produced by the erosive activity of a mountain glacier. Itcommonly contains a small round lake (tarn).
Custom Soil Resource Report
24
Clay
As a soil separate, the mineral soil particles less than 0.002 millimeter in diameter.As a soil textural class, soil material that is 40 percent or more clay, less than 45percent sand, and less than 40 percent silt.
Clay depletions
See Redoximorphic features.
Clay film
A thin coating of oriented clay on the surface of a soil aggregate or lining pores orroot channels. Synonyms: clay coating, clay skin.
Clay spot (map symbol)
A spot where the surface texture is silty clay or clay in areas where the surfacelayer of the soils in the surrounding map unit is sandy loam, loam, silt loam, orcoarser.
Claypan
A dense, compact subsoil layer that contains much more clay than the overlyingmaterials, from which it is separated by a sharply defined boundary. The layerrestricts the downward movement of water through the soil. A claypan iscommonly hard when dry and plastic and sticky when wet.
Climax plant community
The stabilized plant community on a particular site. The plant cover reproducesitself and does not change so long as the environment remains the same.
Coarse textured soil
Sand or loamy sand.
Cobble (or cobblestone)
A rounded or partly rounded fragment of rock 3 to 10 inches (7.6 to 25 centimeters)in diameter.
Cobbly soil material
Material that has 15 to 35 percent, by volume, rounded or partially rounded rockfragments 3 to 10 inches (7.6 to 25 centimeters) in diameter. Very cobbly soilmaterial has 35 to 60 percent of these rock fragments, and extremely cobbly soilmaterial has more than 60 percent.
COLE (coefficient of linear extensibility)
See Linear extensibility.
Colluvium
Unconsolidated, unsorted earth material being transported or deposited on sideslopes and/or at the base of slopes by mass movement (e.g., direct gravitationalaction) and by local, unconcentrated runoff.
Custom Soil Resource Report
25
Complex slope
Irregular or variable slope. Planning or establishing terraces, diversions, and otherwater-control structures on a complex slope is difficult.
Complex, soil
A map unit of two or more kinds of soil or miscellaneous areas in such an intricatepattern or so small in area that it is not practical to map them separately at theselected scale of mapping. The pattern and proportion of the soils ormiscellaneous areas are somewhat similar in all areas.
Concretions
See Redoximorphic features.
Conglomerate
A coarse grained, clastic sedimentary rock composed of rounded or subangularrock fragments more than 2 millimeters in diameter. It commonly has a matrix ofsand and finer textured material. Conglomerate is the consolidated equivalent ofgravel.
Conservation cropping system
Growing crops in combination with needed cultural and management practices.In a good conservation cropping system, the soil-improving crops and practicesmore than offset the effects of the soil-depleting crops and practices. Croppingsystems are needed on all tilled soils. Soil-improving practices in a conservationcropping system include the use of rotations that contain grasses and legumesand the return of crop residue to the soil. Other practices include the use of greenmanure crops of grasses and legumes, proper tillage, adequate fertilization, andweed and pest control.
Conservation tillage
A tillage system that does not invert the soil and that leaves a protective amountof crop residue on the surface throughout the year.
Consistence, soil
Refers to the degree of cohesion and adhesion of soil material and its resistanceto deformation when ruptured. Consistence includes resistance of soil material torupture and to penetration; plasticity, toughness, and stickiness of puddled soilmaterial; and the manner in which the soil material behaves when subject tocompression. Terms describing consistence are defined in the “Soil SurveyManual.”
Contour stripcropping
Growing crops in strips that follow the contour. Strips of grass or close-growingcrops are alternated with strips of clean-tilled crops or summer fallow.
Control section
The part of the soil on which classification is based. The thickness varies amongdifferent kinds of soil, but for many it is that part of the soil profile between depthsof 10 inches and 40 or 80 inches.
Custom Soil Resource Report
26
Coprogenous earth (sedimentary peat)
A type of limnic layer composed predominantly of fecal material derived fromaquatic animals.
Corrosion (geomorphology)
A process of erosion whereby rocks and soil are removed or worn away by naturalchemical processes, especially by the solvent action of running water, but also byother reactions, such as hydrolysis, hydration, carbonation, and oxidation.
Corrosion (soil survey interpretations)
Soil-induced electrochemical or chemical action that dissolves or weakensconcrete or uncoated steel.
Cover crop
A close-growing crop grown primarily to improve and protect the soil betweenperiods of regular crop production, or a crop grown between trees and vines inorchards and vineyards.
Crop residue management
Returning crop residue to the soil, which helps to maintain soil structure, organicmatter content, and fertility and helps to control erosion.
Cropping system
Growing crops according to a planned system of rotation and managementpractices.
Cross-slope farming
Deliberately conducting farming operations on sloping farmland in such a way thattillage is across the general slope.
Crown
The upper part of a tree or shrub, including the living branches and their foliage.
Cryoturbate
A mass of soil or other unconsolidated earthy material moved or disturbed by frostaction. It is typically coarser than the underlying material.
Cuesta
An asymmetric ridge capped by resistant rock layers of slight or moderate dip(commonly less than 15 percent slopes); a type of homocline produced bydifferential erosion of interbedded resistant and weak rocks. A cuesta has a long,gentle slope on one side (dip slope) that roughly parallels the inclined beds; onthe other side, it has a relatively short and steep or clifflike slope (scarp) that cutsthrough the tilted rocks.
Culmination of the mean annual increment (CMAI)
The average annual increase per acre in the volume of a stand. Computed bydividing the total volume of the stand by its age. As the stand increases in age,
Custom Soil Resource Report
27
the mean annual increment continues to increase until mortality begins to reducethe rate of increase. The point where the stand reaches its maximum annual rateof growth is called the culmination of the mean annual increment.
Cutbanks cave
The walls of excavations tend to cave in or slough.
Decreasers
The most heavily grazed climax range plants. Because they are the mostpalatable, they are the first to be destroyed by overgrazing.
Deferred grazing
Postponing grazing or resting grazing land for a prescribed period.
Delta
A body of alluvium having a surface that is fan shaped and nearly flat; depositedat or near the mouth of a river or stream where it enters a body of relatively quietwater, generally a sea or lake.
Dense layer
A very firm, massive layer that has a bulk density of more than 1.8 grams per cubiccentimeter. Such a layer affects the ease of digging and can affect filling andcompacting.
Depression, closed (map symbol)
A shallow, saucer-shaped area that is slightly lower on the landscape than thesurrounding area and that does not have a natural outlet for surface drainage.
Depth, soil
Generally, the thickness of the soil over bedrock. Very deep soils are more than60 inches deep over bedrock; deep soils, 40 to 60 inches; moderately deep, 20to 40 inches; shallow, 10 to 20 inches; and very shallow, less than 10 inches.
Desert pavement
A natural, residual concentration or layer of wind-polished, closely packed gravel,boulders, and other rock fragments mantling a desert surface. It forms where windaction and sheetwash have removed all smaller particles or where rock fragmentshave migrated upward through sediments to the surface. It typically protects thefiner grained underlying material from further erosion.
Diatomaceous earth
A geologic deposit of fine, grayish siliceous material composed chiefly or entirelyof the remains of diatoms.
Dip slope
A slope of the land surface, roughly determined by and approximately conformingto the dip of the underlying bedrock.
Custom Soil Resource Report
28
Diversion (or diversion terrace)
A ridge of earth, generally a terrace, built to protect downslope areas by divertingrunoff from its natural course.
Divided-slope farming
A form of field stripcropping in which crops are grown in a systematic arrangementof two strips, or bands, across the slope to reduce the hazard of water erosion.One strip is in a close-growing crop that provides protection from erosion, and theother strip is in a crop that provides less protection from erosion. This practice isused where slopes are not long enough to permit a full stripcropping pattern to beused.
Drainage class (natural)
Refers to the frequency and duration of wet periods under conditions similar tothose under which the soil formed. Alterations of the water regime by humanactivities, either through drainage or irrigation, are not a consideration unless theyhave significantly changed the morphology of the soil. Seven classes of naturalsoil drainage are recognized—excessively drained, somewhat excessivelydrained, well drained, moderately well drained, somewhat poorly drained, poorlydrained, and very poorly drained. These classes are defined in the “Soil SurveyManual.”
Drainage, surface
Runoff, or surface flow of water, from an area.
Drainageway
A general term for a course or channel along which water moves in draining anarea. A term restricted to relatively small, linear depressions that at some timemove concentrated water and either do not have a defined channel or have onlya small defined channel.
Draw
A small stream valley that generally is shallower and more open than a ravine orgulch and that has a broader bottom. The present stream channel may appearinadequate to have cut the drainageway that it occupies.
Drift
A general term applied to all mineral material (clay, silt, sand, gravel, and boulders)transported by a glacier and deposited directly by or from the ice or transportedby running water emanating from a glacier. Drift includes unstratified material (till)that forms moraines and stratified deposits that form outwash plains, eskers,kames, varves, and glaciofluvial sediments. The term is generally applied toPleistocene glacial deposits in areas that no longer contain glaciers.
Drumlin
A low, smooth, elongated oval hill, mound, or ridge of compact till that has a coreof bedrock or drift. It commonly has a blunt nose facing the direction from whichthe ice approached and a gentler slope tapering in the other direction. The longeraxis is parallel to the general direction of glacier flow. Drumlins are products of
Custom Soil Resource Report
29
streamline (laminar) flow of glaciers, which molded the subglacial floor through acombination of erosion and deposition.
Duff
A generally firm organic layer on the surface of mineral soils. It consists of fallenplant material that is in the process of decomposition and includes everything fromthe litter on the surface to underlying pure humus.
Dune
A low mound, ridge, bank, or hill of loose, windblown granular material (generallysand), either barren and capable of movement from place to place or covered andstabilized with vegetation but retaining its characteristic shape.
Earthy fill
See Mine spoil.
Ecological site
An area where climate, soil, and relief are sufficiently uniform to produce a distinctnatural plant community. An ecological site is the product of all the environmentalfactors responsible for its development. It is typified by an association of speciesthat differ from those on other ecological sites in kind and/or proportion of speciesor in total production.
Eluviation
The movement of material in true solution or colloidal suspension from one placeto another within the soil. Soil horizons that have lost material through eluviationare eluvial; those that have received material are illuvial.
Endosaturation
A type of saturation of the soil in which all horizons between the upper boundaryof saturation and a depth of 2 meters are saturated.
Eolian deposit
Sand-, silt-, or clay-sized clastic material transported and deposited primarily bywind, commonly in the form of a dune or a sheet of sand or loess.
Ephemeral stream
A stream, or reach of a stream, that flows only in direct response to precipitation.It receives no long-continued supply from melting snow or other source, and itschannel is above the water table at all times.
Episaturation
A type of saturation indicating a perched water table in a soil in which saturatedlayers are underlain by one or more unsaturated layers within 2 meters of thesurface.
Erosion
The wearing away of the land surface by water, wind, ice, or other geologic agentsand by such processes as gravitational creep.
Custom Soil Resource Report
30
Erosion (accelerated)
Erosion much more rapid than geologic erosion, mainly as a result of human oranimal activities or of a catastrophe in nature, such as a fire, that exposes thesurface.
Erosion (geologic)
Erosion caused by geologic processes acting over long geologic periods andresulting in the wearing away of mountains and the building up of such landscapefeatures as flood plains and coastal plains. Synonym: natural erosion.
Erosion pavement
A surficial lag concentration or layer of gravel and other rock fragments thatremains on the soil surface after sheet or rill erosion or wind has removed the finersoil particles and that tends to protect the underlying soil from further erosion.
Erosion surface
A land surface shaped by the action of erosion, especially by running water.
Escarpment
A relatively continuous and steep slope or cliff breaking the general continuity ofmore gently sloping land surfaces and resulting from erosion or faulting. Mostcommonly applied to cliffs produced by differential erosion. Synonym: scarp.
Escarpment, bedrock (map symbol)
A relatively continuous and steep slope or cliff, produced by erosion or faulting,that breaks the general continuity of more gently sloping land surfaces. Exposedmaterial is hard or soft bedrock.
Escarpment, nonbedrock (map symbol)
A relatively continuous and steep slope or cliff, generally produced by erosion butin some places produced by faulting, that breaks the continuity of more gentlysloping land surfaces. Exposed earthy material is nonsoil or very shallow soil.
Esker
A long, narrow, sinuous, steep-sided ridge of stratified sand and gravel depositedas the bed of a stream flowing in an ice tunnel within or below the ice (subglacial)or between ice walls on top of the ice of a wasting glacier and left behind as highground when the ice melted. Eskers range in length from less than a kilometer tomore than 160 kilometers and in height from 3 to 30 meters.
Extrusive rock
Igneous rock derived from deep-seated molten matter (magma) deposited andcooled on the earth’s surface.
Fallow
Cropland left idle in order to restore productivity through accumulation of moisture.Summer fallow is common in regions of limited rainfall where cereal grain is grown.
Custom Soil Resource Report
31
The soil is tilled for at least one growing season for weed control anddecomposition of plant residue.
Fan remnant
A general term for landforms that are the remaining parts of older fan landforms,such as alluvial fans, that have been either dissected or partially buried.
Fertility, soil
The quality that enables a soil to provide plant nutrients, in adequate amounts andin proper balance, for the growth of specified plants when light, moisture,temperature, tilth, and other growth factors are favorable.
Fibric soil material (peat)
The least decomposed of all organic soil material. Peat contains a large amountof well preserved fiber that is readily identifiable according to botanical origin. Peathas the lowest bulk density and the highest water content at saturation of allorganic soil material.
Field moisture capacity
The moisture content of a soil, expressed as a percentage of the ovendry weight,after the gravitational, or free, water has drained away; the field moisture content2 or 3 days after a soaking rain; also called normal field capacity, normal moisturecapacity, or capillary capacity.
Fill slope
A sloping surface consisting of excavated soil material from a road cut. Itcommonly is on the downhill side of the road.
Fine textured soil
Sandy clay, silty clay, or clay.
Firebreak
An area cleared of flammable material to stop or help control creeping or runningfires. It also serves as a line from which to work and to facilitate the movement offirefighters and equipment. Designated roads also serve as firebreaks.
First bottom
An obsolete, informal term loosely applied to the lowest flood-plain steps that aresubject to regular flooding.
Flaggy soil material
Material that has, by volume, 15 to 35 percent flagstones. Very flaggy soil materialhas 35 to 60 percent flagstones, and extremely flaggy soil material has more than60 percent flagstones.
Flagstone
A thin fragment of sandstone, limestone, slate, shale, or (rarely) schist 6 to 15inches (15 to 38 centimeters) long.
Custom Soil Resource Report
32
Flood plain
The nearly level plain that borders a stream and is subject to flooding unlessprotected artificially.
Flood-plain landforms
A variety of constructional and erosional features produced by stream channelmigration and flooding. Examples include backswamps, flood-plain splays,meanders, meander belts, meander scrolls, oxbow lakes, and natural levees.
Flood-plain splay
A fan-shaped deposit or other outspread deposit formed where an overloadedstream breaks through a levee (natural or artificial) and deposits its material(commonly coarse grained) on the flood plain.
Flood-plain step
An essentially flat, terrace-like alluvial surface within a valley that is frequentlycovered by floodwater from the present stream; any approximately horizontalsurface still actively modified by fluvial scour and/or deposition. May occurindividually or as a series of steps.
Fluvial
Of or pertaining to rivers or streams; produced by stream or river action.
Foothills
A region of steeply sloping hills that fringes a mountain range or high-plateauescarpment. The hills have relief of as much as 1,000 feet (300 meters).
Footslope
The concave surface at the base of a hillslope. A footslope is a transition zonebetween upslope sites of erosion and transport (shoulders and backslopes) anddownslope sites of deposition (toeslopes).
Forb
Any herbaceous plant not a grass or a sedge.
Forest cover
All trees and other woody plants (underbrush) covering the ground in a forest.
Forest type
A stand of trees similar in composition and development because of given physicaland biological factors by which it may be differentiated from other stands.
Fragipan
A loamy, brittle subsurface horizon low in porosity and content of organic matterand low or moderate in clay but high in silt or very fine sand. A fragipan appearscemented and restricts roots. When dry, it is hard or very hard and has a higherbulk density than the horizon or horizons above. When moist, it tends to rupturesuddenly under pressure rather than to deform slowly.
Custom Soil Resource Report
33
Genesis, soil
The mode of origin of the soil. Refers especially to the processes or soil-formingfactors responsible for the formation of the solum, or true soil, from theunconsolidated parent material.
Gilgai
Commonly, a succession of microbasins and microknolls in nearly level areas orof microvalleys and microridges parallel with the slope. Typically, the microreliefof clayey soils that shrink and swell considerably with changes in moisture content.
Glaciofluvial deposits
Material moved by glaciers and subsequently sorted and deposited by streamsflowing from the melting ice. The deposits are stratified and occur in the form ofoutwash plains, valley trains, deltas, kames, eskers, and kame terraces.
Glaciolacustrine deposits
Material ranging from fine clay to sand derived from glaciers and deposited inglacial lakes mainly by glacial meltwater. Many deposits are bedded or laminated.
Gleyed soil
Soil that formed under poor drainage, resulting in the reduction of iron and otherelements in the profile and in gray colors.
Graded stripcropping
Growing crops in strips that grade toward a protected waterway.
Grassed waterway
A natural or constructed waterway, typically broad and shallow, seeded to grassas protection against erosion. Conducts surface water away from cropland.
Gravel
Rounded or angular fragments of rock as much as 3 inches (2 millimeters to 7.6centimeters) in diameter. An individual piece is a pebble.
Gravel pit (map symbol)
An open excavation from which soil and underlying material have been removedand used, without crushing, as a source of sand or gravel.
Gravelly soil material
Material that has 15 to 35 percent, by volume, rounded or angular rock fragments,not prominently flattened, as much as 3 inches (7.6 centimeters) in diameter.
Gravelly spot (map symbol)
A spot where the surface layer has more than 35 percent, by volume, rockfragments that are mostly less than 3 inches in diameter in an area that has lessthan 15 percent rock fragments.
Custom Soil Resource Report
34
Green manure crop (agronomy)
A soil-improving crop grown to be plowed under in an early stage of maturity orsoon after maturity.
Ground water
Water filling all the unblocked pores of the material below the water table.
Gully (map symbol)
A small, steep-sided channel caused by erosion and cut in unconsolidatedmaterials by concentrated but intermittent flow of water. The distinction betweena gully and a rill is one of depth. A gully generally is an obstacle to farm machineryand is too deep to be obliterated by ordinary tillage whereas a rill is of lesser depthand can be smoothed over by ordinary tillage.
Hard bedrock
Bedrock that cannot be excavated except by blasting or by the use of specialequipment that is not commonly used in construction.
Hard to reclaim
Reclamation is difficult after the removal of soil for construction and other uses.Revegetation and erosion control are extremely difficult.
Hardpan
A hardened or cemented soil horizon, or layer. The soil material is sandy, loamy,or clayey and is cemented by iron oxide, silica, calcium carbonate, or othersubstance.
Head slope (geomorphology)
A geomorphic component of hills consisting of a laterally concave area of ahillside, especially at the head of a drainageway. The overland waterflow isconverging.
Hemic soil material (mucky peat)
Organic soil material intermediate in degree of decomposition between the lessdecomposed fibric material and the more decomposed sapric material.
High-residue crops
Such crops as small grain and corn used for grain. If properly managed, residuefrom these crops can be used to control erosion until the next crop in the rotationis established. These crops return large amounts of organic matter to the soil.
Hill
A generic term for an elevated area of the land surface, rising as much as 1,000feet above surrounding lowlands, commonly of limited summit area and having awell defined outline. Slopes are generally more than 15 percent. The distinctionbetween a hill and a mountain is arbitrary and may depend on local usage.
Custom Soil Resource Report
35
Hillslope
A generic term for the steeper part of a hill between its summit and the drainageline, valley flat, or depression floor at the base of a hill.
Horizon, soil
A layer of soil, approximately parallel to the surface, having distinct characteristicsproduced by soil-forming processes. In the identification of soil horizons, anuppercase letter represents the major horizons. Numbers or lowercase letters thatfollow represent subdivisions of the major horizons. An explanation of thesubdivisions is given in the “Soil Survey Manual.” The major horizons of mineralsoil are as follows:
O horizon: An organic layer of fresh and decaying plant residue.L horizon: A layer of organic and mineral limnic materials, including coprogenousearth (sedimentary peat), diatomaceous earth, and marl.A horizon: The mineral horizon at or near the surface in which an accumulationof humified organic matter is mixed with the mineral material. Also, a plowedsurface horizon, most of which was originally part of a B horizon.E horizon: The mineral horizon in which the main feature is loss of silicate clay,iron, aluminum, or some combination of these.B horizon: The mineral horizon below an A horizon. The B horizon is in part a layerof transition from the overlying A to the underlying C horizon. The B horizon alsohas distinctive characteristics, such as (1) accumulation of clay, sesquioxides,humus, or a combination of these; (2) prismatic or blocky structure; (3) redder orbrowner colors than those in the A horizon; or (4) a combination of these.C horizon: The mineral horizon or layer, excluding indurated bedrock, that is littleaffected by soil-forming processes and does not have the properties typical of theoverlying soil material. The material of a C horizon may be either like or unlike thatin which the solum formed. If the material is known to differ from that in the solum,an Arabic numeral, commonly a 2, precedes the letter C.Cr horizon: Soft, consolidated bedrock beneath the soil.R layer: Consolidated bedrock beneath the soil. The bedrock commonly underliesa C horizon, but it can be directly below an A or a B horizon.M layer: A root-limiting subsoil layer consisting of nearly continuous, horizontallyoriented, human-manufactured materials.W layer: A layer of water within or beneath the soil.
Humus
The well decomposed, more or less stable part of the organic matter in mineralsoils.
Hydrologic soil groups
Refers to soils grouped according to their runoff potential. The soil properties thatinfluence this potential are those that affect the minimum rate of water infiltrationon a bare soil during periods after prolonged wetting when the soil is not frozen.These properties include depth to a seasonal high water table, the infiltration rate,and depth to a layer that significantly restricts the downward movement of water.The slope and the kind of plant cover are not considered but are separate factorsin predicting runoff.
Custom Soil Resource Report
36
Igneous rock
Rock that was formed by cooling and solidification of magma and that has notbeen changed appreciably by weathering since its formation. Major varietiesinclude plutonic and volcanic rock (e.g., andesite, basalt, and granite).
Illuviation
The movement of soil material from one horizon to another in the soil profile.Generally, material is removed from an upper horizon and deposited in a lowerhorizon.
Impervious soil
A soil through which water, air, or roots penetrate slowly or not at all. No soil isabsolutely impervious to air and water all the time.
Increasers
Species in the climax vegetation that increase in amount as the more desirableplants are reduced by close grazing. Increasers commonly are the shorter plantsand the less palatable to livestock.
Infiltration
The downward entry of water into the immediate surface of soil or other material,as contrasted with percolation, which is movement of water through soil layers ormaterial.
Infiltration capacity
The maximum rate at which water can infiltrate into a soil under a given set ofconditions.
Infiltration rate
The rate at which water penetrates the surface of the soil at any given instant,usually expressed in inches per hour. The rate can be limited by the infiltrationcapacity of the soil or the rate at which water is applied at the surface.
Intake rate
The average rate of water entering the soil under irrigation. Most soils have a fastinitial rate; the rate decreases with application time. Therefore, intake rate fordesign purposes is not a constant but is a variable depending on the net irrigationapplication. The rate of water intake, in inches per hour, is expressed as follows:
Very low: Less than 0.2Low: 0.2 to 0.4Moderately low: 0.4 to 0.75Moderate: 0.75 to 1.25Moderately high: 1.25 to 1.75High: 1.75 to 2.5Very high: More than 2.5
Custom Soil Resource Report
37
Interfluve
A landform composed of the relatively undissected upland or ridge between twoadjacent valleys containing streams flowing in the same general direction. Anelevated area between two drainageways that sheds water to thosedrainageways.
Interfluve (geomorphology)
A geomorphic component of hills consisting of the uppermost, comparatively levelor gently sloping area of a hill; shoulders of backwearing hillslopes can narrow theupland or can merge, resulting in a strongly convex shape.
Intermittent stream
A stream, or reach of a stream, that does not flow year-round but that is commonlydry for 3 or more months out of 12 and whose channel is generally below the localwater table. It flows only during wet periods or when it receives ground-waterdischarge or long, continued contributions from melting snow or other surface andshallow subsurface sources.
Invaders
On range, plants that encroach into an area and grow after the climax vegetationhas been reduced by grazing. Generally, plants invade following disturbance ofthe surface.
Iron depletions
See Redoximorphic features.
Irrigation
Application of water to soils to assist in production of crops. Methods of irrigationare:
Basin: Water is applied rapidly to nearly level plains surrounded by levees or dikes.Border: Water is applied at the upper end of a strip in which the lateral flow ofwater is controlled by small earth ridges called border dikes, or borders.Controlled flooding: Water is released at intervals from closely spaced field ditchesand distributed uniformly over the field.Corrugation: Water is applied to small, closely spaced furrows or ditches in fieldsof close-growing crops or in orchards so that it flows in only one direction.Drip (or trickle): Water is applied slowly and under low pressure to the surface ofthe soil or into the soil through such applicators as emitters, porous tubing, orperforated pipe.Furrow: Water is applied in small ditches made by cultivation implements. Furrowsare used for tree and row crops.Sprinkler: Water is sprayed over the soil surface through pipes or nozzles from apressure system.Subirrigation: Water is applied in open ditches or tile lines until the water table israised enough to wet the soil.Wild flooding: Water, released at high points, is allowed to flow onto an areawithout controlled distribution.
Custom Soil Resource Report
38
Kame
A low mound, knob, hummock, or short irregular ridge composed of stratified sandand gravel deposited by a subglacial stream as a fan or delta at the margin of amelting glacier; by a supraglacial stream in a low place or hole on the surface ofthe glacier; or as a ponded deposit on the surface or at the margin of stagnant ice.
Karst (topography)
A kind of topography that formed in limestone, gypsum, or other soluble rocks bydissolution and that is characterized by closed depressions, sinkholes, caves, andunderground drainage.
Knoll
A small, low, rounded hill rising above adjacent landforms.
Ksat
See Saturated hydraulic conductivity.
Lacustrine deposit
Material deposited in lake water and exposed when the water level is lowered orthe elevation of the land is raised.
Lake plain
A nearly level surface marking the floor of an extinct lake filled by well sorted,generally fine textured, stratified deposits, commonly containing varves.
Lake terrace
A narrow shelf, partly cut and partly built, produced along a lakeshore in front ofa scarp line of low cliffs and later exposed when the water level falls.
Landfill (map symbol)
An area of accumulated waste products of human habitation, either above orbelow natural ground level.
Landslide
A general, encompassing term for most types of mass movement landforms andprocesses involving the downslope transport and outward deposition of soil androck materials caused by gravitational forces; the movement may or may notinvolve saturated materials. The speed and distance of movement, as well as theamount of soil and rock material, vary greatly.
Large stones
Rock fragments 3 inches (7.6 centimeters) or more across. Large stonesadversely affect the specified use of the soil.
Lava flow (map symbol)
A solidified, commonly lobate body of rock formed through lateral, surfaceoutpouring of molten lava from a vent or fissure.
Custom Soil Resource Report
39
Leaching
The removal of soluble material from soil or other material by percolating water.
Levee (map symbol)
An embankment that confines or controls water, especially one built along thebanks of a river to prevent overflow onto lowlands.
Linear extensibility
Refers to the change in length of an unconfined clod as moisture content isdecreased from a moist to a dry state. Linear extensibility is used to determinethe shrink-swell potential of soils. It is an expression of the volume changebetween the water content of the clod at 1/3- or 1/10-bar tension (33kPa or 10kPatension) and oven dryness. Volume change is influenced by the amount and typeof clay minerals in the soil. The volume change is the percent change for the wholesoil. If it is expressed as a fraction, the resulting value is COLE, coefficient of linearextensibility.
Liquid limit
The moisture content at which the soil passes from a plastic to a liquid state.
Loam
Soil material that is 7 to 27 percent clay particles, 28 to 50 percent silt particles,and less than 52 percent sand particles.
Loess
Material transported and deposited by wind and consisting dominantly of silt-sizedparticles.
Low strength
The soil is not strong enough to support loads.
Low-residue crops
Such crops as corn used for silage, peas, beans, and potatoes. Residue fromthese crops is not adequate to control erosion until the next crop in the rotation isestablished. These crops return little organic matter to the soil.
Marl
An earthy, unconsolidated deposit consisting chiefly of calcium carbonate mixedwith clay in approximately equal proportions; formed primarily under freshwaterlacustrine conditions but also formed in more saline environments.
Marsh or swamp (map symbol)
A water-saturated, very poorly drained area that is intermittently or permanentlycovered by water. Sedges, cattails, and rushes are the dominant vegetation inmarshes, and trees or shrubs are the dominant vegetation in swamps. Not usedin map units where the named soils are poorly drained or very poorly drained.
Custom Soil Resource Report
40
Mass movement
A generic term for the dislodgment and downslope transport of soil and rockmaterial as a unit under direct gravitational stress.
Masses
See Redoximorphic features.
Meander belt
The zone within which migration of a meandering channel occurs; the flood-plainarea included between two imaginary lines drawn tangential to the outer bends ofactive channel loops.
Meander scar
A crescent-shaped, concave or linear mark on the face of a bluff or valley wall,produced by the lateral erosion of a meandering stream that impinged upon andundercut the bluff.
Meander scroll
One of a series of long, parallel, close-fitting, crescent-shaped ridges and troughsformed along the inner bank of a stream meander as the channel migrated laterallydown-valley and toward the outer bank.
Mechanical treatment
Use of mechanical equipment for seeding, brush management, and othermanagement practices.
Medium textured soil
Very fine sandy loam, loam, silt loam, or silt.
Mesa
A broad, nearly flat topped and commonly isolated landmass bounded by steepslopes or precipitous cliffs and capped by layers of resistant, nearly horizontalrocky material. The summit width is characteristically greater than the height ofthe bounding escarpments.
Metamorphic rock
Rock of any origin altered in mineralogical composition, chemical composition, orstructure by heat, pressure, and movement at depth in the earth’s crust. Nearlyall such rocks are crystalline.
Mine or quarry (map symbol)
An open excavation from which soil and underlying material have been removedand in which bedrock is exposed. Also denotes surface openings to undergroundmines.
Mine spoil
An accumulation of displaced earthy material, rock, or other waste materialremoved during mining or excavation. Also called earthy fill.
Custom Soil Resource Report
41
Mineral soil
Soil that is mainly mineral material and low in organic material. Its bulk density ismore than that of organic soil.
Minimum tillage
Only the tillage essential to crop production and prevention of soil damage.
Miscellaneous area
A kind of map unit that has little or no natural soil and supports little or novegetation.
Miscellaneous water (map symbol)
Small, constructed bodies of water that are used for industrial, sanitary, or miningapplications and that contain water most of the year.
Moderately coarse textured soil
Coarse sandy loam, sandy loam, or fine sandy loam.
Moderately fine textured soil
Clay loam, sandy clay loam, or silty clay loam.
Mollic epipedon
A thick, dark, humus-rich surface horizon (or horizons) that has high basesaturation and pedogenic soil structure. It may include the upper part of thesubsoil.
Moraine
In terms of glacial geology, a mound, ridge, or other topographically distinctaccumulation of unsorted, unstratified drift, predominantly till, deposited primarilyby the direct action of glacial ice in a variety of landforms. Also, a general term fora landform composed mainly of till (except for kame moraines, which arecomposed mainly of stratified outwash) that has been deposited by a glacier.Some types of moraines are disintegration, end, ground, kame, lateral,recessional, and terminal.
Morphology, soil
The physical makeup of the soil, including the texture, structure, porosity,consistence, color, and other physical, mineral, and biological properties of thevarious horizons, and the thickness and arrangement of those horizons in the soilprofile.
Mottling, soil
Irregular spots of different colors that vary in number and size. Descriptive termsare as follows: abundance—few, common, and many; size—fine, medium, andcoarse; and contrast—faint, distinct, and prominent. The size measurements areof the diameter along the greatest dimension. Fine indicates less than 5millimeters (about 0.2 inch); medium, from 5 to 15 millimeters (about 0.2 to 0.6inch); and coarse, more than 15 millimeters (about 0.6 inch).
Custom Soil Resource Report
42
Mountain
A generic term for an elevated area of the land surface, rising more than 1,000feet (300 meters) above surrounding lowlands, commonly of restricted summitarea (relative to a plateau) and generally having steep sides. A mountain canoccur as a single, isolated mass or in a group forming a chain or range. Mountainsare formed primarily by tectonic activity and/or volcanic action but can also beformed by differential erosion.
Muck
Dark, finely divided, well decomposed organic soil material. (See Sapric soilmaterial.)
Mucky peat
See Hemic soil material.
Mudstone
A blocky or massive, fine grained sedimentary rock in which the proportions ofclay and silt are approximately equal. Also, a general term for such material asclay, silt, claystone, siltstone, shale, and argillite and that should be used onlywhen the amounts of clay and silt are not known or cannot be precisely identified.
Munsell notation
A designation of color by degrees of three simple variables—hue, value, andchroma. For example, a notation of 10YR 6/4 is a color with hue of 10YR, valueof 6, and chroma of 4.
Natric horizon
A special kind of argillic horizon that contains enough exchangeable sodium tohave an adverse effect on the physical condition of the subsoil.
Neutral soil
A soil having a pH value of 6.6 to 7.3. (See Reaction, soil.)
Nodules
See Redoximorphic features.
Nose slope (geomorphology)
A geomorphic component of hills consisting of the projecting end (laterally convexarea) of a hillside. The overland waterflow is predominantly divergent. Noseslopes consist dominantly of colluvium and slope-wash sediments (for example,slope alluvium).
Nutrient, plant
Any element taken in by a plant essential to its growth. Plant nutrients are mainlynitrogen, phosphorus, potassium, calcium, magnesium, sulfur, iron, manganese,copper, boron, and zinc obtained from the soil and carbon, hydrogen, and oxygenobtained from the air and water.
Custom Soil Resource Report
43
Organic matter
Plant and animal residue in the soil in various stages of decomposition. Thecontent of organic matter in the surface layer is described as follows:
Very low: Less than 0.5 percentLow: 0.5 to 1.0 percentModerately low: 1.0 to 2.0 percentModerate: 2.0 to 4.0 percentHigh: 4.0 to 8.0 percentVery high: More than 8.0 percent
Outwash
Stratified and sorted sediments (chiefly sand and gravel) removed or “washed out”from a glacier by meltwater streams and deposited in front of or beyond the endmoraine or the margin of a glacier. The coarser material is deposited nearer tothe ice.
Outwash plain
An extensive lowland area of coarse textured glaciofluvial material. An outwashplain is commonly smooth; where pitted, it generally is low in relief.
Paleoterrace
An erosional remnant of a terrace that retains the surface form and alluvialdeposits of its origin but was not emplaced by, and commonly does not grade to,a present-day stream or drainage network.
Pan
A compact, dense layer in a soil that impedes the movement of water and thegrowth of roots. For example, hardpan, fragipan, claypan, plowpan, and trafficpan.
Parent material
The unconsolidated organic and mineral material in which soil forms.
Peat
Unconsolidated material, largely undecomposed organic matter, that hasaccumulated under excess moisture. (See Fibric soil material.)
Ped
An individual natural soil aggregate, such as a granule, a prism, or a block.
Pedisediment
A layer of sediment, eroded from the shoulder and backslope of an erosionalslope, that lies on and is being (or was) transported across a gently slopingerosional surface at the foot of a receding hill or mountain slope.
Custom Soil Resource Report
44
Pedon
The smallest volume that can be called “a soil.” A pedon is three dimensional andlarge enough to permit study of all horizons. Its area ranges from about 10 to 100square feet (1 square meter to 10 square meters), depending on the variability ofthe soil.
Percolation
The movement of water through the soil.
Perennial water (map symbol)
Small, natural or constructed lakes, ponds, or pits that contain water most of theyear.
Permafrost
Ground, soil, or rock that remains at or below 0 degrees C for at least 2 years. Itis defined on the basis of temperature and is not necessarily frozen.
pH value
A numerical designation of acidity and alkalinity in soil. (See Reaction, soil.)
Phase, soil
A subdivision of a soil series based on features that affect its use andmanagement, such as slope, stoniness, and flooding.
Piping
Formation of subsurface tunnels or pipelike cavities by water moving through thesoil.
Pitting
Pits caused by melting around ice. They form on the soil after plant cover isremoved.
Plastic limit
The moisture content at which a soil changes from semisolid to plastic.
Plasticity index
The numerical difference between the liquid limit and the plastic limit; the rangeof moisture content within which the soil remains plastic.
Plateau (geomorphology)
A comparatively flat area of great extent and elevation; specifically, an extensiveland region that is considerably elevated (more than 100 meters) above theadjacent lower lying terrain, is commonly limited on at least one side by an abruptdescent, and has a flat or nearly level surface. A comparatively large part of aplateau surface is near summit level.
Custom Soil Resource Report
45
Playa
The generally dry and nearly level lake plain that occupies the lowest parts ofclosed depressions, such as those on intermontane basin floors. Temporaryflooding occurs primarily in response to precipitation and runoff. Playa depositsare fine grained and may or may not have a high water table and saline conditions.
Plinthite
The sesquioxide-rich, humus-poor, highly weathered mixture of clay with quartzand other diluents. It commonly appears as red mottles, usually in platy, polygonal,or reticulate patterns. Plinthite changes irreversibly to an ironstone hardpan or toirregular aggregates on repeated wetting and drying, especially if it is exposedalso to heat from the sun. In a moist soil, plinthite can be cut with a spade. It is aform of laterite.
Plowpan
A compacted layer formed in the soil directly below the plowed layer.
Ponding
Standing water on soils in closed depressions. Unless the soils are artificiallydrained, the water can be removed only by percolation or evapotranspiration.
Poorly graded
Refers to a coarse grained soil or soil material consisting mainly of particles ofnearly the same size. Because there is little difference in size of the particles,density can be increased only slightly by compaction.
Pore linings
See Redoximorphic features.
Potential native plant community
See Climax plant community.
Potential rooting depth (effective rooting depth)
Depth to which roots could penetrate if the content of moisture in the soil wereadequate. The soil has no properties restricting the penetration of roots to thisdepth.
Prescribed burning
Deliberately burning an area for specific management purposes, under theappropriate conditions of weather and soil moisture and at the proper time of day.
Productivity, soil
The capability of a soil for producing a specified plant or sequence of plants underspecific management.
Profile, soil
A vertical section of the soil extending through all its horizons and into the parentmaterial.
Custom Soil Resource Report
46
Proper grazing use
Grazing at an intensity that maintains enough cover to protect the soil and maintainor improve the quantity and quality of the desirable vegetation. This practiceincreases the vigor and reproduction capacity of the key plants and promotes theaccumulation of litter and mulch necessary to conserve soil and water.
Rangeland
Land on which the potential natural vegetation is predominantly grasses, grasslikeplants, forbs, or shrubs suitable for grazing or browsing. It includes naturalgrasslands, savannas, many wetlands, some deserts, tundras, and areas thatsupport certain forb and shrub communities.
Reaction, soil
A measure of acidity or alkalinity of a soil, expressed as pH values. A soil thattests to pH 7.0 is described as precisely neutral in reaction because it is neitheracid nor alkaline. The degrees of acidity or alkalinity, expressed as pH values,are:
Ultra acid: Less than 3.5Extremely acid: 3.5 to 4.4Very strongly acid: 4.5 to 5.0Strongly acid: 5.1 to 5.5Moderately acid: 5.6 to 6.0Slightly acid: 6.1 to 6.5Neutral: 6.6 to 7.3Slightly alkaline: 7.4 to 7.8Moderately alkaline: 7.9 to 8.4Strongly alkaline: 8.5 to 9.0Very strongly alkaline: 9.1 and higher
Red beds
Sedimentary strata that are mainly red and are made up largely of sandstone andshale.
Redoximorphic concentrations
See Redoximorphic features.
Redoximorphic depletions
See Redoximorphic features.
Redoximorphic features
Redoximorphic features are associated with wetness and result from alternatingperiods of reduction and oxidation of iron and manganese compounds in the soil.Reduction occurs during saturation with water, and oxidation occurs when the soilis not saturated. Characteristic color patterns are created by these processes. Thereduced iron and manganese ions may be removed from a soil if vertical or lateralfluxes of water occur, in which case there is no iron or manganese precipitationin that soil. Wherever the iron and manganese are oxidized and precipitated, they
Custom Soil Resource Report
47
form either soft masses or hard concretions or nodules. Movement of iron andmanganese as a result of redoximorphic processes in a soil may result inredoximorphic features that are defined as follows:
1. Redoximorphic concentrations.—These are zones of apparent accumulationof iron-manganese oxides, including:A. Nodules and concretions, which are cemented bodies that can be
removed from the soil intact. Concretions are distinguished from noduleson the basis of internal organization. A concretion typically hasconcentric layers that are visible to the naked eye. Nodules do not havevisible organized internal structure; and
B. Masses, which are noncemented concentrations of substances withinthe soil matrix; and
C. Pore linings, i.e., zones of accumulation along pores that may be eithercoatings on pore surfaces or impregnations from the matrix adjacent tothe pores.
2. Redoximorphic depletions.—These are zones of low chroma (chromas lessthan those in the matrix) where either iron-manganese oxides alone or bothiron-manganese oxides and clay have been stripped out, including:A. Iron depletions, i.e., zones that contain low amounts of iron and
manganese oxides but have a clay content similar to that of the adjacentmatrix; and
B. Clay depletions, i.e., zones that contain low amounts of iron,manganese, and clay (often referred to as silt coatings or skeletans).
3. Reduced matrix.—This is a soil matrix that has low chroma in situ butundergoes a change in hue or chroma within 30 minutes after the soil materialhas been exposed to air.
Reduced matrix
See Redoximorphic features.
Regolith
All unconsolidated earth materials above the solid bedrock. It includes materialweathered in place from all kinds of bedrock and alluvial, glacial, eolian, lacustrine,and pyroclastic deposits.
Relief
The relative difference in elevation between the upland summits and the lowlandsor valleys of a given region.
Residuum (residual soil material)
Unconsolidated, weathered or partly weathered mineral material thataccumulated as bedrock disintegrated in place.
Rill
A very small, steep-sided channel resulting from erosion and cut in unconsolidatedmaterials by concentrated but intermittent flow of water. A rill generally is not anobstacle to wheeled vehicles and is shallow enough to be smoothed over byordinary tillage.
Custom Soil Resource Report
48
Riser
The vertical or steep side slope (e.g., escarpment) of terraces, flood-plain steps,or other stepped landforms; commonly a recurring part of a series of natural,steplike landforms, such as successive stream terraces.
Road cut
A sloping surface produced by mechanical means during road construction. It iscommonly on the uphill side of the road.
Rock fragments
Rock or mineral fragments having a diameter of 2 millimeters or more; forexample, pebbles, cobbles, stones, and boulders.
Rock outcrop (map symbol)
An exposure of bedrock at the surface of the earth. Not used where the namedsoils of the surrounding map unit are shallow over bedrock or where “Rockoutcrop” is a named component of the map unit.
Root zone
The part of the soil that can be penetrated by plant roots.
Runoff
The precipitation discharged into stream channels from an area. The water thatflows off the surface of the land without sinking into the soil is called surface runoff.Water that enters the soil before reaching surface streams is called ground-waterrunoff or seepage flow from ground water.
Saline soil
A soil containing soluble salts in an amount that impairs growth of plants. A salinesoil does not contain excess exchangeable sodium.
Saline spot (map symbol)
An area where the surface layer has an electrical conductivity of 8 mmhos/cmmore than the surface layer of the named soils in the surrounding map unit. Thesurface layer of the surrounding soils has an electrical conductivity of 2 mmhos/cm or less.
Sand
As a soil separate, individual rock or mineral fragments from 0.05 millimeter to 2.0millimeters in diameter. Most sand grains consist of quartz. As a soil textural class,a soil that is 85 percent or more sand and not more than 10 percent clay.
Sandstone
Sedimentary rock containing dominantly sand-sized particles.
Custom Soil Resource Report
49
Sandy spot (map symbol)
A spot where the surface layer is loamy fine sand or coarser in areas where thesurface layer of the named soils in the surrounding map unit is very fine sandyloam or finer.
Sapric soil material (muck)
The most highly decomposed of all organic soil material. Muck has the leastamount of plant fiber, the highest bulk density, and the lowest water content atsaturation of all organic soil material.
Saturated hydraulic conductivity (Ksat)
The ease with which pores of a saturated soil transmit water. Formally, theproportionality coefficient that expresses the relationship of the rate of watermovement to hydraulic gradient in Darcy’s Law, a law that describes the rate ofwater movement through porous media. Commonly abbreviated as “Ksat.” Termsdescribing saturated hydraulic conductivity are:
Very high: 100 or more micrometers per second (14.17 or more inches per hour)High: 10 to 100 micrometers per second (1.417 to 14.17 inches per hour)Moderately high: 1 to 10 micrometers per second (0.1417 inch to 1.417 inchesper hour)Moderately low: 0.1 to 1 micrometer per second (0.01417 to 0.1417 inch per hour)Low: 0.01 to 0.1 micrometer per second (0.001417 to 0.01417 inch per hour)Very low: Less than 0.01 micrometer per second (less than 0.001417 inch perhour).
To convert inches per hour to micrometers per second, multiply inches per hourby 7.0572. To convert micrometers per second to inches per hour, multiplymicrometers per second by 0.1417.
Saturation
Wetness characterized by zero or positive pressure of the soil water. Underconditions of saturation, the water will flow from the soil matrix into an unlinedauger hole.
Scarification
The act of abrading, scratching, loosening, crushing, or modifying the surface toincrease water absorption or to provide a more tillable soil.
Sedimentary rock
A consolidated deposit of clastic particles, chemical precipitates, or organicremains accumulated at or near the surface of the earth under normal lowtemperature and pressure conditions. Sedimentary rocks include consolidatedequivalents of alluvium, colluvium, drift, and eolian, lacustrine, and marinedeposits. Examples are sandstone, siltstone, mudstone, claystone, shale,conglomerate, limestone, dolomite, and coal.
Sequum
A sequence consisting of an illuvial horizon and the overlying eluvial horizon. (SeeEluviation.)
Custom Soil Resource Report
50
Series, soil
A group of soils that have profiles that are almost alike, except for differences intexture of the surface layer. All the soils of a series have horizons that are similarin composition, thickness, and arrangement.
Severely eroded spot (map symbol)
An area where, on the average, 75 percent or more of the original surface layerhas been lost because of accelerated erosion. Not used in map units in which“severely eroded,”“very severely eroded,” or “gullied” is part of the map unit name.
Shale
Sedimentary rock that formed by the hardening of a deposit of clay, silty clay, orsilty clay loam and that has a tendency to split into thin layers.
Sheet erosion
The removal of a fairly uniform layer of soil material from the land surface by theaction of rainfall and surface runoff.
Short, steep slope (map symbol)
A narrow area of soil having slopes that are at least two slope classes steeperthan the slope class of the surrounding map unit.
Shoulder
The convex, erosional surface near the top of a hillslope. A shoulder is a transitionfrom summit to backslope.
Shrink-swell
The shrinking of soil when dry and the swelling when wet. Shrinking and swellingcan damage roads, dams, building foundations, and other structures. It can alsodamage plant roots.
Shrub-coppice dune
A small, streamlined dune that forms around brush and clump vegetation.
Side slope (geomorphology)
A geomorphic component of hills consisting of a laterally planar area of a hillside.The overland waterflow is predominantly parallel. Side slopes are dominantlycolluvium and slope-wash sediments.
Silica
A combination of silicon and oxygen. The mineral form is called quartz.
Silica-sesquioxide ratio
The ratio of the number of molecules of silica to the number of molecules ofalumina and iron oxide. The more highly weathered soils or their clay fractions inwarm-temperate, humid regions, and especially those in the tropics, generallyhave a low ratio.
Custom Soil Resource Report
51
Silt
As a soil separate, individual mineral particles that range in diameter from theupper limit of clay (0.002 millimeter) to the lower limit of very fine sand (0.05millimeter). As a soil textural class, soil that is 80 percent or more silt and lessthan 12 percent clay.
Siltstone
An indurated silt having the texture and composition of shale but lacking its finelamination or fissility; a massive mudstone in which silt predominates over clay.
Similar soils
Soils that share limits of diagnostic criteria, behave and perform in a similarmanner, and have similar conservation needs or management requirements forthe major land uses in the survey area.
Sinkhole (map symbol)
A closed, circular or elliptical depression, commonly funnel shaped, characterizedby subsurface drainage and formed either by dissolution of the surface ofunderlying bedrock (e.g., limestone, gypsum, or salt) or by collapse of underlyingcaves within bedrock. Complexes of sinkholes in carbonate-rock terrain are themain components of karst topography.
Site index
A designation of the quality of a forest site based on the height of the dominantstand at an arbitrarily chosen age. For example, if the average height attained bydominant and codominant trees in a fully stocked stand at the age of 50 years is75 feet, the site index is 75.
Slickensides (pedogenic)
Grooved, striated, and/or glossy (shiny) slip faces on structural peds, such aswedges; produced by shrink-swell processes, most commonly in soils that havea high content of expansive clays.
Slide or slip (map symbol)
A prominent landform scar or ridge caused by fairly recent mass movement ordescent of earthy material resulting from failure of earth or rock under shear stressalong one or several surfaces.
Slope
The inclination of the land surface from the horizontal. Percentage of slope is thevertical distance divided by horizontal distance, then multiplied by 100. Thus, aslope of 20 percent is a drop of 20 feet in 100 feet of horizontal distance.
Slope alluvium
Sediment gradually transported down the slopes of mountains or hills primarily bynonchannel alluvial processes (i.e., slope-wash processes) and characterized byparticle sorting. Lateral particle sorting is evident on long slopes. In a profilesequence, sediments may be distinguished by differences in size and/or specificgravity of rock fragments and may be separated by stone lines. Burnished peds
Custom Soil Resource Report
52
and sorting of rounded or subrounded pebbles or cobbles distinguish thesematerials from unsorted colluvial deposits.
Slow refill
The slow filling of ponds, resulting from restricted water transmission in the soil.
Slow water movement
Restricted downward movement of water through the soil. See Saturatedhydraulic conductivity.
Sodic (alkali) soil
A soil having so high a degree of alkalinity (pH 8.5 or higher) or so high apercentage of exchangeable sodium (15 percent or more of the totalexchangeable bases), or both, that plant growth is restricted.
Sodic spot (map symbol)
An area where the surface layer has a sodium adsorption ratio that is at least 10more than that of the surface layer of the named soils in the surrounding map unit.The surface layer of the surrounding soils has a sodium adsorption ratio of 5 orless.
Sodicity
The degree to which a soil is affected by exchangeable sodium. Sodicity isexpressed as a sodium adsorption ratio (SAR) of a saturation extract, or the ratioof Na+ to Ca++ + Mg++. The degrees of sodicity and their respective ratios are:
Slight: Less than 13:1Moderate: 13-30:1Strong: More than 30:1
Sodium adsorption ratio (SAR)
A measure of the amount of sodium (Na) relative to calcium (Ca) and magnesium(Mg) in the water extract from saturated soil paste. It is the ratio of the Naconcentration divided by the square root of one-half of the Ca + Mg concentration.
Soft bedrock
Bedrock that can be excavated with trenching machines, backhoes, small rippers,and other equipment commonly used in construction.
Soil
A natural, three-dimensional body at the earth’s surface. It is capable of supportingplants and has properties resulting from the integrated effect of climate and livingmatter acting on earthy parent material, as conditioned by relief and by thepassage of time.
Soil separates
Mineral particles less than 2 millimeters in equivalent diameter and rangingbetween specified size limits. The names and sizes, in millimeters, of separatesrecognized in the United States are as follows:
Custom Soil Resource Report
53
Very coarse sand: 2.0 to 1.0Coarse sand: 1.0 to 0.5Medium sand: 0.5 to 0.25Fine sand: 0.25 to 0.10Very fine sand: 0.10 to 0.05Silt: 0.05 to 0.002Clay: Less than 0.002
Solum
The upper part of a soil profile, above the C horizon, in which the processes ofsoil formation are active. The solum in soil consists of the A, E, and B horizons.Generally, the characteristics of the material in these horizons are unlike those ofthe material below the solum. The living roots and plant and animal activities arelargely confined to the solum.
Spoil area (map symbol)
A pile of earthy materials, either smoothed or uneven, resulting from humanactivity.
Stone line
In a vertical cross section, a line formed by scattered fragments or a discrete layerof angular and subangular rock fragments (commonly a gravel- or cobble-sizedlag concentration) that formerly was draped across a topographic surface and waslater buried by additional sediments. A stone line generally caps material that wassubject to weathering, soil formation, and erosion before burial. Many stone linesseem to be buried erosion pavements, originally formed by sheet and rill erosionacross the land surface.
Stones
Rock fragments 10 to 24 inches (25 to 60 centimeters) in diameter if rounded or15 to 24 inches (38 to 60 centimeters) in length if flat.
Stony
Refers to a soil containing stones in numbers that interfere with or prevent tillage.
Stony spot (map symbol)
A spot where 0.01 to 0.1 percent of the soil surface is covered by rock fragmentsthat are more than 10 inches in diameter in areas where the surrounding soil hasno surface stones.
Strath terrace
A type of stream terrace; formed as an erosional surface cut on bedrock and thinlymantled with stream deposits (alluvium).
Stream terrace
One of a series of platforms in a stream valley, flanking and more or less parallelto the stream channel, originally formed near the level of the stream; represents
Custom Soil Resource Report
54
the remnants of an abandoned flood plain, stream bed, or valley floor producedduring a former state of fluvial erosion or deposition.
Stripcropping
Growing crops in a systematic arrangement of strips or bands that providevegetative barriers to wind erosion and water erosion.
Structure, soil
The arrangement of primary soil particles into compound particles or aggregates.The principal forms of soil structure are:
Platy: Flat and laminatedPrismatic: Vertically elongated and having flat topsColumnar: Vertically elongated and having rounded topsAngular blocky: Having faces that intersect at sharp angles (planes)Subangular blocky: Having subrounded and planar faces (no sharp angles)Granular: Small structural units with curved or very irregular faces
Structureless soil horizons are defined as follows:
Single grained: Entirely noncoherent (each grain by itself), as in loose sandMassive: Occurring as a coherent mass
Stubble mulch
Stubble or other crop residue left on the soil or partly worked into the soil. Itprotects the soil from wind erosion and water erosion after harvest, duringpreparation of a seedbed for the next crop, and during the early growing periodof the new crop.
Subsoil
Technically, the B horizon; roughly, the part of the solum below plow depth.
Subsoiling
Tilling a soil below normal plow depth, ordinarily to shatter a hardpan or claypan.
Substratum
The part of the soil below the solum.
Subsurface layer
Any surface soil horizon (A, E, AB, or EB) below the surface layer.
Summer fallow
The tillage of uncropped land during the summer to control weeds and allowstorage of moisture in the soil for the growth of a later crop. A practice commonin semiarid regions, where annual precipitation is not enough to produce a cropevery year. Summer fallow is frequently practiced before planting winter grain.
Custom Soil Resource Report
55
Summit
The topographically highest position of a hillslope. It has a nearly level (planar oronly slightly convex) surface.
Surface layer
The soil ordinarily moved in tillage, or its equivalent in uncultivated soil, rangingin depth from 4 to 10 inches (10 to 25 centimeters). Frequently designated as the“plow layer,” or the “Ap horizon.”
Surface soil
The A, E, AB, and EB horizons, considered collectively. It includes all subdivisionsof these horizons.
Talus
Rock fragments of any size or shape (commonly coarse and angular) derived fromand lying at the base of a cliff or very steep rock slope. The accumulated mass ofsuch loose broken rock formed chiefly by falling, rolling, or sliding.
Taxadjuncts
Soils that cannot be classified in a series recognized in the classification system.Such soils are named for a series they strongly resemble and are designated astaxadjuncts to that series because they differ in ways too small to be ofconsequence in interpreting their use and behavior. Soils are recognized astaxadjuncts only when one or more of their characteristics are slightly outside therange defined for the family of the series for which the soils are named.
Terminal moraine
An end moraine that marks the farthest advance of a glacier. It typically has theform of a massive arcuate or concentric ridge, or complex of ridges, and isunderlain by till and other types of drift.
Terrace (conservation)
An embankment, or ridge, constructed across sloping soils on the contour or at aslight angle to the contour. The terrace intercepts surface runoff so that watersoaks into the soil or flows slowly to a prepared outlet. A terrace in a field generallyis built so that the field can be farmed. A terrace intended mainly for drainage hasa deep channel that is maintained in permanent sod.
Terrace (geomorphology)
A steplike surface, bordering a valley floor or shoreline, that represents the formerposition of a flood plain, lake, or seashore. The term is usually applied both to therelatively flat summit surface (tread) that was cut or built by stream or wave actionand to the steeper descending slope (scarp or riser) that has graded to a lowerbase level of erosion.
Terracettes
Small, irregular steplike forms on steep hillslopes, especially in pasture, formedby creep or erosion of surficial materials that may be induced or enhanced bytrampling of livestock, such as sheep or cattle.
Custom Soil Resource Report
56
Texture, soil
The relative proportions of sand, silt, and clay particles in a mass of soil. The basictextural classes, in order of increasing proportion of fine particles, are sand, loamysand, sandy loam, loam, silt loam, silt, sandy clay loam, clay loam, silty clay loam,sandy clay, silty clay, and clay. The sand, loamy sand, and sandy loam classesmay be further divided by specifying “coarse,”“fine,” or “very fine.”
Thin layer
Otherwise suitable soil material that is too thin for the specified use.
Till
Dominantly unsorted and nonstratified drift, generally unconsolidated anddeposited directly by a glacier without subsequent reworking by meltwater, andconsisting of a heterogeneous mixture of clay, silt, sand, gravel, stones, andboulders; rock fragments of various lithologies are embedded within a finer matrixthat can range from clay to sandy loam.
Till plain
An extensive area of level to gently undulating soils underlain predominantly bytill and bounded at the distal end by subordinate recessional or end moraines.
Tilth, soil
The physical condition of the soil as related to tillage, seedbed preparation,seedling emergence, and root penetration.
Toeslope
The gently inclined surface at the base of a hillslope. Toeslopes in profile arecommonly gentle and linear and are constructional surfaces forming the lower partof a hillslope continuum that grades to valley or closed-depression floors.
Topsoil
The upper part of the soil, which is the most favorable material for plant growth.It is ordinarily rich in organic matter and is used to topdress roadbanks, lawns,and land affected by mining.
Trace elements
Chemical elements, for example, zinc, cobalt, manganese, copper, and iron, insoils in extremely small amounts. They are essential to plant growth.
Tread
The flat to gently sloping, topmost, laterally extensive slope of terraces, flood-plainsteps, or other stepped landforms; commonly a recurring part of a series of naturalsteplike landforms, such as successive stream terraces.
Tuff
A generic term for any consolidated or cemented deposit that is 50 percent ormore volcanic ash.
Custom Soil Resource Report
57
Upland
An informal, general term for the higher ground of a region, in contrast with a low-lying adjacent area, such as a valley or plain, or for land at a higher elevation thanthe flood plain or low stream terrace; land above the footslope zone of the hillslopecontinuum.
Valley fill
The unconsolidated sediment deposited by any agent (water, wind, ice, or masswasting) so as to fill or partly fill a valley.
Variegation
Refers to patterns of contrasting colors assumed to be inherited from the parentmaterial rather than to be the result of poor drainage.
Varve
A sedimentary layer or a lamina or sequence of laminae deposited in a body ofstill water within a year. Specifically, a thin pair of graded glaciolacustrine layersseasonally deposited, usually by meltwater streams, in a glacial lake or other bodyof still water in front of a glacier.
Very stony spot (map symbol)
A spot where 0.1 to 3.0 percent of the soil surface is covered by rock fragmentsthat are more than 10 inches in diameter in areas where the surface of thesurrounding soil is covered by less than 0.01 percent stones.
Water bars
Smooth, shallow ditches or depressional areas that are excavated at an angleacross a sloping road. They are used to reduce the downward velocity of waterand divert it off and away from the road surface. Water bars can easily be drivenover if constructed properly.
Weathering
All physical disintegration, chemical decomposition, and biologically inducedchanges in rocks or other deposits at or near the earth’s surface by atmosphericor biologic agents or by circulating surface waters but involving essentially notransport of the altered material.
Well graded
Refers to soil material consisting of coarse grained particles that are welldistributed over a wide range in size or diameter. Such soil normally can be easilyincreased in density and bearing properties by compaction. Contrasts with poorlygraded soil.
Wet spot (map symbol)
A somewhat poorly drained to very poorly drained area that is at least two drainageclasses wetter than the named soils in the surrounding map unit.
Custom Soil Resource Report
58

Wilting point (or permanent wilting point)
The moisture content of soil, on an ovendry basis, at which a plant (specifically asunflower) wilts so much that it does not recover when placed in a humid, darkchamber.
Windthrow
The uprooting and tipping over of trees by the wind.
Custom Soil Resource Report
59

1
APPENDIX E
Drawing of Irrigation Design
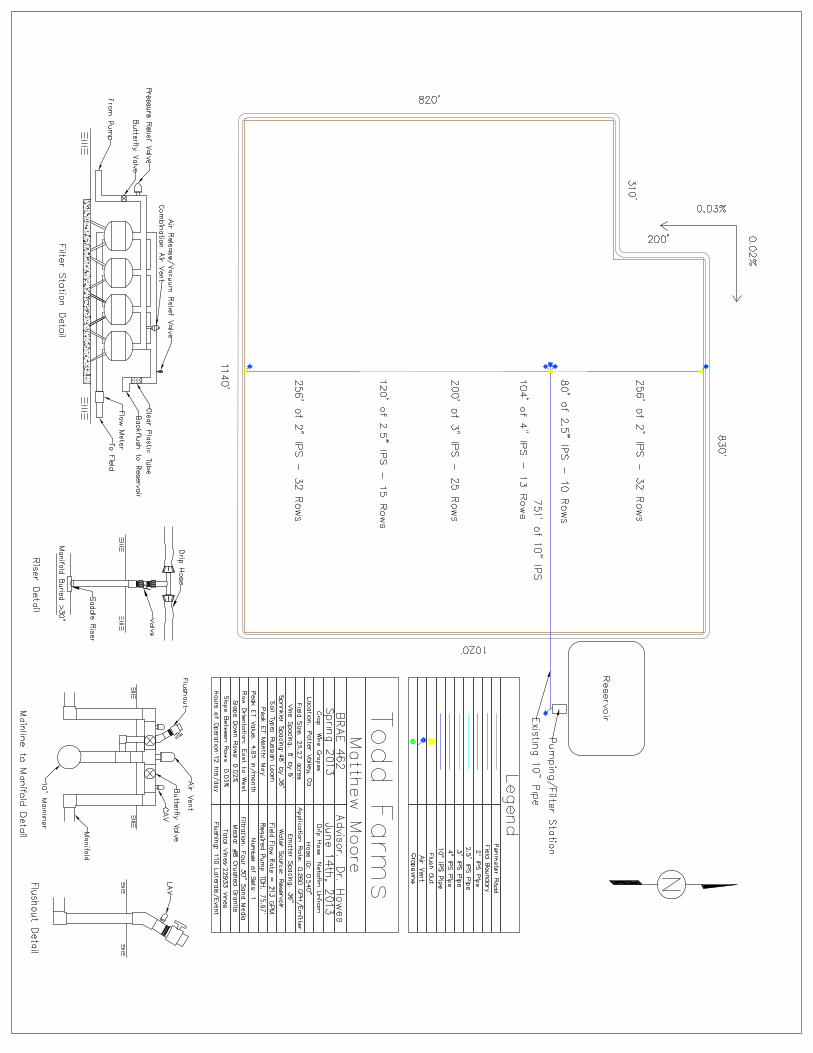
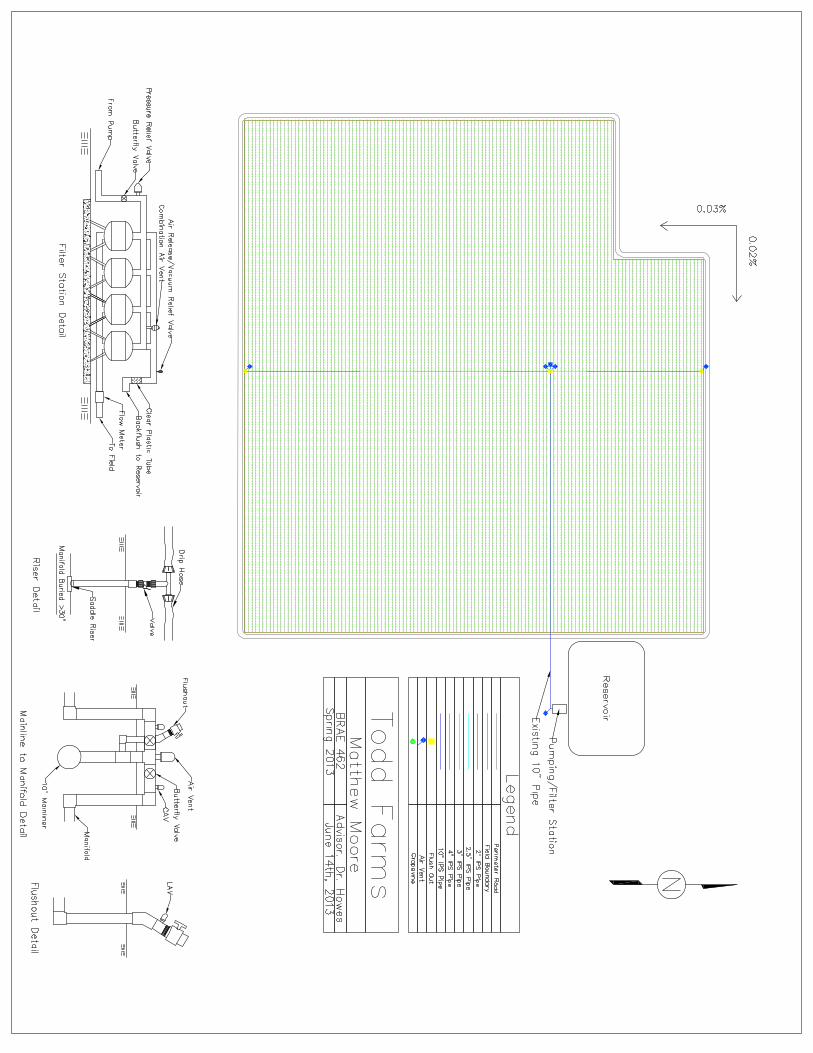
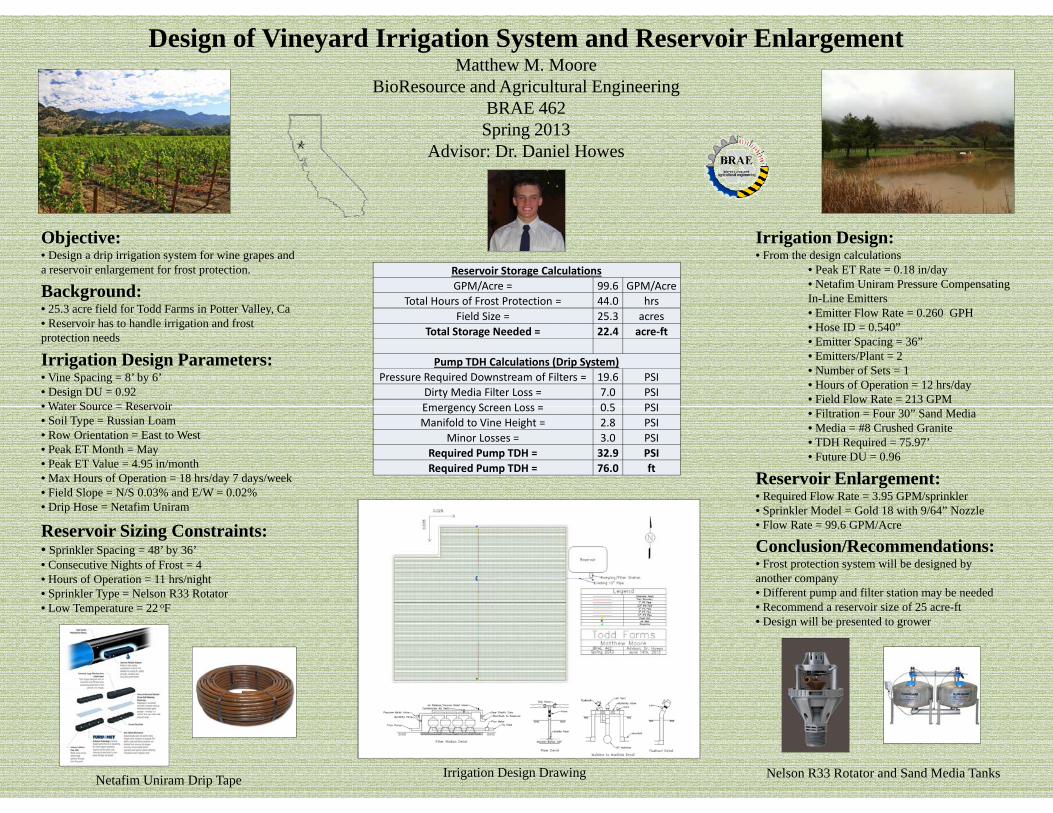
Design of Vineyard Irrigation System and Reservoir EnlargementMatthew M. Moore
BioResource and Agricultural EngineeringBRAE 462BRAE 462
Spring 2013Advisor: Dr. Daniel Howes
Objective:• Design a drip irrigation system for wine grapes and a reservoir enlargement for frost protection.
Background:• 25 3 acre field for Todd Farms in Potter Valley Ca
Irrigation Design:• From the design calculations
• Peak ET Rate = 0.18 in/day• Netafim Uniram Pressure Compensating In-Line Emitters
E i Fl R 0 260 GPH
Reservoir Storage CalculationsGPM/Acre = 99.6 GPM/Acre
Total Hours of Frost Protection = 44.0 hrs• 25.3 acre field for Todd Farms in Potter Valley, Ca• Reservoir has to handle irrigation and frost protection needs
Irrigation Design Parameters:• Vine Spacing = 8’ by 6’• Design DU = 0.92• Water Source = Reservoir
• Emitter Flow Rate = 0.260 GPH• Hose ID = 0.540”• Emitter Spacing = 36”• Emitters/Plant = 2• Number of Sets = 1• Hours of Operation = 12 hrs/day• Field Flow Rate = 213 GPM
Field Size = 25.3 acresTotal Storage Needed = 22.4 acre‐ft
Pump TDH Calculations (Drip System)Pressure Required Downstream of Filters = 19.6 PSI
Dirty Media Filter Loss = 7.0 PSIEmergency Screen Loss = 0 5 PSI• Water Source = Reservoir
• Soil Type = Russian Loam• Row Orientation = East to West• Peak ET Month = May• Peak ET Value = 4.95 in/month• Max Hours of Operation = 18 hrs/day 7 days/week• Field Slope = N/S 0.03% and E/W = 0.02%
D i H N t fi U i
• Filtration = Four 30” Sand Media• Media = #8 Crushed Granite• TDH Required = 75.97’• Future DU = 0.96
Reservoir Enlargement:• Required Flow Rate = 3.95 GPM/sprinkler
Emergency Screen Loss = 0.5 PSIManifold to Vine Height = 2.8 PSI
Minor Losses = 3.0 PSIRequired Pump TDH = 32.9 PSIRequired Pump TDH = 76.0 ft
• Drip Hose = Netafim Uniram
Reservoir Sizing Constraints:• Sprinkler Spacing = 48’ by 36’• Consecutive Nights of Frost = 4• Hours of Operation = 11 hrs/night• Sprinkler Type = Nelson R33 Rotator
Conclusion/Recommendations:• Frost protection system will be designed by another company• Different pump and filter station may be needed
• Sprinkler Model = Gold 18 with 9/64” Nozzle• Flow Rate = 99.6 GPM/Acre
• Low Temperature = 22 oF • Recommend a reservoir size of 25 acre-ft• Design will be presented to grower
Netafim Uniram Drip Tape Irrigation Design Drawing Nelson R33 Rotator and Sand Media Tanks