Embed Size (px)
Citation preview
Designing for Collaborative Reflection Gabriela Marcu
CMU-HCII-14-106 December 2014
Human-Computer Interaction Institute
School of Computer Science Carnegie Mellon University
Pittsburgh, Pennsylvania 15213
Thesis Committee Anind Dey (Co-chair), Carnegie Mellon University Sara Kiesler (Co-chair), Carnegie Mellon University
Jill Lehman, Carnegie Mellon University Madhu Reddy, The Pennsylvania State University
Mary Czerwinski, Microsoft Research
Submitted in partial fulfillment of the requirements for the degree of Doctor of Philosophy.
Copyright © 2014 Gabriela Marcu. All rights reserved.
This work was supported by the National Science Foundation under Grant No. CCF-1029549, and by a National Science Foundation Graduate Research Fellowship, a Siebel Scholarship, and a Microsoft Research Graduate Women’s Scholarship.
2
Keywords Health information technology, coordination of care, electronic health records, special education, behavioral and mental health services, social informatics, organizational information systems, organization science, action research, anthropology, human-centered design, participatory design, user experience design, field studies, human-computer interaction, computer-supported cooperative work, ubiquitous computing, pervasive computing.
3
Abstract
A rise in chronic conditions has put a strain on our healthcare system. Treatment for chronic conditions
spans time, agencies, and providers, making coordination a complex problem. Information systems such
as electronic health records should be helping with the challenge of coordination, but research shows
that often they do not. This thesis aims to alleviate this problem by examining the design of health
information technology with an emphasis on social and organizational processes. The focus of this thesis
is on the implications of continuous care over time: the shift from a single provider to team-based
services, the emergence of patients and families as primary caregivers in the home, and the diffusion of
data-driven decision making. I investigated these trends to understand the role of data in coordinating
long-term care, and inform the design of information systems.
I studied behavioral and mental health services for children, which are coordinated across clinical, home,
and special education settings. I found coordination that was unstructured, unpredictable, and adaptive.
I developed a conceptual framework, collaborative reflection, to describe my observations and
distinguish my findings from the processes of time-critical and protocol-based care. I also found ways in
which coordination was not data-driven, due to a lack of support and tools. Collaborative reflection thus
illustrates how long-term coordination works when it is data-driven, informing a discussion of what is
needed for coordination to be data-driven.
Based on the process of collaborative reflection, and using participatory design, I developed Lilypad—a
tablet-based information system for data-driven coordination. I conducted a five-month deployment
study of Lilypad in the field, to examine its social impact. This study validated designing for collaborative
reflection to improve the use of data in coordination.
The contributions of this thesis are: a description of unstructured and informal workflow that drives
long-term coordination in health services; the theoretical construct of collaborative reflection to inform
the design of systems that improve coordination; a field deployment validation, demonstrating how
designing for collaborative reflection improves coordination and avoids common unintended
consequences of health information technology.
4
Acknowledgements In this work I have been aided, influenced, and accompanied by many wonderful people. Above all, I
thank them for helping me to do what I love and love what I do.
Having come to the end of this process, I maintain that I do not know what the downsides are to being
co-advised. My advisors deserve much credit for this. Anind Dey provided unwavering support and
mentorship through the hardest parts and lowest points in this process. I aspire to do for my future
students what you have done for me. Some of my greatest moments of triumph during this process were
a hard-earned stamp of approval from Sara Kiesler. Your kindness and supportive guidance enabled me
to work as hard as I did for them.
My committee shared in my passion for this work, and pushed me to honor the vision I had for it. Jill
Lehman helped me learn to be thoughtful and conscientious in my research, so I can realize my dream of
creating technology that will truly have a positive impact on the world. Mary Czerwinski jumped into
this with enthusiasm and encouragement, and provided positivity during a process that is all about
critique. Madhu Reddy wasted no time putting his mark on this work with lasting influence, believing in
me from the moment we met, and being a wonderful mentor during the critical juncture that is
transitioning out of being a PhD student.
This work was accomplished by an impeccable team, which enabled me to reach much further with this
dissertation than I could have imagined. To my team: thank you for being in the thick of it with me.
Your dedication, talents, and moral support made me fearless. Working with all of you was a highlight of
this entire experience: Shilpa Balaji, Quintin Carlson, Andy Chen, Rebecca Chen, Hayden Demerson,
Debra Gladwin, Jillian Goodwyn, Justin Greet, Ryhan Hassan, Arthur Hong, Anu Jayasinghe, Sabrina Li,
Westin Lohne, Angela McCarthy, Greg Nicholas, Chanamon Ratanalert, Gabrielle Rivkin, Kevin
Schaefer, Cristina Shin, and Julia Teitelbaum.
I must acknowledge and sincerely thank the many people who have participated in my research,
welcoming me into their lives, homes, and workplaces. Working with you is what gets me up in the
morning. Thank you for enabling me to have my dream job.
5
It is an honor to be among the scholars and alumni of the Human-Computer Interaction Institute. Gary
Hsieh and Erin Walker set an example for me, in both work and life, that I never stopped turning to even
after they graduated. Although they weren’t there with me in the years that followed, their example,
advice, and kindness stayed with me. Amy Ogan, Chris Harrison, and Jessica Hammer helped me learn
how to best communicate my research and give fantastic talks that do this work justice. The following
people injected life, wisdom, and joy into this process through acts both big and small: Adrian de Freitas,
Tawanna Dillahunt, Samantha Finkelstein, Beka Gulotta, Christian Koehler, Min Kyung Lee, Matthew
Lee, Ian Li, Bilge Mutlu, Stephen Oney, Jeff Rzeszotarski, Julia Schwarz, Dan Tasse, Tatiana Vlahovic,
Ruth Wylie, and the Ubicomp Lab.
Jessica Stanley, Kevin Topolski, Indra Szegedy, and the HCII administrative staff, you are amazing. I
almost wish you weren’t so helpful and efficient, so that we could have spent more time together.
Thank you to those who helped me put an emphasis on the ‘H’ in HCI. My pursuits would have meant
nothing without a human aspect, both personally and professionally. To paraphrase Maya Angelou, I
may forget what you said, I may even forget what you did, but I will never forget how you made me feel.
Carol Frieze and Mary Widom, our partnership and friendship had the ability to make the stresses of
being a PhD student fade away and made me feel at home when I most needed it. Haakon Faste, thank
you for reminding me how to have fun with my work and positive impact with every choice. Chloe Fan,
Afsaneh Doryab, Juan David Hincapie-Ramos, and Mijay Pavon, how wonderful it is that your friendship
and loyalty do not fade with time or distance. You help me keep perspective in life.
I wrote much of this thesis sitting in Pittsburgh’s homegrown cafes—especially Square Café—fueled as
much by their smiling faces as their bottomless cups of coffee. During an excruciatingly solitary writing
process, those minor social transactions felt not so minor and kept me going. Thank you for doing what
you do for your community.
6
Finally, to my biggest supporters, I am driven by wanting to be worthy of your support and faith in me.
Queenie, my kindred spirit, I don’t know where I’d be without you.
Jakob Bardram, thank you for taking a chance on a young and eager PhD student who hadn’t quite found
her way yet. Though only a few months, my visit had a profound impact on my development as a
researcher and an individual.
To the Abowd academic family: you are the big, crazy, extended family that I never had. Thank you for
modeling what it means to be a contributing and influential member of a research community. Thank
you, too, for exemplifying work-life balance and convincing me that it can be done in academia.
Jen Mankoff, the way you work tirelessly for your students, family, and community is an inspiration.
Thank you for always being there for me.
Gillian Hayes, some years ago you were a newly minted PhD and Assistant Professor, and I told you that
I wanted to be you when I grew up. I cannot claim to have done it as well, and I have much more to learn
from you – but I grew up to be you, as I had set out to do. I also grew up enough to now be ready to be
me. I have gotten here because I had you as a role model and supporter. You inspired my passion for
HCI and propelled me into my academic career, for which I don’t know how to thank you except to work
hard to make you proud.
Mom and Dad, you gave me the confidence, tenacity, curiosity, and work ethic that made this possible.
Cristian and Alex, you’ve helped me learn to temper the aforementioned qualities so I can live a little,
too. Across time zones or continents, you have always been there for me. You are what family should be.
7
Table of Contents
Chapter 1. Coordination of chronic care
1.1. The changing face of health services
1.2. Coordination in behavioral and mental health services
1.3. Why long-term coordination is different
1.4. Bringing anthropology to HCI
1.5. Contributions
Chapter 2. What is the role of data in coordination?
2.1. Organizational context
2.2 A paradoxical persistence of paper
2.3. Why paper persists in the workplace
2.4. Methods
2.5. Findings
2.5.1. Why they use paper to collect data
2.5.1.1. Data needs are complex and not standardized
2.5.1.2. Immediate demands of their job interfere with thorough in situ data collection
2.5.1.3. Existing technology for data collection is inadequate
2.5.2. How HIT can improve sharing and use of collected data
2.5.2.1. Data sheets are idiosyncratic and not useful without human mediation
2.5.2.2. Improved communication with parents could improve interventions
2.5.2.3. Staff are willing, and even eager, to incorporate technology
2.6. Conclusions
Chapter 3. Collaborative reflection: how coordination works when it is data-driven
3.1. Data-driven coordination in behavioral and mental health services
3.2. Methods
3.3. Findings
3.3.1. Unstructured
3.3.2. Mobile
3.3.3. Reciprocally interdependent
3.3.4. Long-term
8
3.4. Collaborative reflection
3.4.1. When collaborative reflection is not data-driven
Chapter 4. What is needed for coordination to be data-driven?
4.1. Three barriers to data-driven practices
4.1.1. Record keepers have difficulty capturing representative data
4.1.2. Decision makers do not have adequate access to informative data
4.1.3. Intuition and face-to-face communication are more prevalent drivers than data
4.2. Standardization and the unfulfilled promise of health information technology
4.3. Changing focus from standardized practices to social practices
4.3.1. Sensemaking and reflection in organizations
4.3.2. Organizational features can dictate the design of appropriate HIT
Chapter 5. The Lilypad prototype: How can a system support data-driven coordination?
5.1. Design process
5.2. Designing Lilypad to support data-driven coordination
5.2.1. Record keepers need support for capturing representative data
5.2.2. Decision makers need access to informative data
5.2.3. Data needs to complement intuition and face-to-face communication
5.3. Lilypad within the process of collaborative reflection
Chapter 6. Lilypad in the wild: A field deployment validating Lilypad as an organic system
6.1. Methods
6.2. Findings
6.2.1. Diffuse roles and responsibilities
6.2.2. Flexible plans and changing goals
6.2.3. Authority based on knowledge rather than position
6.2.4. Multidirectional communication
6.3. Conclusion
9
Chapter 1 Coordination of Chronic Care
“The system for healthcare delivery in the United States, in regard to physical and mental health, is neither logical nor a system. In reality, it is a nonsystem… a conglomerate of health practitioners,
agencies, and institutions, all of which operate more or less independently. There often is little or no effective planning or coordination.”
William C. Cockerham, Sociology of Mental Disorder
Coordination of health services is one of the defining challenges of today’s healthcare system. The U.S.
healthcare system has grown highly complex due to: a high pace of advances in science and technology;
increasing expectations from patients who are more informed and better connected than ever; higher
complexity of U.S. laws, regulations, and payment; and an increase in chronic illness. Half of Americans
have at least one chronic condition, defined as a physical or mental illness that lasts more than 3
months. Long-term care of chronic conditions requires the coordination of multiple providers and
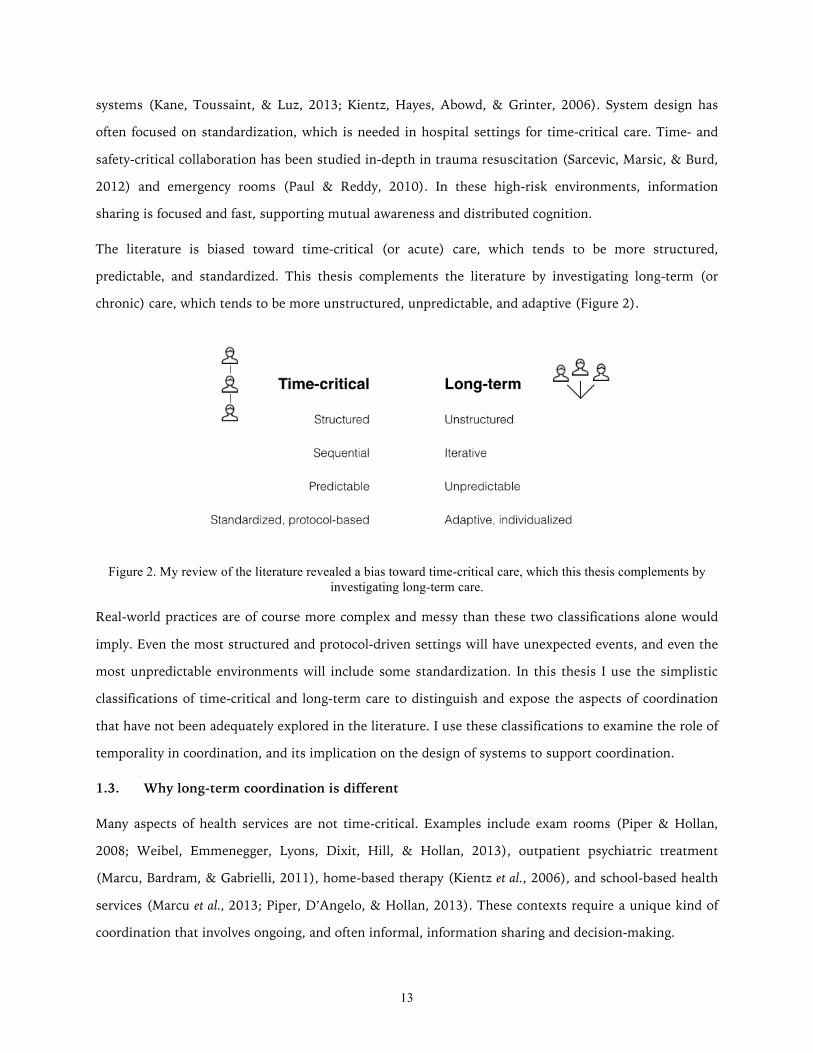
agencies, resulting in 75% of direct medical expenses devoted to chronic conditions. There are so many
providers that 17% of the U.S. workforce is employed in medical care. The complexity of coordination
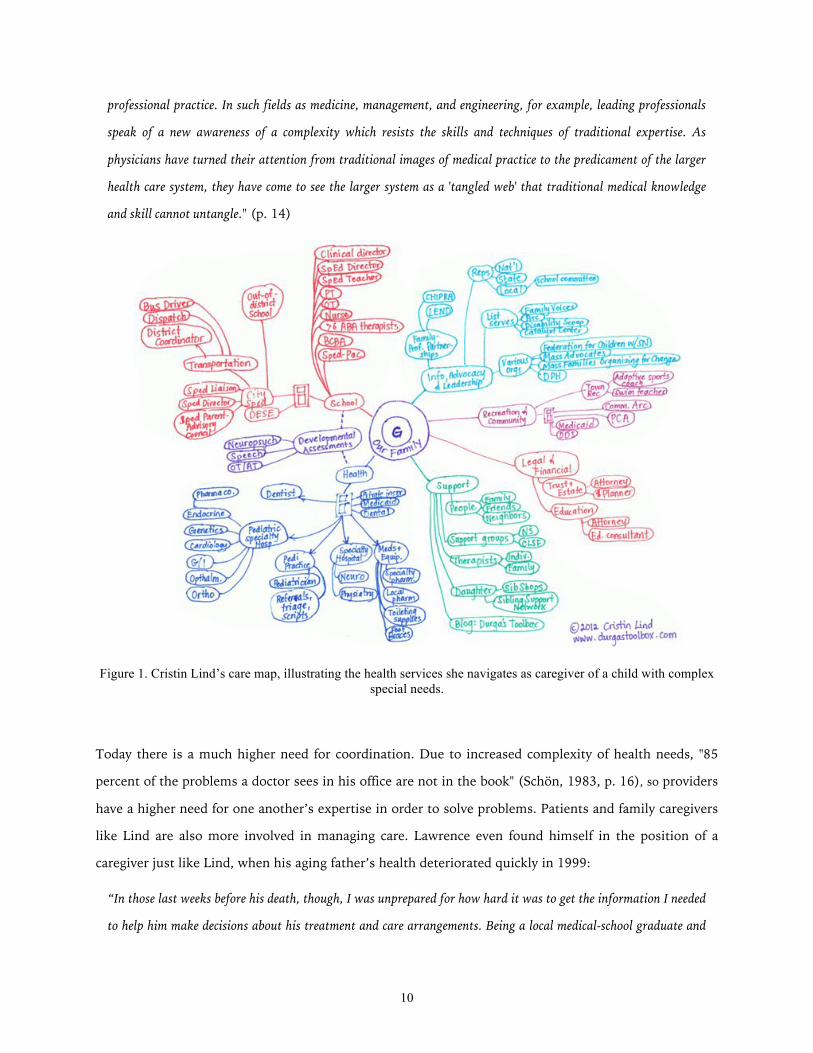
among so many providers is illustrated in Figure 1, a care map drawn and shared by a blogger to show
how many health services she must navigate as a caregiver for her son, who has complex health care
needs (Lind, 2012).
1.1. The changing face of health services
It is important for providers and agencies to coordinate care over time, but they do not have the support
or the incentives to do so. Coordination is a relatively new need, because medicine began as an
autonomous and paternalistic practice. David Lawrence, Chairman Emeritus of Kaiser Permanente, the
largest non-profit health care system in the world, explains the root of the problem: “medicine began as
a craft practiced by independent, autonomous professionals who relied on one another only when they
had to… this model persists to this day” (2003, p. 11-12). Donald Schön (1983) explains that a reliance
on one provider’s knowledge and expertise no longer works for addressing problems within a large and
complex healthcare system—a problem which affects other professions as well:
"Professional knowledge is mismatched to the changing character of the situations of practice—the complexity,
uncertainty, instability, uniqueness, and value conflicts which are increasingly perceived as central to the world of
10
professional practice. In such fields as medicine, management, and engineering, for example, leading professionals
speak of a new awareness of a complexity which resists the skills and techniques of traditional expertise. As
physicians have turned their attention from traditional images of medical practice to the predicament of the larger
health care system, they have come to see the larger system as a 'tangled web' that traditional medical knowledge
and skill cannot untangle." (p. 14)
Figure 1. Cristin Lind’s care map, illustrating the health services she navigates as caregiver of a child with complex special needs.
Today there is a much higher need for coordination. Due to increased complexity of health needs, "85
percent of the problems a doctor sees in his office are not in the book" (Schön, 1983, p. 16), so providers
have a higher need for one another’s expertise in order to solve problems. Patients and family caregivers
like Lind are also more involved in managing care. Lawrence even found himself in the position of a
caregiver just like Lind, when his aging father’s health deteriorated quickly in 1999:
“In those last weeks before his death, though, I was unprepared for how hard it was to get the information I needed
to help him make decisions about his treatment and care arrangements. Being a local medical-school graduate and
11
an executive in a large medical organization didn’t help. I was just a son, joining my brother and sister and father’s
wife to help our father navigate a medical-care system ill-suited to deliver what he required.” (p. xiv)
That Lawrence’s experience navigating decisions and providers was as difficult as Lind’s, despite his
expertise and well-connected position, is telling. The complexity of today’s health care system makes it
extremely difficult to navigate even for an expert. In part, Lind’s account indicates that services are
difficult to navigate due to remnants of a paternalistic and autonomous model of medicine. She wrote,
for example, that showing providers the care map in Figure 1 seemed to remind them that they are not
her son’s only provider:
“I can’t say for sure, but it felt as if they treated me with a bit more respect when they could see how many balls I
was juggling. One doctor helped me prioritize upcoming appointments once she saw what we were dealing with. In
one case, one said that they felt humbled to realize that all this time they considered themselves so central to my
son’s care, yet there were so many other people in his life who were doing just as much.” (Lind, 2012)
In this thesis I address the need described by a growing body of literature as continuity of care: to provide a
sense that services are connected over time and place by improving information exchange and
communication among providers (Gulliford, Naithani, & Morgan, 2006; Jee & Cabana, 2006; Miller,
Condin, McKellin, Shaw, Klassen, & Sheps, 2009). My focus is on coordination among providers and
caregivers of children with special needs, illustrated by Lind in Figure 1. The challenges of caring for a
child with special needs require coordination across various agencies. At the core of this coordination is
information sharing across home and school. A child’s daily life revolves around these settings, so care is
coordinated primarily by caregivers in the home and providers within a specialized school setting.
1.2. Coordination in behavioral and mental health services
I studied collocated team members who provide behavioral and mental health services in special
education programs. These programs integrate treatment typical of psychiatric clinics within the school
day, enabling a child to live at home and attend school while receiving support to address behavioral,
emotional, or social challenges on a daily basis. Children in these programs have diagnoses such as
autism spectrum disorders, neurological impairments, and emotional disturbance. Symptoms and
behaviors of these disorders vary and change over time, making it important to document behavior and
progress (or lack of progress) from treatment interventions. Decision-making is complex due to the
long-term nature of treatment and the invisibility of underlying conditions. Teams rely on manually
12
recorded behavioral data (e.g., social behaviors, aggressive behaviors, behaviors related to skills for
independent living) for evidence of progress.
Similar to studies that have examined electronic medical records (Park, Pine, & Chen, 2013), I was
interested in what the appropriation of paper-based tools could tell us about information and
coordination needs not being met by HIT. The context of special education provided a perspective on
formal and informal, objective and subjective aspects of coordination. Contrasting the more rigid and
standardized use of HIT in hospitals, in this context HIT use and protocols are only partially
standardized and require a significant amount of flexibility (Marcu, Tassini, Carlson, Goodwyn, Rivkin,
Schaefer, Dey, & Kiesler, 2013). Behavioral data are formally and informally recorded to evaluate the
effectiveness of behavioral interventions and psychiatric medications. Treatment teams coordinate in
order to subjectively interpret, and act on, long-term behavioral data. Objective and automated measures
cannot be used, though research in computational behavioral science aims to make this possible in the
future.
I was surprised to find that coordination for a child with special needs is driven by behavioral data
recorded almost exclusively on paper. Despite the emergence of electronic health records and a general
trend toward paperless service delivery, what I observed in this context was a reliance on paper despite
open frustration with its limitations. Existing health information technology (HIT) was mismatched to
the coordination needs in this context, and efforts to transition away from paper had been unsuccessful.
To address this problem, I answer the following research questions:
• What is the role of data in coordination?
• What is needed for coordination to be data-driven?
• How can an information system support data-driven coordination?
By posing these research questions within the context of behavioral and mental health services, this
thesis addresses a gap in the literature. Most of the literature on health service collaboration has been
drawn from studies of hospital environments – e.g., Abraham & Reddy, 2008; Bardram & Bossen, 2005;
Mentis, 2010; Paul & Reddy, 2010; Park, Pine, & Chen, 2013; Sarcevic, Marsis, & Burd, 2012. Health
services in hospitals involve a large number of protocols and standardized workflows for data-driven
decision-making. Examples of formalized structure are the coordination of schedules, staff, patients,
space, and equipment (Abraham & Reddy, 2008), computerized physician order entry systems
(Niazkhani, Pirnejad, Berg, & Aarts, 2009), and diagnosis and treatment aided by decision support
13
systems (Kane, Toussaint, & Luz, 2013; Kientz, Hayes, Abowd, & Grinter, 2006). System design has
often focused on standardization, which is needed in hospital settings for time-critical care. Time- and
safety-critical collaboration has been studied in-depth in trauma resuscitation (Sarcevic, Marsic, & Burd,
2012) and emergency rooms (Paul & Reddy, 2010). In these high-risk environments, information
sharing is focused and fast, supporting mutual awareness and distributed cognition.
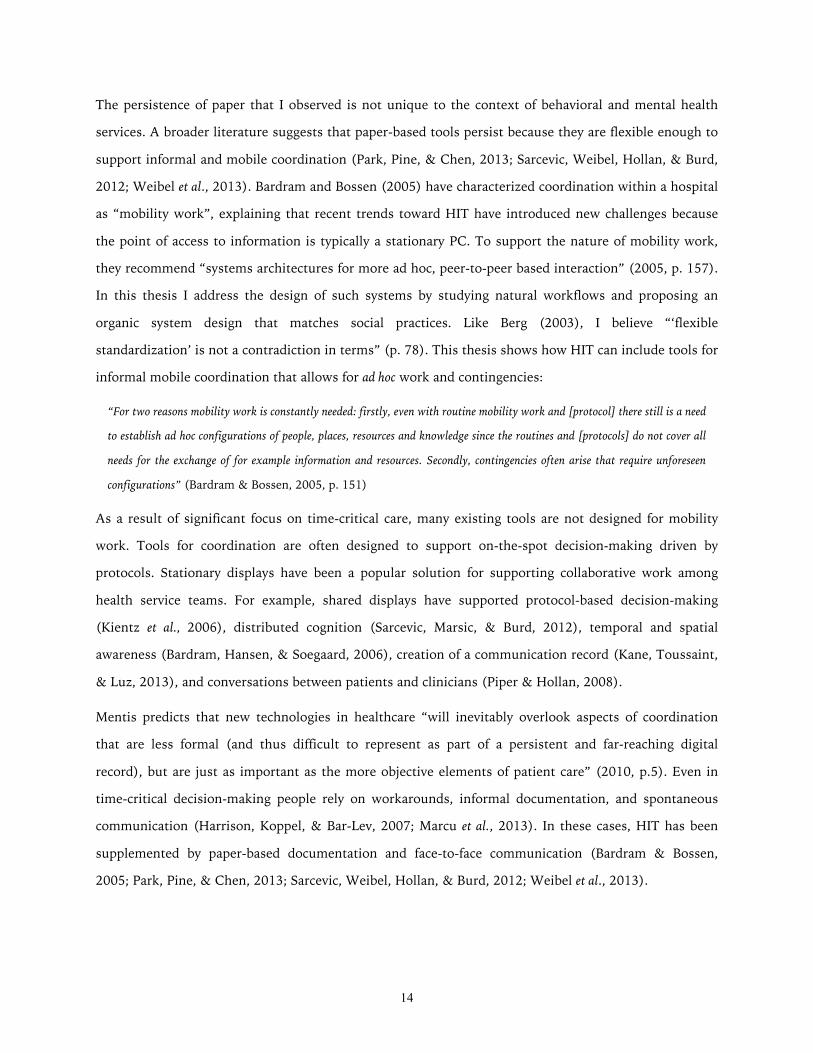
The literature is biased toward time-critical (or acute) care, which tends to be more structured,
predictable, and standardized. This thesis complements the literature by investigating long-term (or
chronic) care, which tends to be more unstructured, unpredictable, and adaptive (Figure 2).
Figure 2. My review of the literature revealed a bias toward time-critical care, which this thesis complements by investigating long-term care.
Real-world practices are of course more complex and messy than these two classifications alone would
imply. Even the most structured and protocol-driven settings will have unexpected events, and even the
most unpredictable environments will include some standardization. In this thesis I use the simplistic
classifications of time-critical and long-term care to distinguish and expose the aspects of coordination
that have not been adequately explored in the literature. I use these classifications to examine the role of
temporality in coordination, and its implication on the design of systems to support coordination.
1.3. Why long-term coordination is different
Many aspects of health services are not time-critical. Examples include exam rooms (Piper & Hollan,
2008; Weibel, Emmenegger, Lyons, Dixit, Hill, & Hollan, 2013), outpatient psychiatric treatment
(Marcu, Bardram, & Gabrielli, 2011), home-based therapy (Kientz et al., 2006), and school-based health
services (Marcu et al., 2013; Piper, D’Angelo, & Hollan, 2013). These contexts require a unique kind of
coordination that involves ongoing, and often informal, information sharing and decision-making.
14
The persistence of paper that I observed is not unique to the context of behavioral and mental health
services. A broader literature suggests that paper-based tools persist because they are flexible enough to
support informal and mobile coordination (Park, Pine, & Chen, 2013; Sarcevic, Weibel, Hollan, & Burd,
2012; Weibel et al., 2013). Bardram and Bossen (2005) have characterized coordination within a hospital
as “mobility work”, explaining that recent trends toward HIT have introduced new challenges because
the point of access to information is typically a stationary PC. To support the nature of mobility work,
they recommend “systems architectures for more ad hoc, peer-to-peer based interaction” (2005, p. 157).
In this thesis I address the design of such systems by studying natural workflows and proposing an
organic system design that matches social practices. Like Berg (2003), I believe “‘flexible
standardization’ is not a contradiction in terms” (p. 78). This thesis shows how HIT can include tools for
informal mobile coordination that allows for ad hoc work and contingencies:
“For two reasons mobility work is constantly needed: firstly, even with routine mobility work and [protocol] there still is a need
to establish ad hoc configurations of people, places, resources and knowledge since the routines and [protocols] do not cover all
needs for the exchange of for example information and resources. Secondly, contingencies often arise that require unforeseen
configurations” (Bardram & Bossen, 2005, p. 151)
As a result of significant focus on time-critical care, many existing tools are not designed for mobility
work. Tools for coordination are often designed to support on-the-spot decision-making driven by
protocols. Stationary displays have been a popular solution for supporting collaborative work among
health service teams. For example, shared displays have supported protocol-based decision-making
(Kientz et al., 2006), distributed cognition (Sarcevic, Marsic, & Burd, 2012), temporal and spatial
awareness (Bardram, Hansen, & Soegaard, 2006), creation of a communication record (Kane, Toussaint,
& Luz, 2013), and conversations between patients and clinicians (Piper & Hollan, 2008).
Mentis predicts that new technologies in healthcare “will inevitably overlook aspects of coordination
that are less formal (and thus difficult to represent as part of a persistent and far-reaching digital
record), but are just as important as the more objective elements of patient care” (2010, p.5). Even in
time-critical decision-making people rely on workarounds, informal documentation, and spontaneous
communication (Harrison, Koppel, & Bar-Lev, 2007; Marcu et al., 2013). In these cases, HIT has been
supplemented by paper-based documentation and face-to-face communication (Bardram & Bossen,
2005; Park, Pine, & Chen, 2013; Sarcevic, Weibel, Hollan, & Burd, 2012; Weibel et al., 2013).
15
1.4. Bringing anthropology to HCI
The literature therefore identifies a need to focus more on social practices and subjective aspects of
work. Berg (2003) summarizes the state of HIT this way:
“Currently … health information management deals first and foremost with the challenge of integrating health
information systems in health care work in such a way that the quality of that work is improved. This sounds
obvious, but … it is not. Health information management is about the complex task of handling technical
innovation simultaneously with organizational transformation.” (p. 2)
The design and integration of HIT, then, is a wicked problem – a complex, ill defined, and
interconnected social problem that is difficult to solve (Buchanan, 1992). The purpose of this thesis is
not to solve this problem, but to learn about it, especially through design and evaluation of a system in
context. The goals of this work are to influence and inform future directions of HIT, a task described by
Kolko (2012):
“Because of the role of design in developing infrastructure, designers can play a central role in mitigating the
negative consequences of wicked problems and positioning the broad trajectory of culture in new and more desirable
directions. This mitigation is not an easy, quick, or solitary exercise. While traditional circles of entrepreneurship
focus on speed and agility, designing for impact is about staying the course through methodical, rigorous iteration.
Due to the system qualities of these large problems … this demands interdisciplinary collaboration, and most
importantly, perseverance.” (p. 11)
To this end, I have used anthropology-inspired design methods in this work. In my methodology I drew
from approaches used in a variety of disciplines, including action research (HCI: Hayes, 2014), action
design research (information science: Sein, Henfridsson, Purao, Rossi, & Lindgren, 2011), community-
based participatory design (public health: Israel, Eng, Schulz, & Parker, 2012), and applied social
research (human services: Monette, Sullivan, & DeJong, 2010). These approaches have rich traditions in
other disciplines, but are relatively new to the design of HIT, where they can address wicked problems
by combining technical problem solving (what Schön calls professional, craft-based problem solving)
with social problem solving (the alternative to what Forsythe (1992) calls ‘deleting the social’ and
muting the voice of users). I used these methods iteratively and followed emerging themes, because
“bringing new technology into being is a complex process in which goals are discovered, determined,
and modified along the way” (Schön, 1983). Each activity informed the others: I conducted fieldwork to
16
drive design work, I applied action research and participatory design in the development of a prototype,
and I evaluated the prototype through a field study.
I began formative fieldwork at seven organizations providing behavioral and mental health services, to
understand the role of coordination. I then focused on two of these organizations to investigate what is
needed for coordination to be data-driven, and begin design work on a prototype, Lilypad. Lilypad is
designed to support data-driven coordination, and was validated in a field deployment at one of the
organizations. Themes that emerged from my formative fieldwork across seven organizations aligned
with those that I found in broader literature. Therefore, the formative work focused on services primarily
related to autism and special education, but this thesis makes contributions to a broader range of health
services. Similarly, the design work delved deeper into two of the organizations and the deployment was
in one organization, but frequent comparisons to my own and others’ data enabled me to make broader
contributions to health service coordination.
1.5. Contributions
This thesis contributes to human-computer interaction, health informatics, social informatics, and user
experience design. I describe naturalistic coordination in behavioral and mental health services, and use
this context to explain the role of data in long-term coordination (Chapter 2). I provide a theoretical
construct, collaborative reflection, to show how long-term coordination works when it is data-driven and
distinguish this from when it is not data-driven (Chapter 3). Comparing my findings to other health
service settings and themes in the literature, I then use the characteristics of an organic system to isolate
and describe what is needed for coordination to be data-driven (Chapter 4). Finally, the Lilypad
prototype (Chapter 5) and results of a field deployment (Chapter 6) illustrate and validate this approach.
The contributions of this thesis are: a description of unstructured and informal workflow that drives
long-term coordination in health services; the theoretical construct of collaborative reflection to inform
the design of systems that improve coordination; a field deployment validation, demonstrating how
designing for collaborative reflection improves coordination and avoids common unintended
consequences of HIT.
References
Abraham, J. & Reddy, M.C. (2008). Moving patients around: a field study of coordination between clinical and non-clinical staff in hospitals. In Proceedings of CSCW ‘08, 225-228.
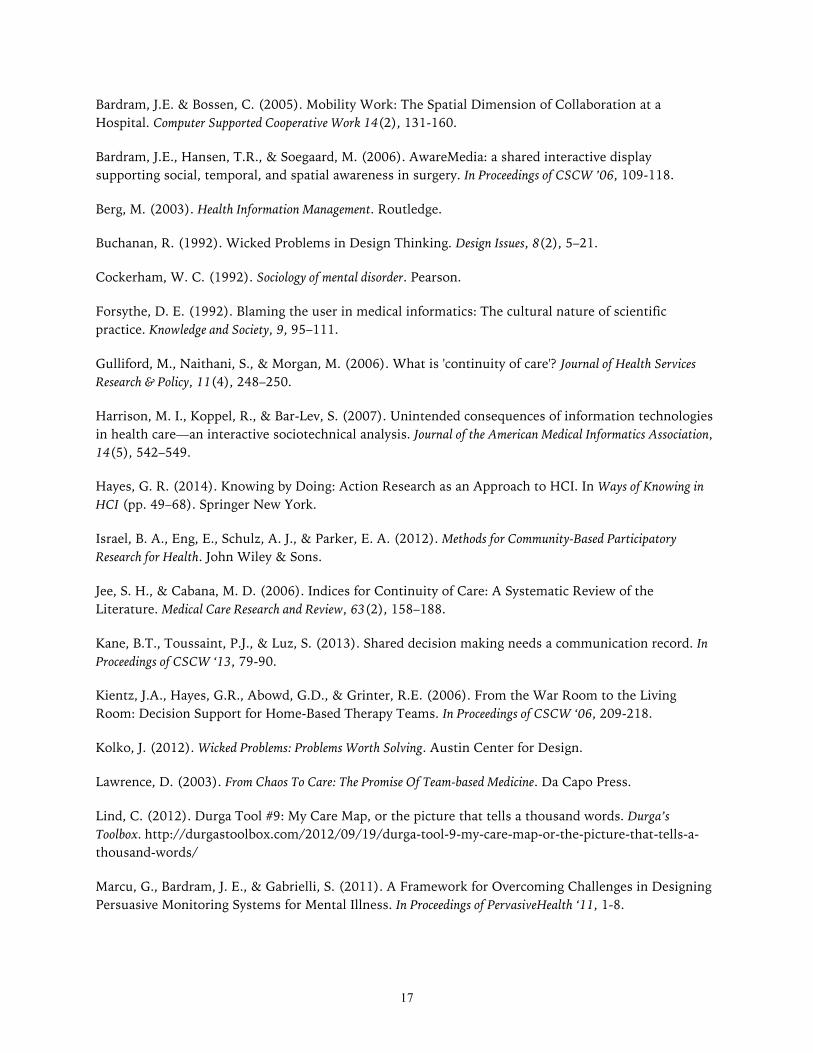
17
Bardram, J.E. & Bossen, C. (2005). Mobility Work: The Spatial Dimension of Collaboration at a Hospital. Computer Supported Cooperative Work 14(2), 131-160.
Bardram, J.E., Hansen, T.R., & Soegaard, M. (2006). AwareMedia: a shared interactive display supporting social, temporal, and spatial awareness in surgery. In Proceedings of CSCW ’06, 109-118.
Berg, M. (2003). Health Information Management. Routledge.
Buchanan, R. (1992). Wicked Problems in Design Thinking. Design Issues, 8(2), 5–21.
Cockerham, W. C. (1992). Sociology of mental disorder. Pearson.
Forsythe, D. E. (1992). Blaming the user in medical informatics: The cultural nature of scientific practice. Knowledge and Society, 9, 95–111.
Gulliford, M., Naithani, S., & Morgan, M. (2006). What is 'continuity of care'? Journal of Health Services Research & Policy, 11(4), 248–250.
Harrison, M. I., Koppel, R., & Bar-Lev, S. (2007). Unintended consequences of information technologies in health care—an interactive sociotechnical analysis. Journal of the American Medical Informatics Association, 14(5), 542–549.
Hayes, G. R. (2014). Knowing by Doing: Action Research as an Approach to HCI. In Ways of Knowing in HCI (pp. 49–68). Springer New York.
Israel, B. A., Eng, E., Schulz, A. J., & Parker, E. A. (2012). Methods for Community-Based Participatory Research for Health. John Wiley & Sons.
Jee, S. H., & Cabana, M. D. (2006). Indices for Continuity of Care: A Systematic Review of the Literature. Medical Care Research and Review, 63(2), 158–188.
Kane, B.T., Toussaint, P.J., & Luz, S. (2013). Shared decision making needs a communication record. In Proceedings of CSCW ‘13, 79-90.
Kientz, J.A., Hayes, G.R., Abowd, G.D., & Grinter, R.E. (2006). From the War Room to the Living Room: Decision Support for Home-Based Therapy Teams. In Proceedings of CSCW ‘06, 209-218.
Kolko, J. (2012). Wicked Problems: Problems Worth Solving. Austin Center for Design.
Lawrence, D. (2003). From Chaos To Care: The Promise Of Team-based Medicine. Da Capo Press.
Lind, C. (2012). Durga Tool #9: My Care Map, or the picture that tells a thousand words. Durga’s Toolbox. http://durgastoolbox.com/2012/09/19/durga-tool-9-my-care-map-or-the-picture-that-tells-a-thousand-words/
Marcu, G., Bardram, J. E., & Gabrielli, S. (2011). A Framework for Overcoming Challenges in Designing Persuasive Monitoring Systems for Mental Illness. In Proceedings of PervasiveHealth ‘11, 1-8.
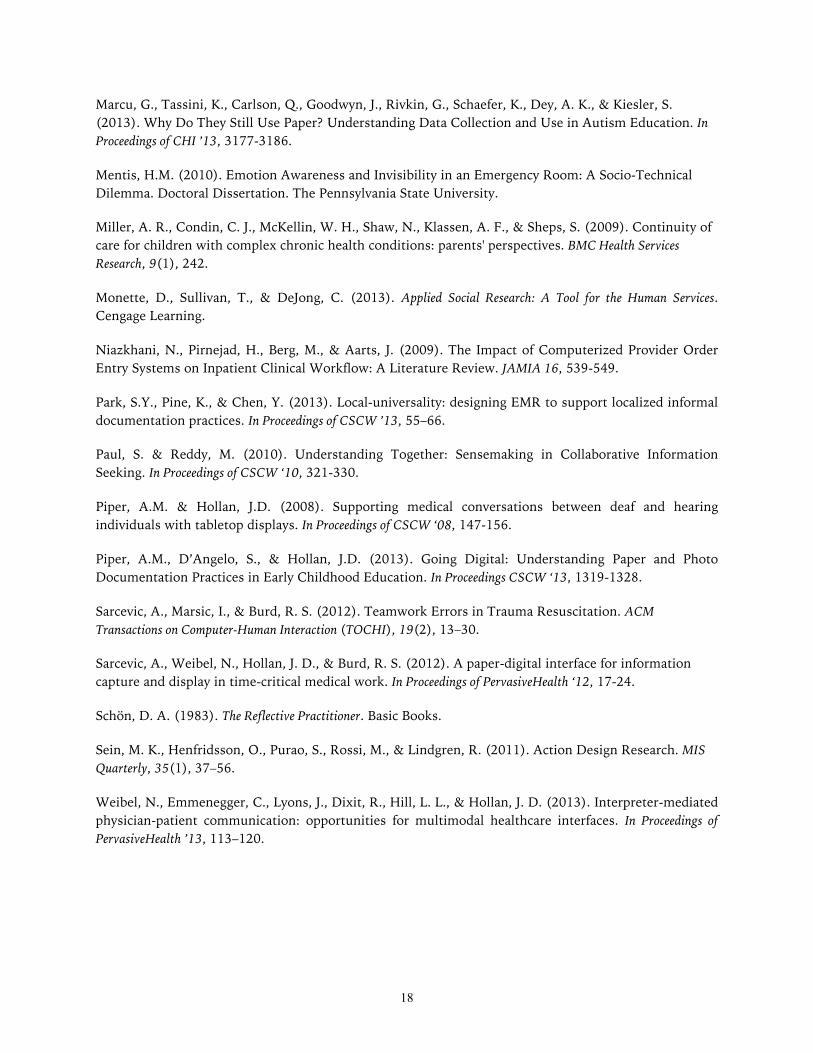
18
Marcu, G., Tassini, K., Carlson, Q., Goodwyn, J., Rivkin, G., Schaefer, K., Dey, A. K., & Kiesler, S. (2013). Why Do They Still Use Paper? Understanding Data Collection and Use in Autism Education. In Proceedings of CHI ’13, 3177-3186.
Mentis, H.M. (2010). Emotion Awareness and Invisibility in an Emergency Room: A Socio-Technical Dilemma. Doctoral Dissertation. The Pennsylvania State University.
Miller, A. R., Condin, C. J., McKellin, W. H., Shaw, N., Klassen, A. F., & Sheps, S. (2009). Continuity of care for children with complex chronic health conditions: parents' perspectives. BMC Health Services Research, 9(1), 242.
Monette, D., Sullivan, T., & DeJong, C. (2013). Applied Social Research: A Tool for the Human Services. Cengage Learning.
Niazkhani, N., Pirnejad, H., Berg, M., & Aarts, J. (2009). The Impact of Computerized Provider Order Entry Systems on Inpatient Clinical Workflow: A Literature Review. JAMIA 16, 539-549.
Park, S.Y., Pine, K., & Chen, Y. (2013). Local-universality: designing EMR to support localized informal documentation practices. In Proceedings of CSCW ’13, 55–66.
Paul, S. & Reddy, M. (2010). Understanding Together: Sensemaking in Collaborative Information Seeking. In Proceedings of CSCW ‘10, 321-330.
Piper, A.M. & Hollan, J.D. (2008). Supporting medical conversations between deaf and hearing individuals with tabletop displays. In Proceedings of CSCW ‘08, 147-156.
Piper, A.M., D’Angelo, S., & Hollan, J.D. (2013). Going Digital: Understanding Paper and Photo Documentation Practices in Early Childhood Education. In Proceedings CSCW ‘13, 1319-1328.
Sarcevic, A., Marsic, I., & Burd, R. S. (2012). Teamwork Errors in Trauma Resuscitation. ACM Transactions on Computer-Human Interaction (TOCHI), 19(2), 13–30.
Sarcevic, A., Weibel, N., Hollan, J. D., & Burd, R. S. (2012). A paper-digital interface for information capture and display in time-critical medical work. In Proceedings of PervasiveHealth ‘12, 17-24.
Schön, D. A. (1983). The Reflective Practitioner. Basic Books.
Sein, M. K., Henfridsson, O., Purao, S., Rossi, M., & Lindgren, R. (2011). Action Design Research. MIS Quarterly, 35(1), 37–56.
Weibel, N., Emmenegger, C., Lyons, J., Dixit, R., Hill, L. L., & Hollan, J. D. (2013). Interpreter-mediated physician-patient communication: opportunities for multimodal healthcare interfaces. In Proceedings of PervasiveHealth ’13, 113–120.
19
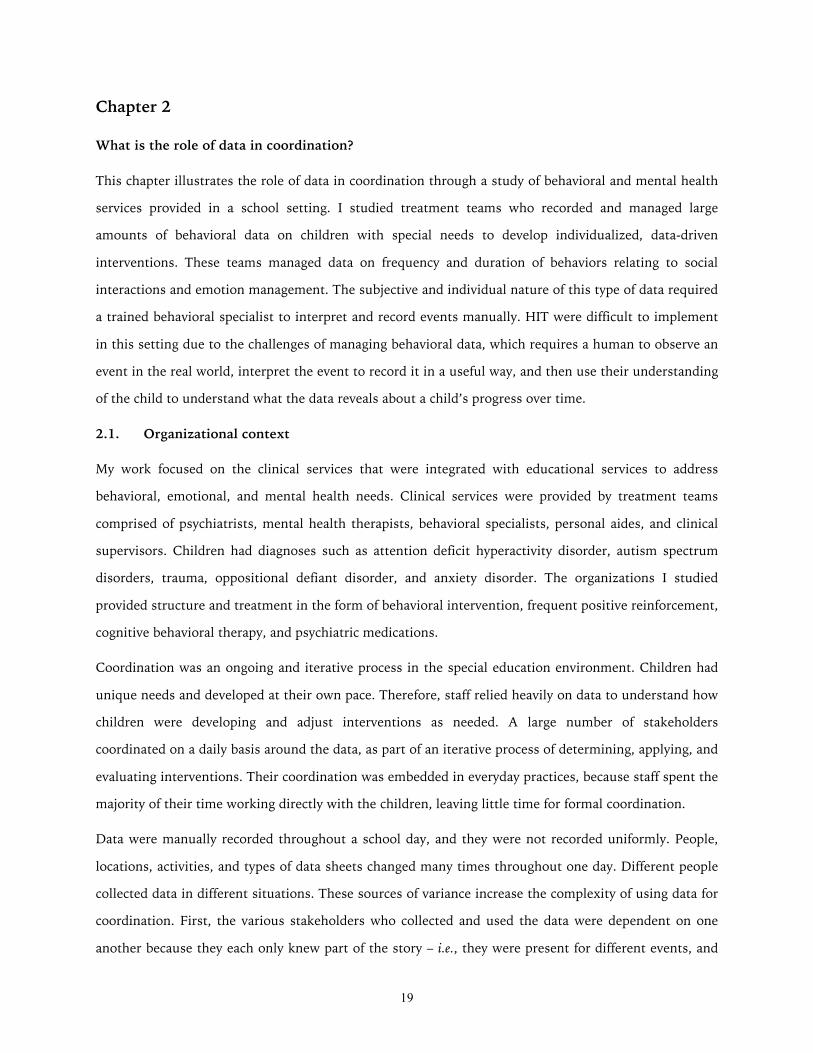
Chapter 2
What is the role of data in coordination?
This chapter illustrates the role of data in coordination through a study of behavioral and mental health
services provided in a school setting. I studied treatment teams who recorded and managed large
amounts of behavioral data on children with special needs to develop individualized, data-driven
interventions. These teams managed data on frequency and duration of behaviors relating to social
interactions and emotion management. The subjective and individual nature of this type of data required
a trained behavioral specialist to interpret and record events manually. HIT were difficult to implement
in this setting due to the challenges of managing behavioral data, which requires a human to observe an
event in the real world, interpret the event to record it in a useful way, and then use their understanding
of the child to understand what the data reveals about a child’s progress over time.
2.1. Organizational context
My work focused on the clinical services that were integrated with educational services to address
behavioral, emotional, and mental health needs. Clinical services were provided by treatment teams
comprised of psychiatrists, mental health therapists, behavioral specialists, personal aides, and clinical
supervisors. Children had diagnoses such as attention deficit hyperactivity disorder, autism spectrum
disorders, trauma, oppositional defiant disorder, and anxiety disorder. The organizations I studied
provided structure and treatment in the form of behavioral intervention, frequent positive reinforcement,
cognitive behavioral therapy, and psychiatric medications.
Coordination was an ongoing and iterative process in the special education environment. Children had
unique needs and developed at their own pace. Therefore, staff relied heavily on data to understand how
children were developing and adjust interventions as needed. A large number of stakeholders
coordinated on a daily basis around the data, as part of an iterative process of determining, applying, and
evaluating interventions. Their coordination was embedded in everyday practices, because staff spent the
majority of their time working directly with the children, leaving little time for formal coordination.
Data were manually recorded throughout a school day, and they were not recorded uniformly. People,
locations, activities, and types of data sheets changed many times throughout one day. Different people
collected data in different situations. These sources of variance increase the complexity of using data for
coordination. First, the various stakeholders who collected and used the data were dependent on one
another because they each only knew part of the story – i.e., they were present for different events, and
20
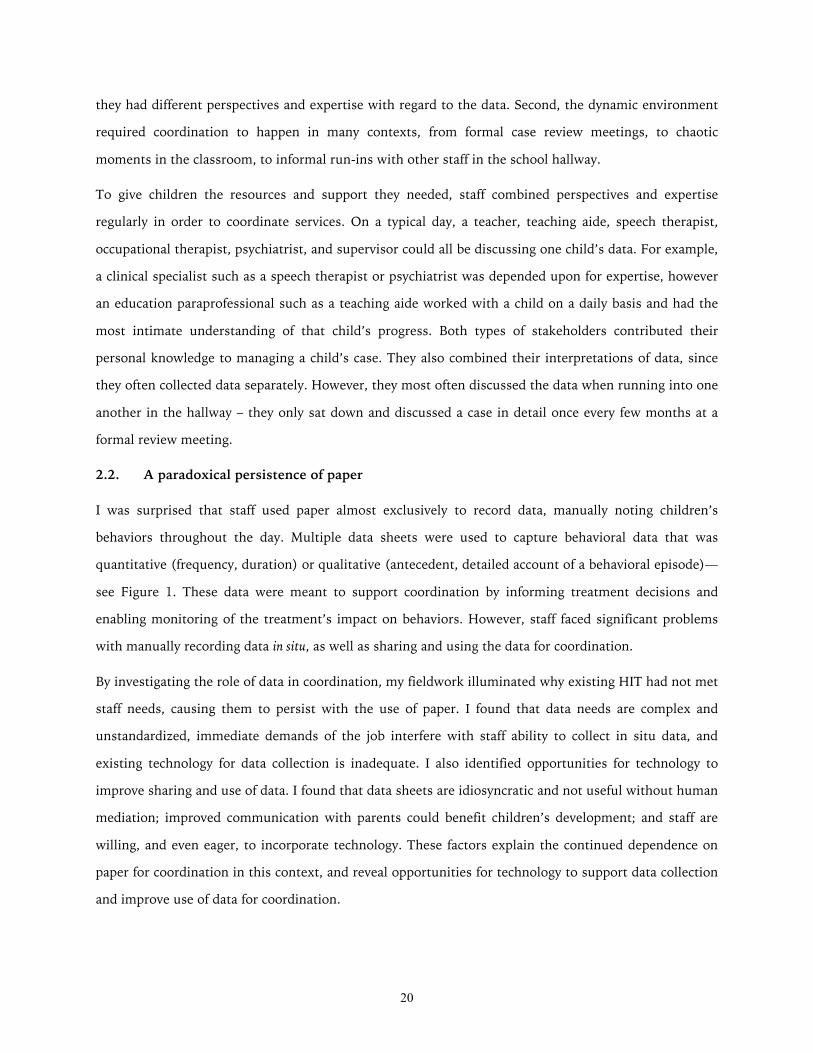
they had different perspectives and expertise with regard to the data. Second, the dynamic environment
required coordination to happen in many contexts, from formal case review meetings, to chaotic
moments in the classroom, to informal run-ins with other staff in the school hallway.
To give children the resources and support they needed, staff combined perspectives and expertise
regularly in order to coordinate services. On a typical day, a teacher, teaching aide, speech therapist,
occupational therapist, psychiatrist, and supervisor could all be discussing one child’s data. For example,
a clinical specialist such as a speech therapist or psychiatrist was depended upon for expertise, however
an education paraprofessional such as a teaching aide worked with a child on a daily basis and had the
most intimate understanding of that child’s progress. Both types of stakeholders contributed their
personal knowledge to managing a child’s case. They also combined their interpretations of data, since
they often collected data separately. However, they most often discussed the data when running into one
another in the hallway – they only sat down and discussed a case in detail once every few months at a
formal review meeting.
2.2. A paradoxical persistence of paper
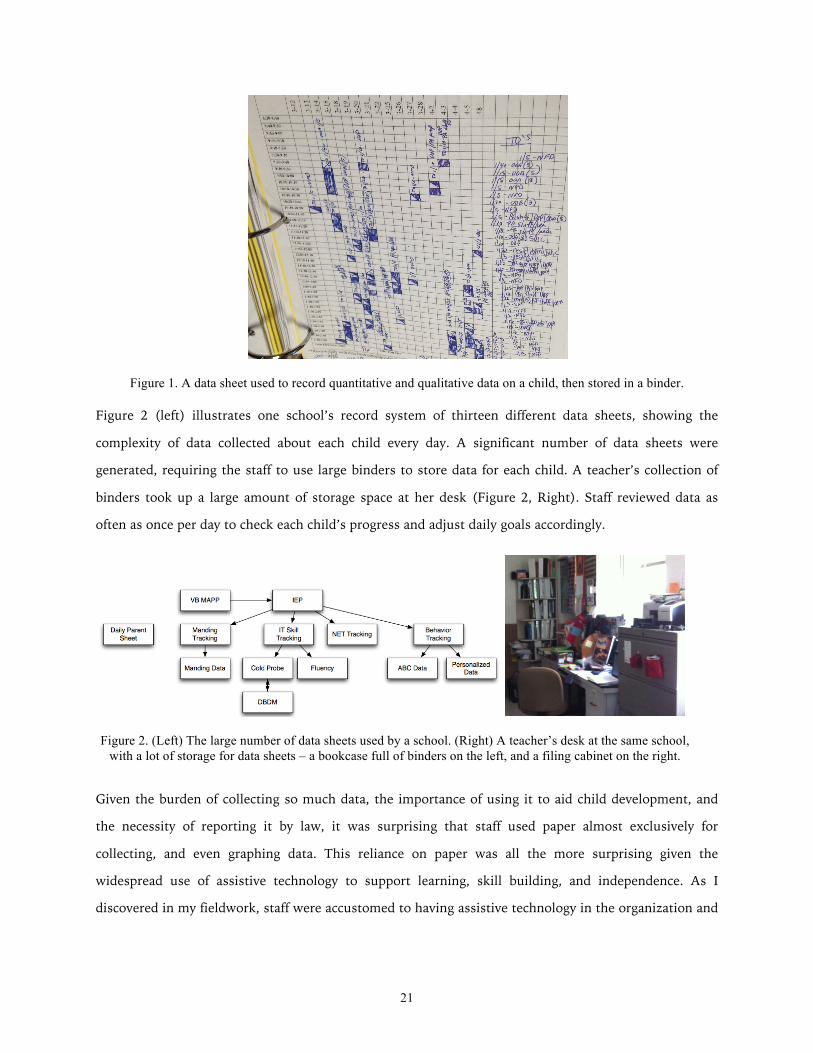
I was surprised that staff used paper almost exclusively to record data, manually noting children’s
behaviors throughout the day. Multiple data sheets were used to capture behavioral data that was
quantitative (frequency, duration) or qualitative (antecedent, detailed account of a behavioral episode)—
see Figure 1. These data were meant to support coordination by informing treatment decisions and
enabling monitoring of the treatment’s impact on behaviors. However, staff faced significant problems
with manually recording data in situ, as well as sharing and using the data for coordination.
By investigating the role of data in coordination, my fieldwork illuminated why existing HIT had not met
staff needs, causing them to persist with the use of paper. I found that data needs are complex and
unstandardized, immediate demands of the job interfere with staff ability to collect in situ data, and
existing technology for data collection is inadequate. I also identified opportunities for technology to
improve sharing and use of data. I found that data sheets are idiosyncratic and not useful without human
mediation; improved communication with parents could benefit children’s development; and staff are
willing, and even eager, to incorporate technology. These factors explain the continued dependence on
paper for coordination in this context, and reveal opportunities for technology to support data collection
and improve use of data for coordination.
21
Figure 1. A data sheet used to record quantitative and qualitative data on a child, then stored in a binder.
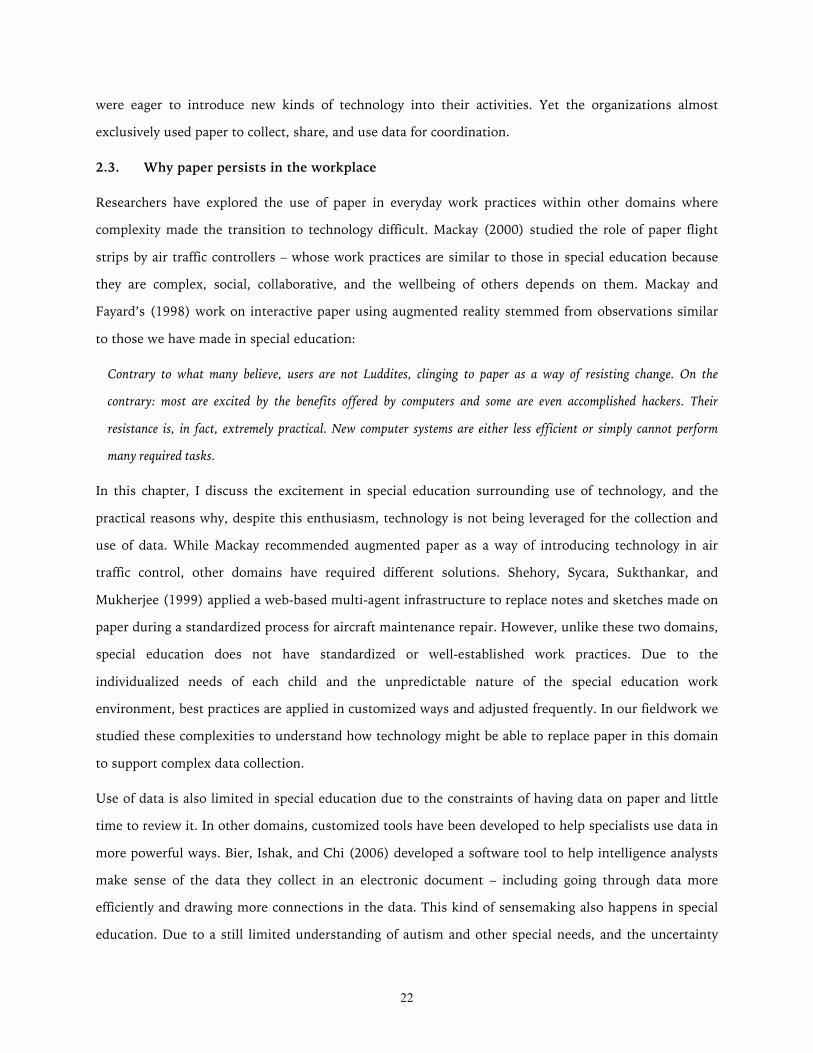
Figure 2 (left) illustrates one school’s record system of thirteen different data sheets, showing the
complexity of data collected about each child every day. A significant number of data sheets were
generated, requiring the staff to use large binders to store data for each child. A teacher’s collection of
binders took up a large amount of storage space at her desk (Figure 2, Right). Staff reviewed data as
often as once per day to check each child’s progress and adjust daily goals accordingly.
Given the burden of collecting so much data, the importance of using it to aid child development, and
the necessity of reporting it by law, it was surprising that staff used paper almost exclusively for
collecting, and even graphing data. This reliance on paper was all the more surprising given the
widespread use of assistive technology to support learning, skill building, and independence. As I
discovered in my fieldwork, staff were accustomed to having assistive technology in the organization and
Figure 2. (Left) The large number of data sheets used by a school. (Right) A teacher’s desk at the same school, with a lot of storage for data sheets – a bookcase full of binders on the left, and a filing cabinet on the right.
22
were eager to introduce new kinds of technology into their activities. Yet the organizations almost
exclusively used paper to collect, share, and use data for coordination.
2.3. Why paper persists in the workplace
Researchers have explored the use of paper in everyday work practices within other domains where
complexity made the transition to technology difficult. Mackay (2000) studied the role of paper flight
strips by air traffic controllers – whose work practices are similar to those in special education because
they are complex, social, collaborative, and the wellbeing of others depends on them. Mackay and
Fayard’s (1998) work on interactive paper using augmented reality stemmed from observations similar
to those we have made in special education:
Contrary to what many believe, users are not Luddites, clinging to paper as a way of resisting change. On the
contrary: most are excited by the benefits offered by computers and some are even accomplished hackers. Their
resistance is, in fact, extremely practical. New computer systems are either less efficient or simply cannot perform
many required tasks.
In this chapter, I discuss the excitement in special education surrounding use of technology, and the
practical reasons why, despite this enthusiasm, technology is not being leveraged for the collection and
use of data. While Mackay recommended augmented paper as a way of introducing technology in air
traffic control, other domains have required different solutions. Shehory, Sycara, Sukthankar, and
Mukherjee (1999) applied a web-based multi-agent infrastructure to replace notes and sketches made on
paper during a standardized process for aircraft maintenance repair. However, unlike these two domains,
special education does not have standardized or well-established work practices. Due to the
individualized needs of each child and the unpredictable nature of the special education work
environment, best practices are applied in customized ways and adjusted frequently. In our fieldwork we
studied these complexities to understand how technology might be able to replace paper in this domain
to support complex data collection.
Use of data is also limited in special education due to the constraints of having data on paper and little
time to review it. In other domains, customized tools have been developed to help specialists use data in
more powerful ways. Bier, Ishak, and Chi (2006) developed a software tool to help intelligence analysts
make sense of the data they collect in an electronic document – including going through data more
efficiently and drawing more connections in the data. This kind of sensemaking also happens in special
education. Due to a still limited understanding of autism and other special needs, and the uncertainty
23
and variety of interventions used, sense making is complex. The staff make decisions based on their
expertise and an intimate knowledge of children. Therefore, we draw from Mackay’s (2000)
recommendation that flight strips for air traffic controllers be augmented but not changed, to “leave the
user interface and its subsequent evolution in the hands of the people most responsible, the air traffic
controllers themselves.”
In special education, “the user interface and its subsequent evolution” take the form of a prescribed
model of recording and managing data (the implications of administrators prescribing this model,
without significant input from those using it, are discussed in Chapter 4). In this work, I did not set out
to fundamentally change the way data is recorded. Staff in the special education domain need support to
record and use data, but I did not want to change their fundamental methods, as they alone are the
experts on the management and use of their data. I explored how technology can support staff in
recording and interpreting data, with the goal of their human expertise and collaboration driving the
process and empowering nuanced decision-making regarding interventions. Ultimately, however, any
HIT inevitably changes workflow in some way – Chapter 5 touches upon this issue.
My approach in this work differs from other work on improving data collection in the autism domain in
two ways: (1) I focus on staff playing an active role in collecting data, and (2) I seek to understand the
complexity of complete data needs within a classroom. Other work has been aimed at reducing burden
on users as much as possible, by seeking to automate data collection using capture and access, sensors,
and other highly augmented collection methods. These types of systems collect large amounts of data
automatically while a child is engaging in an activity (Hayes, Hirano, Marcu, Monibi, Nguyen, &
Yeganyan, 2010; Westeyn, Abowd, Starner, Johnson, Presti, & Weaver, 2012), or with minimal
involvement from staff or caregivers (Hayes & Abowd, 2006; Hayes, Gardere, Abowd, & Truong, 2008;
Nazneen, Boujarwah, Rozga, Abowd, Arriaga, Oberleitner, & Pharkute, 2012; Plotz, Hammerla, Rozga,
Reavis, Call, & Abowd, 2012). My work complements these systems by providing an understanding of
the expert’s role in collecting data in situ. I considered the implicit processes at play when experts
(teaching staff and therapists) collect and use data, and we tried to make these processes explicit to
inform the design of technologies that support or automate data collection. I focused on understanding
current data collection methods without changing them in order to learn about experts’ work practices. I
also studied use of the data, including information sharing among staff and the ability to craft reports
about multiple kinds of data for multiple stakeholders. Finally, I looked at data collection and use
24
broadly in the classroom setting, rather than within the context of a particular therapy or activity, to
address the multiplicity and complexity of the complete data needs.
Abaris, a system designed to support a specialized approach for autism therapy, was developed using a
model close to my own, that is, supporting collaborative collection and use of data for decision-making
(Kientz, Hayes, Westeyn, Starner, & Abowd, 2007). I build on this work by studying a variety of
approaches and interventions at several schools, and understanding how a system like Abaris could
operate in the complex and unpredictable setting of a school. AMA, a tablet application for annotation,
monitoring, and analysis, was developed with goals similar to ours (Sano, Hernandez, Deprey, Eckhardt,
Picard, & Goodwyn, 2012). I contribute to the development of these kinds of applications by providing a
real-world investigation of how they can be used in special education, and understanding why similar,
widely available applications are not currently being used in schools.
In this study I set out to understand the role of data in coordination, to ultimately inform the role of HIT
in supporting these practices with data.
2.4. Methods
I conducted fieldwork with a team of six researchers over the course of six months. Field sites were 7
special education programs in 4 states providing services to children with autism and other special
needs. Six of the sites were schools (two with residential programs), and one was a therapy center
providing after-school services. While the organizations differed somewhat, their services for children
with autism were similar. Participants were recruited by word of mouth. All activities were approved by
my university’s review board, and the sites’ review boards if required.
Fieldwork included 58 person-hours of observation and 62 interviews with staff. We primarily
interviewed teachers [n=14], because they play the largest role in data collection. In one school, I
surveyed 130 of their 150 staff, with 49 of the staff also participating in two focus groups. During
fieldwork we interacted with teaching staff, therapeutic staff (e.g., speech, physical, occupational), and
administrators. We observed staff and children in the school environment but did not interview any
children.
Children with autism are reactive to change in their environment, so the presence of even passive
observers may be disruptive and distracting. We therefore used mixed methods to gain as accurate of a
picture as possible of informants’ natural daily activities. We conducted contextual inquiries (Beyer &
Holtzblatt, 1998) with the staff to understand their workflow and tools. We used interviews and focus
25
groups to gain an understanding of aspects we would not be able to capture only through naturalistic
observation (Esterberg, 2002; Lofland, Snow, Anderson, & Lofland, 2006). During fieldwork we took
detailed notes, and the research team met after fieldwork sessions to discuss and interpret the data. We
used affinity analysis (Beyer & Holtzblatt, 1998) to combine data from different sites, collected by
different researchers.
We also conducted a competitive analysis to understand the data collection tools currently available.
This knowledge enabled us to discuss tools during fieldwork, helping us discover why the tools were not
their meeting needs. We focused on mobile apps for data collection because of the ease of integrating
their use in situ, the abundance and popularity of these apps, and the high degree of interest we
observed in iPads. We searched app stores, blogs, reviews, and forums, identifying apps using two
criteria: 1) popular apps that were the most downloaded, discussed, and reviewed, and 2) apps that are
representative of the type of functionality available. We identified 5 apps: ABC Data Pro, Autism Tracker
Pro, Behavior Journal, Behavior Tracker Pro, and Catalyst HD. All were available for download on the
iTunes App Store. One was free, one had a monthly subscription fee of $40, and the rest ranged from a
one-time payment of $10 to $30. The comparative costs were not reflected in the quality or functionality
of the apps. These five apps were analyzed based on established usability principles (Brooks, 1994;
Tognazzini, 2012), and user experience metrics adapted for ubiquitous health technologies (Connelly,
Caine, Siek, Kientz, Kutz, Hanania, Khan, & Choe, 2012).
2.5. Findings
I identified six factors affecting the use of data for coordination in special education (see Table 1). Three
of the factors suggest why paper is still being used to drive coordination. Three other factors suggest
opportunities for technology to increase sharing and use of data, in order to improve coordination.
Table 1. Six findings about the use of data to support coordination in special education.
26
2.5.1. Why they use paper to collect data
During our formative research, we followed emerging themes to narrow our focus from the use of HIT in
special education to the use of data for coordination. We were surprised that technology was not being
used in this area, and it became very clear that these processes are both critical and cumbersome. For
those two reasons, data collection was one of our most frequently encountered topics. As our fieldwork
continued we found two challenges staff face in collecting data for coordination: data needs are complex
and not standardized, and the immediate demands of their job interfere with thorough in situ data
collection. These challenges explain the persistence of paper due to the complexities of the domain and
demands on the staff. Later, I discuss how existing technology is not meeting the needs of the staff as a
result of these demands.
2.5.1.1. Data needs are complex and not standardized
Data needs in special education derive from the individualized nature of teaching. Skills that need to be
developed in special education include life skills such as sitting correctly in a chair, learning goals such
as reading and counting, social skills such as greeting a stranger, as well as curbing any aggressive or
disruptive behavior. Each child’s learning goals will differ, and a child’s goals will change based on his
development. As such, data help staff track these changes and make decisions about interventions and
approaches to use with each child.
One teacher described a particular data sheet as the “backbone” of her work with children. Staff
depended on data sheets for making everyday decisions to help the children succeed. Each child
progresses differently, and sometimes working on a particular skill may take months of painstaking work
before staff see progress. Data is sometimes the only way to judge a child’s progress.
Perhaps due to the high need for individualization and flexibility, there is little standardization of
methods for data collection in special education. For example, the model shown in Figure 2 (Left) is only
representative of one school we studied. The other programs used different systems and entirely
different sheets for collecting the data. Each program determines its own system for collecting data, and
each staff member may adapt the system to her own work practices. These systems are so complex that
they take a significant amount of time to learn:
“The time to learn a data recording system can take anywhere from a week or two to over a month depending on the
employee's position and type of data that they record.” –Staff member in a focus group
27
Data collection enables the staff to monitor a child’s development, and adjust interventions regularly
depending on how a child is progressing. If an intervention is improving a child’s learning or behavior,
staff must have evidence of that progress to show that the approach works well for that child. If an
intervention is not resulting in improvement, the staff need to recognize this in order to change course
and evaluate other interventions.
Due to the range and transience of treatment goals, teachers develop lesson plans with activities more
complex than typical subjects such as math or reading. Lesson plans integrate many skills in order to
address the individual needs of children. In order to help children generalize what they learn to different
situations, staff randomize the skills they work on and the order in which children will work on them.
According to Tracy this dynamic and unpredictable approach to behavioral intervention “gets [children]
ready for the real world, it helps them be flexible”. However, it also makes data collection a complex
process. Collection methods need to be dynamic and flexible enough to keep up with constant changes.
This was a main reason paper seemed to be the only reliable method of collecting data. We saw staff
adapt data sheets to their own personal work practices so they could be as efficient and accurate as
possible. Even small adaptations such as adding an extra column seemed to help make a data sheet more
usable.
During our contextual inquiries, we noticed staff would make these minor adaptations to data sheets for
themselves. Interestingly, when we probed about the possibility of the sheets being designed to suit
their needs better or help them work more efficiently, the staff were unable to suggest many
improvements, stating that they weren’t sure because out of necessity they had figured out how to make
that sheet work for them. As Alicia put it, “maybe I only like [the sheet] because it’s what I’m used to...
it works.”
This response spoke to the incredible adaptability of special education staff, in making a system work for
them so that they can focus on helping the children. Their job pushes them to be creative in most
aspects, yet because they are so reliant on current data collection methods they are forced to adapt to
them rather than think past them to what might be more effective. For technology designers, this means
these particular users may not provide much in the way of design ideas. Moreover, this finding speaks to
a certain amount of rigidity when it comes to changing an established data collection process. Not only
is the process deeply integrated into classroom activities, but staff have also worked so hard to make the
process work for them that they can’t seem to be able to consider another possible process. Changing
the process may therefore lead to staff resistance or stress.
28
At the same time, each teacher’s adaptation of the sheets led to increased inconsistency in how data was
collected:
“It’s not consistent. Sometimes I won’t know what data is being collected. I won’t know how to read someone else’s
data sheet.” –Staff member in a focus group
Problems with inconsistency, which were common, suggest that a change in process would improve the
impact of data collected. Administrators from one school spoke frequently about the importance of inter-
rater reliability amongst all of the staff collecting data on the children. Staff at this school regularly
performed inter-rater reliability checks.
Another problem with data inconsistency is when children are transferred between classrooms or
schools:
“When you transfer a child you’re looking at the data sheet and you’re trying to figure out how they worked with
it. Instead of just having a system that goes with them and stays consistent year to year.” –Staff member in a
focus group
A lack of standardization, coupled with individual staff members’ necessitated adaptations of sheets,
often leads to problems using data that was previously collected on a child. This challenge seemed to
leave staff with unusable data, forced to guess about a child’s past history and start data collection from
scratch. Sometimes, children arrived at a new school with no data at all.
2.5.1.2. Immediate demands of their job interfere with thorough in situ data collection
Adding to the difficulty of collecting data, the staff need to make sure the data is accurate by collecting it
in situ. Whether tracking each time a child exhibits a type of behavior, or monitoring the acquisition of a
skill through repeated trials, staff need to work closely with a child and observe his behavior carefully. A
piece of paper is always nearby—at arm’s length whenever possible—for recording data during most
activities. However, the staff’s work with the children and collection of data naturally interfere with one
another, creating conflicting demands on their attention. Data should be collected in situ to ensure
accuracy, but by writing down that data, they take some of their attention away from the children.
Staff reported that they sometimes don’t have a chance to capture data because they are in a situation in
which they absolutely cannot afford the distraction. This kind of situation may happen if a child is
having a difficult day and unable to stay on task, or if it is a particularly chaotic day in the classroom
overall. Many staff reported that they sometimes have to record data on sheets at the end of the day
29
instead, though admitting “I have trouble remembering the exact details of all behaviors from one day”
(Tracy, teacher). The demands of their immediate responsibilities to the children can get in the way of
data collection, and despite the fact that they recognize the value of data, in the moment they will choose
attending to a child over recording data.
A day in special education is rarely typical, making it difficult to rely on predictable methods of collecting
data. Special education is rarely predictable and often chaotic. Behaviors are quite unpredictable, and a
day can be turned upside down by one child having a difficult day. When staff have to respond and
attend to one child who is having a difficult day, the rest of the staff must help to cover for one another.
Moreover, one child’s anxiety and behaviors can affect another’s, quickly spreading tension or chaos to
an entire room. Staff respond to these events using best practices they’ve been trained in, but their
response will be highly based on their own expertise and their nuanced understanding of each individual
child. Each child with autism is unique, and special education is work that is inherently and complexly
human and social – as such, it is an environment that is difficult to automate.
However, a significant opportunity for technology to support staff in collecting data is to free up their
attention so they can focus on the children. One staff member participating in a focus group, describing
how cumbersome it is to collect data on paper and transfer that data several times, lamented that “it’s
taking time from the kids.” One of the complaints we heard most frequently from staff was the amount
of energy spent on paperwork. They found the cumbersome process frustrating because the most
important aspect of their role is their direct work with children, and as a result they often have to take
any unfinished paperwork home at the end of the workday.
One staff member wanted to involve children in data collection, to help him engage with the children
rather than taking his attention away from them. He used a wall display with pipe cleaners to count
behavior points where they were visible to the children, rather than on a piece of paper only he could
see. Children had greater awareness of when they were receiving or losing points (which can be effective
reinforcement), and by engaging them in the collection, this method helped to bring his attention back
to the children. However, it also increased the burden as it took him additional time to transfer the data
to paper afterwards. If technology supports data collection and can also engage children (similar to
Cramer, Hirano, Tentori, Yeganyan, & Hayes, 2011 and Hirano, Yeganyan, Marcu, Nguyen, Boyd, &
Hayes, 2010), it can reduce burden on staff and also enhance motivation to collect data by leveraging the
staff’s desire to engage with the children.
30
Though we expected other factors—such as cost, politics, or resistance to new technology—to contribute
to the difficulty of adopting technology in schools, we discovered that time was the single most limiting
factor. Staff in special education are regularly overburdened, and face-to-face time with the children
always comes first. As a result, little time remains for their other responsibilities such as data collection
or staff collaboration, and there is almost no time for researching or learning new technologies. From
our focus groups and survey at one school, we found that professional development was a problem that
administrators were aware of and staff expressed frustration with:
“New tech training has kind of been trial by fire. I wish there was more a chance to learn new systems before being
thrown in there.” –Staff member in a focus group
The staff struggle to learn and incorporate technologies with the little time and training they have
available. Changing their data collection processes from paper to technology would require significant
effort, and adequate professional development would be critical.
2.5.1.3. Existing technology for data collection is inadequate
We encountered hardware such as iPads and Smart Boards in schools, but the staff had difficulty
incorporating them into their activities due to a lack of adequate software applications that would make
these devices useful for them. Grants made iPads and Smart Boards attainable for three schools we
studied. One school had provided an iPad for each staff member. Another school purchased three iPads
to trial, and our survey at this school revealed that iPads were in high demand among the staff—they
were one of the most common topics of responses to both closed-ended and open-ended questions.
Administrators at this school were in discussions to purchase additional iPads, but wanted to
understand first how they would be used and what software was available, rather than purchasing them
as a hardware device without a specific purpose.
The hesitation of these administrators points to a key reason that paper is still being used for data
collection—existing technology is inadequate. There is no existing system that is widely known and
recommended for data collection, which is unusual in a domain where many creative parents and staff
discover and share effective solutions. For example, Proloquo2Go is a popular communication app for
children who have limited speech, and Talking Tom Cat is a popular game that appeals to children with
autism. When apps are as effective as these two examples, they become popular through word of mouth,
parent support groups, online forums and educational blogs. So, it is unusual that there is no well-
known app for supporting data collection and use—and an indication that existing apps are inadequate.
31
Another school we studied had set out to find an app to use on the iPads they already own. They were
even able to devote some time to this endeavor, having several staff members test existing apps on their
iPads. However, their disappointment with the functionality and usability of these apps led them to
abandon their search and continue to use paper. Our competitive analysis of existing apps revealed what
aspects made them fall short of meeting their needs. Our findings echo the complaints reported by the
school.
Not practical for collecting data on multiple children. We first discovered that many of the apps were
designed for collecting data on a single child. Few supported separating data by child, which is critical
for the school environment. In addition, data could only be collected using a single device and was stored
locally on the device. This kind of use is not practical given the number of staff interacting with a child in
a school day, and the unpredictability that causes the staff to have to cover for each other often. More
importantly, data cannot be stored locally on devices due to personal health and educational data privacy
laws (HIPAA and FERPA, respectively). These laws ensure student data is protected, and make it
impossible to use many existing apps in schools.
Tradeoff between burdensome customization and limited functionality. Given the complexity of
collecting different types of data on each child depending on individualized goals, apps failed to manage
an important tradeoff between burdensome customization and limited functionality. Those that provided
simple and easy to use collection methods were too limited in their functionality, and lacked
customization for a variety of children. However, those apps that provided customization added
significant burden to the user, and tended to also suffer from usability issues. Some apps included so
many options for data collection that the amount of time it takes to complete a report would not be
practical in a special education environment. We also saw apps attempting to enable a variety of data
collection methods by using such unconventional interactions as a triple tap and two-finger tap. These
interactions are unintuitive and not feasible to use in an unpredictable environment that is demanding
on the staff’s attention.
Lack of support for data use and analysis. Most apps were focused only on the collection of data, and did
not support users in sharing or analyzing the data effectively. Some provided low-fidelity line graphs or a
means of sending raw data by email from the application. Based on our fieldwork findings that we
discuss in the next section, these features would not provide much value to staff, who need sophisticated
analyses of school-wide data, and quick ways of sharing digestible snippets of key data.
32
Attempts to be engaging impeded usability. Most of the apps embraced their context of use and used
school-related design elements such as pencils, crayons, notebooks, and primary colors. However, these
design elements, coupled with interactions that broke with convention, tended to be distracting or
confusing and ultimately impeded usability. One app had an interface mimicking a multi-section
notebook, but inconsistently implemented this metaphor. For example, clicking on a section tab opened
a pop-up window rather than mimicking a page turn to that section.
Schools reported the same shortcomings that we found in existing systems, and pointed to those
shortcomings as reasons for sticking with paper and pencil.
2.5.2. How HIT can improve sharing and use of collected data
The staff is limited in how they can share and use data that has been collected on paper. Data on paper is
difficult to reproduce or share with others. The demands on staff also leave little time to review the data
and use it to inform their decisions. With the support of technology, we discovered opportunities for
sharing and use of data: improving collaboration among staff, and communication with parents. In
addition, the eagerness of staff to incorporate technology into their work shows the feasibility of
adoption if systems can meet their data collection needs and offer improvements in collaboration and
communication.
2.5.2.1. Data sheets are idiosyncratic and not useful without human mediation
One of the most important uses of data is to help staff monitor child development and make decisions
about the most appropriate interventions and approaches to use with each individual child.
Collaboration among different types of staff (teachers, teaching aides, speech therapists, occupational
therapists, etc.) is involved in deciding on interventions for each child. Though some best practices exist
for interventions, each child with autism is unique and staff must be creative in applying interventions to
each individual child’s case. Teaching staff spend their time with the same set of children—those in their
classroom—while other types of staff have larger caseloads assigned to them. For example, a speech
therapist we interviewed covered two classrooms. Other therapists have even larger caseloads, working
with a larger portion of the school.
The teaching staff know the children best, while therapeutic staff are experts on developing particular
skills. Together they determine interventions and goals for each individual child. When teachers struggle
with a child’s grasp of a particular skill, they seek advice from one of the therapists on how to best help a
child. Similarly, therapists spend one-on-one time with a child a few times a week, evaluating their skills
33
and working with them in focused therapy sessions. Therapists then report back to teaching staff, so that
the same work with the child can continue in the classroom. Jamie, a speech therapist, explained that
this type of collaboration is critical “because therapy doesn't work if you're only doing it two times a
week”. The interventions used by the therapists should match those used by the teaching staff.
Despite the importance of staff collaboration, our informants frequently discussed the issue of time:
“I wish we had time. I feel like staff here are really innovative. People work in teams and do cool things. This year I
lost all my time... we need time to mess with things and see what works.” – Staff member in a focus group
Staff collaboration was described as running into each other in the hallway, talking in passing while
doing something else such as cleaning up, or stopping by someone’s office to try and catch them. One
staff member estimated that 60-70% of collaboration is done in passing. Staff use email and phone to
reach out to one another, but rarely have the time to sit down for a scheduled meeting. Scheduled face to
face time may be every few weeks, but during busy times of the school year these meetings are cancelled.
Jared, a member of the teaching staff said this situation is “pathetic”.
Due in part to the limited time the staff have for collaborating, they share little data among one another.
First of all, the lack of standardization makes it difficult to interpret data collected by someone else.
Second, a lack of face-to-face collaboration makes it difficult to share and discuss data. Jamie, a speech
therapist, shares with teachers the data that she collects during one-on-one therapy sessions, but she
knows many of them do not look at the data. She feels that she can make a bigger impact by walking into
a teacher’s classroom and briefly explaining some advice she has for working with a child based on her
data. She can only hope that teachers put her advice to use and that it influences their teaching. Overall,
she feels there is only so much she can do because she knows that the teaching staff have a lot of
demands on their time and so are not likely to be able to look at data that she provides. This concerns
her given the importance she noted of continuing therapy outside of one-on-one sessions, and inserting
it through the school day. There is an opportunity for technology to help someone like Jamie
communicate her data to other staff in a palatable way. Given the impromptu nature of collaboration,
data analysis and visualization could help staff prepare and discuss data more efficiently.
One of the schools we studied had a particularly strong interest in data, originating from an
administrator who wanted to improve collaboration. She had recently joined the school and enforced a
system for more structured and frequent data collection based on a standardized point system. At first,
staff did not like the extra work involved in the incorporation of this system, but the school’s new
34
system grew on staff as they came to understand the value of data and the administrator’s vision for it.
While data is now more available, however, Stephanie recognized that technological tools to empower
both collection and analysis were missing. As long as data is still on paper, they are significantly limited
in what they can do. This school had attempted to find and adopt an iPad application for data collection,
and in their search evaluated the same apps that we did for our competitive analysis. Echoing the issues
we found with the apps, Stephanie said none of them met their needs so they were forced to stick with
paper.
There is significant opportunity for technology to provide visualizations and other tools for easily
sharing important snippets of data and supporting collaboration and decision-making around the data. In
addition, schools want to be able to make school-wide comparisons, for example across days of the
week, gender, staff members, or interventions. Tools for analyzing large data sets would be influential
for schools, which are working to find what works for each child and provide evidence for their success,
within a domain that has limited standardization and best practices.
2.5.2.2. Improved communication with parents could improve interventions
Coordination within special education reaches beyond the individuals within the organization. There are
many communication needs externally as well. U.S. laws require special education programs to report to
state agencies regularly on a child’s progress, and online systems are becoming more common and
widely utilized for standardized reporting. Several times a year, school staff must put additional effort
into summarizing and reporting data to meet this requirement, as well as to communicate a child’s
progress with parents and other staff members. Despite little standardization in data collection,
reporting mechanisms are standardized across states, forcing the staff to use tools that they do not find
easy to use. Transferring data into these reporting tools adds to their workload and frustration.
Technology to aid the transfer of this data would significantly reduce staff burden.
In addition to state-mandated reporting requirements, the staff sees additional value in improved
communication with parents. Despite staff’s hard work within the school environment, they recognize
that a child’s development is highly dependent on their home life. When parents are knowledgeable and
involved with their child’s learning and behavioral goals, children make the most significant progress in
their development. Therefore, staff are often looking for ways to engage parents by keeping them
informed about what happens with their child at school, and what they can do to continue working on
goals at home.
35
Our focus group participants spoke at length about their efforts to improve communication with parents.
For example, because they cannot assume that all families have access to the Internet at home, they had
developed a newsletter to send home relatively easily as a mass mailing to all parents. However, they
discovered that parents did not want to know generic information about goings on at the school, but
rather specific details about their child. Preparing individualized reports would take a significant amount
of time, so a parent committee developed a sheet for staff to fill out, in an attempt to make it easier for
them. However, this sheet is very unpopular, with both parents and staff, in part because it is sent home
each day. Staff feel overburdened and even report having to cut time with children short in order to have
the time to fill out the sheets. On the other side, most parents seem too busy to read such reports on a
daily basis, which staff are aware of because they find the sheets still in children’s backpacks.
Staff argued for communication that is more detailed and frequent, but not a large burden on them.
Parents have a legal right to see their child’s data, and it can help them make decisions outside of school:
“Parents can see any data sheet they want. Some ask to see all data, and a lot ask for behavior data to show to a
psychiatrist—helps with deciding on what meds parents will or will not give their kids. [Sharing data is] needed to
make home life better.” –Tracy, teacher
In addition to providing data that will help parents at home, staff want data to be shared back and forth
to help them do their job. For example, sometimes a behavior is achieved at school, but has not been
generalized outside of that context. As a result, a child will not display the behavior at home, and
parents may not even believe staff when they report this behavior. This situation is frustrating for staff,
who have worked hard with children to achieve the behavior, and want to share data with disbelieving
parents as proof.
Staff also wish they received more data from parents, because it helps them predict and respond to a
child’s needs:
“Predictors are really important. [We] need to know outside factors, such as changes in meds.” –Dylan, behavior
specialist
In addition to big changes such as medications, small pieces of information can be helpful to staff. For
example, if something anxiety-provoking happens in the morning before a child gets to school, some
parents let staff know by phone call or email. This kind of information helps staff not only predict
children’s behaviors, but also interpret and respond to them appropriately. Unfortunately, parents rarely
36
provide staff with this kind of information. Providing a different mechanism for sharing data could
increase the amount of information shared by parents, thus improving coordination.
2.5.2.3. Staff are willing, and even eager, to incorporate technology
Staff are open to and eager to try new technologies if they have reason to believe it would support their
coordination practices and they see evidence of a technology’s success. For example, the recent rise in
use of the Apple iPad has made a significant impact on the special education community. The device is
very affordable compared to traditional assistive devices that cost thousands of dollars each. Moreover,
with a plethora of apps available, it can replace multiple devices created for a specific purpose. Staff and
parents alike are excited by stories about various apps that have made an impact on children with
autism. However, they find the number of apps available to be overwhelming, especially since the right
app needs to be matched to each individual child according to his needs. Many feel that it would take too
much time to look through all of the apps to find the right one for each child:
“I think there’s a lot more out there available, but it just takes time and energy to find it.” –Zoe, Teacher
Despite this drawback, there is still significant excitement about incorporating iPads into many aspects
of special education. In our focus groups and many of our interviews, iPads came up as solutions to a
variety of problems, especially data collection. Informants thought iPads would give them the mobility to
collect data around the classroom and the power to store and analyze large amounts of data – however
they were not sure how exactly this would work. Still, some staff were quick to point out that iPads are
not a panacea, especially considering the time it would take to find the right app for many different
individualized goals.
Technology was brought up frequently when we discussed data collection in our fieldwork. Staff pointed
out many benefits of incorporating technology, including saving paper, saving time, and providing easier
access to data:
“We have parent-teacher communication forms that have to be filled out every day. It’s a ton of paper that’s being
wasted. Can we do this electronically? Teachers can sit down each day and say this is what has been covered. If
you’re looking for information on what’s being done each and every day there should be somewhere you can go.” –
Staff member in a focus group
The eagerness of staff to use technology for data collection, and their astute suggestions as to how it
would improve their process, made it all the more surprising that all of the schools we studied were still
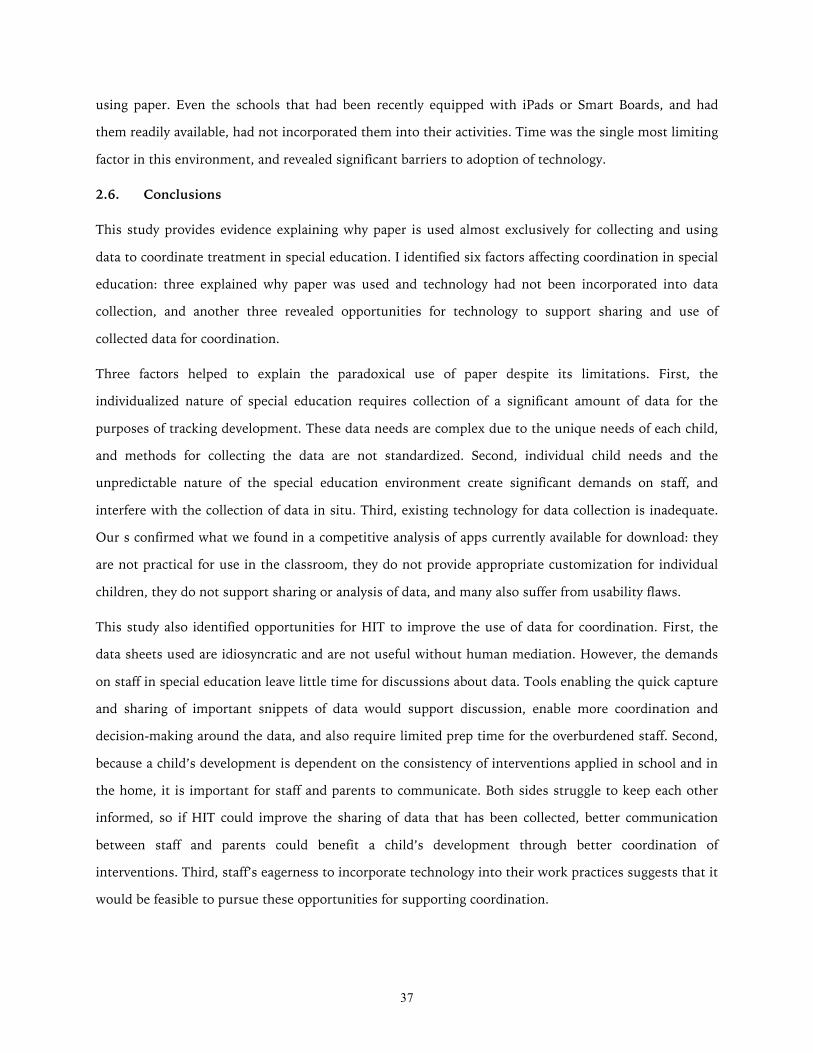
37
using paper. Even the schools that had been recently equipped with iPads or Smart Boards, and had
them readily available, had not incorporated them into their activities. Time was the single most limiting
factor in this environment, and revealed significant barriers to adoption of technology.
2.6. Conclusions
This study provides evidence explaining why paper is used almost exclusively for collecting and using
data to coordinate treatment in special education. I identified six factors affecting coordination in special
education: three explained why paper was used and technology had not been incorporated into data
collection, and another three revealed opportunities for technology to support sharing and use of
collected data for coordination.
Three factors helped to explain the paradoxical use of paper despite its limitations. First, the
individualized nature of special education requires collection of a significant amount of data for the
purposes of tracking development. These data needs are complex due to the unique needs of each child,
and methods for collecting the data are not standardized. Second, individual child needs and the
unpredictable nature of the special education environment create significant demands on staff, and
interfere with the collection of data in situ. Third, existing technology for data collection is inadequate.
Our s confirmed what we found in a competitive analysis of apps currently available for download: they
are not practical for use in the classroom, they do not provide appropriate customization for individual
children, they do not support sharing or analysis of data, and many also suffer from usability flaws.
This study also identified opportunities for HIT to improve the use of data for coordination. First, the
data sheets used are idiosyncratic and are not useful without human mediation. However, the demands
on staff in special education leave little time for discussions about data. Tools enabling the quick capture
and sharing of important snippets of data would support discussion, enable more coordination and
decision-making around the data, and also require limited prep time for the overburdened staff. Second,
because a child’s development is dependent on the consistency of interventions applied in school and in
the home, it is important for staff and parents to communicate. Both sides struggle to keep each other
informed, so if HIT could improve the sharing of data that has been collected, better communication
between staff and parents could benefit a child’s development through better coordination of
interventions. Third, staff’s eagerness to incorporate technology into their work practices suggests that it
would be feasible to pursue these opportunities for supporting coordination.
38
In special education, it is critical for multiple kinds of data to be collected in situ in order to inform and
support coordination among staff. However, the number of interruptions and activities, and other people
to be consulted, interfere with data collection. Informants in this study perceived that paper is much
easier for jotting down notes, editing them later, and collaborating with others on these notes than any
technology they have tried. Paradoxically, we found that the persistence of paper reduces the amount of
sharing and use of data for coordination. The large collection of data sheets is difficult to use. By
replacing paper with technological tools that better fit the needs of in situ data collection and data
storage, HIT could empower their use of data for coordination.
References
Bier, E.A., Ishak, E.W., & Chi, E.H. (2006). Entity workspace: an evidence file that aids memory, inference, and reading. In Proceedings of ISI ’06, 466-472.
Beyer, H., & Holtzblatt, K. (1998). Contextual Design: Defining Customer-Centered Systems. Morgan Kaufmann Publishers, Inc.
Brooks, P. (1994). Adding value to usability testing. In J. Nielsen & R. L. Mack, Usability Inspection Methods (pp. 255–271). John Wiley & Sons, Inc.
Connelly, K., Caine, K., Siek, K.A., Kientz, J.A., Kutz, D.O., Hanania, R., Khan, D., & Choe, E.K. (2012). Evaluating Off-the-Shelf Technologies for Personal Health Monitoring, Ubicomp 2012 workshop proposal abstract.
Cramer, M.D., Hirano, S., Tentori, M., Yeganyan, M., & Hayes, G.R. (2011). Classroom-Based Assistive Technology: Collective Use of Interactive Visual Schedules by Students with Autism. In Proceedings of CHI ‘11, 1-10.
Esterberg, K.G. (2002). Qualitative Methods in Social Research. McGraw-Hill.
Hayes, G.R. & Abowd, G.D. (2006). Tensions in Designing Capture Technologies for an Evidence-Based Care Community. In Proceedings of CHI ‘06, 937–946.
Hayes, G.R., Gardere, L.M., Abowd, G.D. & Truong, K.N. (2008). CareLog: A Selective Archiving Tool for Behavior Management in Schools. In Proceedings of CHI ‘08, 685-694.
Hayes, G.R., Hirano, S., Marcu, G., Monibi, M., Nguyen, D.H., & Yeganyan, M. (2010). Interactive Visual Supports for Children with Autism. Personal and Ubiquitous Computing, 14(7), 663-680.
Hirano, S., Yeganyan, M., Marcu, G., Nguyen, D., Boyd, L.A., & Hayes, G.R. (2010). vSked: Evaluation of a System to Support Classroom Activities for Children with Autism. In Proceedings of CHI ‘10, 1633-1642.
39
Kientz, J.A., Hayes, G.R., Westeyn, T.L., Starner, T., & Abowd, G.D. (2007). Pervasive computing and autism: assisting caregivers of children with special needs. IEEE Pervasive Computing, Jan 2007, 28–35.
Lofland, J., Snow, D.A., Anderson, A., & Lofland, L.H. (2006). Analyzing Social Settings: A Guide to Qualitative Observation and Analysis (4th Ed). Thomson Wadsworth.
Mackay, W.E. (2000). Is Paper Safer? The Role of Paper Flight Strips in Air Traffic Control. ACM Transactions on Computer-Human Interaction, 6(4), 311-340.
Mackay, W.E. & Fayard, A-L. (1998). Designing Interactive Paper: Lessons from three Augmented Reality Projects. In Proceedings of International Workshop on Augmented Reality. A K Peters, Ltd.
Nazneen, Boujarwah, F.A., Rozga, A., Abowd, G.D., Arriaga, R.I., Oberleitner, R., & Pharkute, S. (2012). Towards in-home collection of behavior specimens: Within the cultural context of autism in Pakistan. In Proceedings of PervasiveHealth ‘12, 9-16.
Plotz, T., Hammerla, N.Y., Rozga, A., Reavis, A., Call, N., & Abowd, G.D. (2012). Automatic Assessment of Problem Behavior in Individuals with Developmental Disabilities. In Proceedings of Ubicomp ‘12, 391-400.
Sano, A., Hernandez, J., Deprey, J., Eckhardt, M. Picard, R.W., & Goodwin, M.S. (2012). Multimodal Annotation Tool for Challenging Behaviors in People with Autism Spectrum Disorders. Ubicomp 2012 Workshop on Ubiquitous Mobile Instrumentation.
Shehory, O., Sycara, K., Sukthankar, G., & Mukherjee, V. (1999). Agent aided aircraft maintenance. In Proceedings of Intl. Conf. on Autonomous Agents ‘99, 306-312.
Tognazzini B. (2012). Ask TOG: First principles of interaction design. [2012 May 23]. http://www.asktog.com/basics/firstPrinciples.html.
Westeyn, T.L., Abowd, G.D., Starner, T.E., Johnson, J.M., Presti, P.W., & Weaver, K.A. (2012). Monitoring children’s developmental progress using augmented toys and activity recognition. Personal and Ubiquitous Computing, 16(2), 169-191.

40
41
Chapter 3
Collaborative reflection: how coordination works when it is data-driven
The study presented in Chapter 2 showed that coordination in special education relies heavily on the use
of manually recorded data, but the persistence of paper limits the effectiveness of data for coordination.
Chapter 2 also began to propose ways that HIT can improve the use of data for coordination. In this
chapter, I present continued fieldwork that more closely examined when coordination was data-driven
and when it was not. In this phase of fieldwork, I developed a theoretical construct, collaborative
reflection, which describes what is needed for coordination to be data-driven. The process of
collaborative reflection that I observed in my fieldwork is (1) unstructured, (2) mobile, (3) reciprocally
interdependent, and (4) long-term. Within this iterative process, I describe a short-term loop and long-
term loop of reflection that connect the use of data to coordination practices over time. I further engaged
informants in a participatory design process to understand how HIT could be designed to fit this process,
and developed in seven design recommendations. This chapter presents the role of HIT as supporting
the process of collaborative reflection in order to make coordination more data-driven. Findings from
this study suggest that HIT could improve reliability of data recorded by multiple providers, improve
availability and access for all team members to reflect on data, and help teams more frequently
corroborate interpretations of data.
3.1. Data-driven coordination in behavioral and mental health services
In Chapter 2, I used the example of special education to illustrate how services are meant to be data-
driven but managing and using data is not trivial. The unfulfilled promise of HIT includes a failure to
support the informal documentation and communication that enable effective use of data (Oborn,
Barrett, & Davidson, 2011; Park, Pine, & Chen, 2013; Pine & Mazmanian, 2014). For example, Pine and
Mazmanian found that a hospital’s existing standards applied as-is to the design of HIT caused “negative
organizational outcomes, effectively undermining coordination and necessitating inaccurate accounts of
work” (2014, p. 1). In this study I used qualitative fieldwork and participatory design to investigate how
HIT could be designed to alleviate these problems.
I continued my fieldwork in the context of behavioral and mental health services because it provided a
rich context for exploring informal and unpredictable coordination practices. Contrasting the
standardization of HIT in organizations such as hospitals, in this context protocols are only partially
standardized because services require a significant amount of flexibility (Marcu, Tassini, Carlson,
42
Goodwyn, Rivkin, Schaefer, Dey, & Kiesler, 2013). Behaviors are recorded to evaluate the effectiveness
of behavioral interventions and psychiatric medications. However, behavioral data are difficult to both
record and interpret. This type of data requires subjective manual entry by behavioral specialists.
Objective and automated measures cannot be used, though research in computational behavioral science
aims to make this possible in the future.
In addition to the subjectivity of the data, the highly social nature of providing data-driven health
services complicates the design of HIT:
The development and implementation of such technologies are processes of ongoing negotiations, involving many
different stakeholders that fight for their positions, and their views on how things should be organized. Second,
because the ‘final’ IT application is the outcome of these processes, it itself ‘reflects’ this coming-into-being. (Berg,
2003, p. 38)
I used an anthropological approach to this work in order to negotiate the meaning and role of a new
system together with informants, and involve them in the process of the system coming into being. In
order for a system to be accepted and make a positive impact in this context, it needs to fit into the
existing workflow.
I followed up the formative fieldwork described in Chapter 2, which investigated coordination in seven
special education programs, with a more focused study in two of the schools. Treatment teams in these
schools were comprised of behavioral specialists, educators, personal aides, psychiatrists, mental health
therapists, speech therapists, occupational therapists, supervisors, and administrators. The programs
integrated treatment typical of psychiatric clinics within the school day, enabling a child to live at home
and attend school while receiving support to address behavioral, emotional, or social challenges on a
daily basis. Children in these programs had diagnoses such as autism spectrum disorders, neurological
impairments, and emotional disturbance. Symptoms and behaviors of these disorders vary and change
over time, making it important to document behavior and progress (or lack of progress) from treatment
interventions. Decision-making is complex due to the long-term nature of treatment and the invisibility
of underlying conditions. Teams relied on manually recorded behavioral data (e.g., social behaviors,
aggressive behaviors, behaviors related to skills for independent living) for to make data-driven decisions
about behavioral intervention.
43
3.2. Methods
In this phase of fieldwork, a research team of 15 interaction designers, developers, and HCI practitioners
conducted 71 person-hours of observation and 67 interviews with staff. Our approach to collecting and
analyzing field data was based on constructivist grounded theory (Charmaz, 2006). In particular, we
focused on gathering rich data using theoretical sampling across team members and contexts, constant
comparison with data previously collected, as well as opinions of domain experts at our field sites, and
inductive thematic analysis. We visited sites at least once a week, sometimes several times a week.
During fieldwork, members of the research team took detailed notes and photographs of the artifacts
and environments. We used affinity analysis (Kolko, 2011) to identify themes inductively. We used an
iterative process to discuss themes while continuing to gather field data. The research team met several
times a week to analyze and compare fieldwork data. Using a collaborative approach grounded in data
from field sites, models of knowledge sharing and implications of work practices were iteratively
developed based on inductive themes.
In the spirit of action research (Hayes, 2011), we collaborated with our field sites to define the problem
(recording and use of data for coordination) and decide on an iPad solution. We conducted contextual
inquiries with school staff to understand their coordination practices and use of artifacts, and studied
work practices using aspects of contextual design (Beyer & Holtzblatt, 1998). We used naturalistic
observation (Lofland, Snow, Anderson, & Lofland, 2006) in combination with interviews and focus
groups to understand coordination practices in detail. Applying the participatory design framework
outlined in (Marcu, Bardram, & Gabrielli, 2011), which is tailored to mental health systems, we involved
providers in designing a system that could meet their needs. We used interviews and focus groups with a
variety of users, and iteratively showed design mockups to users for feedback over the course of one
year.
3.3. Findings
The documentation and communication practices I observed, which I call “collaborative reflection”, had
four characteristics: they were (1) unstructured, (2) mobile, (3) reciprocally interdependent, and (4)
long-term.
Prior use of the term collaborative reflection by Prilla, Degeling, & Herrmann (2012) describes people’s
reflections on their experiences and memories to aid learning. In this paper, we use the term differently,
to mean pooling and reflecting on patient data to aid decision-making. In the sense that it emphasizes
44
collaborative information sharing and decision making, our use of the term is similar to what has been
called collaborative sensemaking (e.g., Paul & Reddy, 2010). However, the sensemaking concept has
often been used to describe information seeking, time-critical decision-making, and the input of
individuals who are not reciprocally interdependent—aspects that were not part of the collaboration we
observed. Prior work on collaborative sensemaking within the domain of children with special needs has
focused largely on information sharing practices (e.g., Piper, D’Angelo, & Hollan, 2013), especially to
increase the accuracy of data collection (e.g., Kientz, Hayes, Abowd, & Grinter, 2006). In contrast, we
are concerned with supporting communication and collaboration for interpreting and using the
subjective data that are collected in this domain.
The teams we studied reflected on data to monitor students’ long-term behavioral change and treatment.
As change occurred, the teams retrospectively re-interpreted data. They were reciprocally interdependent
in decision-making, meaning that each depended on others to do their work, and decisions were often
jointly made. Thus my use of the term reflection rather than sensemaking. The concept of reflection
which I use draws from personal informatics, where the same process has been studied within an
individual (Li, Dey, & Forlizzi, 2010).
3.3.1. Unstructured
Treatment teams used face-to-face communication and paper records in unstructured ways for virtually
all of their collaborative work. We observed many informal interactions during which critical
information and expertise were being transferred informally among team members. Therapists used the
few minutes they were physically in the classroom to check in with a child’s classroom staff, consisting
of a teacher and several teaching aides. For example, an occupational therapist took a child from his
classroom twice a week for a one-on-one therapy session. The therapist picked up the student from his
classroom, walked him to her office for the session, and then escorted him back to his classroom
afterwards.
In one instance of the brief interaction when an occupational therapist brought a student back to his
classroom, there was a discussion about generalizing the skills learned in therapy. The therapist had
used the day’s session to work on the task of the child putting on his jacket independently. She asked
the classroom staff what they typically do with his jacket at the end of every school day; do they hand it
to him or put it on for him? She suggested they hand it to him, since he had shown enough progress that
he should be able to put his jacket on by himself. Practicing everyday when he left school would help
45
him to continue making progress. This informal communication based on the therapist’s observations
was one example of how unstructured practices were more effective for treatment team collaboration
than structured records and practices.
The flexibility and adaptability of paper records accorded staff the ability to more easily coordinate their
unstructured work. Staff considered paper-based notes, charts, and to-do lists flexible and easy to use.
For example, jotting something on a post-it note reminded a team member to share some information
with someone else on the team. Paper data sheets and reports, although they typically comprised a form
or template for tracking children’s behavior and problems over time, also offered the opportunity for
unstructured communication. Our observations of the appropriations of paper and frequency of ad hoc
interactions helps to explain the ways in which information technology failed to meet the team’s needs,
as similarly reported by Marcu et al. (2013), Park et al. (2013), and Weibel, Emmenegger, Lyons, Dixit,
Hill, & Hollan (2013). In our study, we saw that the process of reflecting involves unstructured and
informal work that cannot be formalized.
3.3.2. Mobile
Team members exchanged information and knowledge in multiple places: meeting rooms for formal
meetings, and informal interactions in hallways, classrooms, and the cafeteria. They used multiple
resources, not just word of mouth, but also paper data collected in different ways by different people.
Spontaneous informal meetings among team members happened everywhere. Team members might be
in a formal meeting reviewing a child’s case, they might be engaging with a child together, or they might
run into one another in the hallway and have something to discuss about a child.
In their study of collaboration in hospitals, Bardram and Bossen (2005) identified four aspects of what
they call mobility work: resources, persons, places, and knowledge. These observations resonate with
ours. We found that paper records were critical resources that were shared and discussed within teams;
the persons involved in reflecting on the data were a variety of specialists that make up a treatment
team; the places where interaction takes place ranged from conference rooms (formal) to hallways
(informal) to classrooms (at times chaotic); and finally, that reciprocal interdependence drove exchange
of knowledge.
Resources
Behavioral data were recorded on a regular basis to evaluate and support a child’s unique needs with
customized interventions. Behaviors were recorded in two ways: positive behaviors that interventions
46
aimed to increase (e.g., following directions, appropriate social interactions) or negative behaviors that
interventions aimed to decrease (e.g., verbal or physical aggression, anxiety-induced avoidance of social
situations).
Teams implemented a token economy—a type of psychotherapy typically used for behavioral
intervention, which reinforces desired behavior through the tracking of tokens (or points) that can be
exchanged for rewards. The token economy was the main part of their data collection, and together with
some free form note taking, formed the records used to regularly assess and make decisions about the
individualized support provided to each child.
The teams struggled to find appropriate computer-based tools to support recording and use of data
(Marcu et al., 2013). Much of their process was paper-based and cumbersome. Records were paper data
sheets and paper scatter plots. Data were frequently transferred among various forms and reports.
Summaries were overly abstracted, and human errors were difficult to avoid. Data were ultimately stored
in binders, where they were not easily reviewed or shared.
Persons
Both programs had psychiatrists, mental health therapists, behavioral specialists, educators, personal
aides, speech therapists, and occupational therapists. Each child was assigned a treatment team
consisting of a subset of these specialists, based on the unique behavioral and mental health needs of
that child.
Due to the difficulty of reviewing and sharing data, teams most often made decisions based on
anecdotes, intuition, and highly abstracted data. While teams were able to achieve positive outcomes
using these methods because they primarily needed to rely on human intuition and expertise, they
recognized that significant untapped potential lay in the data, which was not used enough in
determining trends and evaluating interventions.
Places
Team members were collocated within the school building. Their work practices were both synchronous
and asynchronous. Teaching staff stayed mostly within the bounds of their classroom. Other staff, such
as therapists and supervisors, worked across classrooms and moved throughout the school during the
workday. Therapists moved between classrooms on a schedule, while supervisors were on call and
moved between classrooms based on where they were needed.
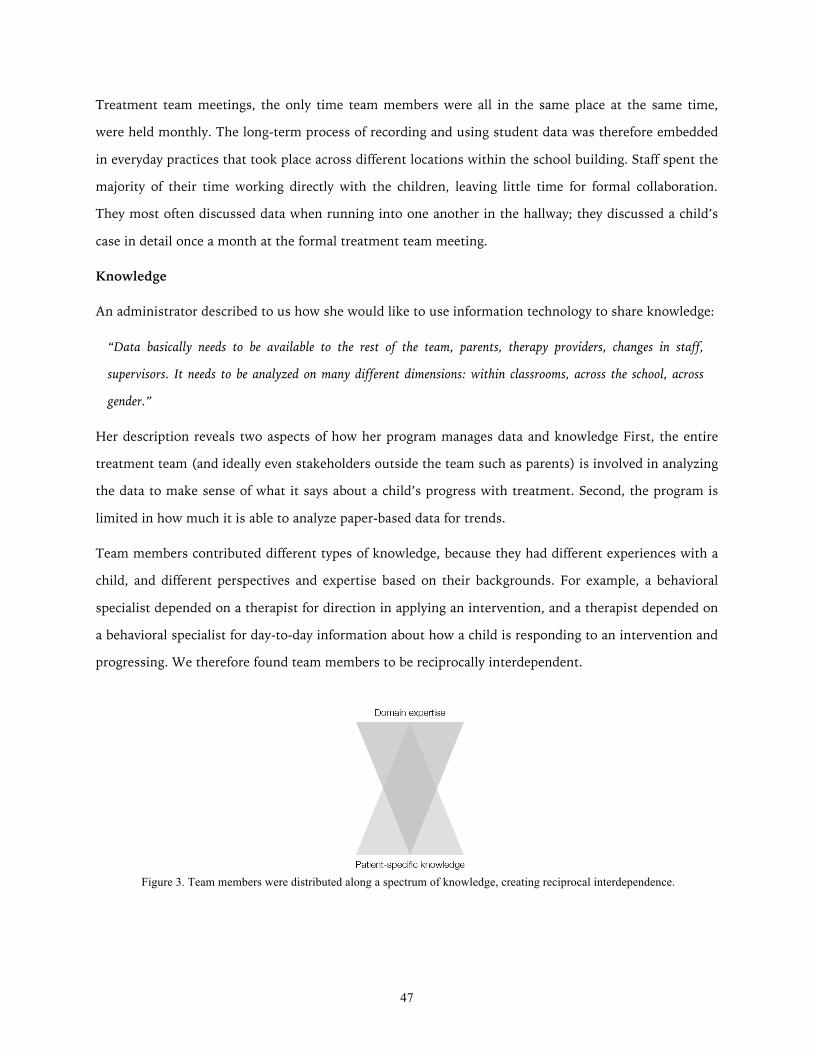
47
Treatment team meetings, the only time team members were all in the same place at the same time,
were held monthly. The long-term process of recording and using student data was therefore embedded
in everyday practices that took place across different locations within the school building. Staff spent the
majority of their time working directly with the children, leaving little time for formal collaboration.
They most often discussed data when running into one another in the hallway; they discussed a child’s
case in detail once a month at the formal treatment team meeting.
Knowledge
An administrator described to us how she would like to use information technology to share knowledge:
“Data basically needs to be available to the rest of the team, parents, therapy providers, changes in staff,
supervisors. It needs to be analyzed on many different dimensions: within classrooms, across the school, across
gender.”
Her description reveals two aspects of how her program manages data and knowledge First, the entire
treatment team (and ideally even stakeholders outside the team such as parents) is involved in analyzing
the data to make sense of what it says about a child’s progress with treatment. Second, the program is
limited in how much it is able to analyze paper-based data for trends.
Team members contributed different types of knowledge, because they had different experiences with a
child, and different perspectives and expertise based on their backgrounds. For example, a behavioral
specialist depended on a therapist for direction in applying an intervention, and a therapist depended on
a behavioral specialist for day-to-day information about how a child is responding to an intervention and
progressing. We therefore found team members to be reciprocally interdependent.
Figure 3. Team members were distributed along a spectrum of knowledge, creating reciprocal interdependence.
48
3.3.3. Reciprocally interdependent
Reciprocal interdependence exists in a relationship in which both parties rely on one another for
information to be able to complete their work (Thompson, 1967/2013). Reciprocal interdependence
requires more than information sharing, it involves frequent communication and knowledge sharing.
The team members we studied were reciprocally interdependent for several reasons: data were collected
by multiple staff members and later aggregated; staff had unique experiences and data about one child;
and staff were drawing knowledge from different areas of expertise.
Team members were reciprocally interdependent because they each only knew part of the narrative
making up a child’s story and trajectory. Team members worked with the same child in different
contexts, so they each developed unique knowledge based on different behaviors they were witness to in
different situations. Treatment teams integrated all of these perspectives through collaborative
reflection, to understand a child’s progress and make treatment decisions over time.
Team members were distributed along a spectrum of specialized knowledge, illustrated in Figure 1.
Those who spent most time with the children had detailed knowledge about their day-to-day life,
behaviors, progress, personality, and needs. These individuals, represented by the bottom of the lower
triangle in Figure 1, were parents and paraprofessionals (e.g., teaching aides, personal care assistants).
Some had formal training or expertise, and all applied practical knowledge from working hands-on with
a focused caseload or loved one. Domain experts, represented by the top triangle in Figure 1, were
clinical supervisors and psychiatrists. They managed a larger caseload, so they had a high-level
understanding of each child without day-to-day details. These professionals used their expertise and
knowledge of best practices to provide diagnosis, prescriptions, treatment plans, and other high-level
direction.
Some team members, such as therapists, fell somewhere in the center of the spectrum. For example,
speech therapists had expertise in speech-language pathology and applied it to their work with the same
child once or twice a week. Although they had some regular contact with the child, outside of these one-
on-one therapy sessions, speech therapists depended on other staff members for information about the
child’s regular progress.
3.3.4. Long-term
The safety-critical aspect of behavioral and mental health services is long-term rather than immediate.
Teams tracked children’s behaviors over time, and we heard references to concepts such as “predictors”
49
of behaviors over time. One of the schools tracked treatment periods of 20 days, comparing the current
treatment period with the previous treatment period to evaluate the effects of interventions. Treatment
team meetings were for reflecting on a child’s progress and making decisions about interventions for the
next treatment period.
Our observations brought to light information practices that held long-term weight in two ways. First, a
multitude of daily decisions could impact long-term outcomes for a child. Second, the focus on change
over time required records of children’s behavior over time that could be compared, not just for change
but also for “predictors.” With good, easily accessible information, providers would be able to review
large amounts of information and corroborate interpretations and decisions with others. Unfortunately,
the mass of paper data in pages of charts and notes were not as useful as they might be for this purpose,
as the data could not be manipulated or viewed in different ways to answer questions about a child’s
progress and treatment.
Our findings demonstrate a need for information technology that can support an understanding of
information over time; help users identify and explain trends over time; and even help to predict
behaviors or outcomes into the future.
3.4. Collaborative Reflection
The coordination practices we observed were not adequately supported by information technology.
Treatment teams had evaluated existing technologies, especially iPad apps. They told us that none were
an improvement over their paper methods. The limitations of apps they had tried, documented in more
detail in (Marcu et al., 2013), included poor usability, lack of scalability for their number of students, and
lack of flexibility for recording and sharing data in their distributed environment. Improving their paper
methods remained an unsolved problem. The challenges our field sites faced with incorporating
information technology to help them record and share their data were similar to those experienced in
other settings (Mentis, 2010; Niazkhani, Pirnejad, Berg, & Aarts, 2009; Park, et al., 2013) suggesting
that the collaborative processes we focused on are relevant for a variety of domains and systems.
I have named the process we observed collaborative reflection because team members were reciprocally
interdependent on one another’s knowledge and had to collaborate in interpreting data to make long-
term treatment decisions. Further, making these ongoing decisions required retrospective reflection on
the data as they changed over time. Figure 2 illustrates the collaborative reflection process, consisting of
two iterative loops.
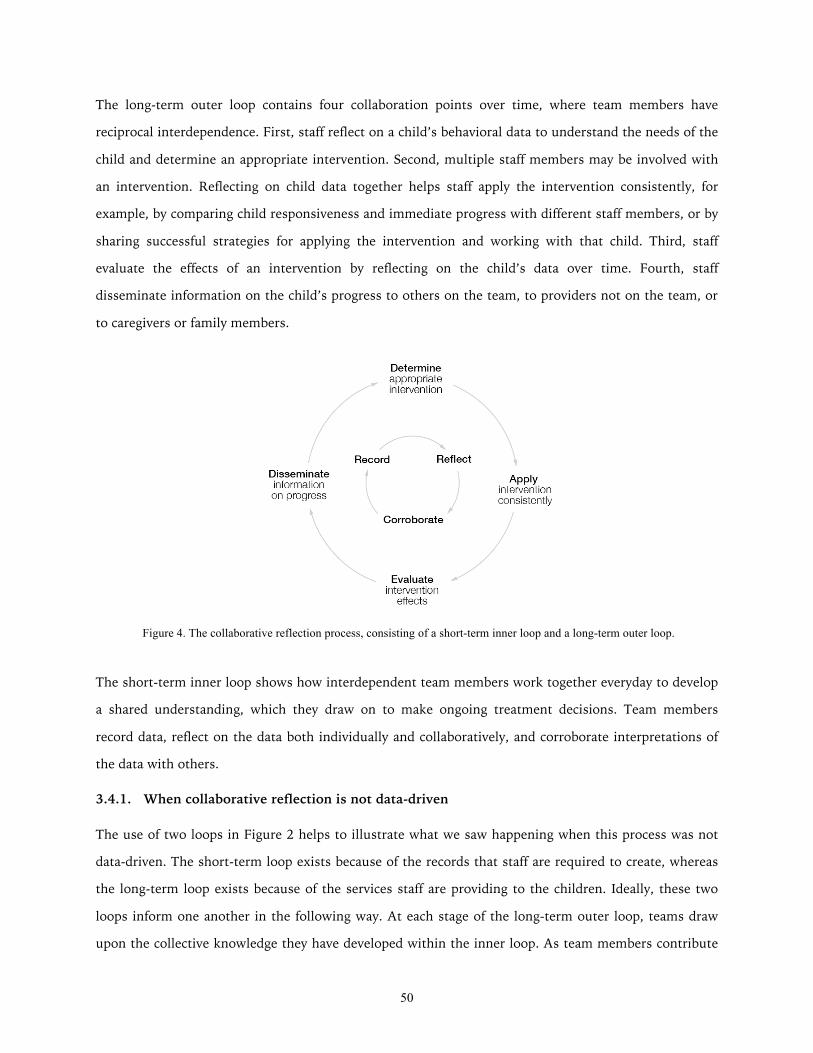
50
The long-term outer loop contains four collaboration points over time, where team members have
reciprocal interdependence. First, staff reflect on a child’s behavioral data to understand the needs of the
child and determine an appropriate intervention. Second, multiple staff members may be involved with
an intervention. Reflecting on child data together helps staff apply the intervention consistently, for
example, by comparing child responsiveness and immediate progress with different staff members, or by
sharing successful strategies for applying the intervention and working with that child. Third, staff
evaluate the effects of an intervention by reflecting on the child’s data over time. Fourth, staff
disseminate information on the child’s progress to others on the team, to providers not on the team, or
to caregivers or family members.
The short-term inner loop shows how interdependent team members work together everyday to develop
a shared understanding, which they draw on to make ongoing treatment decisions. Team members
record data, reflect on the data both individually and collaboratively, and corroborate interpretations of
the data with others.
3.4.1. When collaborative reflection is not data-driven
The use of two loops in Figure 2 helps to illustrate what we saw happening when this process was not
data-driven. The short-term loop exists because of the records that staff are required to create, whereas
the long-term loop exists because of the services staff are providing to the children. Ideally, these two
loops inform one another in the following way. At each stage of the long-term outer loop, teams draw
upon the collective knowledge they have developed within the inner loop. As team members contribute
Figure 4. The collaborative reflection process, consisting of a short-term inner loop and a long-term outer loop.
51
individual knowledge to recording and reflection, this integration of knowledge, and the process of
corroborating knowledge and evidence (inner loop), enables the team to interpret data collaboratively
and use their collective knowledge to make treatment decisions over time (outer loop).
However, the realities of how challenging it is to record, manage, and use data – reported in Chapter 2 –
result in a disconnect between the two loops. Staff may be required to record certain data, but when
applying interventions and making decisions about a child it was easier for them to rely on intuition and
face-to-face coordination, rather than the data. Figure 2 helps to identify where in the process I can
pinpoint, based on the findings from Chapter 2, practices that were not data-driven. In the following
chapter, I discuss how I applied this perspective to the design of a prototype, Lilypad, aimed at making
practices more data-driven.
References
Bardram, J.E. & Bossen, C. (2005). Mobility Work: The Spatial Dimension of Collaboration at a Hospital. Computer Supported Cooperative Work 14(2), 131-160.
Berg, M. (2003). Health Information Management. Routledge.
Beyer, H. & Holtzblatt, K. (1998). Contextual Design: Defining Customer-Centered Systems. Morgan Kaufmann Publishers, Inc.
Charmaz, K. (2006). Constructing grounded theory: A practical guide through qualitative analysis. Sage.
Hayes, G.R. (2011). The Relationship of Action Research to Human-Computer Interaction. ToCHI 18(3), 15.
Kientz, J.A., Hayes, G.R., Abowd, G.D., & Grinter, R.E. (2006). From the War Room to the Living Room: Decision Support for Home-Based Therapy Teams. In Proceedings of CSCW ’06, 209-218.
Kolko, J. (2011). Exposing the Magic of Design: A Practitioner’s Guide to the Methods and Theory of Synthesis. Oxford University Press.
Li, I., Dey, A., & Forlizzi, J. (2010). A stage-based model of personal informatics systems. In Proceedings of CHI ‘10, 557-566.
Lofland, J., Snow, D.A., Anderson, A., & Lofland, L.H. (2006). Analyzing Social Settings: A Guide to Qualitative Observation and Analysis (4th Ed.). Thomson Wadsworth.
Marcu, G., Bardram, J. E., & Gabrielli, S. (2011). A Framework for Overcoming Challenges in Designing Persuasive Monitoring Systems for Mental Illness. In Proceedings of PervasiveHealth ‘11, 1-8.
52
Marcu, G., Tassini, K., Carlson, Q., Goodwyn, J., Rivkin, G., Schaefer, K., Dey, A. K., & Kiesler, S. (2013). Why Do They Still Use Paper? Understanding Data Collection and Use in Autism Education. In Proceedings of CHI ‘13, 3177-3186.
Mentis, H.M. (2010). Emotion Awareness and Invisibility in an Emergency Room: A Socio-Technical Dilemma. Doctoral Dissertation. The Pennsylvania State University.
Niazkhani, N., Pirnejad, H., Berg, M., & Aarts, J. (2009). The Impact of Computerized Provider Order Entry Systems on Inpatient Clinical Workflow: A Literature Review. JAMIA 16, 539-549.
Oborn, E., Barrett, M., & Davidson, E. (2011). Unity in Diversity: Electronic Patient Record Use in Multidisciplinary Practice. Information Systems Research, 22(3), 547-564.
Paul, S. & Reddy, M. (2010). Understanding Together: Sensemaking in Collaborative Information Seeking. In Proceedings of CSCW ‘10, 321-330.
Park, S.Y., Pine, K., & Chen, Y. (2013). Local-universality: designing EMR to support localized information documentation practice. In Proceedings of CSCW ‘13, 55-66.
Pine, K. H., & Mazmanian, M. (2014). Institutional logics of the EMR and the problem of “perfect” but inaccurate accounts. In Proceedings of CSCW ’14, 283–294.
Piper, A.M., D’Angelo, S., & Hollan, J.D. (2013). Going Digital: Understanding Paper and Photo Documentation Practices in Early Childhood Education. In Proceedings of CSCW ‘13, 1319-1328.
Prilla, M., Degeling, M., & Herrmann, T. (2012). Collaborative reflection at work: supporting informal learning at a healthcare workplace. In Proceedings of GROUP ‘12, 55-64.
Thompson, J.D. (2013). Organizations in Action: Social Science Bases of Administrative Theory. Transaction Publishers. (Original work published 1967)
Weibel, N., Emmenegger, C., Lyons, J., Dixit, R., Hill, L.L., & Hollan, J.D. (2013). Interpreter-mediated physician-patient communication: Opportunities for multimodal healthcare interfaces. In Proceedings of PervasiveHealth ‘13, 113-120.
53
Chapter 4
What is needed for coordination to be data-driven?
With an explanation of why paper persists in the use of data for coordination (Chapter 2), and having
observed the process of collaborative reflection that occurs when coordination is data-driven (Chapter
3), my next phase of fieldwork focused on understanding what it takes for coordination to be data-
driven. The findings reported in this chapter come from 81 hours of fieldwork conducted over 11 months
at two of the seven organizations I began with. I first used the construct of collaborative reflection to
conduct more focused fieldwork investigating the gap between the short-term and long-term loops,
which causes processes to be less data-driven. I then generalized my fieldwork findings by comparing
them to the literature, to understand what themes were common across different health service settings.
These themes determined the main functionality of a prototype, Lilypad, designed to support data-driven
coordination based on the process of collaborative reflection. The full design of Lilypad is described in
Chapter 5.
4.1. Three barriers to data-driven practices
I observed many instances where coordination among staff was not driven by data that they had
recorded. The informants themselves sometimes discussed, unprompted, the shortcomings of the data
or their challenges with using it to inform interventions. I observed one such conversation during a
regular meeting at one of the organizations, which I will call Monet, in which team members trying to
make sense of a child’s paper-based records to reflect on his progress over the past several weeks:
Psychiatrist: “He seems to be doing better based on this data, and the brief moments I’ve seen him in the classroom
and hallway. He seems less irritable.”
Behavioral specialist (record keeper): “This is an example of how our record system doesn’t work for someone
like him, because it’s showing something else … it should be telling us, when he is supposed to be on task, is he?”
Mental health therapist: “The data may be accurate but it’s not reflecting how he’s really doing. I’m wondering if
we can separate that behavior out and record that separately.”
Behavioral specialist (record keeper): “That would be hard.” [Laughs nervously]
54
Mental health therapist: “I’m just thinking, if an auditor came in here and looked at the numbers, it would not
be reflected that he’s really where he is … how can we better reflect that he still needs to be in this program?
Somebody from the outside may think, oh he’s doing great, why is he still here?”
This vignette illustrates the three critical problems that emerged in my fieldwork: record keepers have
difficulty capturing representative records, decision makers do not have adequate access to informative
records, and intuition and face-to-face communication are more prevalent drivers than data. This chapter
illustrates how data is currently not representative and informative enough to drive the process of
collaborative reflection.
4.1.1. Record keepers have difficulty capturing representative data
During the conversation above, the psychiatrist, who had a large caseload and thus little contact with
each child, was misled to believe that a child had improved based on the records presented to her and
her own anecdotal evidence. Two other members on the team, who saw the child more regularly, jumped
in to explain that the records were not actually representative and the psychiatrist was making a
misguided conclusion.
This scenario exemplifies how teams at Monet used paper-based records and anecdotal reports to
coordinate among themselves. I heard many accounts of failed attempts to adopt HIT for the task of
recording and analyzing behaviors. One comment from a mental health therapist summed up attitudes at
Monet, especially toward one EHR they had tried using: “You’ve probably heard all about [redacted
name of a system]; that was horrible, not user friendly at all, and we had to go back to paper”. In
addition to the problem of user friendliness, it was clear during observations and interviews that the
flexibility required for coordination at Monet could not be provided by existing HIT.
Providers responsible for manually capturing data and managing records were consistently
overburdened, and the unpredictability of their environment further complicated their responsibilities. If
a provider was busy responding to an incident and intervening, he or she would not be able to create the
record until later. Recording accurate data in the moment was challenging, and staff adopted unique
practices to help them accomplish their work as conveniently as possible, in a way that worked for them.
Freeform annotations and note taking, such as jotting down notes on the margins of a piece of paper or
on a post-it note, were common. Staff even wrote on their hands during a critical incident when they did
not have access to paper. No HIT had been able to provide nearly this much flexibility, explaining why
paper persisted out of necessity.
55
HIT only came into play when it was required for reporting data to other agencies for billing and
auditing purposes. Staff were frustrated with their lack of usability and how cumbersome it was to
manually transfer data from paper to multiple reports and graphs. Complicating the task of creating
records was that staff members (and especially record keepers) were responsible first and foremost for
children’s safety and behavioral intervention. Many informants spoke about the logistical impossibility of
balancing all of the tasks they were responsible for: “there is no clerical time within the 40 hr work
week, you do billing and paperwork on your own time”. There were some efforts to incorporate use of
Microsoft Excel and specialized iPad apps into this process, but they were not successful.
I found that supervisors tended to have unrealistic expectations that an incident be recorded in the
moment, or immediately thereafter. However, the accuracy and timeliness of a record depended on the
provider’s availability to create the record. The gap between what was expected and what was possible
was a significant issue during design work—some supervisors at Monet were unaware of this gap, and all
of them were unsure of how to address it. I saw frustration among the record keepers expected to create
and manage records without adequate support or tools, and their frustration grew with each passing
month.
One record keeper recounted a conversation with his supervisor during which he was once again asked
to record more data, without additional support. Having tried different ways to ask for support, he
suggested to his supervisor: “we should do time studies to figure out how long all of these recording
activities will take”. The supervisor rejected the idea, saying, “this isn’t a factory”. The record keeper’s
reaction was “yes, it is”—revealing his disappointment that the demands of records were intervening
with the human aspects of his job working with children. This record keeper often shared his feelings
with us, typically using his sarcastic humor to express his frustration with supervisors’ unrealistic
expectation that he manage both clerical work and providing behavioral intervention to multiple
children: “they’re turning this into an office job—inside a petting zoo!”
4.1.2. Decision makers do not have adequate access to informative data
The earlier vignette showed how records informed treatment decisions by communicating progress both
internally and externally. External decision makers included auditors who license organizations like
Monet so that they can provide services, and parents who decide which organization and treatment is
best for their child.
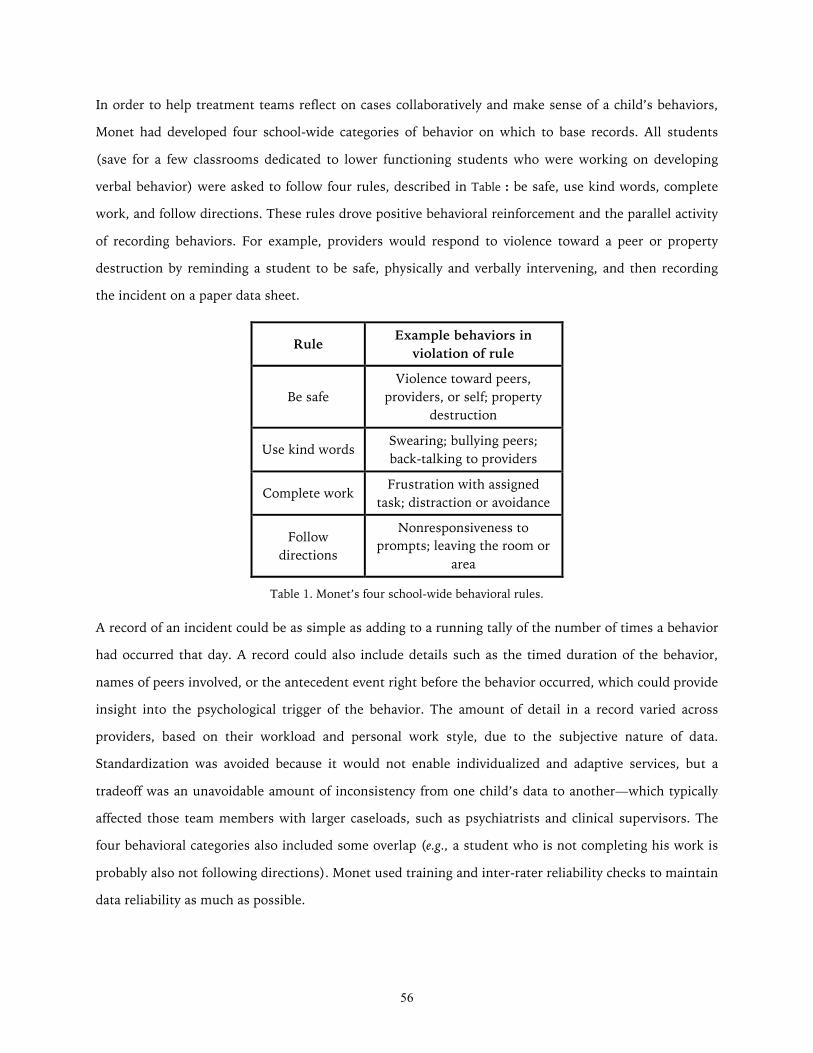
56
In order to help treatment teams reflect on cases collaboratively and make sense of a child’s behaviors,
Monet had developed four school-wide categories of behavior on which to base records. All students
(save for a few classrooms dedicated to lower functioning students who were working on developing
verbal behavior) were asked to follow four rules, described in Table : be safe, use kind words, complete
work, and follow directions. These rules drove positive behavioral reinforcement and the parallel activity
of recording behaviors. For example, providers would respond to violence toward a peer or property
destruction by reminding a student to be safe, physically and verbally intervening, and then recording
the incident on a paper data sheet.
Rule Example behaviors in violation of rule
Be safe Violence toward peers,
providers, or self; property destruction
Use kind words Swearing; bullying peers; back-talking to providers
Complete work Frustration with assigned task; distraction or avoidance
Follow directions
Nonresponsiveness to prompts; leaving the room or
area
Table 1. Monet’s four school-wide behavioral rules.
A record of an incident could be as simple as adding to a running tally of the number of times a behavior
had occurred that day. A record could also include details such as the timed duration of the behavior,
names of peers involved, or the antecedent event right before the behavior occurred, which could provide
insight into the psychological trigger of the behavior. The amount of detail in a record varied across
providers, based on their workload and personal work style, due to the subjective nature of data.
Standardization was avoided because it would not enable individualized and adaptive services, but a
tradeoff was an unavoidable amount of inconsistency from one child’s data to another—which typically
affected those team members with larger caseloads, such as psychiatrists and clinical supervisors. The
four behavioral categories also included some overlap (e.g., a student who is not completing his work is
probably also not following directions). Monet used training and inter-rater reliability checks to maintain
data reliability as much as possible.
57
I also discovered conflicting information needs across decision makers, which helped to explain the
unrealistic expectations for recording practices, and why these tensions remained unresolved. Insurance
companies required specific information for billing purposes, such as detailed logs of work hours and
activities. Each provider was required to justify their work with each child, sometimes down to the
minute, to be assured their regular pay. Monet administrators passed down these instructions to their
employees, sometimes with specific software to be used for reporting records for billing. Insurance
companies requested daily narratives to be written for each child, outlining their treatment and progress.
These narratives were to be entered into a poorly designed and time-consuming piece of software.
Audits were common, sometimes once a year, adding to the pressure of having to create detailed and
accurate records so as to not create problems for oneself or the organization. Administrators were in a
difficult position, having to adhere to requirements from insurance companies, and passing these down
to their employees. Meanwhile, providers were more concerned with the nuances of carrying out a
treatment plan, rather than reporting out progress so regularly. Providers were driven to record data that
would help with sensemaking and reflection for making treatment decisions. They were therefore
frustrated when records needed to be created for mere logistical purposes, and took up a significant
amount of the time they had with the children. The day before an audit, for example, some providers
who typically worked full time in a classroom had to take time completely away from their regular jobs
in order to find a quiet place to sit at a computer and work on records. Even more frustratingly, last
minute requests for more data continued to come in from their supervisors.
4.1.3. Intuition and face-to-face communication are more prevalent drivers than data
Coordination at Monet needed to be flexible because the responsibility of maintaining a safe
environment and providing all of the children the support they needed was dispersed across all staff in
the organization. The nature of behavioral and mental health services required Monet’s staff members to
support one another and jump in to fulfill responsibilities. Regardless of whether staff held roles such as
teacher, therapist, or supervisor, to ensure the safety and wellbeing of children and staff alike, all staff
members were trained to respond to behavioral incidents, and did so at a moment’s notice when the
need arose.
For example, when a child grew frustrated and left the classroom, at least one staff member would
follow him into the hallway (or outside) to ensure his safety, talk him through managing his emotions,
and generally wait him out until he was able to calm down and move on. This process could take
minutes or hours. Meanwhile, the remaining staff members in the classroom needed to continue the
58
current activity with the rest of the children, and ensure record keeping continued. A staff member from
outside of that classroom, such as a therapist or supervisor, sometimes filled in if additional support is
needed during this time period. As such episodes were unpredictable and could accumulate across
multiple children at any given moment without warning, staff members were always ready to diffuse
responsibility at a moment’s notice.
The social aspects of this diffusion generally ran smoothly because the staff were well trained and
prepared to use their instincts and work together. Staff members were able to ask for support through
several established social channels such as gesturing to a team member, making a request to any staff
member in the hallway, or calling their assigned supervisor who was always on call and would answer
their mobile phone even during meetings. However, despite how effective these social channels were,
the records were not effective for coordination. The paper-based records acted as a mechanistic system,
thus not matching the need for an organic way of keeping all team members informed and adapting to
each situation. When records were not representative or informative enough, staff relied on anecdotal
evidence and their intuition—as the psychiatrist in our earlier vignette did in the context of a formal
meeting.
4.2. Standardization and the unfulfilled promise of health information technology
The three problems that I observed are not unique to the setting that I studied. Comparing my findings
to health informatics literature, I saw a common theme surrounding the standardization of formalized,
structured workflow through HIT, which conflicts with the reality of informal, unpredictable workflow
that takes place in health services.
Standardized processes are a stark contrast to the process of collaborative reflection that I observed.
Similar to my findings, others have revealed the inadequacy of tools that aim to increase standardization,
for example with handoffs in hospitals (Cohen & Hilligoss, 2008). Historically, the design of HIT has
focused heavily on standardization of practices (Kimble, 2014; Berg, 2003). An increasing amount of
literature shows that the promise of HIT – reducing human error and cost, while improving
coordination, best practices, and efficiency – remains largely unfulfilled (Kimble, 2014; Berg, 2003). As a
result, the focus on standardization is now being called into question.
The introduction of information systems has been plagued by unintended consequences—many of which
actually undermine communication and coordination (Stoller, 2013). These unintended consequences
are being attributed to design toward standardization: “information technology is seen by many to be
59
[the solution], yet the standardization of health care work that this requires may render this ‘solution’ to
be fatally contradictory to the nature of health care work and information” (Berg, 2003, p. 79). Mentis,
too, calls out the “a lack of understanding how medical workers realistically coordinate and share
information” (2010, p. 3).
A focus on standardization has let to the design of HIT that tends to overemphasize structure, and not
support informal documentation and communication (Harrison, Koppel, & Bar-Lev, 2007; Park, Pine, &
Chen, 2013; Weibel, Emmenegger, Lyons, Dixit, Hill, & Hollan, 2013). Informal practices tend to be
overlooked in the design of HIT. In striving for standardized and perfect accounts, research shows that
HIT actually undermines accuracy in records (Pine & Mazmanian, 2014). In an increasingly complex
health care system, there is an "unprecedented requirement for adaptability" (Schön, 1983, p. 15), which
HIT is not currently designed for. Studies have revealed that HIT misrepresents communication as
information transfer, and misrepresents collective, interactive work as linear, predictable workflow
(Harrison et al., 2007).
According to Berg (2003), “technology development still all too often tends to be considered as an
autonomous or neutral process” (p. 38) – yet HIT is “thoroughly social” (p. 37). A focus on
standardization has resulted in what Diana Forsythe refers to as HIT that “delete the social” (1992, p.
111). Her extensive fieldwork in medical settings showed that because HIT is “designed, built, and
evaluated according to procedures that ‘delete the social’ and mute the voice of users, most of these
systems remain ‘on the shelf,’ a fact which is hardly surprising” (1992, p. 111). The design limitations
that caused the low adoption rates Forsythe observed in the 1990s continue to cause the unintended
consequences reported today. Rates of adoption have naturally increased given the prevalence of
information technology, yet “despite the fact that similar systems had been used outside healthcare for a
number of years, definitive evidence of their success in the healthcare domain remains elusive” (Kimble,
2014, p. 1).
The design of HIT continues to not match social practices, and higher adoption has led to a higher
incidence of unintended consequences. Design problems also plague consumer health applications,
which have low rates of adoption and impact, despite the pervasiveness of smart phones and the high
availability of health applications aiming to empower patients (Bebinger, 2013; Shute, 2013). Although
they target both providers and consumers of health services, information technologies are not improving
coordination in health services.
60
4.3. Changing focus from standardized practices to social practices
In this thesis, then, I take an alternative approach to one that prioritizes standardization and risks a
result that will “delete the social”. Instead I begin with the social, and then explore how much
standardization is appropriate. My design work is based on Berg’s (2003) idea that “‘flexible
standardization’ is not a contradiction in terms” (p. 79). I am ultimately concerned with determining
how information technology can support realistic coordination despite the amount of unpredictability
and subjectivity involved in health services. I investigate the social aspects of coordination by looking at
coordination at the organizational level. Using an organizational lens provides a complementary
perspective to approaches such as cognitive psychology (e.g., activity theory, distributed cognition), by
showing the realistic, logistical, and subjective aspects of HIT implementation that occur at the
organizational level.
4.3.1. Sensemaking and reflection in organizations
The term sensemaking has been commonly applied to the organizational process of interpreting and
acting on data by applying knowledge, experience, and available resources (Weick, 1995). Sensemaking
plays a key role in health services (Paul & Reddy, 2010). Weick (1993) famously described the
enactment of sensemaking, describing how the process plays out through the actions of individuals
within an organization—including what happens when the process breaks down.
While some studies focus on sensemaking in a lab setting, I am concerned with the naturalistic
enactment of sensemaking in the real world, which is called macrocognition. Macrocognitive models of
sensemaking include Klein, Moon, and Hoffman’s (2006) Data/Frame Theory, which describes the active
process of framing and interpreting data. Frames are used to “shape the data (for example, a house fire
will be perceived differently by the homeowner, the firefighters, and the arson investigators)” and they
also “change as we acquire data” (p. 1). Through a bidirectional process, frames “shape and define the
relevant data, and data mandate that frames change in nontrivial ways” (p. 1). The frame metaphor
captures the unpredictable nature of sensemaking in the real world.
Others have described this unpredictability as improvisation, comparing it to the actions of skilled jazz
musicians (Miner, Bassoff, & Moorman, 2001; Schön, 1983). During improvisation, skill and memory is
applied to unexpected, non-routine events. Miner et al.’s (2001) field study found that this process was
embedded in collective processes: “the distinct competencies in improvisation did not appear to reside in
specific individuals; rather, they flowed from broader organizational routines, cultures, and collective
61
capabilities” (p. 327). Other studies have also shown how sensemaking is enacted in organizational
coordination and culture (Bardram & Bossen, 2005; Orlikowski, 2002).
Another relevant aspect of sensemaking processes in organizations is that they are focused on long-term
outcomes. Miner et al. (2001) describe how long-term processes are informed by short-term and
situational actions. Short-term improvisation can “serve as a ‘trial’ in long-term trial-and-error learning”,
and long-term learning occurs “after outcomes of action have been experienced, and new actions or
inferences arise, specifically based on the consequences of completed action” (2001, p. 321). I similarly
use the term collaborative reflection in this thesis (Chapter 3) to illustrate this process within health
service settings. Short-term activities comprise of recording data, interpreting data, and corroborating
interpretations with others. As individuals contribute these activities on a daily basis, the integration of
knowledge long-term creates a collective knowledge base that an organization draws upon over time for
treating complex and unpredictable chronic conditions.
Schön (1983) uses the term reflection as I did in Chapter 3, to connote the “complexity, uncertainty,
instability, uniqueness, and value conflicts” (p. 14) involved in professions like medicine, management,
and engineering. Increasing complexity in these fields “resists the skills and techniques of traditional
expertise” (p. 14), requiring instead what Schön refers to as reflection-in-action. There is an
unprecedented adaptability required of individuals in these professions: "85 percent of the problems a
doctor sees in his office are not in the book" (p. 16). Through reflective practice, a practitioner frames
and reframes the problem, applies past experience to the unique situation, and rigorously experiments in
the moment. Reflection-in-action enables what Erikson (1985) calls “disciplined subjectivity” when a
lack of standardization, structure, or predictability prevent objectivity.
Given the amount of improvisation, reflection, and subjectivity required, how can information
technology support sensemaking? Weick asserts that information technology can make the sensemaking
process more susceptible to breakdowns because people “act less, compare less, socialize less, pause
less, and consolidate less when they work at terminals than when they are away from them” (1985. p.
56). In clinical settings this effect has been called electronic siloing, or the discouraging of spontaneous
interaction in clinical workflow (Stoller, 2013). Weick argues that unintended effects can be reduced
through the use of mobile technologies in the field, which can make people better problem solvers
because they are “able to use different forms of data and test their hunches with triangulation” (1985, p.
62). Similarly, Bardram and Bossen’s concept of mobility work highlights the spatial aspects of problem
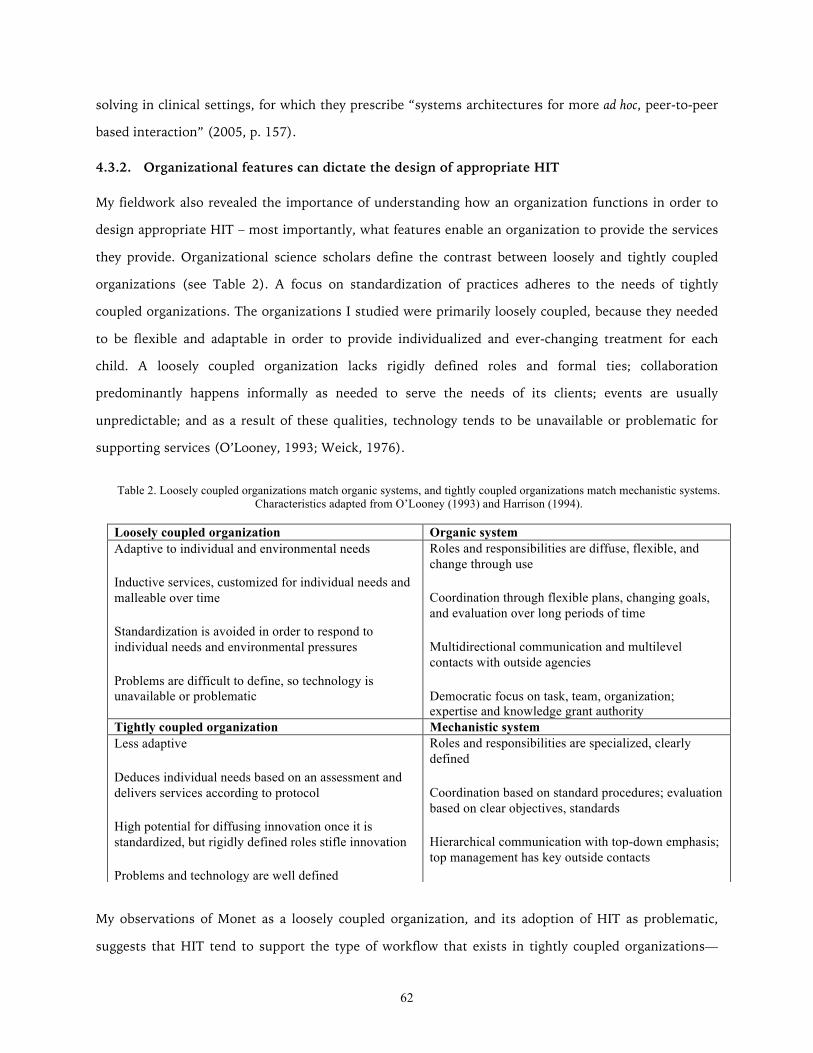
62
solving in clinical settings, for which they prescribe “systems architectures for more ad hoc, peer-to-peer
based interaction” (2005, p. 157).
4.3.2. Organizational features can dictate the design of appropriate HIT
My fieldwork also revealed the importance of understanding how an organization functions in order to
design appropriate HIT – most importantly, what features enable an organization to provide the services
they provide. Organizational science scholars define the contrast between loosely and tightly coupled
organizations (see Table 2). A focus on standardization of practices adheres to the needs of tightly
coupled organizations. The organizations I studied were primarily loosely coupled, because they needed
to be flexible and adaptable in order to provide individualized and ever-changing treatment for each
child. A loosely coupled organization lacks rigidly defined roles and formal ties; collaboration
predominantly happens informally as needed to serve the needs of its clients; events are usually
unpredictable; and as a result of these qualities, technology tends to be unavailable or problematic for
supporting services (O’Looney, 1993; Weick, 1976).
My observations of Monet as a loosely coupled organization, and its adoption of HIT as problematic,
suggests that HIT tend to support the type of workflow that exists in tightly coupled organizations—
Table 2. Loosely coupled organizations match organic systems, and tightly coupled organizations match mechanistic systems. Characteristics adapted from O’Looney (1993) and Harrison (1994).
Loosely coupled organization Organic system Adaptive to individual and environmental needs
Inductive services, customized for individual needs and malleable over time
Standardization is avoided in order to respond to individual needs and environmental pressures
Problems are difficult to define, so technology is unavailable or problematic
Roles and responsibilities are diffuse, flexible, and change through use
Coordination through flexible plans, changing goals, and evaluation over long periods of time
Multidirectional communication and multilevel contacts with outside agencies
Democratic focus on task, team, organization; expertise and knowledge grant authority
Tightly coupled organization Mechanistic system Less adaptive
Deduces individual needs based on an assessment and delivers services according to protocol
High potential for diffusing innovation once it is standardized, but rigidly defined roles stifle innovation
Problems and technology are well defined
Roles and responsibilities are specialized, clearly defined
Coordination based on standard procedures; evaluation based on clear objectives, standards
Hierarchical communication with top-down emphasis; top management has key outside contacts
Loyalty to superiors is stressed; position and experience grant authority
63
those with formal ties that prescribe coordination and collaboration (see Table ). Sociotechnical
information systems that are a good fit for tightly coupled organizations are mechanistic: they involve
standard procedures and objectivity; they are hierarchical in their communications, with top
management making outside contact; and they are based on loyalty to superiors, with position and
experience granting authority (Harrison, 1994). Problems are well defined in tightly coupled
organizations, and therefore services are able to follow a protocol by using deductive logic to determine
individual needs. They can deliver services more quickly and efficiently by following a standardized
process. Emergency rooms, trauma teams, and acute care services are more likely to be tightly coupled
because they are designed to respond quickly to time-critical events. Technology can be well defined for
this kind of organization, and can increase efficiency and safety—for example, decision support systems
help with deductive logic, and HIT helps with standardization.
When a mechanistic system is used in a loosely coupled organization, however, this creates the type of
unintended consequences that have been well documented with HIT (Harrison et al., 2007; Marcu,
Tassini, Carlson, Goodwyn, Rivkin, Schaefer, Dey, & Kiesler, 2013; Mentis, 2010; Park et al., 2013; Pine
& Mazmanian, 2014; Stoller, 2013). Sociotechnical information systems that are a good fit for loosely
coupled organizations are organic (see Table 2): they involve roles and responsibilities that are diffuse,
flexible, and change over time; they coordinate through flexible plans and changing goals; their
communication is multidirectional and there are multilevel contacts with the outside; and they operate
democratically, with a focus on the task, team and the organization, and expertise and knowledge
granting authority (Harrison, 1994).
Monet’s persistent use of paper-based records, and struggles to transition to HIT, illustrate a lack of
appropriate organic systems to fit their coordination practices. My findings suggest that unintended
consequences of HIT are caused by a mismatch between their design as largely mechanistic systems,
when the organizations that use them, and the broader healthcare context of these organizations, are not
always tightly coupled. For Monet, as with many organizations, this resulted in a reliance on paper
records, and minimal and problematic use of HIT.
References
Bardram, J.E. & Bossen, C. (2005). Mobility Work: The Spatial Dimension of Collaboration at a Hospital. Computer Supported Cooperative Work 14(2), 131-160.
64
Bebinger, M. (2013). Patients Lead The Way As Medicine Grapples With Apps. NPR. http://www.npr.org/blogs/health/2013/06/18/192777704.
Berg, M. (2003). Health Information Management. Routledge.
Cohen, M.D. & Hilligoss, P.B. (2008). Handoffs in Hospitals: A review of the literature on information exchange while transferring patient responsibility or control [online]. Deep Blue.
Erikson, E.H. (1985). The Nature of Clinical Evidence. Daedalus 87(4), 65-87.
Forsythe, D.E. (1992). Blaming the User in Medical Informatics: The Cultural Nature of Scientific Practice. Knowledge and Society 9, 95-111.
Harrison, M.I. (1994). Diagnosing Organizations: Methods, Models, and Processes (2nd Ed.). Sage.
Harrison, M.I., Koppel, R., & Bar-Lev, S. (2007). Unintended Consequences of Information Technologies in Health Care—An Interactive Sociotechnical Analysis. JAMIA 14(5), 542-549.
Kimble, C. (2014). Electronic Health Records: Cure-All or Chronic Condition? Global Business and Organizational Excellence 33(4), 63-74.
Klein, G., Moon, B., & Hoffman, R.R. (2006). Making Sense of Sensemaking: A Macrocognitive Model. IEEE Intelligent Systems 21(5), 88-92.
Marcu, G., Tassini, K., Carlson, Q., Goodwyn, J., Rivkin, G., Schaefer, K., Dey, A. K., & Kiesler, S. (2013). Why Do They Still Use Paper? Understanding Data Collection and Use in Autism Education. In Proceedings of CHI ‘13, 3177-3186.
Mentis, H.M. (2010). Emotion Awareness and Invisibility in an Emergency Room: A Socio-Technical Dilemma. Doctoral Dissertation. The Pennsylvania State University.
Miner, A.S., Bassoff, P. & Moorman, C. (2001). Organizational improvisation and learning: A Field study. Administrative Science Quarterly 46(2), 304-337.
O’Looney, J. (1993). Beyond Privatization and Service Integration: Organizational Models for Service Delivery. Social Service Review 67(4), 501-534.
Orlikowski, W.J. (2002). Knowing in Practice: Enacting a Collective Capability in Distributed Organizing. Organization Science 13(3), 249-273.
Park, S.Y., Pine, K., & Chen, Y. (2013). Local-universality: designing EMR to support localized information documentation practice. In Proceedings of CSCW ‘13, 55-66.
Paul, S. & Reddy, M. (2010). Understanding Together: Sensemaking in Collaborative Information Seeking. In Proceedings of CSCW ‘10, 321-330.
Pine, K. & Mazmanian, M. (2014). Institutional Logics of the EMR and the Problem of “Perfect” but Inaccurate Accounts. In Proceedings of CSCW ‘14, 283-294.
65
Schön, D.A. (1983). The Reflective Practitioner: How Professionals Think In Action. Basic Books, Inc.
Shute, N. (2013). The Long List Of Health Apps Features Few Clear Winners. NPR. http://www.npr.org/blogs/health/2013/10/30/241852598.
Stoller, J.K. (2013). Electronic siloing: An unintended consequence of the electronic health record. Cleveland Clinic Journal of Medicine 80(7), 406-409.
Weibel, N., Emmenegger, C., Lyons, J.;,Dixit, R., Hill, L.L., & Hollan, J.D. (2013). Interpreter-mediated physician-patient communication: Opportunities for multimodal healthcare interfaces. In Proceedings of PervasiveHealth, 113-120.
Weick, K.E. (1976). Educational Organizations as Loosely Coupled Systems. Administrative Science Quarterly 21(1), 1-19.
Weick, K.E. (1985). Cosmos vs. chaos: Sense and nonsense in electronic contexts. Organizational Dynamics 14(2), 51-64.
Weick, K.E. (1993). The collapse of sensemaking in organizations: The Mann Gulch disaster. Administrative Science Quarterly 38(4), 628-652.
Weick, K.E. (1995). Sensemaking in Organizations. Sage.

66
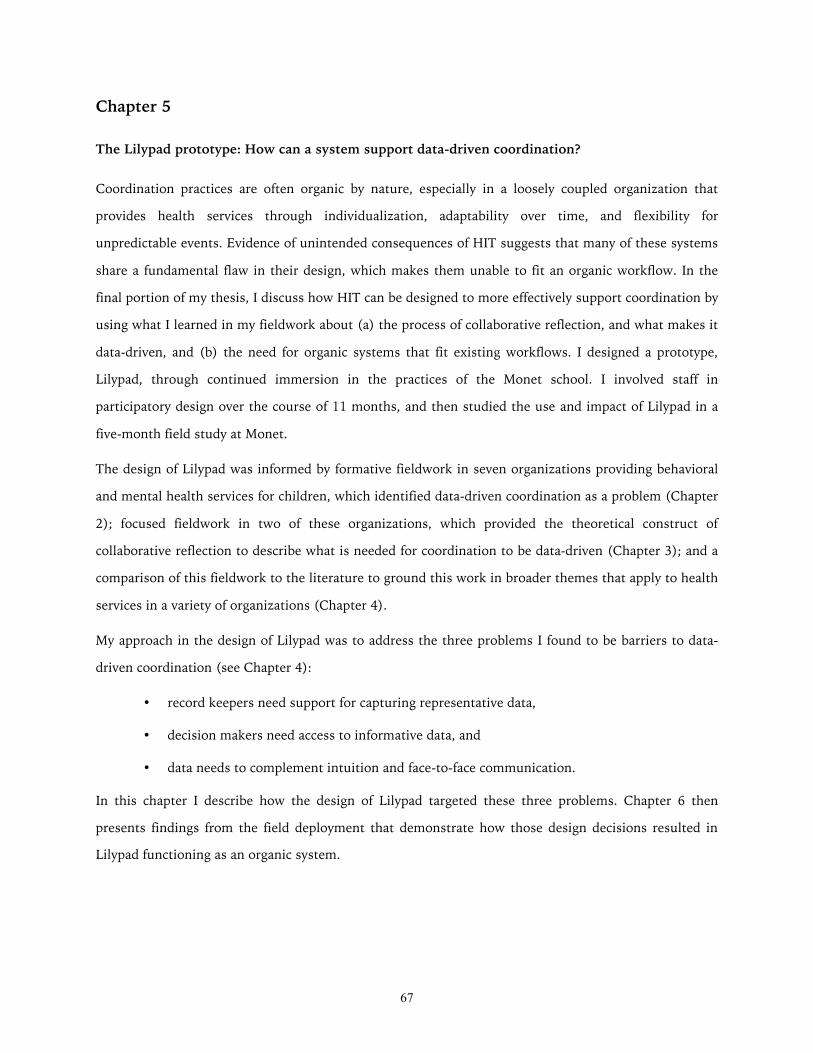
67
Chapter 5
The Lilypad prototype: How can a system support data-driven coordination?
Coordination practices are often organic by nature, especially in a loosely coupled organization that
provides health services through individualization, adaptability over time, and flexibility for
unpredictable events. Evidence of unintended consequences of HIT suggests that many of these systems
share a fundamental flaw in their design, which makes them unable to fit an organic workflow. In the
final portion of my thesis, I discuss how HIT can be designed to more effectively support coordination by
using what I learned in my fieldwork about (a) the process of collaborative reflection, and what makes it
data-driven, and (b) the need for organic systems that fit existing workflows. I designed a prototype,
Lilypad, through continued immersion in the practices of the Monet school. I involved staff in
participatory design over the course of 11 months, and then studied the use and impact of Lilypad in a
five-month field study at Monet.
The design of Lilypad was informed by formative fieldwork in seven organizations providing behavioral
and mental health services for children, which identified data-driven coordination as a problem (Chapter
2); focused fieldwork in two of these organizations, which provided the theoretical construct of
collaborative reflection to describe what is needed for coordination to be data-driven (Chapter 3); and a
comparison of this fieldwork to the literature to ground this work in broader themes that apply to health
services in a variety of organizations (Chapter 4).
My approach in the design of Lilypad was to address the three problems I found to be barriers to data-
driven coordination (see Chapter 4):
• record keepers need support for capturing representative data,
• decision makers need access to informative data, and
• data needs to complement intuition and face-to-face communication.
In this chapter I describe how the design of Lilypad targeted these three problems. Chapter 6 then
presents findings from the field deployment that demonstrate how those design decisions resulted in
Lilypad functioning as an organic system.
68
5.1. Design process
The design process I used is best characterized by the new interdisciplinary term design anthropology
(Clarke, 2010; Gunn, Otto, & Smith, 2013). Combining immersive ethnographic fieldwork and design
work, I studied the use of data for coordination, and the meaning of the data, interactions, and artifacts
involved in workflow. This design work culminated in the development and evaluation of a first
prototype, Lilypad. Following user testing that included a think-aloud study, I launched a 5-month field
deployment study (Siek, Hayes, Newman, & Tang, 2014) to engage an organization in a transition to
HIT and study the impacts of the design decisions behind Lilypad. The deployment was modeled after
the recent trend of “in the wild” studies, to examine the use of the prototype in situ, rather than in the
lab (Bonsignore, Quinn, Druin, & Bederson, 2013; Johnson, Rogers, van der Linden, & Bianchi-
Berthouze, 2012; Marshall, Morris, Rogers, Kreitmayer, & Davies, 2013; Messeter & Molenaar, 2012).
Lilypad was designed for, and with, the Monet school. A team of 9 developers, user experience
designers, and ethnographers engaged the staff in participatory design for 11 months. All team members
interacted with Monet and its employees through a subset of the following activities throughout the
design process: observation, contextual inquiry, design workshops, and user studies. We involved
members of the organization in the design of a solution to their problem, in the spirit of action research
(Hayes, 2011), and in response to Schön’s (1983) assessment that “professionally designed solutions to
public problems have had unanticipated consequences, sometimes worse than the problems they were
designed to solve” (p. 4). We, as the design professionals, practiced Schön’s reflection-in-action
ourselves by framing and reframing the problem together with the organization. We engaged the
professionals at Monet in reflection-in-action while we conducted participant observation and contextual
inquiry to reflect on their existing workflow together, and used participatory design to iterate together
many times on ideas and mockups for a solution.
5.2. Designing Lilypad to support data-driven coordination
With existing paper-based systems for collecting data on a child, the data were stored in the form of
hard-to-read scatter plots or overly abstract monthly reports. Data stored in heavy binders were not
easily accessed or shared. Sometimes one staff member would be the keeper of the data and responsible
for transferring information from data sheets to graphs or reports for others to use, making human error
difficult to avoid, and making staff dependent on one person’s interpretation and handling of data.
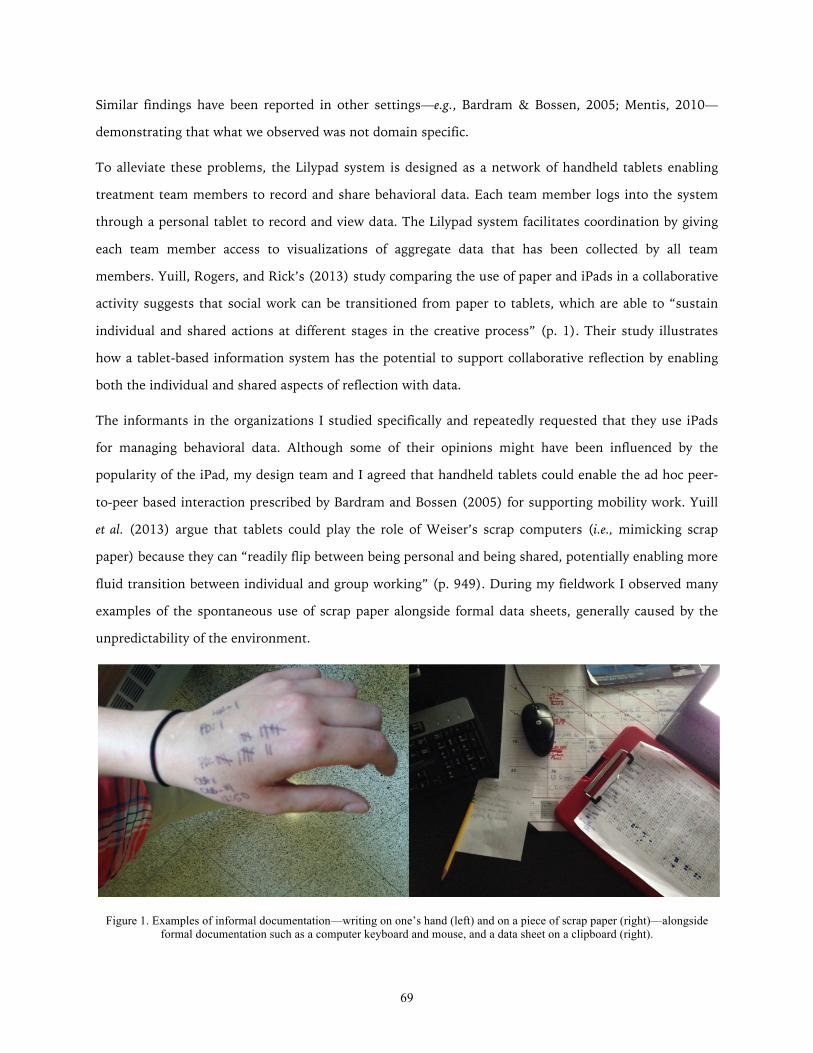
69
Similar findings have been reported in other settings—e.g., Bardram & Bossen, 2005; Mentis, 2010—
demonstrating that what we observed was not domain specific.
To alleviate these problems, the Lilypad system is designed as a network of handheld tablets enabling
treatment team members to record and share behavioral data. Each team member logs into the system
through a personal tablet to record and view data. The Lilypad system facilitates coordination by giving
each team member access to visualizations of aggregate data that has been collected by all team
members. Yuill, Rogers, and Rick’s (2013) study comparing the use of paper and iPads in a collaborative
activity suggests that social work can be transitioned from paper to tablets, which are able to “sustain
individual and shared actions at different stages in the creative process” (p. 1). Their study illustrates
how a tablet-based information system has the potential to support collaborative reflection by enabling
both the individual and shared aspects of reflection with data.
The informants in the organizations I studied specifically and repeatedly requested that they use iPads
for managing behavioral data. Although some of their opinions might have been influenced by the
popularity of the iPad, my design team and I agreed that handheld tablets could enable the ad hoc peer-
to-peer based interaction prescribed by Bardram and Bossen (2005) for supporting mobility work. Yuill
et al. (2013) argue that tablets could play the role of Weiser’s scrap computers (i.e., mimicking scrap
paper) because they can “readily flip between being personal and being shared, potentially enabling more
fluid transition between individual and group working” (p. 949). During my fieldwork I observed many
examples of the spontaneous use of scrap paper alongside formal data sheets, generally caused by the
unpredictability of the environment.
Figure 1. Examples of informal documentation—writing on one’s hand (left) and on a piece of scrap paper (right)—alongside formal documentation such as a computer keyboard and mouse, and a data sheet on a clipboard (right).
70
The images in Figure 1 are two examples of scrap paper captured in situ. The photograph on the right
was taken of a record keeper’s desk in the middle of the day, and was not staged. It shows a piece of
scrap paper with a pencil lying among (from left to right) a computer keyboard, mouse, paper calendar,
data sheet on a clipboard, and an iPad in the top right corner. All of these tools were actively being used
throughout the day, demonstrating the lack of an adequate and streamlined information system. The
photograph on the right shows how a different record keeper made do when she was in the hallway with
a child who had left his classroom – she kept track of his behaviors by writing with a pen on the back of
her hand.
The informal concept of scrap computers can support record keepers who capture the data by enabling
the flexibility to adapt to this type of unpredictable environment. In addition, this type of system could
improve the social aspects of the work of treatment teams (i.e., collaborative reflection). Yuill et al.’s
study (2013) compared the use of paper and iPads for collaborative work (via a game of co-creation).
They found that iPads afforded similar social behaviors and coordination as paper, and improved group
creativity – suggesting that Lilypad could be designed to maintain some of the affordances of paper that
other HIT have not been able to achieve.
5.2.1. Record keepers need support for capturing representative data
Figure 1 shows the main Lilypad interface for recording data. Record keepers manage one child’s data on
his or her unique screen (in Figure 2, a student with the pseudonym Benedict D.). The system enables
quick switching between the individual screens of children under a provider’s care (the left navigation
pane in Figure 2). In a classroom setting, providers are often working with multiple children at a given
time, and must track all of their behaviors as immediately as possible. The recording features were
designed to mimic the existing practice of carrying a clipboard with a data sheet for all of the children
and all of the day’s activities for one classroom. Therefore, the ease with which users could flip back and
forth between students and activities was a key part of the design.
On multiple occasions during the design process, inconsistencies were uncovered in the implementation
of data recording practices. Most of the time I found contradictions between supervisors, who tried to
enforce ideal recording practices, and behavioral specialists working in the classroom, who recorded data
as they could in the moment. Sometimes informants were unaware of their contradictions, and
sometimes I acted as a mediator to find a compromise between the ideal and the realistic. The process of
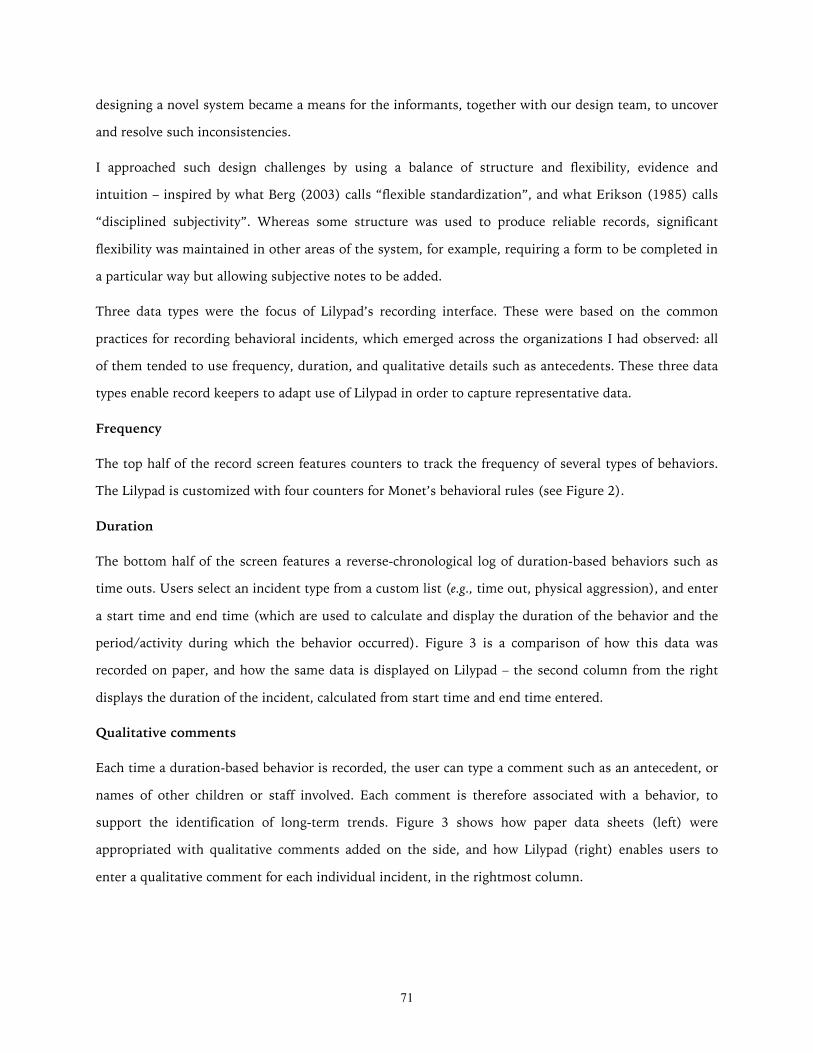
71
designing a novel system became a means for the informants, together with our design team, to uncover
and resolve such inconsistencies.
I approached such design challenges by using a balance of structure and flexibility, evidence and
intuition – inspired by what Berg (2003) calls “flexible standardization”, and what Erikson (1985) calls
“disciplined subjectivity”. Whereas some structure was used to produce reliable records, significant
flexibility was maintained in other areas of the system, for example, requiring a form to be completed in
a particular way but allowing subjective notes to be added.
Three data types were the focus of Lilypad’s recording interface. These were based on the common
practices for recording behavioral incidents, which emerged across the organizations I had observed: all
of them tended to use frequency, duration, and qualitative details such as antecedents. These three data
types enable record keepers to adapt use of Lilypad in order to capture representative data.
Frequency
The top half of the record screen features counters to track the frequency of several types of behaviors.
The Lilypad is customized with four counters for Monet’s behavioral rules (see Figure 2).
Duration
The bottom half of the screen features a reverse-chronological log of duration-based behaviors such as
time outs. Users select an incident type from a custom list (e.g., time out, physical aggression), and enter
a start time and end time (which are used to calculate and display the duration of the behavior and the
period/activity during which the behavior occurred). Figure 3 is a comparison of how this data was
recorded on paper, and how the same data is displayed on Lilypad – the second column from the right
displays the duration of the incident, calculated from start time and end time entered.
Qualitative comments
Each time a duration-based behavior is recorded, the user can type a comment such as an antecedent, or
names of other children or staff involved. Each comment is therefore associated with a behavior, to
support the identification of long-term trends. Figure 3 shows how paper data sheets (left) were
appropriated with qualitative comments added on the side, and how Lilypad (right) enables users to
enter a qualitative comment for each individual incident, in the rightmost column.
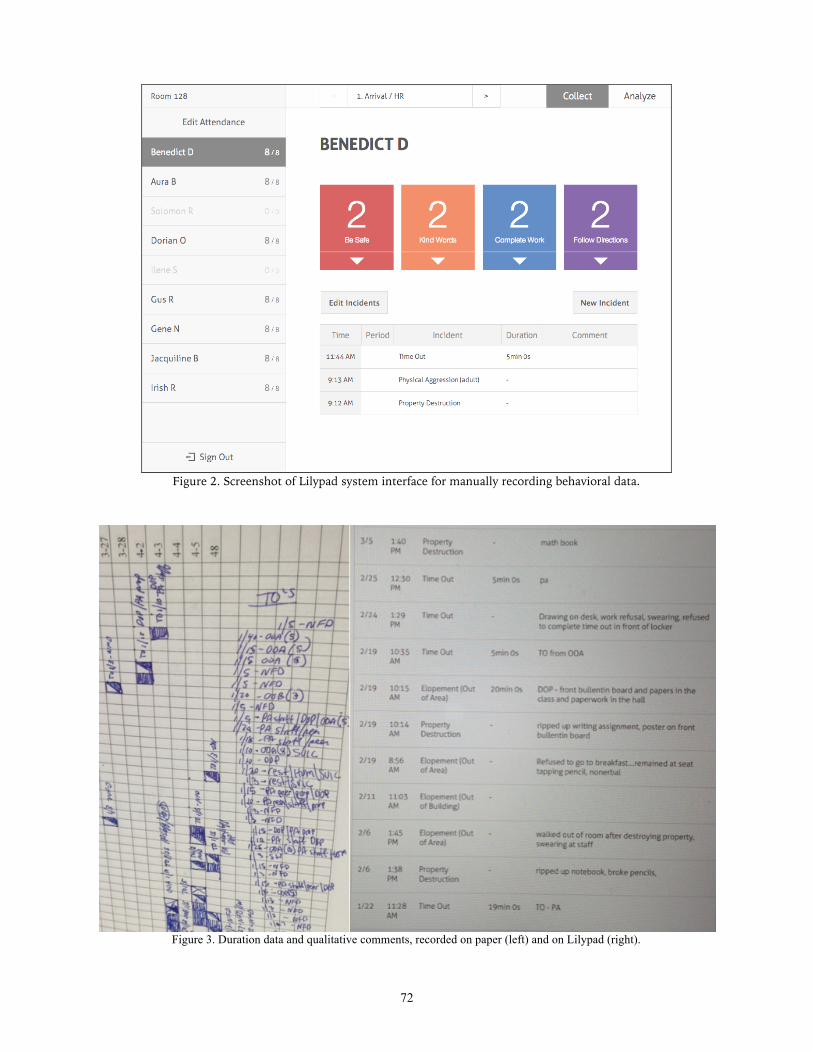
72
Figure 2. Screenshot of Lilypad system interface for manually recording behavioral data.
Figure 3. Duration data and qualitative comments, recorded on paper (left) and on Lilypad (right).
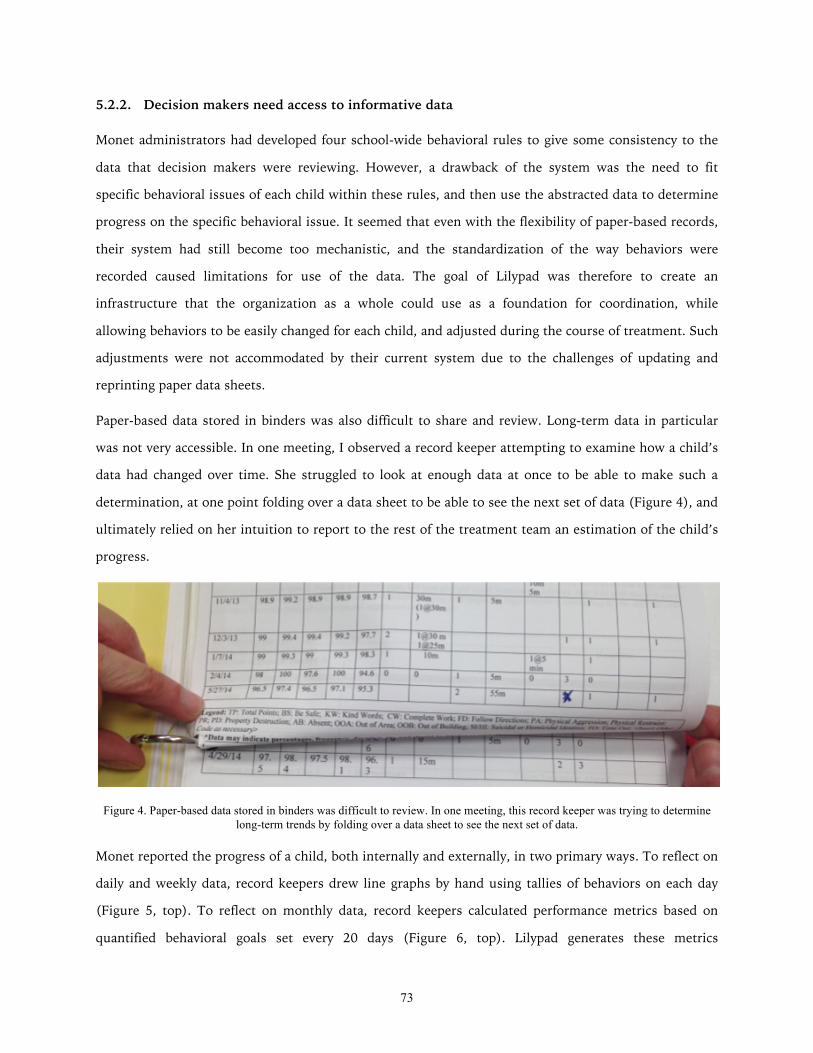
73
5.2.2. Decision makers need access to informative data
Monet administrators had developed four school-wide behavioral rules to give some consistency to the
data that decision makers were reviewing. However, a drawback of the system was the need to fit
specific behavioral issues of each child within these rules, and then use the abstracted data to determine
progress on the specific behavioral issue. It seemed that even with the flexibility of paper-based records,
their system had still become too mechanistic, and the standardization of the way behaviors were
recorded caused limitations for use of the data. The goal of Lilypad was therefore to create an
infrastructure that the organization as a whole could use as a foundation for coordination, while
allowing behaviors to be easily changed for each child, and adjusted during the course of treatment. Such
adjustments were not accommodated by their current system due to the challenges of updating and
reprinting paper data sheets.
Paper-based data stored in binders was also difficult to share and review. Long-term data in particular
was not very accessible. In one meeting, I observed a record keeper attempting to examine how a child’s
data had changed over time. She struggled to look at enough data at once to be able to make such a
determination, at one point folding over a data sheet to be able to see the next set of data (Figure 4), and
ultimately relied on her intuition to report to the rest of the treatment team an estimation of the child’s
progress.
Figure 4. Paper-based data stored in binders was difficult to review. In one meeting, this record keeper was trying to determine long-term trends by folding over a data sheet to see the next set of data.
Monet reported the progress of a child, both internally and externally, in two primary ways. To reflect on
daily and weekly data, record keepers drew line graphs by hand using tallies of behaviors on each day
(Figure 5, top). To reflect on monthly data, record keepers calculated performance metrics based on
quantified behavioral goals set every 20 days (Figure 6, top). Lilypad generates these metrics
74
automatically and displays real-time visualizations (Figure 5, bottom, and Figure 6, bottom). Existing
paper-based line graphs showed only approximately two weeks’ worth of data each, and were stored in
binders where they were not easy to review. By enabling the instantaneous viewing of data at various
levels of detail, such as day, week, month, or year, Lilypad introduces the capability to reflect on long-
term data so teams can identify trends and patterns in behavior.
Team members discussed quantitative behavioral data in one of two ways: by absolute points earned
(20/40) or percentage of points earned (50%). Different team members were discussing data based on
their personal preference for one of the two representations. Over time, during the participatory design
discussions, they realized that each of the two representations revealed different aspects of a child’s
progress. This information was used in the design of Lilypad’s visualizations. Percentages helped them
review data long-term because percentages accounted for variations in points possible (for example, due
to a half day or a student arriving late for school). Absolute points were harder to reflect on long-term
because the denominator could change, but absolute points gave a more complete picture of a particular
day or short-term period.
Improving treatment teams’ ability to review and reflect on data is a main area where Lilypad has the
potential make a real and positive impact. However, achieving an entirely positive impact without
unintended consequences was nontrivial due to the complexity of workflow. Each simple feature could
cause a tremendous shift in workflow. The challenge of designing new visualizations was to not change
workflow too much. The design process therefore involved the team balancing our ideas about what
could be ideal if we were starting with a blank slate, with what would be closest to the existing practices
of the organization. The resulting designs for visualizations (see bottom of Figures 5 and 6) were
purposefully safe and attempted to usher users gently into new ways of reflecting on their data.
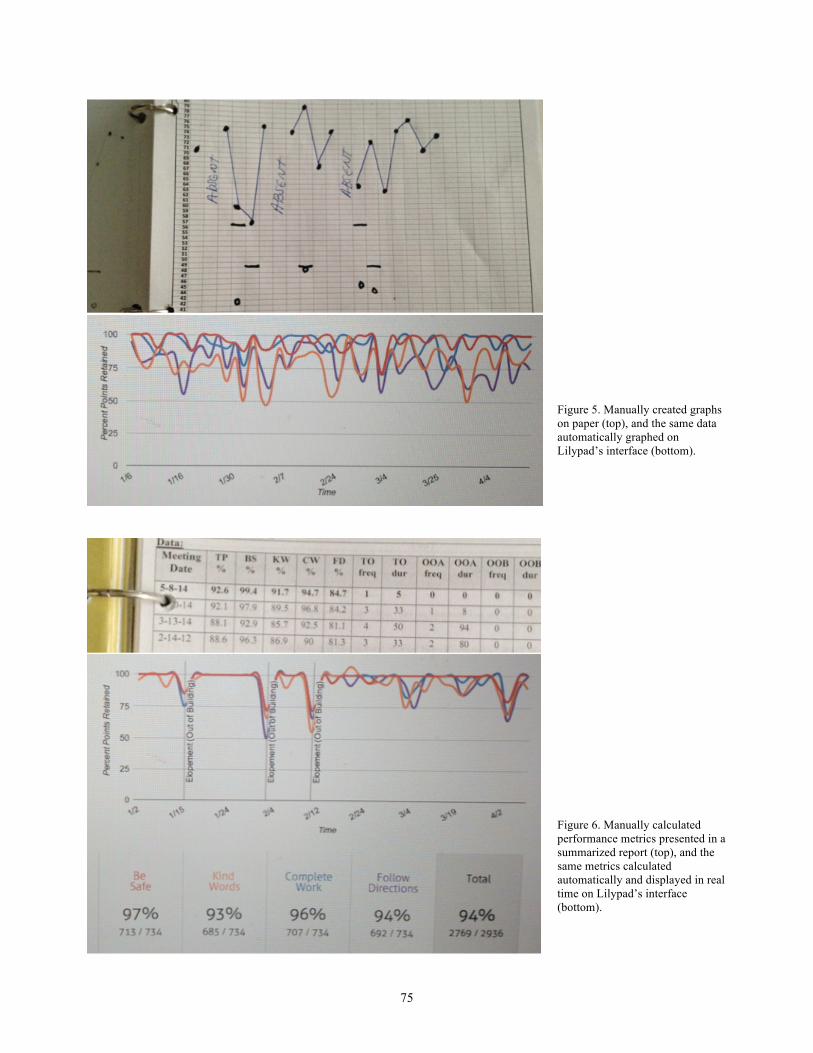
75
Figure 5. Manually created graphs on paper (top), and the same data automatically graphed on Lilypad’s interface (bottom).
Figure 6. Manually calculated performance metrics presented in a summarized report (top), and the same metrics calculated automatically and displayed in real time on Lilypad’s interface (bottom).
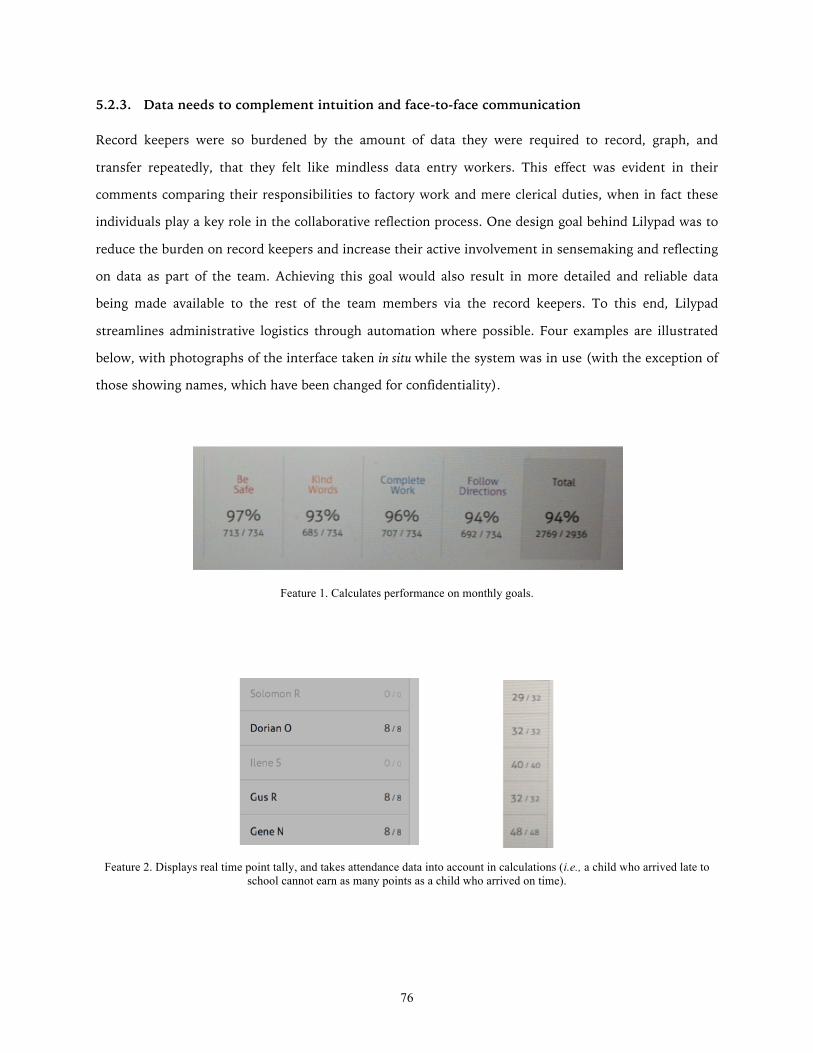
76
5.2.3. Data needs to complement intuition and face-to-face communication
Record keepers were so burdened by the amount of data they were required to record, graph, and
transfer repeatedly, that they felt like mindless data entry workers. This effect was evident in their
comments comparing their responsibilities to factory work and mere clerical duties, when in fact these
individuals play a key role in the collaborative reflection process. One design goal behind Lilypad was to
reduce the burden on record keepers and increase their active involvement in sensemaking and reflecting
on data as part of the team. Achieving this goal would also result in more detailed and reliable data
being made available to the rest of the team members via the record keepers. To this end, Lilypad
streamlines administrative logistics through automation where possible. Four examples are illustrated
below, with photographs of the interface taken in situ while the system was in use (with the exception of
those showing names, which have been changed for confidentiality).
Feature 1. Calculates performance on monthly goals.
Feature 2. Displays real time point tally, and takes attendance data into account in calculations (i.e., a child who arrived late to school cannot earn as many points as a child who arrived on time).
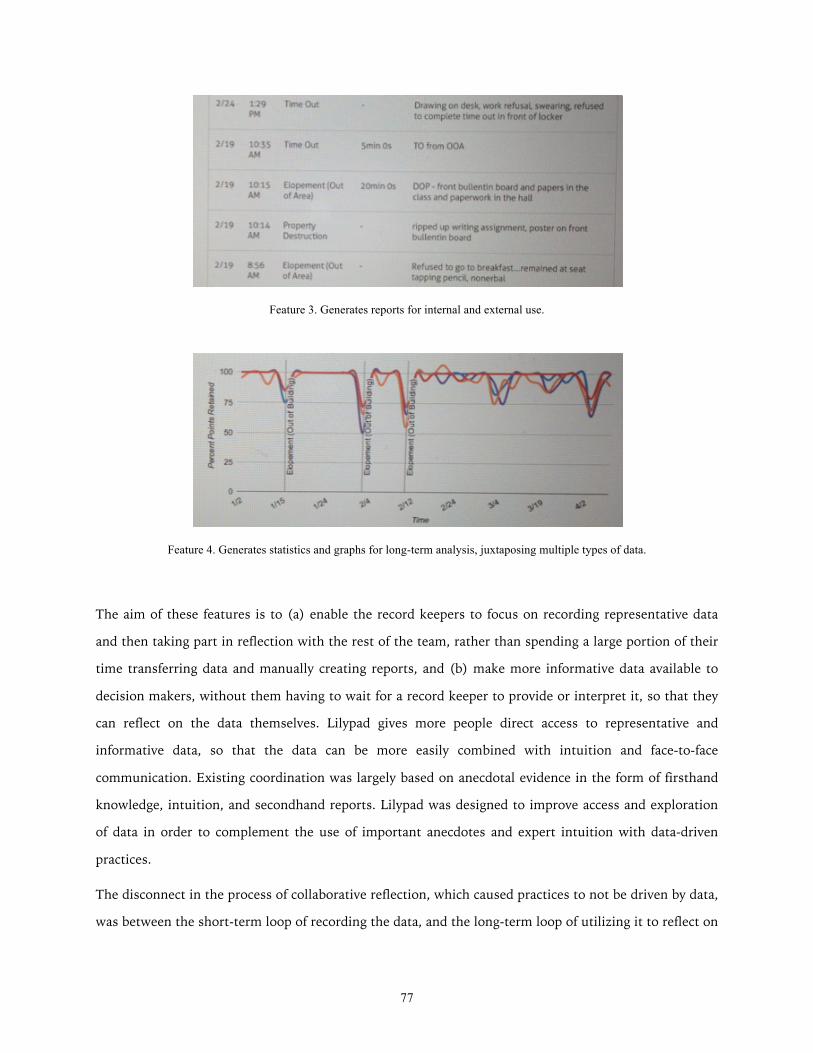
77
Feature 3. Generates reports for internal and external use.
Feature 4. Generates statistics and graphs for long-term analysis, juxtaposing multiple types of data.
The aim of these features is to (a) enable the record keepers to focus on recording representative data
and then taking part in reflection with the rest of the team, rather than spending a large portion of their
time transferring data and manually creating reports, and (b) make more informative data available to
decision makers, without them having to wait for a record keeper to provide or interpret it, so that they
can reflect on the data themselves. Lilypad gives more people direct access to representative and
informative data, so that the data can be more easily combined with intuition and face-to-face
communication. Existing coordination was largely based on anecdotal evidence in the form of firsthand
knowledge, intuition, and secondhand reports. Lilypad was designed to improve access and exploration
of data in order to complement the use of important anecdotes and expert intuition with data-driven
practices.
The disconnect in the process of collaborative reflection, which caused practices to not be driven by data,
was between the short-term loop of recording the data, and the long-term loop of utilizing it to reflect on
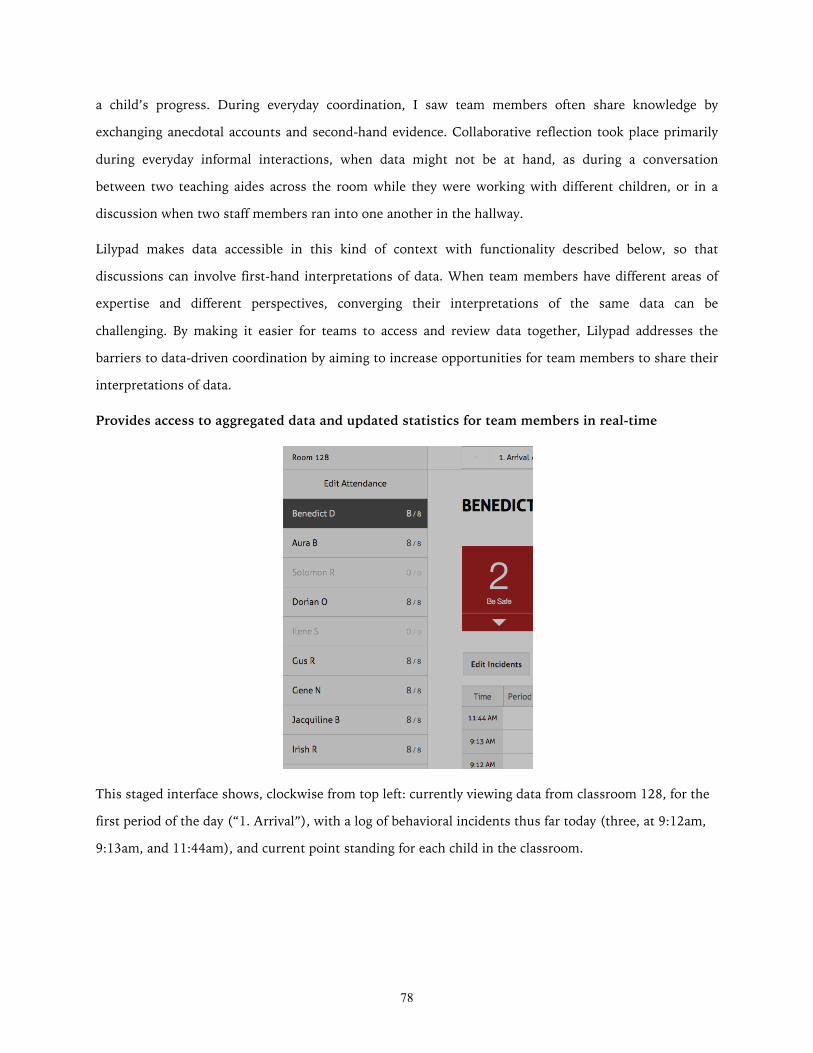
78
a child’s progress. During everyday coordination, I saw team members often share knowledge by
exchanging anecdotal accounts and second-hand evidence. Collaborative reflection took place primarily
during everyday informal interactions, when data might not be at hand, as during a conversation
between two teaching aides across the room while they were working with different children, or in a
discussion when two staff members ran into one another in the hallway.
Lilypad makes data accessible in this kind of context with functionality described below, so that
discussions can involve first-hand interpretations of data. When team members have different areas of
expertise and different perspectives, converging their interpretations of the same data can be
challenging. By making it easier for teams to access and review data together, Lilypad addresses the
barriers to data-driven coordination by aiming to increase opportunities for team members to share their
interpretations of data.
Provides access to aggregated data and updated statistics for team members in real-time
This staged interface shows, clockwise from top left: currently viewing data from classroom 128, for the
first period of the day (“1. Arrival”), with a log of behavioral incidents thus far today (three, at 9:12am,
9:13am, and 11:44am), and current point standing for each child in the classroom.
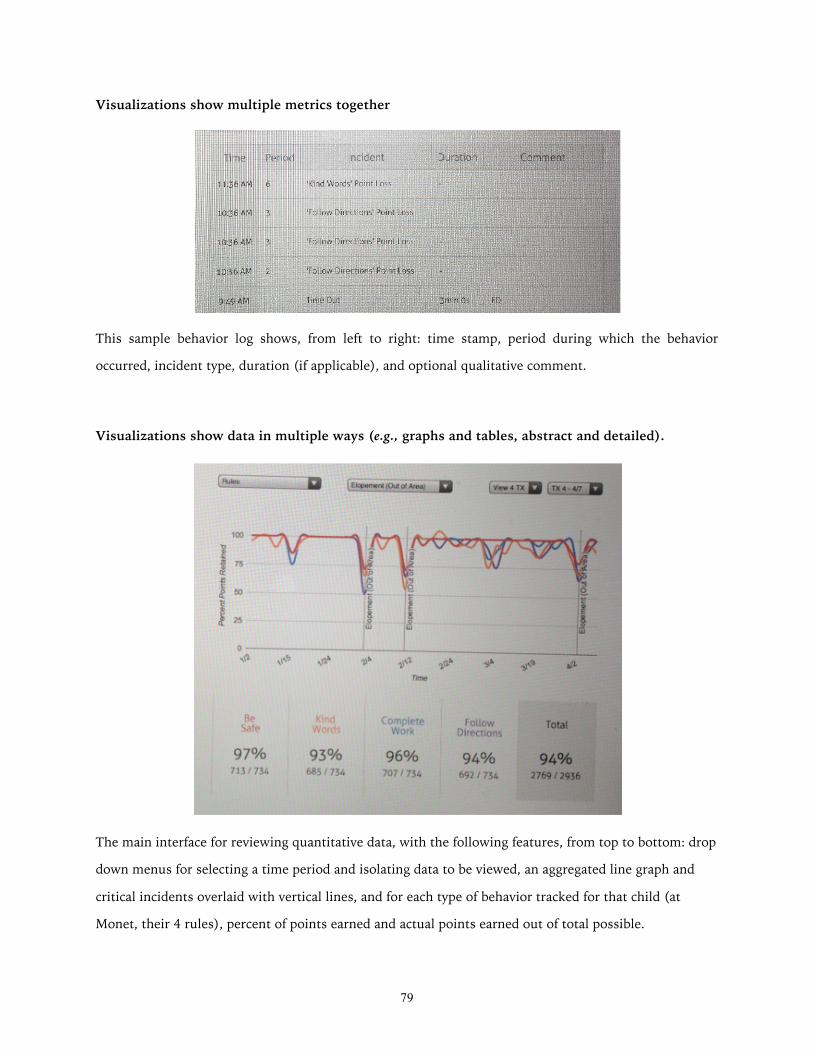
79
Visualizations show multiple metrics together
This sample behavior log shows, from left to right: time stamp, period during which the behavior
occurred, incident type, duration (if applicable), and optional qualitative comment.
Visualizations show data in multiple ways (e.g., graphs and tables, abstract and detailed).
The main interface for reviewing quantitative data, with the following features, from top to bottom: drop
down menus for selecting a time period and isolating data to be viewed, an aggregated line graph and
critical incidents overlaid with vertical lines, and for each type of behavior tracked for that child (at
Monet, their 4 rules), percent of points earned and actual points earned out of total possible.
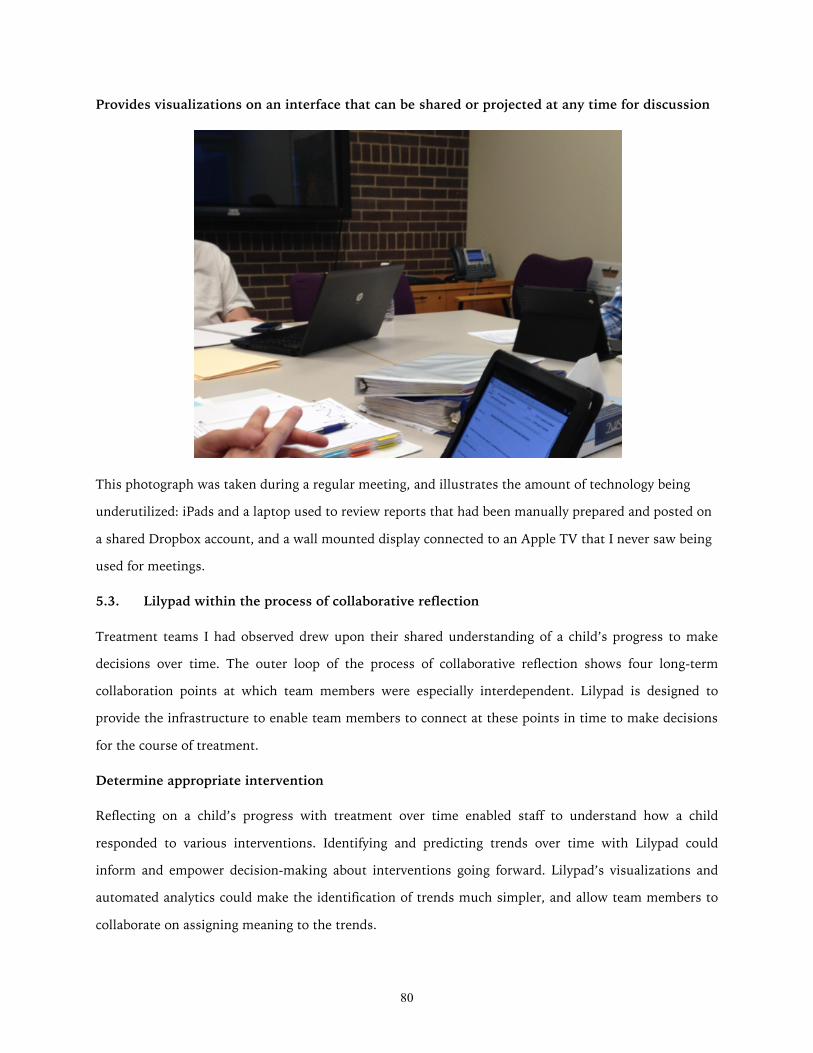
80
Provides visualizations on an interface that can be shared or projected at any time for discussion
This photograph was taken during a regular meeting, and illustrates the amount of technology being
underutilized: iPads and a laptop used to review reports that had been manually prepared and posted on
a shared Dropbox account, and a wall mounted display connected to an Apple TV that I never saw being
used for meetings.
5.3. Lilypad within the process of collaborative reflection
Treatment teams I had observed drew upon their shared understanding of a child’s progress to make
decisions over time. The outer loop of the process of collaborative reflection shows four long-term
collaboration points at which team members were especially interdependent. Lilypad is designed to
provide the infrastructure to enable team members to connect at these points in time to make decisions
for the course of treatment.
Determine appropriate intervention
Reflecting on a child’s progress with treatment over time enabled staff to understand how a child
responded to various interventions. Identifying and predicting trends over time with Lilypad could
inform and empower decision-making about interventions going forward. Lilypad’s visualizations and
automated analytics could make the identification of trends much simpler, and allow team members to
collaborate on assigning meaning to the trends.
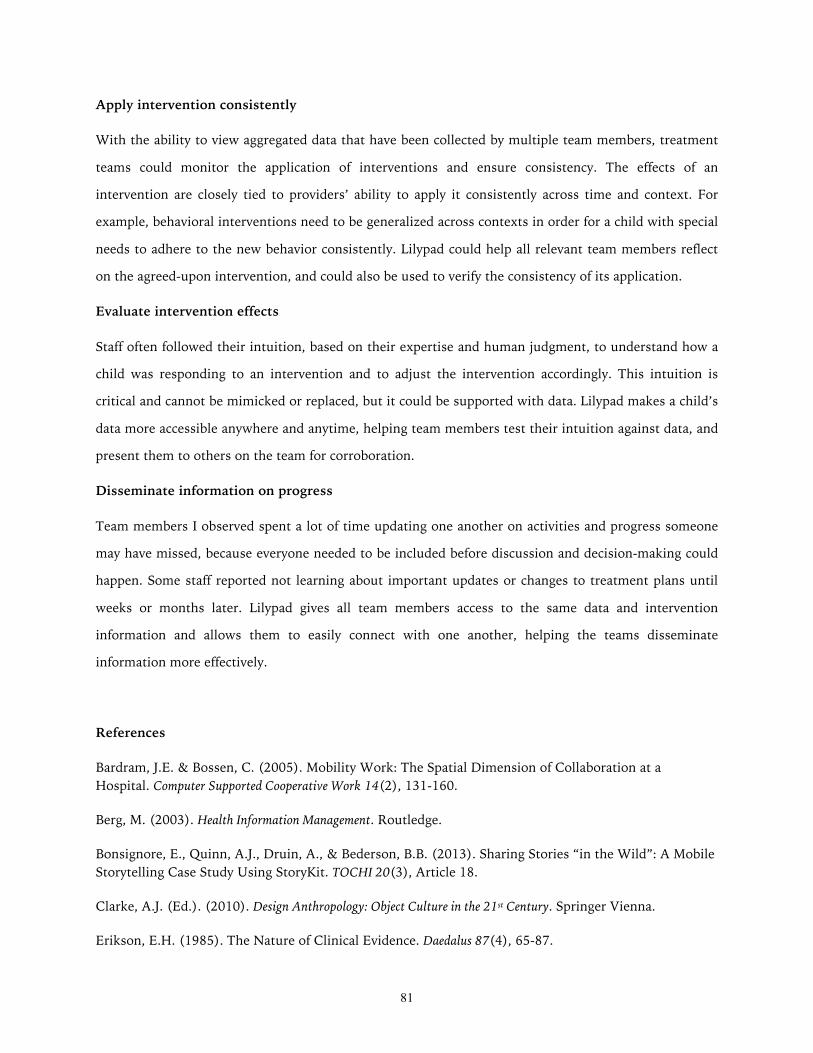
81
Apply intervention consistently
With the ability to view aggregated data that have been collected by multiple team members, treatment
teams could monitor the application of interventions and ensure consistency. The effects of an
intervention are closely tied to providers’ ability to apply it consistently across time and context. For
example, behavioral interventions need to be generalized across contexts in order for a child with special
needs to adhere to the new behavior consistently. Lilypad could help all relevant team members reflect
on the agreed-upon intervention, and could also be used to verify the consistency of its application.
Evaluate intervention effects
Staff often followed their intuition, based on their expertise and human judgment, to understand how a
child was responding to an intervention and to adjust the intervention accordingly. This intuition is
critical and cannot be mimicked or replaced, but it could be supported with data. Lilypad makes a child’s
data more accessible anywhere and anytime, helping team members test their intuition against data, and
present them to others on the team for corroboration.
Disseminate information on progress
Team members I observed spent a lot of time updating one another on activities and progress someone
may have missed, because everyone needed to be included before discussion and decision-making could
happen. Some staff reported not learning about important updates or changes to treatment plans until
weeks or months later. Lilypad gives all team members access to the same data and intervention
information and allows them to easily connect with one another, helping the teams disseminate
information more effectively.
References
Bardram, J.E. & Bossen, C. (2005). Mobility Work: The Spatial Dimension of Collaboration at a Hospital. Computer Supported Cooperative Work 14(2), 131-160.
Berg, M. (2003). Health Information Management. Routledge.
Bonsignore, E., Quinn, A.J., Druin, A., & Bederson, B.B. (2013). Sharing Stories “in the Wild”: A Mobile Storytelling Case Study Using StoryKit. TOCHI 20(3), Article 18.
Clarke, A.J. (Ed.). (2010). Design Anthropology: Object Culture in the 21st Century. Springer Vienna.
Erikson, E.H. (1985). The Nature of Clinical Evidence. Daedalus 87(4), 65-87.
82
Gunn, W., Otto, T., & Smith, R.C. (Eds.). (2013). Design Anthropology: Theory and Practice. Bloomsbury.
Hayes, G.R. (2011). The Relationship of Action Research to Human-Computer Interaction. ToCHI 18(3), 15.
Johnson, R., Rogers, Y., van der Linden, J., & Bianchi-Berthouze, N. (2012). Being in the thick of in-the-wild studies: the challenges and insights of researcher participation. In Proceedings of CHI ‘12, 1135-1144.
Marshall, P., Morris, R., Rogers, Y., Kreitmayer, S., & Davies, M. (2013). Rethinking 'multi-user': an in-the-wild study of how groups approach a walk-up-and-use tabletop interface. In Proceedings of CHI ‘13, 3033-3042.
Mentis, H.M. (2010). Emotion Awareness and Invisibility in an Emergency Room: A Socio-Technical Dilemma. Doctoral Dissertation. The Pennsylvania State University.
Messeter, J. & Molenaar, D. (2012). Evaluating ambient displays in the wild: highlighting social aspects of use in public settings. In Proceedings of DIS ’12, 478-481.
Siek, K.A., Hayes, G.R., Newman, M.W., & Tang, J.C. (2014). Field deployments: Knowing from using in context. In Kellogg, W.A. and Olson, J.S., (Eds.)., Ways of Knowing in HCI (119-142). Springer.
Schön, D.A. (1983). The Reflective Practitioner: How Professionals Think In Action. Basic Books.
Yuill, N., Rogers, Y. & Rick, J. (2013). Pass the iPad: Collaborative creating and sharing in family groups. In Proceedings of CHI ‘13, 941-950.
83
Chapter 6
Lilypad in the wild: A field deployment validating Lilypad as an organic system
I modeled a field deployment (Siek, Hayes, Newman, & Tang, 2014) for Lilypad after the growing trend
of “in the wild” studies (Bonsignore, Quinn, Druin, & Bederson, 2013; Johnson, Rogers, van der Linden,
& Bianchi-Berthouze, 2012; Marshall, Morris, Rogers, Kreitmayer, & Davies, 2013; Messeter &
Molenaar, 2012), to examine the use and impacts of the technology in situ, with real world social
scenarios and constraints, rather than in the lab. The features of Lilypad were rolled out gradually, in
order to study the effects of their use. The goal was not a full and complete transition from paper records
to HIT. Instead, I took a long-term view and treated the deployment as an attempt to carry out a
transition in the real world, without a required outcome. This enabled me to realistically validate the
design of Lilypad, including its feasibility, limitations, and impacts. My goal was to determine Lilypad’s
impact on workflow at Monet, as well as user adoption, acceptance, and attitudes.
6.1. Methods
Lilypad was deployed at Monet for 24 weeks. During that time, I conducted 76 hours of participant
observation in 48 total visits, averaging 4.5 hours per week. I attended 27 confidential treatment team
meetings with consent from parents. 24 staff informants were compensated with $20 per week through
the course of the deployment.
Fieldwork during the deployment investigated the recording of data in three classrooms at Monet, and
followed how that data was shared and used across the rest of the organization. The three classrooms
served 2nd to 6th grade students. Each classroom had 4 to 5 staff members working with 4 to 9 children.
Treatment teams serving each of these students were made up of individuals across all levels of the
organization (e.g., classroom staff, therapeutic staff, psychiatrists, and clinical supervisors). Fieldwork
focused on 7 treatment teams composed of 24 staff.
Student diagnoses, skills and needs varied within each of these classrooms—some students were
functioning one or two grade levels below their age, and some had progressed enough during several
years at Monet that they were in the process of gradually transitioning to a typical school. Despite the
range of special needs, the services provided to all of these students were a similar combination of
behavioral reinforcement, cognitive behavioral therapy, and potentially psychiatric medications. These
services were driven by the collaborative use of behavioral data by the treatment teams.
84
Organizational change is a large part of transitioning to HIT. I therefore worked with the entire
organization to support a transition from paper-based records to HIT. I met with administrators and
supervisors throughout the study to update them on the progress of the transition, interview them for
their attitudes, and work to maintain their buy-in. I spent most of my participant observation with
record keepers, who used the Lilypad system most frequently as the gatekeepers of the data. I also used
guerilla interviewing to reach staff across all levels of the organization.
6.2. Findings
Lilypad was designed as an organic system in order to fit Monet’s loose coupling. Findings from the
deployment show that Lilypad was able to fit into the workflow of treatment teams, and help their
coordination be more data-driven. In this section I describe this evidence within four categories, by
referencing the four characteristics of organic systems (O’Looney, 1993) that were particularly relevant
for Monet: diffuse roles and responsibilities, flexible coordination, authority based on knowledge rather
than position, and multidirectional communication.
6.2.1. Diffuse roles and responsibilities
Team members had particular roles and contributed unique expertise and backgrounds to the treatment
of a child (e.g., therapist, record keeper, family liaison), but these roles were not rigid. Their daily roles
and responsibilities needed to be diffuse in order to adapt to individual needs and situations. Lilypad
facilitated diffuse roles and responsibilities by making it easier for more stakeholders to be involved with
recording and reviewing records, and providing access to aggregated records in real-time. An intuitive
and collaborative interface helped team members coordinate around the data.
One important goal for Lilypad was to reduce the burden on primary record keepers, because their
responsibilities were unrealistically split between creating records, and providing in situ behavioral
intervention to children to ensure their safety and progress. The record keepers’ ability to learn to use it
quickly, combined with their attitudes toward Lilypad, demonstrated a perceived reduction of burden
which enabled them to better manage their responsibilities. Record keepers learned to use Lilypad on
the job. For their first 3 days of use, we conducted 3-4 hours of participant observation, thereby making
ourselves available while they were learning to use Lilypad. However, Lilypad’s design closely mimicking
existing paper-based records made this transition smooth. The record keepers needed little guidance
while learning to create records using Lilypad. By the second week of use, Olivia was upbeat about
85
having already adjusted to Lilypad in her daily practices, saying: “it’s nice that this [system] is becoming
a part of my day”.
When Olivia was preparing for maternity leave, the record keeper who replaced her spent about two
weeks shadowing her in order to transition into her role. The new record keeper picked up Lilypad as
part of this transition within three days, without our support. Lilypad was transitioned from one
individual to another naturally and smoothly as part of the whole process, indicating that it had become
an integral part of the record keepers’ workflow.
During the sixth week, team members working closely with record keepers like Olivia began helping
them create records on Lilypad. I had not encouraged or trained these individuals to use Lilypad. Instead,
they were intrigued by watching the record keepers use it, and jumped in as users themselves in order to
diffuse the responsibility of creating records. As an interesting counter example to this trend, when a
record keeper was absent one day no one used Lilypad in his place, choosing to try to maintain record
keeping using the familiar paper-based method instead. This incident suggests that despite the diffusion
of responsibility, team members are not willing or able to handle an undue burden associated with
someone else’s role. Taking over the use of Lilypad for a day on their owne likely felt like a higher
commitment than making some notes on a piece of paper—an attitude which would also suggest that
staff placed weight on the utility and role of Lilypad within workflow. Overall, the voluntary
participation of more and more staff members, and their ability to quickly learn to use the interface,
showed how Lilypad’s design was appealing, intuitive, and able to facilitate the diffusion of roles and
responsibilities.
6.2.2. Flexible plans and changing goals
Chapter 2 describes the persistence of paper due to the challenges of incorporating HIT to support the
unpredictable and individualized services provided by organizations like Monet. Lilypad was designed as
an organic system to address the tendency of HIT to overemphasize structure and standardized practices.
A marked moment of success during the deployment was therefore when I asked the record keepers if
they still needed to rely on paper, during the fourth week, and they told me that Lilypad met all of their
needs. They had adapted to using Lilypad to record all quantitative and qualitative types of data they had
been recording on paper.
The design of Lilypad’s recording interface and data structures, with flexible ways of recording multiple
types of data, enabled users to adapt it to their needs. Claire was overwhelmed on a daily basis and not
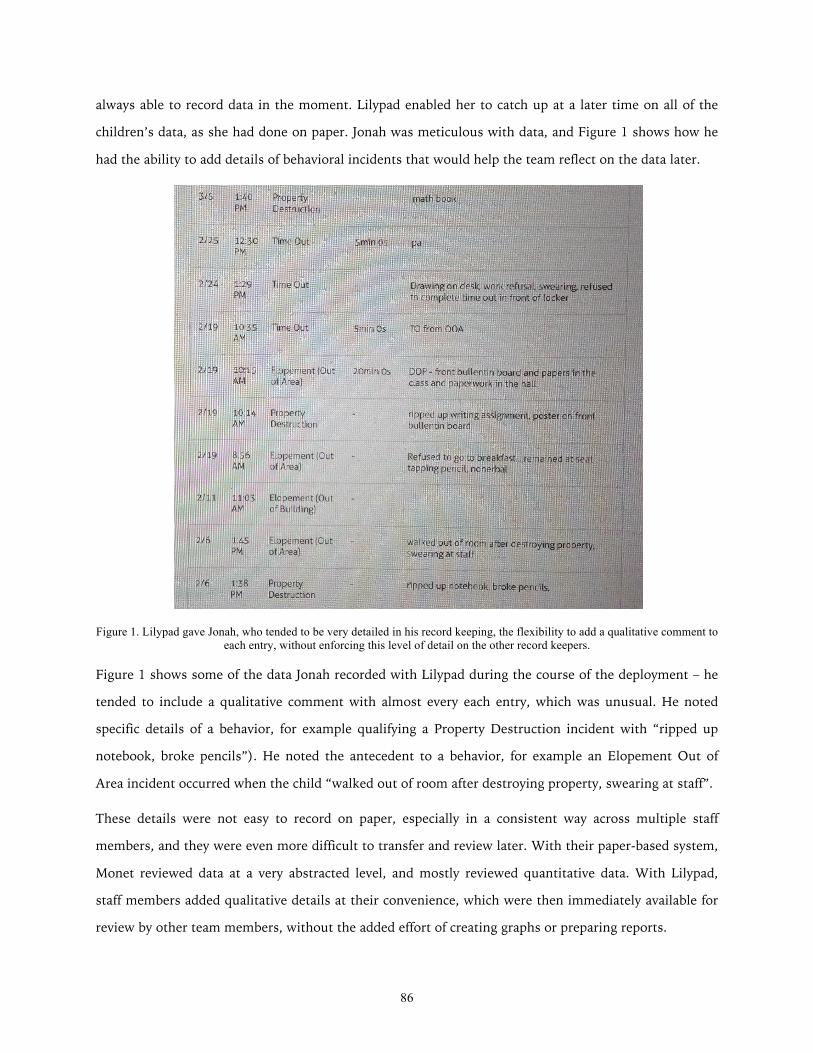
86
always able to record data in the moment. Lilypad enabled her to catch up at a later time on all of the
children’s data, as she had done on paper. Jonah was meticulous with data, and Figure 1 shows how he
had the ability to add details of behavioral incidents that would help the team reflect on the data later.
Figure 1. Lilypad gave Jonah, who tended to be very detailed in his record keeping, the flexibility to add a qualitative comment to each entry, without enforcing this level of detail on the other record keepers.
Figure 1 shows some of the data Jonah recorded with Lilypad during the course of the deployment – he
tended to include a qualitative comment with almost every each entry, which was unusual. He noted
specific details of a behavior, for example qualifying a Property Destruction incident with “ripped up
notebook, broke pencils”). He noted the antecedent to a behavior, for example an Elopement Out of
Area incident occurred when the child “walked out of room after destroying property, swearing at staff”.
These details were not easy to record on paper, especially in a consistent way across multiple staff
members, and they were even more difficult to transfer and review later. With their paper-based system,
Monet reviewed data at a very abstracted level, and mostly reviewed quantitative data. With Lilypad,
staff members added qualitative details at their convenience, which were then immediately available for
review by other team members, without the added effort of creating graphs or preparing reports.
87
In the vignette presented in Chapter 4, I had observed a conversation among team members about what
adjustments might lead to capturing records that are more representative. The record keeper, Claire,
laughed uncomfortably at the suggestion of changing her recording practices on paper, saying it would
be too difficult. The limitations of paper-based records led to these types of dead ends during reflective
conversations. These observations suggest that more flexibility in the management of their data would
enable the process of collaborative reflection to be more data-driven. The flexibility provided in Lilypad’s
recording interface, which allowed Claire to catch up when she was able to, and Jonah to add additional
details, could have significant implications long-term as teams iteratively record and use the data for
decisions about interventions.
Long-term, Lilypad could also enable members of a team to compare and discuss how they are recording
data. Teams might develop some common structure to their data, improving consistency, by providing
the flexibility and communication tools for team members to become aware of which elements of their
individual practices work best. During the course of the deployment administrators mentioned to me
that they were considering a change from the four school rules to individualized behavioral goals. They
were reassured and pleased to learn that Lilypad had been designed to handle such a change, because of
the primary focus on customizable frequency and duration data.
6.2.3. Authority based on knowledge rather than position
Monet followed a democratic service model (Bloom and Farragher, 2013), encouraging and valuing the
involvement of all staff in treatment discussions and coordination. Team members were reciprocally
interdependent, because they each contributed unique knowledge and experiences to coordination
(Marcu, Dey, & Kiesler, 2014). As a result, hierarchy was not as valued as democratically sharing
experiences, anecdotes, opinions and interpretations—the process that makes up collaborative reflection.
Authority, in turn, was granted to those staff members who at that moment had the appropriate
knowledge to contribute to the process of collaborative reflection. Lilypad fit this model by
democratizing the use of HIT for coordination.
Chapter 5 discussed the frustrations of overburdened record keepers, and the observed tensions between
them and the supervisors who sometimes had unrealistic expectations of them. These tensions were
caused in part by the negative impact of the cumbersome paper-based system on the overall democratic
process of collaborative reflection. Record keepers were dependent on their supervisors to provide data
sheets, so they did not have much say in what data should be recorded or how. By the second week of
88
our deployment, one of the record keepers, Olivia, implied that Lilypad had the potential to address
these issues. She referenced the tension with her supervisors: “this is great, I’ve been asking for
something [to help me with records] for a while, and they wouldn’t even let me use Excel.” Olivia’s
comment suggests that the introduction of Lilypad began to empower record keepers like her. Lilypad
was designed to have the flexibility to enable team members to record data in slightly different ways, so
they could have the freedom to adjust their recording practices within the bounds of required data
collection. I found that the balance of structure and flexibility gave those recording the data more of a
voice in their practices and lowered their feeling of being constrained by the paper forms provided by
their supervisor for recording data.
Within a month of beginning the deployment, I had built enough rapport that staff members were
comfortable expressing their frustrations and speaking freely about tensions with their supervisors.
Record keepers in particular shared stories about other staff members who had left or been fired, and
thoughts about whether they themselves might leave the organization or the field. Fieldwork during the
deployment focused mostly on the record keepers at first, because Lilypad’s ability to support
collaborative reflection depended on first and foremost enabling the capturing of records. The openness
with which these individuals vented their grievances suggested that they were eager to be heard and
supported. Their desire to be heard and empowered in their jobs drove the participatory design process,
and my ability to build the closest rapport of all informants with the record keepers indicates that their
involvement in design was meaningful and effective in driving organizational change.
Claire was the record keeper with which I had least rapport, and this did not surprise her coworkers.
Claire was jaded after a decade of experience with her supervisors changing record keeping practices and
tools. Already feeling overwhelmed with her job on a daily basis (even though she was not more
burdened than her peers), she was unwilling to adapt to a new tool that, from her skeptical perspective,
was likely to be taken away by her supervisors soon. Claire’s reason for not wanting to adapt to Lilypad
points to a lack of empowerment and an external locus of control. For a long time before Lilypad, staff
members had been feeling that supervisors were enforcing practices a certain way and dictating how data
should be managed. All of the record keepers other than Claire embraced Lilypad as a means to have
more say and participation in how records are created, and those record keepers enjoyed using Lilypad
and were enthusiastic to be a part of this work. The experiences of the record keepers show the
importance of helping staff feel that they have a say in the design and use of a system, and overall
organizational change, in order to match Monet’s democratic service model.
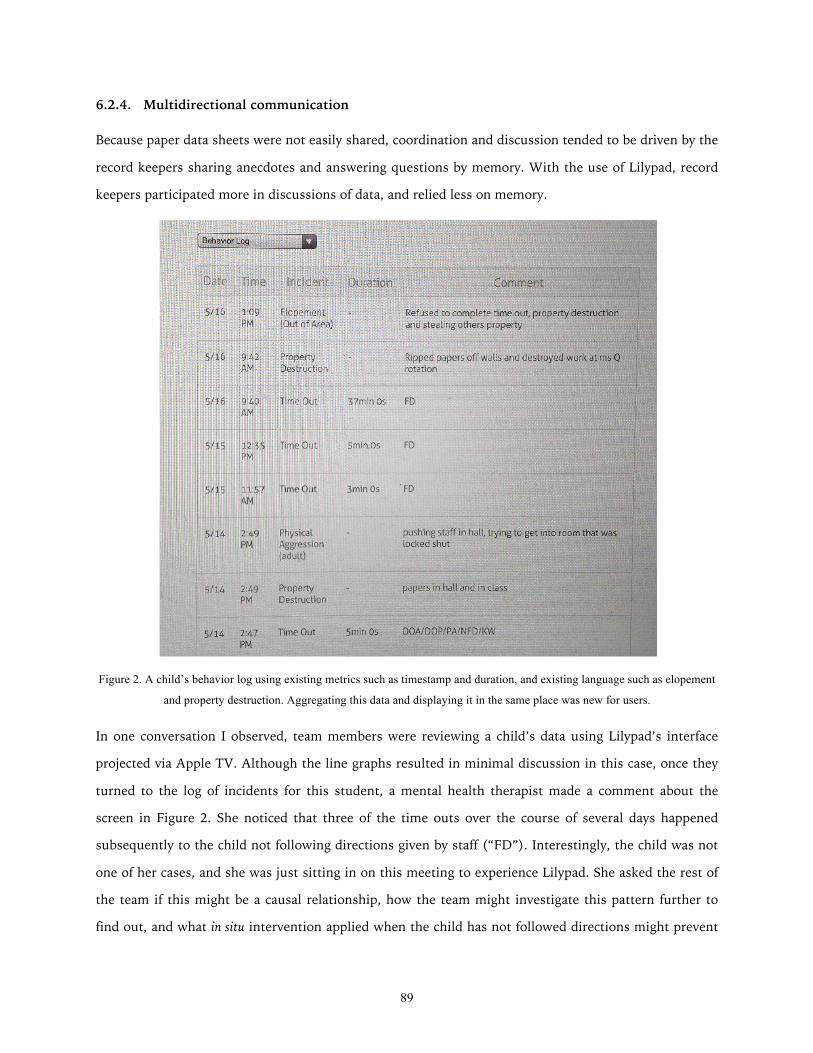
89
6.2.4. Multidirectional communication
Because paper data sheets were not easily shared, coordination and discussion tended to be driven by the
record keepers sharing anecdotes and answering questions by memory. With the use of Lilypad, record
keepers participated more in discussions of data, and relied less on memory.
Figure 2. A child’s behavior log using existing metrics such as timestamp and duration, and existing language such as elopement
and property destruction. Aggregating this data and displaying it in the same place was new for users.
In one conversation I observed, team members were reviewing a child’s data using Lilypad’s interface
projected via Apple TV. Although the line graphs resulted in minimal discussion in this case, once they
turned to the log of incidents for this student, a mental health therapist made a comment about the
screen in Figure 2. She noticed that three of the time outs over the course of several days happened
subsequently to the child not following directions given by staff (“FD”). Interestingly, the child was not
one of her cases, and she was just sitting in on this meeting to experience Lilypad. She asked the rest of
the team if this might be a causal relationship, how the team might investigate this pattern further to
find out, and what in situ intervention applied when the child has not followed directions might prevent
90
an escalation to a time out. The mental health therapist’s insight, and the discussion that followed,
exemplify data-driven coordination. This incident illustrates a distinct change from a prior tendency to
use primarily intuition and anecdotal evidence. Instead, the process of collaborative reflection was driven
by the use of data.
Team members also played different roles in maintaining external communication, each of which
involved their own challenges: mental health therapists were the primary liaisons between home and
school to support the course of treatment; psychiatrists would contact parents for medical information
and external clinicians for medical histories; behavioral specialists would communicate with parents to
compare and contrast daily behavioral trends between home and school; and supervisors would
communicate with auditors and school districts in managing Monet’s programs. Due to the limitations
of paper-based records, these communications were not very data-driven. Much like the earlier vignette
from a formal meeting, informal conversations tended to be based largely on anecdotal evidence and
memory.
Various team members reacted positively to seeing visualizations on Lilypad, and comments reflected
their respective roles in external communications. Mental health therapists, unprompted, stated how
useful the visualizations would be for sharing with parents and keeping them informed about their
child’s progress. Several informants confirmed that the visualizations would be easier for parents to
understand than existing paper reports. The roles of behavioral specialists (who were also record
keepers) and supervisors sometimes contradicted, since the former was concerned with working closely
with one classroom of children and getting to know their families, while supervisors were concerned
with the wellbeing of the organization as a whole and its ability to pass audits. Lilypad seemed to create
equilibrium by separating logistical needs that supervisors were concerned with, from the treatment
needs that drove the everyday work of behavioral specialists. Supervisors were satisfied with the
statistics being reported, while behavioral specialists had a variety of resources with which to explore a
child’s data.
Overall, the line graphs generated in real-time, performance metrics, and reports were highly valued. In
contrast to the frustration record keepers felt when it came to requests from their supervisors for more
paper-based records, they were willing put in the effort to adapt to Lilypad because they were motivated
by the direct benefit they could experience in not having to transfer and manage as many reports. Claire,
who was jaded and dragged her feet more than the others when it came to adoption, was more
motivated after seeing the functioning graphs and experiencing that immediate and concrete benefit.
91
One informant joined the study when she was hired as a new mental health therapist at Monet. She had
a very positive reaction when first introduced to Lilypad’s visualizations, and was eager to be involved
with the study despite still working to adjust to her new job. Based on her prior experience in the field,
she told us Lilypad would be in high demand if it were offered as a product, suggesting that she viewed
the design as filling an unmet need. She viewed Lilypad as an asset, requested to become a user, and
enthusiastically asked questions about its features.
6.3. Conclusion
The promise of health information technologies has remained largely unfulfilled, and unintended
consequences plague the introduction of these systems. This thesis builds on the growing body of
literature identifying these problems. It provides a complementary perspective to the considerable
literature on time-critical and acute care, by describing the nature of long-term chronic care. With a rise
in the prevalence of chronic conditions that span time, organizations, and providers (e.g., autism,
asthma, diabetes), team-based decision-making is becoming more common in health services.
I distinguish the focus of this thesis using the simplistic categories of organic and mechanistic systems.
Mechanistic systems are more predictable and structured – with well-defined problems – and thus
information technology is more straightforward to design and incorporate in these settings. I argue that
the unintended consequences that have arisen with HIT involve a mismatch between an organization
that operates organically, and HIT designed as a mechanistic system. I therefore designed and validated
Lilypad as an organic system. It involves flexible coordination that enables individualized services—plans
are flexible, goals change over time, and evaluation is subjective and long-term. It also avoids
standardization to allow for the type of adaptability, or framing and re-framing, involved in the
enactment of sensemaking and reflection.
The design of Lilypad as an organic system fit into existing workflow in an organization. Staff at Monet
adapted to recording data with Lilypad, and their discussions referenced the data in ways they had not
before. In addition, the Lilypad deployment seemed to reduce tensions among staff. In an organization
where tensions already existed, introducing a tool that had the potential to increase accountability and
supervision presented some risks. The use of Lilypad could have caused record keepers to feel even more
pressure, and the ability of administrators to more closely oversee their actions could have created an
even larger imbalance of power. Instead, Lilypad’s design as an organic system empowered the record
keepers. The deployment ended with Monet administrators asking for a full deployment across the
92
school for the following year – a request in which they appeared to draw from opinions of staff at all
levels of the organization. Lilypad was designed and introduced organically by addressing the needs at
various levels in the organization, and this united staff members who were sometimes at odds with one
another due to competing demands.
The contributions of this thesis include both breadth and depth: fieldwork provided an understanding of
day-to-day practices of coordination, with a focus on behavioral and mental health services; a
combination of field sites and comparisons to literature grounded findings in broader impact across
health services and organizational coordination. The concept of collaborative reflection emerged from
both the breadth and depth of this work, and thus it can be applied to other types of organizations that
use data to coordinate services.
Collaborative reflection can also further inform the design of organic systems, in ways that were out of
the scope of this thesis. For example, I observed the use of email, cell phones, landline classroom
phones, meetings, and ad hoc interactions in the hallway. HIT could provide additional means for team
members to reach one another in order to corroborate interpretations of data. Examples include group
messages with links to data, discussion forums around visualizations of data, and notifications based on
automated analyses of data as they are recorded and aggregated. Multiple representations of data also
could help members of a treatment team discuss the data in different ways. For example, data can be
shown in a scatter plot or a bar chart, and data can be shown by week or by month. Looking at the data
in different ways could help teams broaden discussions and possibly share more varying interpretations.
Multiple views could therefore aid corroboration by helping team members to identify where there are
diverging interpretations, and what should be discussed in order to develop a shared understanding as a
team.
Further research is required to investigate the effects of a significant change in the representation of
data. Existing paper-based data management enables little more than line graphs created by hand. The
staff we observed did not have the means to perform statistical analysis even as simple as correlations,
and few had appropriate training in data analysis. As a result, I expect new representations of their data
to be a significant change in their practices. Understanding how this change will affect providers and
their interpretations will inform the design of information systems for collaborative reflection.
93
References
Bloom, S. L., & Farragher, B. (2013). Restoring Sanctuary: A New Operating System for Trauma-Informed Systems of Care. Oxford University Press.
Bonsignore, E., Quinn, A.J., Druin, A., & Bederson, B.B. (2013). Sharing Stories “in the Wild”: A Mobile Storytelling Case Study Using StoryKit. TOCHI 20(3), Article 18.
Johnson, R., Rogers, Y., van der Linden, J., & Bianchi-Berthouze, N. (2012). Being in the thick of in-the-wild studies: the challenges and insights of researcher participation. In Proceedings of CHI ‘12, 1135-1144.
Marcu, G., Dey, A.K., & Kiesler, S. (2014). Designing for Collaborative Reflection. In Proceedings of PervasiveHealth ‘14.
Marshall, P., Morris, R., Rogers, Y., Kreitmayer, S., & Davies, M. (2013). Rethinking 'multi-user': an in-the-wild study of how groups approach a walk-up-and-use tabletop interface. In Proceedings of CHI ‘13, 3033-3042.
Messeter, J. & Molenaar, D. (2012). Evaluating ambient displays in the wild: highlighting social aspects of use in public settings. In Proceedings of DIS ‘12, 478-481.
O’Looney, J. (1993). Beyond Privatization and Service Integration: Organizational Models for Service Delivery. Social Service Review 67(4), 501-534.
Siek, K.A., Hayes, G.R., Newman, M.W., & Tang, J.C. (2014). Field deployments: Knowing from using in context. In Kellogg, W.A. and Olson, J.S., (Eds.)., Ways of Knowing in HCI (119-142). Springer.