Embed Size (px)
Citation preview
Designing the data warehouse/ data marts
Methodologies and Techniques
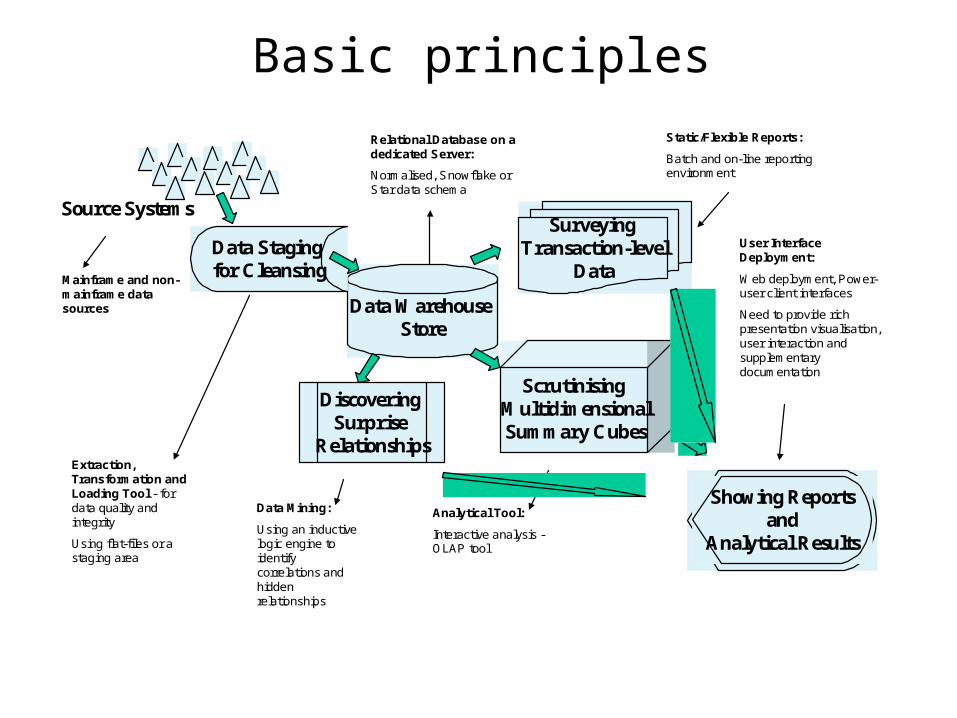
Mainframe and non-mainframe data sources
Extraction, Transformation and Loading Tool - for data quality and integrity
Using flat-files or a staging area
Relational Database on a dedicated Server:
Normalised, Snowflake or Star data schema
Static/Flexible Reports:
Batch and on-line reporting environment
Data Mining:
Using an inductive logic engine to identify correlations and hidden relationships
Analytical Tool:
Interactive analysis -OLAP tool
User Interface Deployment:
Web deployment, Power-user client interfaces
Need to provide rich presentation visualisation, user interaction and supplementary documentation
Scrutinising MultidimensionalSummary Cubes
Surveying Transaction-level
Data
Showing Reportsand
Analytical Results
Data Warehouse Store
Source Systems
Discovering Surprise
Relationships
Data Staging for Cleansing
Basic principles
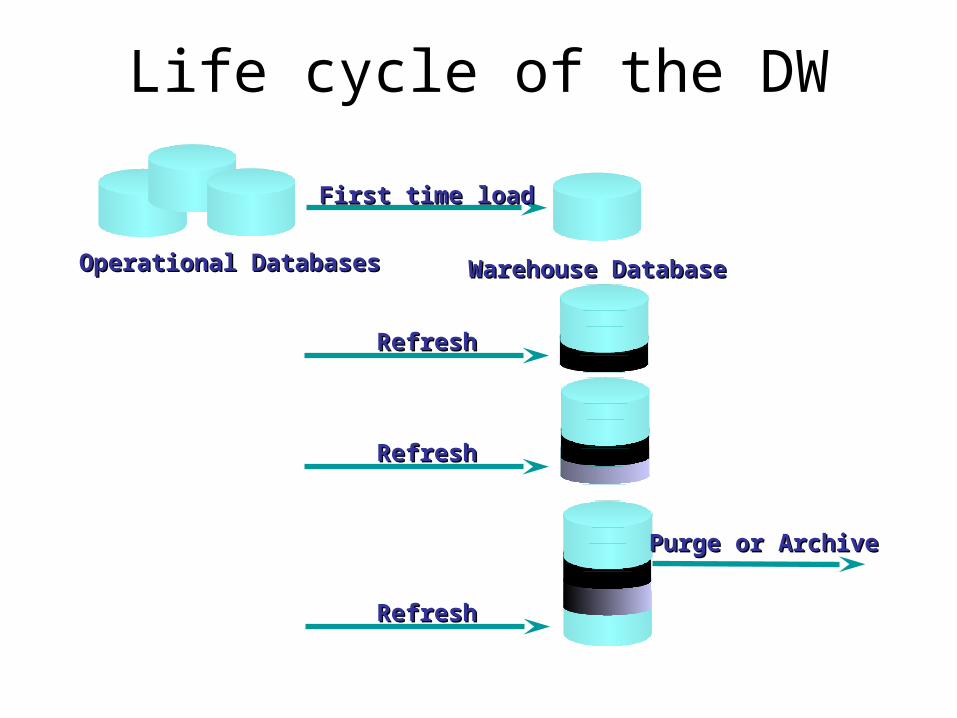
Life cycle of the DW
Operational DatabasesOperational Databases Warehouse DatabaseWarehouse Database
First time loadFirst time load
RefreshRefresh
RefreshRefresh
RefreshRefresh
Purge or ArchivePurge or Archive
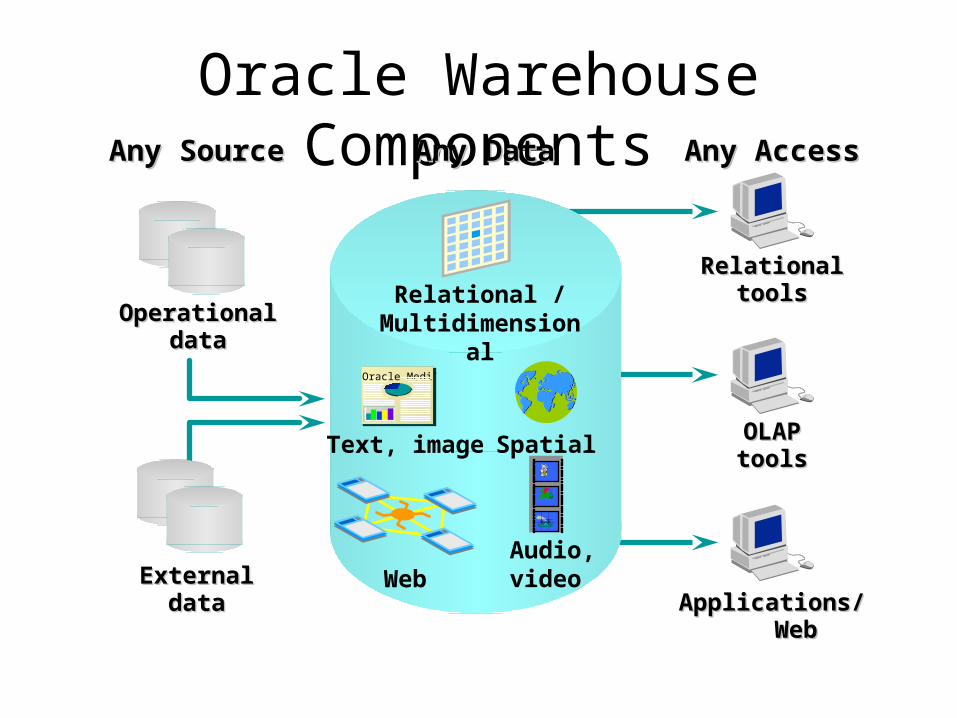
Oracle Warehouse Components
RelationalRelationaltoolstools
Applications/ WebApplications/ Web
Any DataAny Data Any AccessAny AccessAny SourceAny Source
ExternalExternaldatadata
OperationalOperationaldatadata
OLAPOLAPtoolstools
Text, image
Oracle Medi`
Relational /Multidimensional
Spatial
Audio,videoWeb
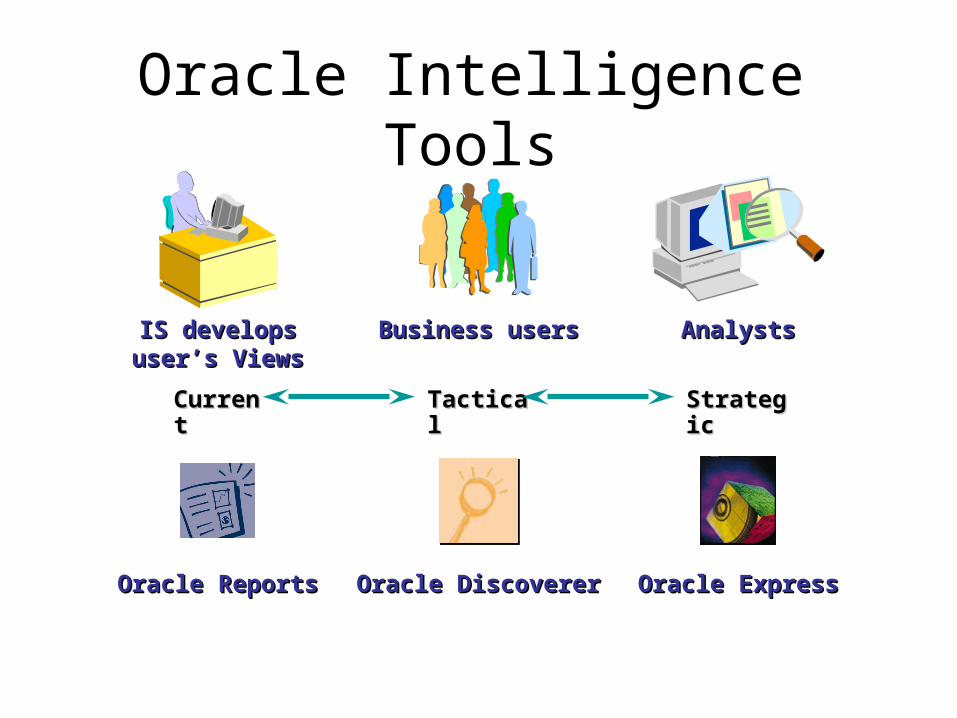
Oracle Intelligence Tools
IS developsIS developsuser’s Viewsuser’s Views
Oracle ReportsOracle Reports
CurrentCurrent
Business usersBusiness users
Oracle DiscovererOracle Discoverer
TacticalTactical
AnalystsAnalysts
Oracle ExpressOracle Express
StrategicStrategic
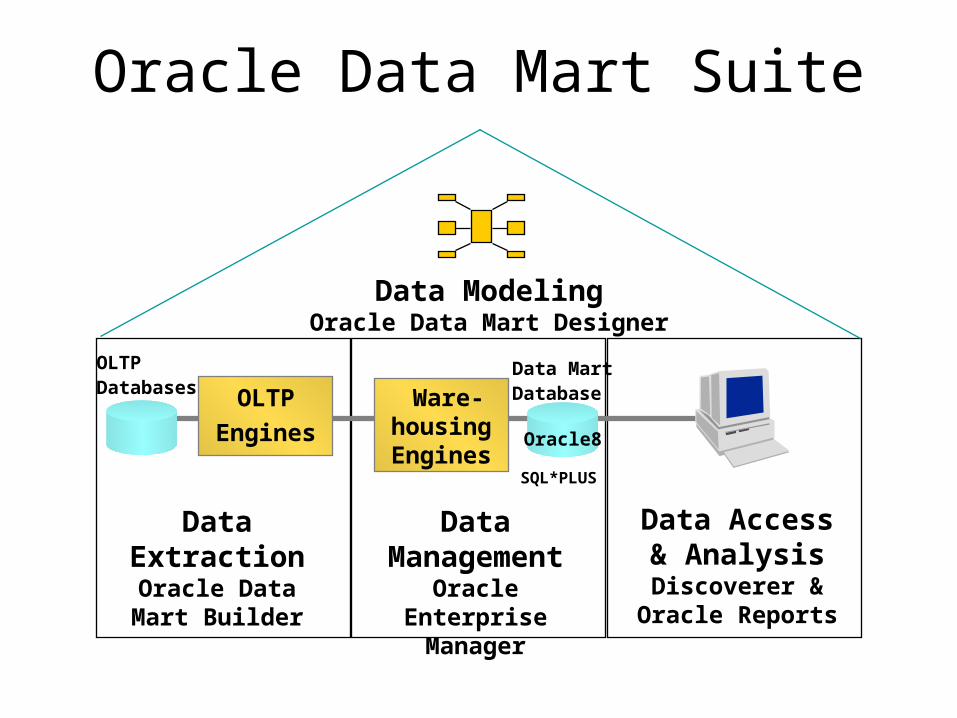
Oracle Data Mart Suite
Ware-housingEngines
Data ModelingOracle Data Mart Designer
Data Management
Oracle Enterprise Manager
Data Extraction
Oracle Data Mart Builder
Data Access & AnalysisDiscoverer &
Oracle Reports
OLTP
Engines
OLTPDatabases
Data MartDatabase
Oracle8
SQL*PLUS
“Big Bang” Approach:Advantages and Disadvantages• Advantages:
– warehouse built as part of major project (eg: BPR)
– Having a “big picture” of the data warehouse before starting the data warehousing project
• Disadvantages:– Involves a high risk, takes a longer time– Runs the risk of needing to change
requirements– Costly and harder to get support for from
users
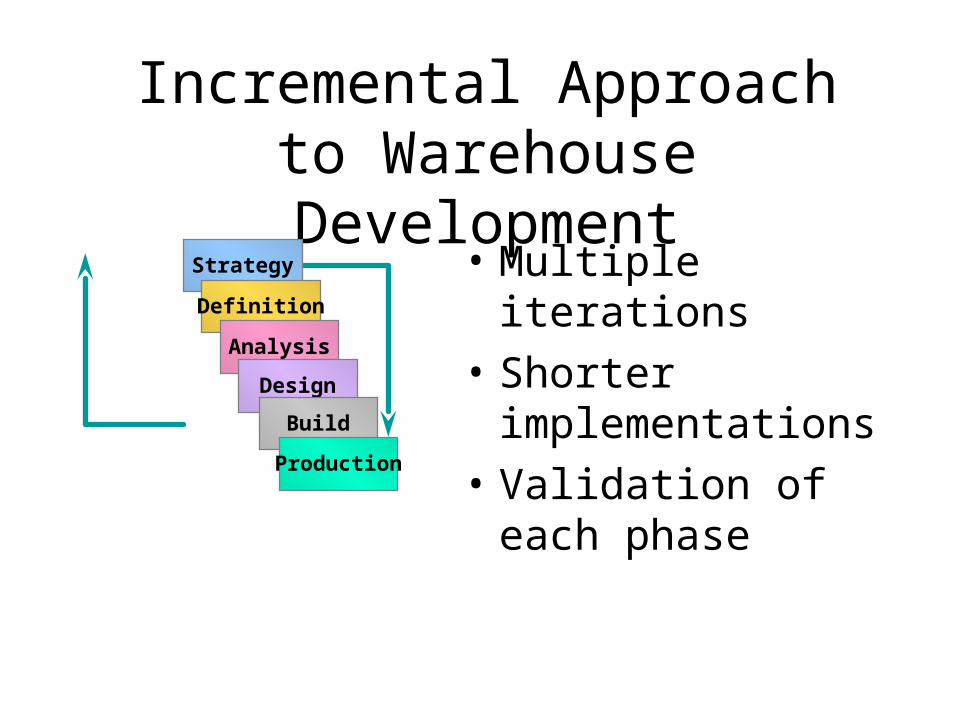
Incremental Approach to Warehouse Development
• Multiple iterations
• Shorter implementations
• Validation of each phase
Strategy
Definition
Analysis
Design
Build
Production
Benefits of an Incremental Approach
• Delivers a strategic data warehouse solution through incremental development efforts
• Provides extensible, scalable architecture • Quickly provides business benefits and
ensures a much earlier return of investment
• Allows a data warehouse to be built based on a subject or application area at a time
• Allows the construction of an integrated data mart environment
Data Mart • A subset of a data warehouse that
supports the requirements of a particular department or business function.
• Characteristics include:– Do not normally contain detailed operational data
unlike data warehouses.– May contain certain levels of aggregation
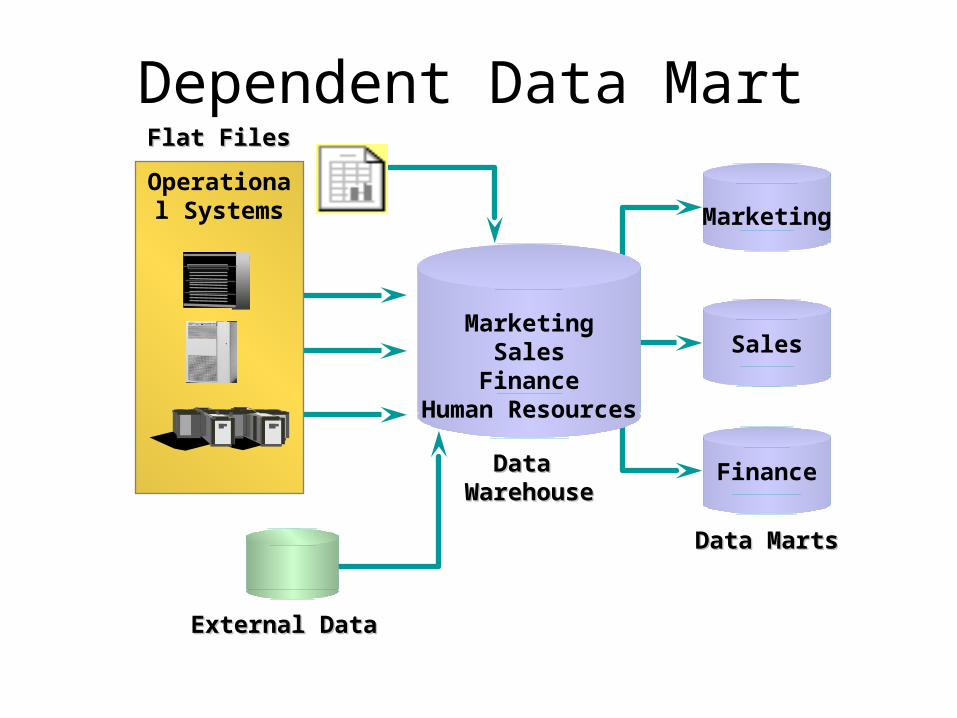
MarketingSales
FinanceHuman Resources
Dependent Data Mart
Data Data WarehouseWarehouse
Data MartsData Marts
External DataExternal Data
Flat FilesFlat Files
Operational Systems Marketing
Sales
Finance
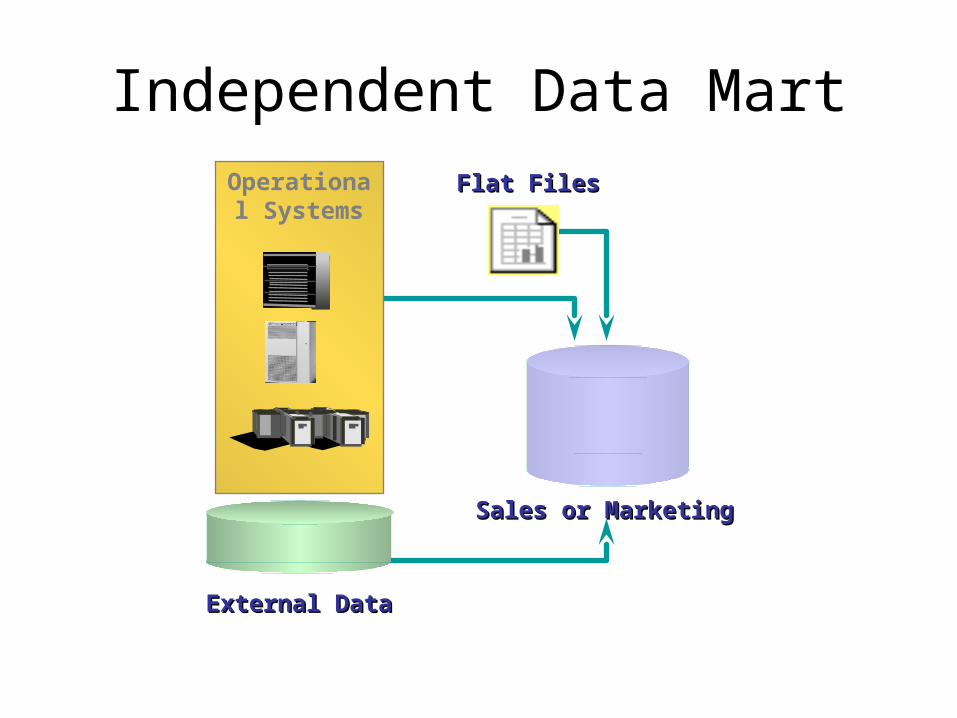
Independent Data Mart
Sales or MarketingSales or Marketing
External DataExternal Data
Flat FilesFlat FilesOperational Systems
Reasons for Creating a Data Mart
• To give users more flexible access to the data they need to analyse most often.
• To provide data in a form that matches the collective view of a group of users
• To improve end-user response time.
• Potential users of a data mart are clearly defined and can be targeted for support
Reasons for Creating a Data Mart
• To provide appropriately structured data as dictated by the requirements of the end-user access tools.
• Building a data mart is simpler compared with establishing a corporate data warehouse.
• The cost of implementing data marts is far less than that required to establish a data warehouse.
Data Marts Issues• Data mart functionality• Data mart size• Data mart load performance• Users access to data in multiple data
marts• Data mart Internet / Intranet access• Data mart administration• Data mart installation
Example of DW tool OLAP
• Rotate and drill down to successive levels of detail.
• Create and examine calculated data interactively on large volumes of data.
• Determine comparative or relative differences.
• Perform exception and trend analysis.
• Perform advanced analytical functions for example forecasting, modeling, and regression analysis
Original OLAP Rules
1. Multidimensional conceptual view
2. Transparency
3. Accessibility
4. Consistent reporting performance
5. Client-server architecture
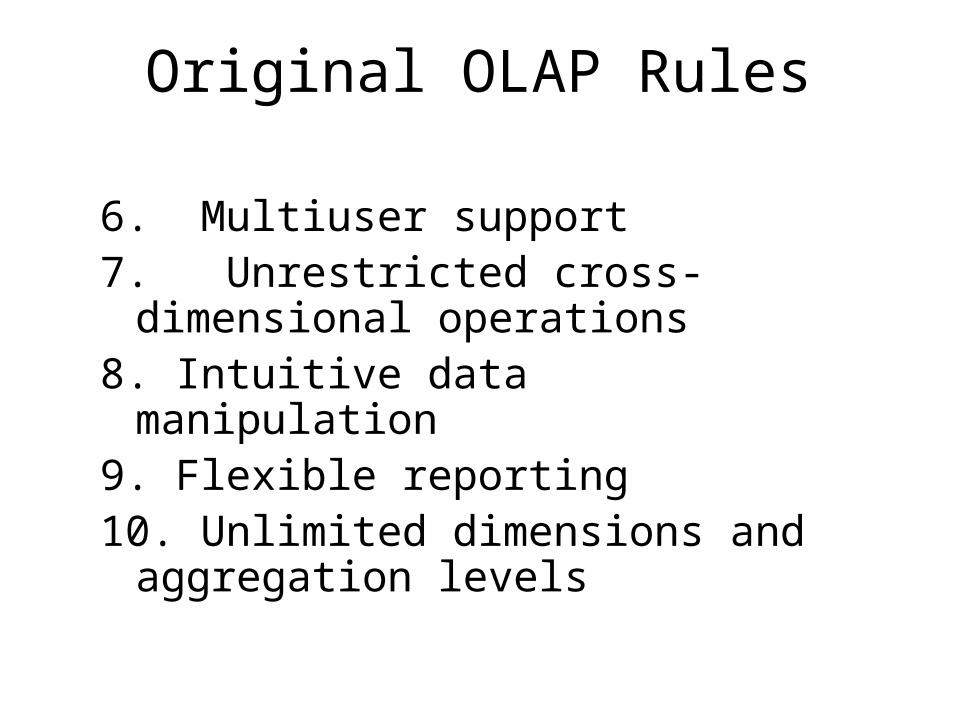
Original OLAP Rules
6. Multiuser support7. Unrestricted cross-dimensional
operations8. Intuitive data manipulation9. Flexible reporting10. Unlimited dimensions and
aggregation levels
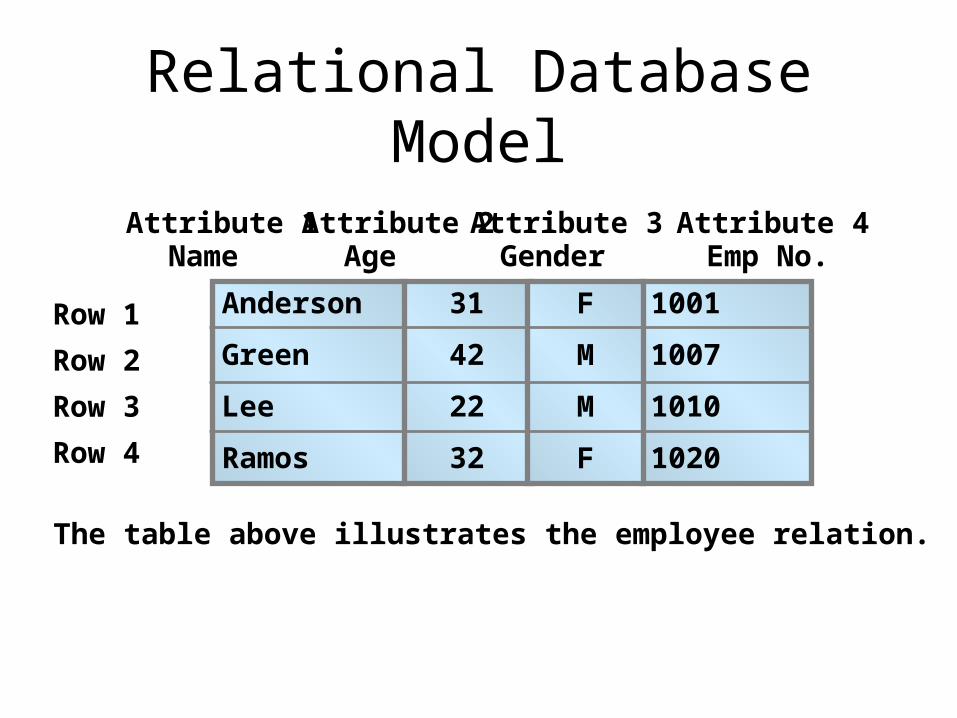
1001
1007
1010
1020
Relational Database Model
31
42
22
32
F
M
M
F
Anderson
Green
Lee
Ramos
Attribute 1Name
Attribute 2Age
Attribute 3Gender
Row 1
Row 2
Row 3
Row 4
The table above illustrates the employee relation.
Attribute 4Emp No.
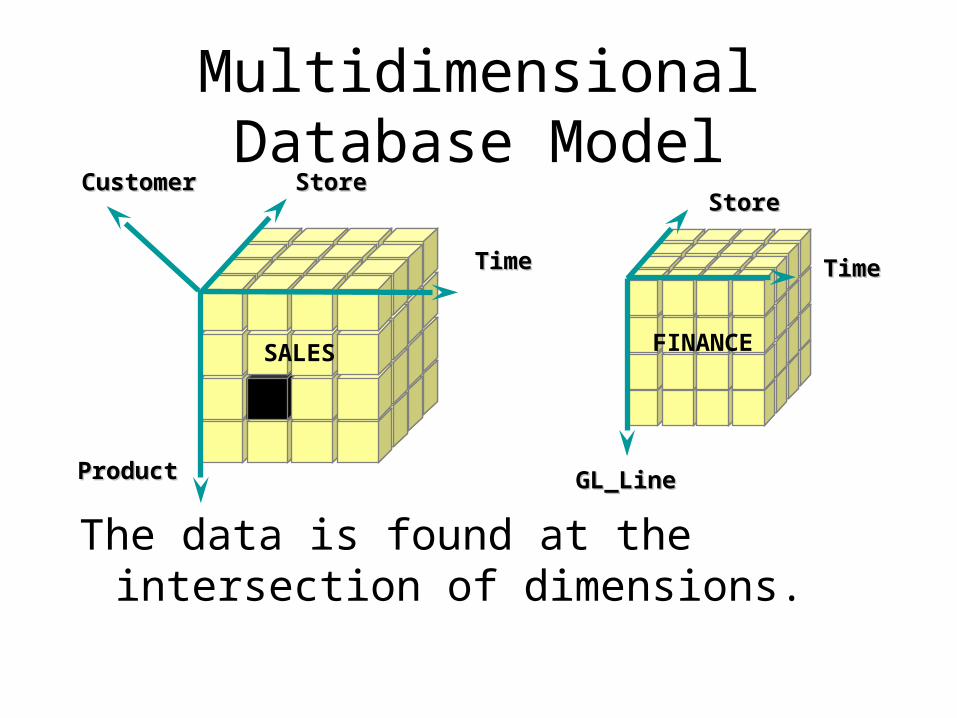
Multidimensional Database Model
The data is found at the intersection of dimensions.
StoreStore
GL_LineGL_Line
TimeTime
FINANCE
StoreStore
ProductProduct
TimeTime
SALES
CustomerCustomer
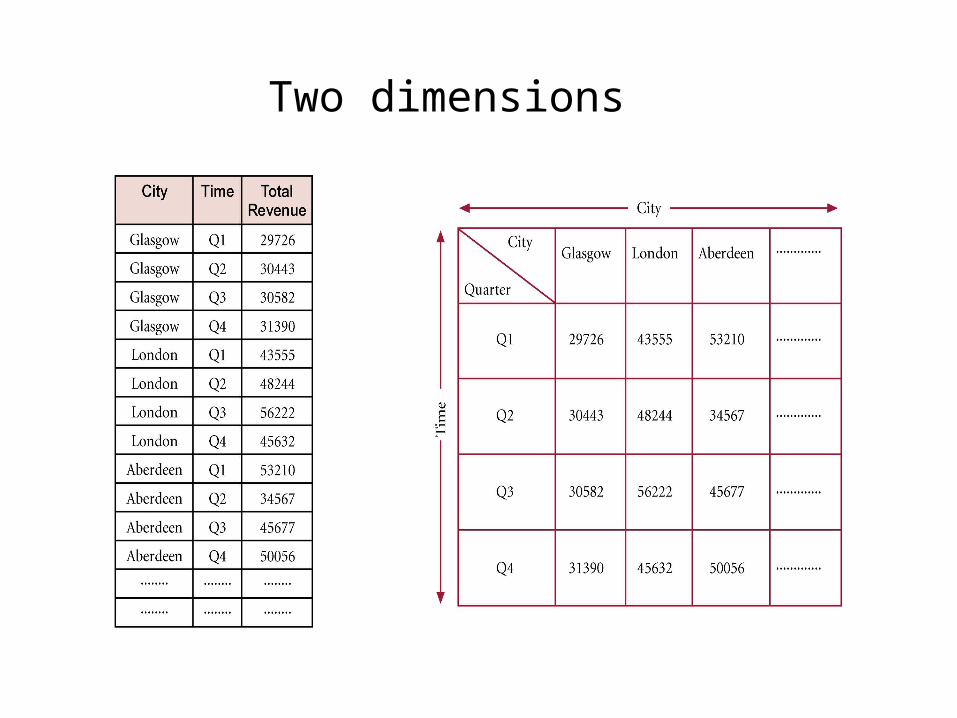
Two dimensions
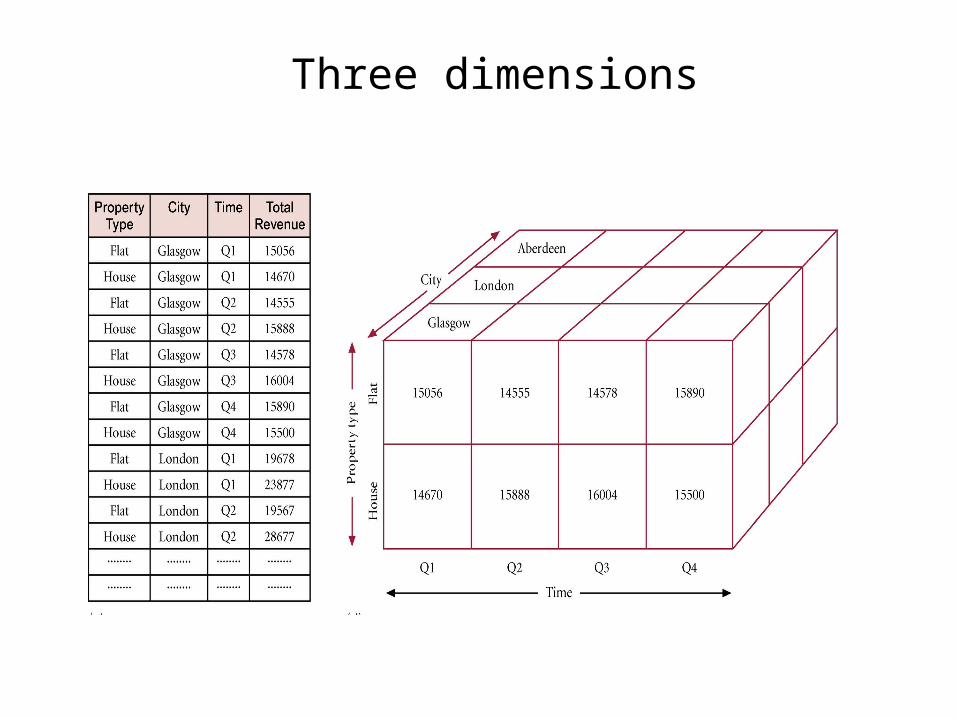
Three dimensions
Specialised Multidimensional tool• Benefits:
– Quick access to very large volumes of data– Extensive and comprehensive libraries of
complex functions• analysis• Strong modeling and forecasting capabilities
– Can access multidimensional and relational database structures
– Caters for calculated fields
• Disadvantages:– Difficulty of changing model – Lack of support for very large volumes of data– May require significant processing power
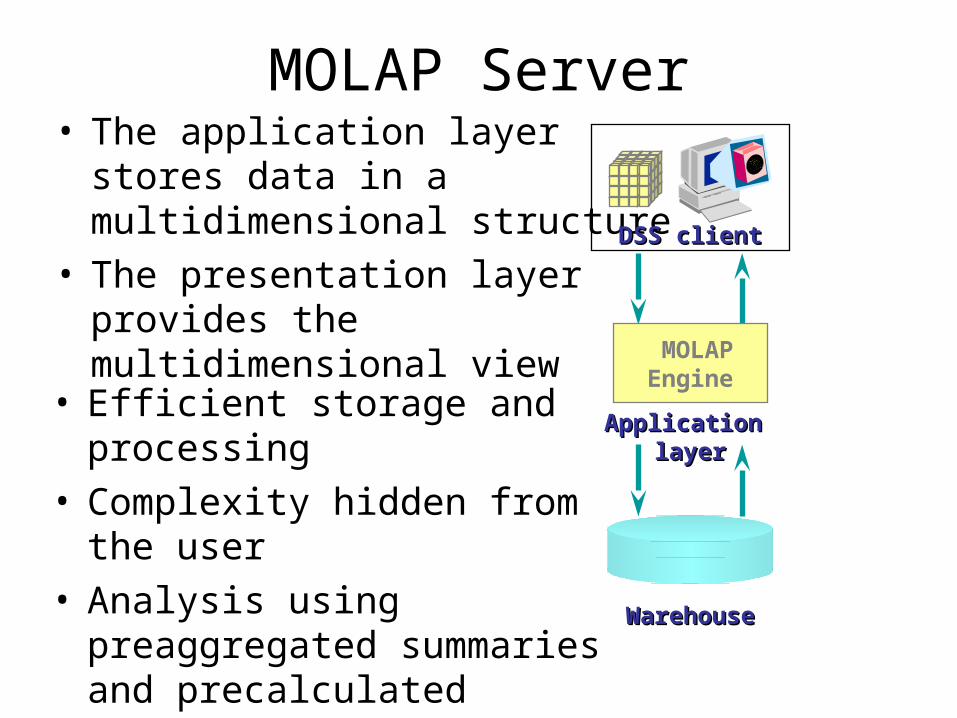
MOLAP Server• The application layer
stores data in a multidimensional structure
• The presentation layer provides the multidimensional view MOLAP
Engine
DSS clientDSS client
Application Application layerlayer
WarehouseWarehouse
• Efficient storage and processing• Complexity hidden from the
user• Analysis using preaggregated
summaries and precalculated measures
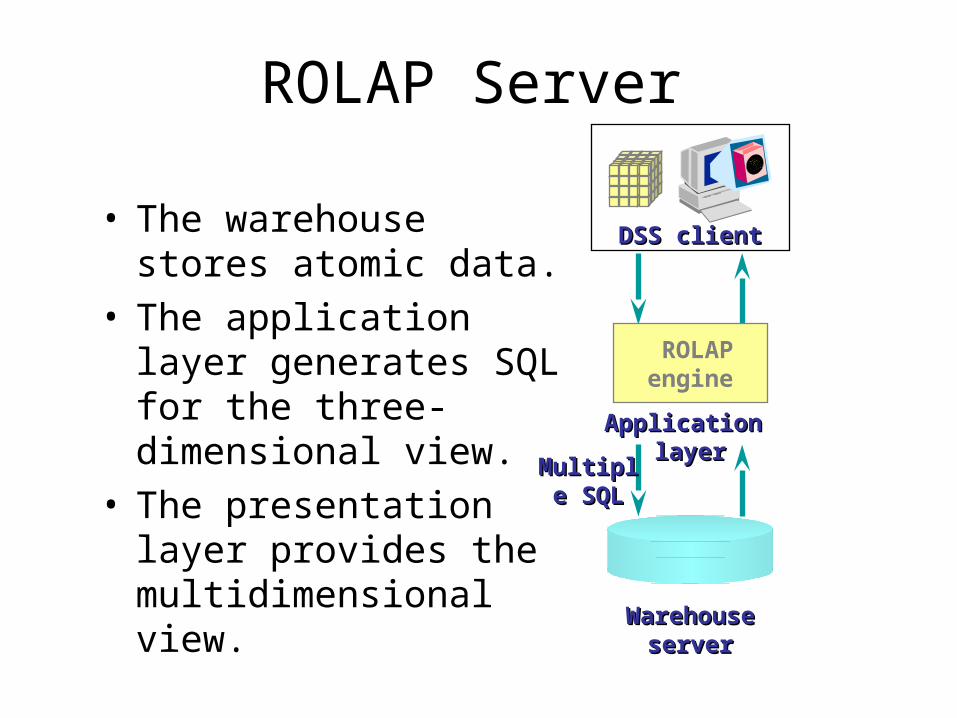
ROLAP Server
• The warehouse stores atomic data.
• The application layer generates SQL for the three- dimensional view.
• The presentation layer provides the multidimensional view.
ROLAPengine
DSS clientDSS client
Application Application layerlayer
WarehouseWarehouseserverserver
Multiple Multiple SQLSQL
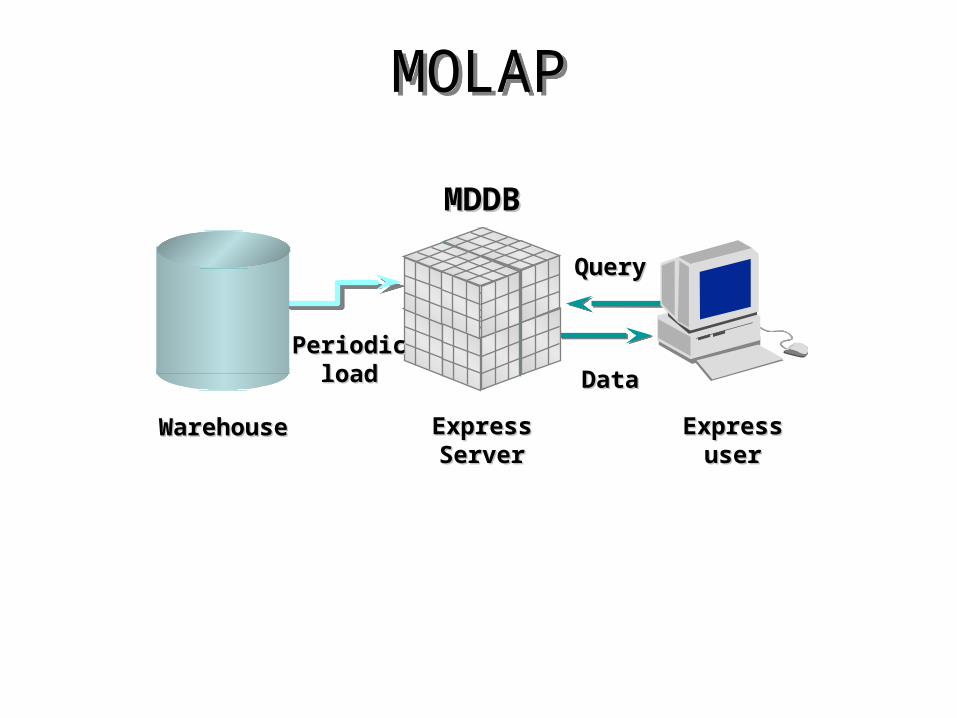
MOLAPMOLAP
ExpressExpressServerServer
ExpressExpressuseruser
WarehouseWarehouse
QueryQuery
DataData
MDDBMDDB
PeriodicPeriodicloadload
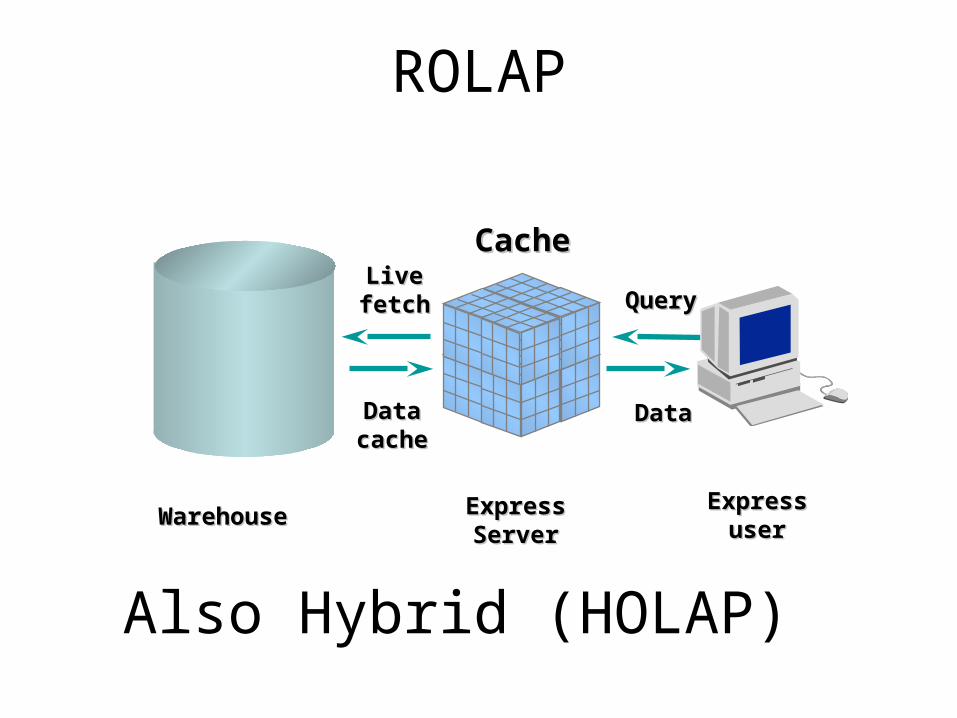
ROLAP
ExpressExpressServerServer
ExpressExpressuseruserWarehouseWarehouse
DataDatacachecache
LiveLivefetchfetch
CacheCache
QueryQuery
DataData
Also Hybrid (HOLAP)
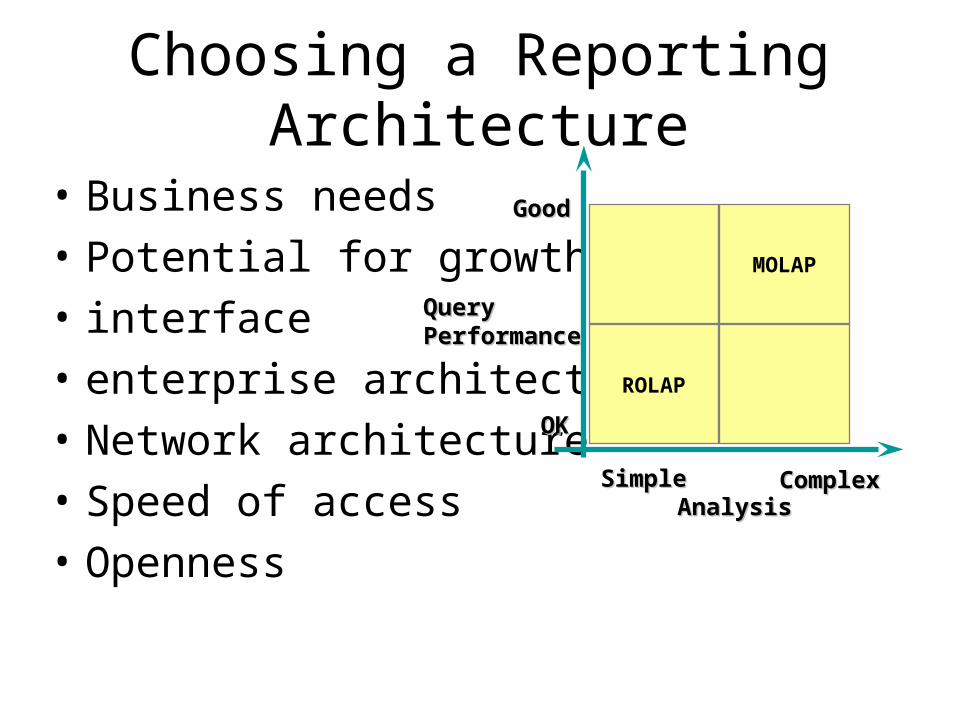
Choosing a Reporting Architecture
• Business needs
• Potential for growth
• interface
• enterprise architecture
• Network architecture
• Speed of access
• Openness
MOLAP
ROLAP
SimpleSimple ComplexComplex
QueryQueryPerformancePerformance
GoodGood
OKOK
AnalysisAnalysis
Data Acquisition
• Identify, extract, transform, and transport source data
• Consider internal and external data
• Perform gap analysis between source data and target database objects
• Plan move of data between sources and target
• Define first-time load and refresh strategy
• Define tool requirements
• Build, test, and execute data acquisition modules
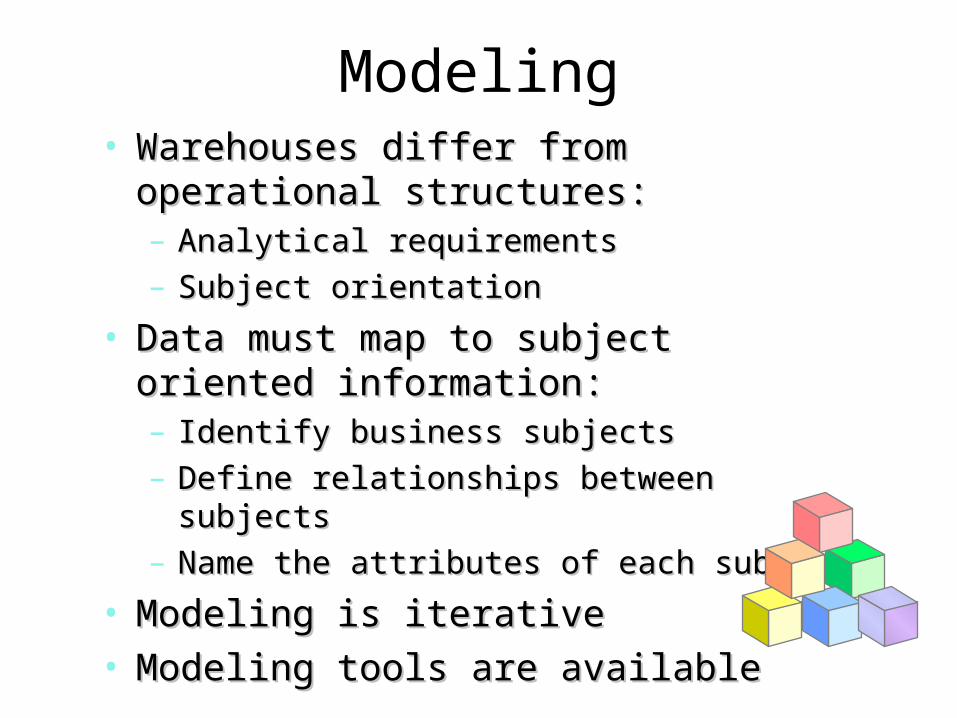
Modeling• Warehouses differ from operational Warehouses differ from operational
structures: structures: – Analytical requirementsAnalytical requirements– Subject orientationSubject orientation
• Data must map to subject oriented Data must map to subject oriented information:information:– Identify business subjectsIdentify business subjects– Define relationships between subjectsDefine relationships between subjects– Name the attributes of each subjectName the attributes of each subject
• Modeling is iterativeModeling is iterative• Modeling tools are availableModeling tools are available
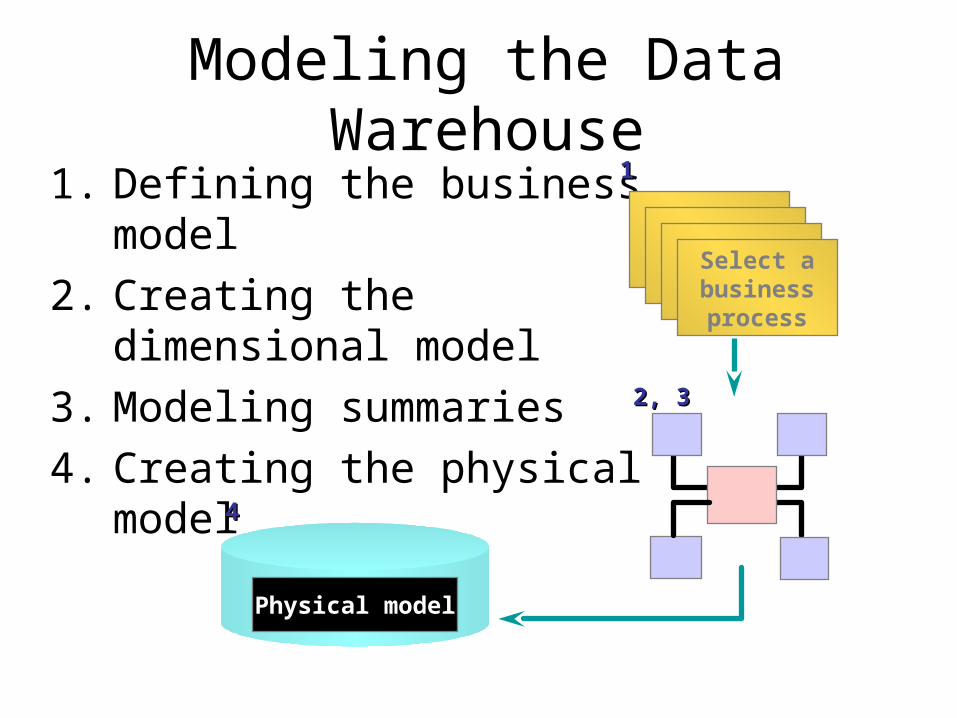
1. Defining the business model
2. Creating the dimensional model
3. Modeling summaries
4. Creating the physical model
Physical model
11
2, 32, 3
44
Select a business process
Modeling the Data Warehouse
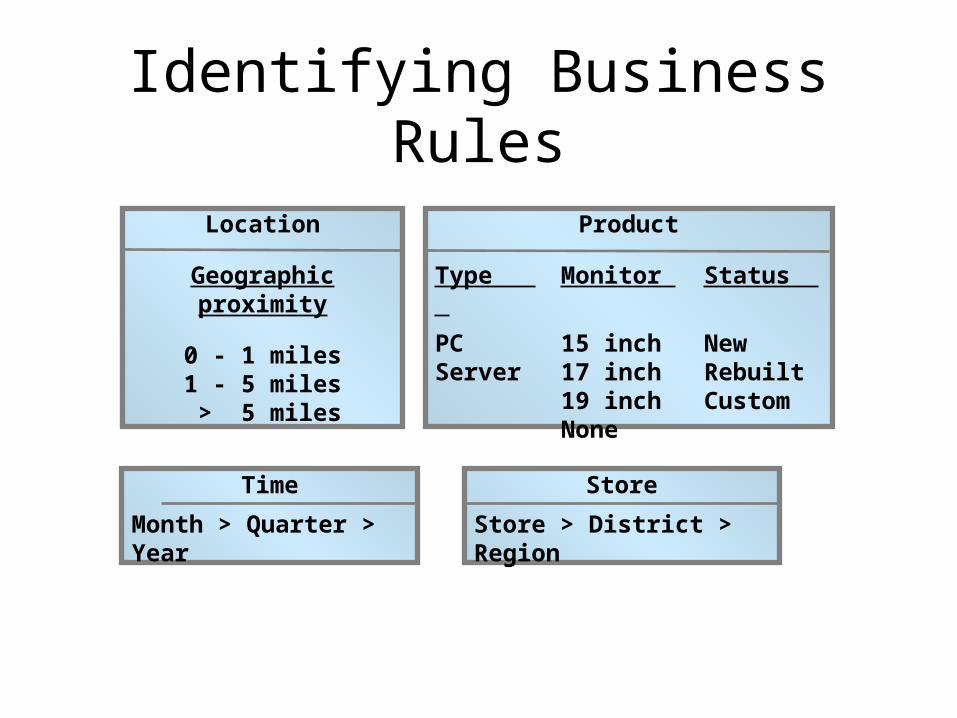
Identifying Business Rules
Product
Type Monitor Status
PC 15 inch NewServer 17 inch Rebuilt
19 inch CustomNone
Location
Geographic proximity
0 - 1 miles1 - 5 miles > 5 miles
Store
Store > District > Region
Time
Month > Quarter > Year
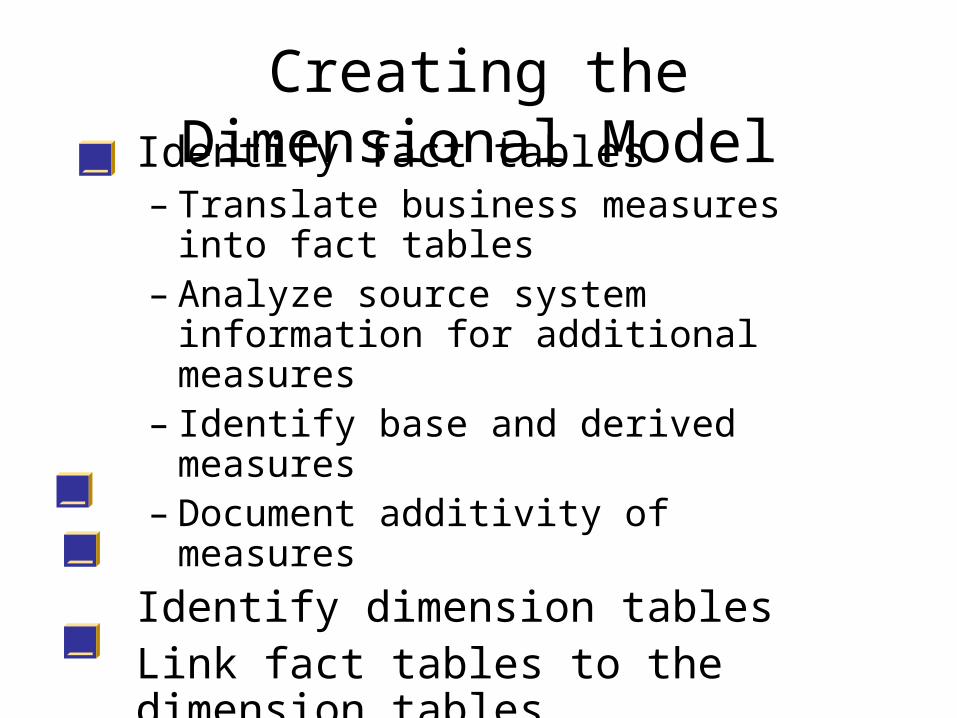
Creating the Dimensional ModelIdentify fact tables– Translate business measures into fact
tables– Analyze source system information for
additional measures– Identify base and derived measures– Document additivity of measures
Identify dimension tablesLink fact tables to the dimension tablesCreate views for users
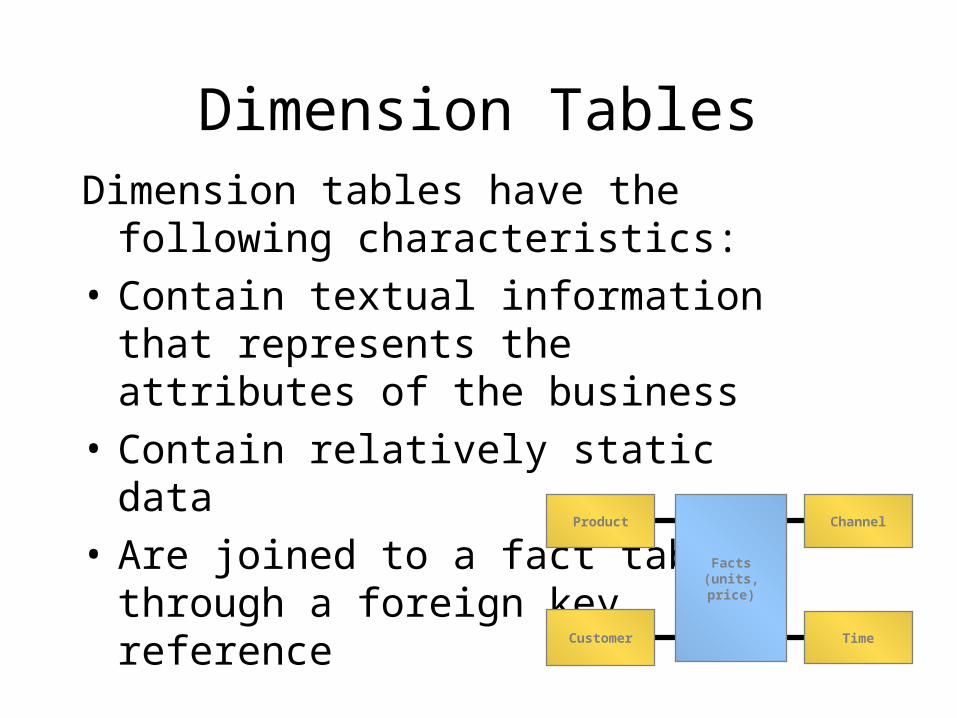
Dimension TablesDimension tables have the following
characteristics:
• Contain textual information that represents the attributes of the business
• Contain relatively static data
• Are joined to a fact table through a foreign key reference Product Channel
Facts(units,price)
Customer Time
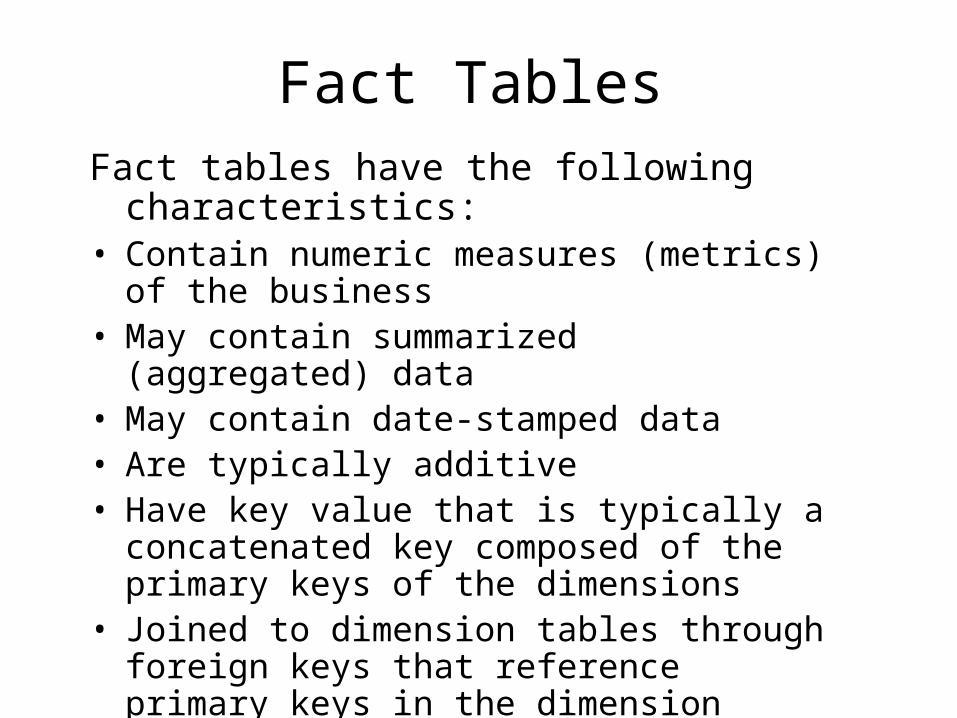
Fact TablesFact tables have the following characteristics:• Contain numeric measures (metrics) of the
business• May contain summarized (aggregated) data• May contain date-stamped data• Are typically additive• Have key value that is typically a
concatenated key composed of the primary keys of the dimensions
• Joined to dimension tables through foreign keys that reference primary keys in the dimension tables
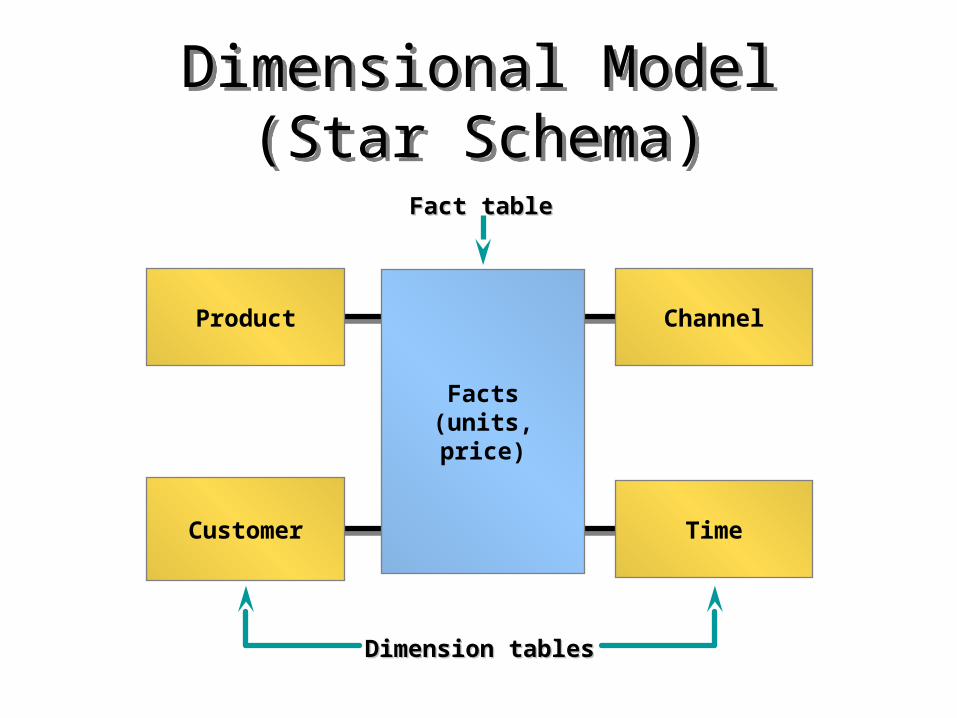
Dimensional Model (Star Schema)
Dimensional Model (Star Schema)
Product Channel
Facts(units,price)
Customer Time
Dimension tablesDimension tables
Fact tableFact table
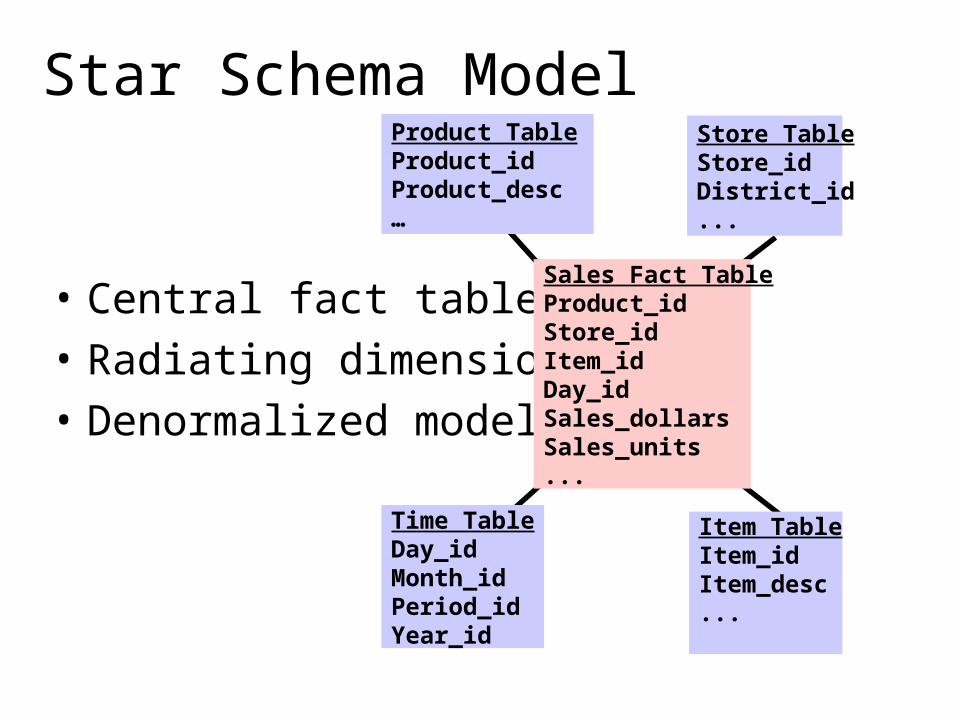
Star Schema Model
• Central fact table
• Radiating dimensions
• Denormalized model
Store TableStore_idDistrict_id...
Item TableItem_idItem_desc...
Time TableDay_idMonth_idPeriod_idYear_id
Product TableProduct_idProduct_desc…
Sales Fact TableProduct_idStore_idItem_idDay_idSales_dollarsSales_units...
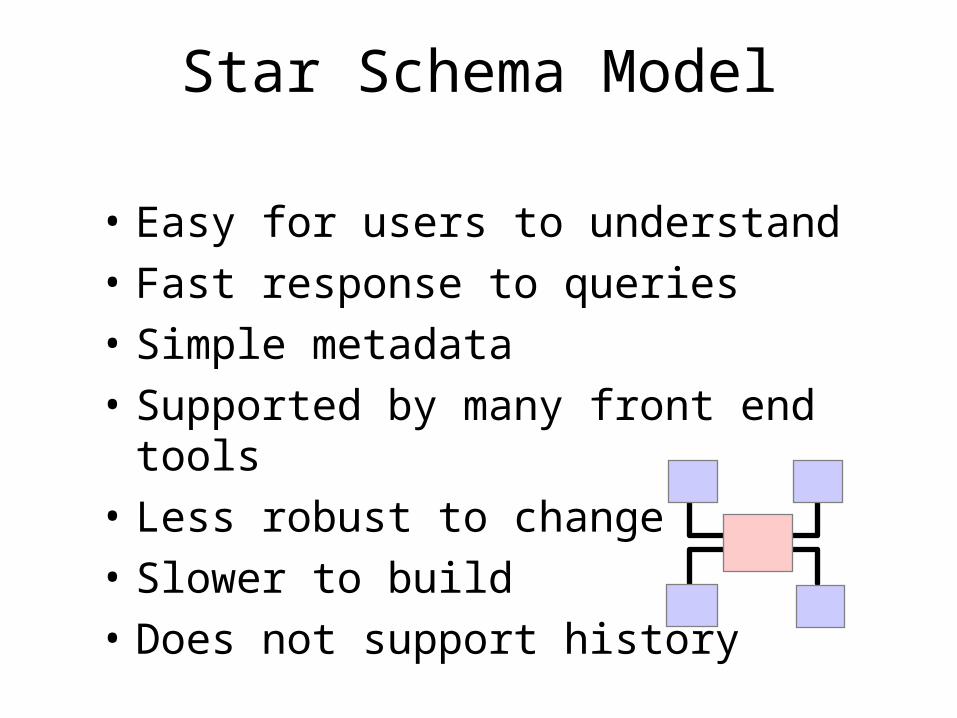
Star Schema Model
• Easy for users to understand
• Fast response to queries
• Simple metadata
• Supported by many front end tools
• Less robust to change
• Slower to build
• Does not support history
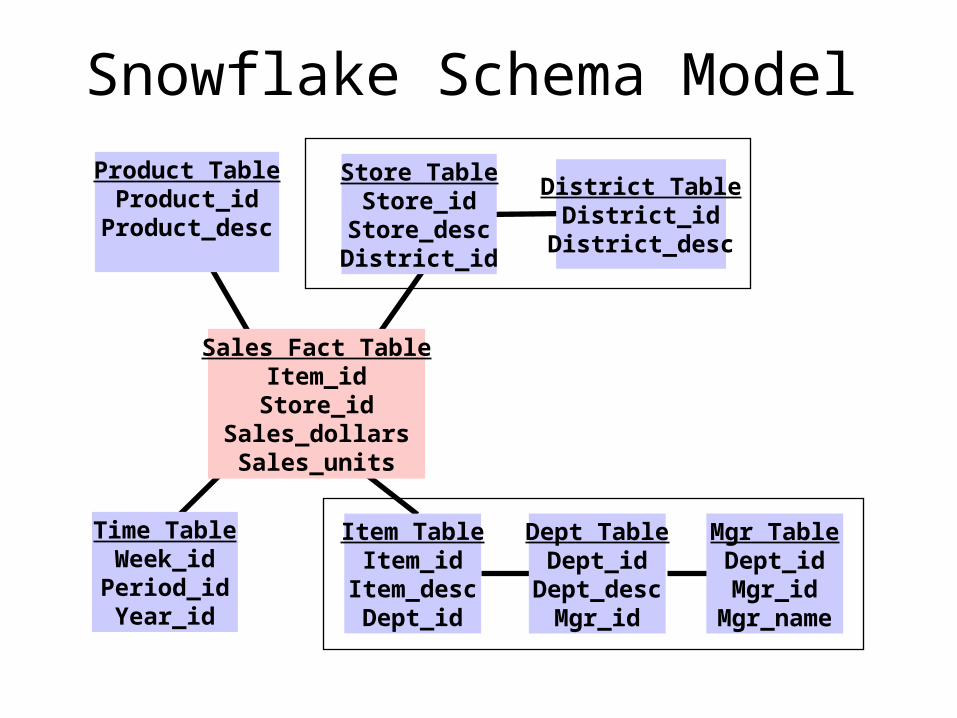
Snowflake Schema Model
Time TableWeek_idPeriod_idYear_id
Dept TableDept_id
Dept_descMgr_id
Mgr TableDept_idMgr_id
Mgr_name
Product TableProduct_id
Product_desc
Item TableItem_id
Item_descDept_id
Sales Fact TableItem_idStore_id
Sales_dollarsSales_units
Store TableStore_id
Store_descDistrict_id
District TableDistrict_id
District_desc
Snowflake Schema Model
• Direct use by some tools
• More flexible to change
• Provides for speedier data loading
• May become large and unmanageable
• Degrades query performance
• More complex metadata
Using Summary Data
• Provides fast access to precomputed data
• Reduces use of I/O, CPU, and memory
• Is distilled from source systems and precalculated summaries
• Usually exists in summary fact tables
Phase 3: Modeling summaries
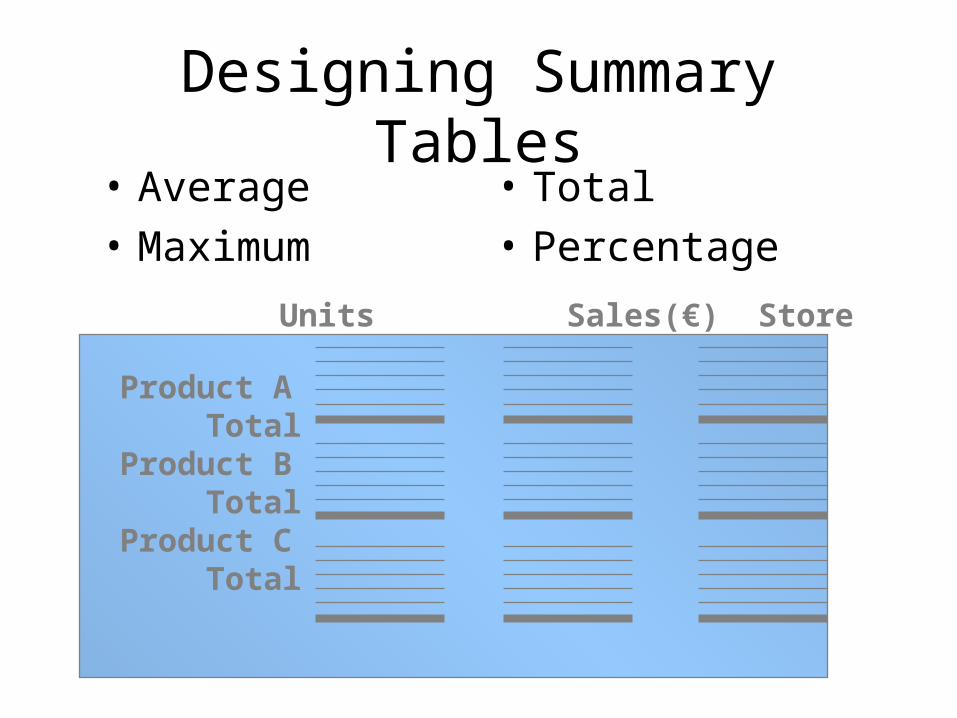
Designing Summary Tables
Units Sales(€) Store
Product ATotal
Product BTotal
Product CTotal
• Average• Maximum
• Total• Percentage
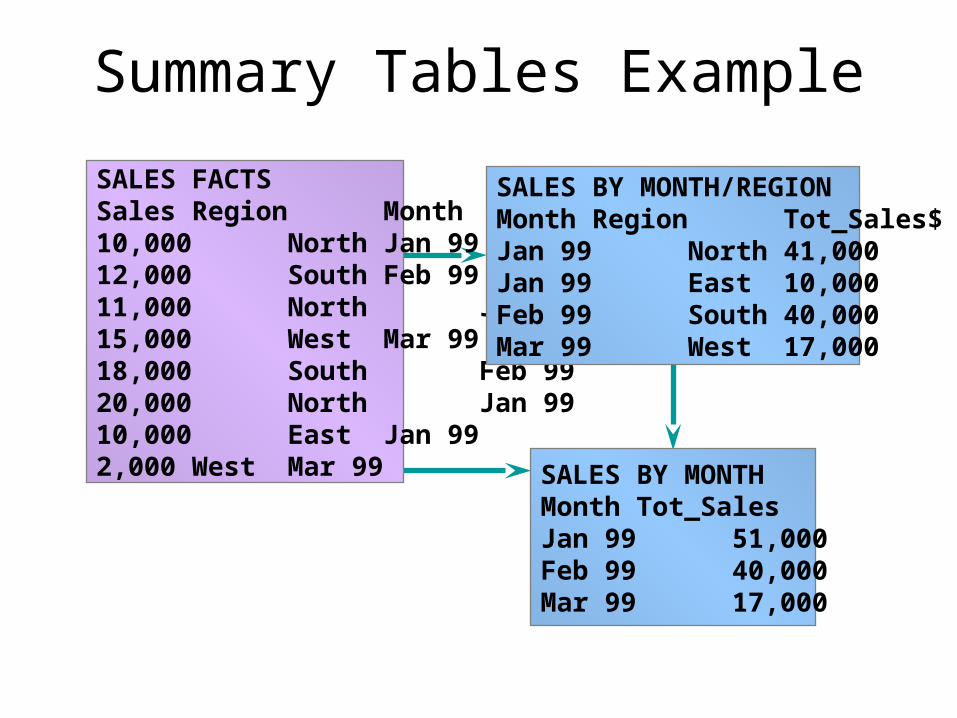
Summary Tables Example
SALES FACTSSales Region Month10,000 North Jan 9912,000 South Feb 9911,000 North Jan 9915,000 West Mar 9918,000 South Feb 9920,000 North Jan 9910,000 East Jan 992,000 West Mar 99
SALES BY MONTH/REGIONMonth Region Tot_Sales$Jan 99 North 41,000Jan 99 East 10,000Feb 99 South 40,000Mar 99 West 17,000
SALES BY MONTHMonth Tot_SalesJan 99 51,000Feb 99 40,000Mar 99 17,000
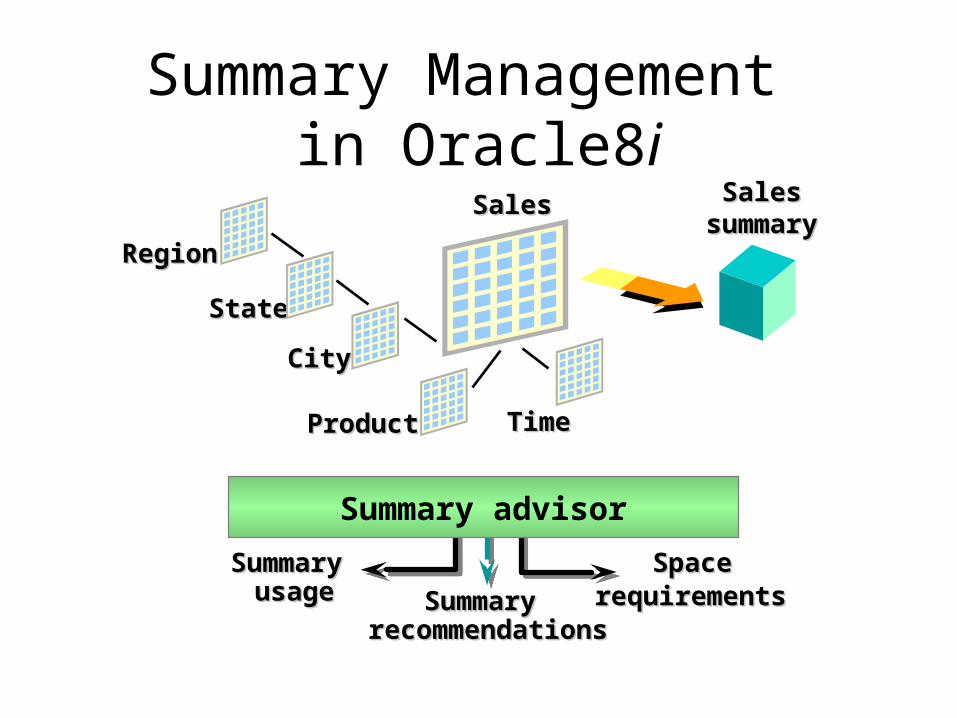
Summary Management in Oracle8i
ProductProduct
RegionRegion
TimeTime
SalesSalessummarysummary
CityCity
SalesSales
StateState
Summary Summary usageusage
Summary advisor
Space Space requirementsrequirements Summary Summary
recommendationsrecommendations
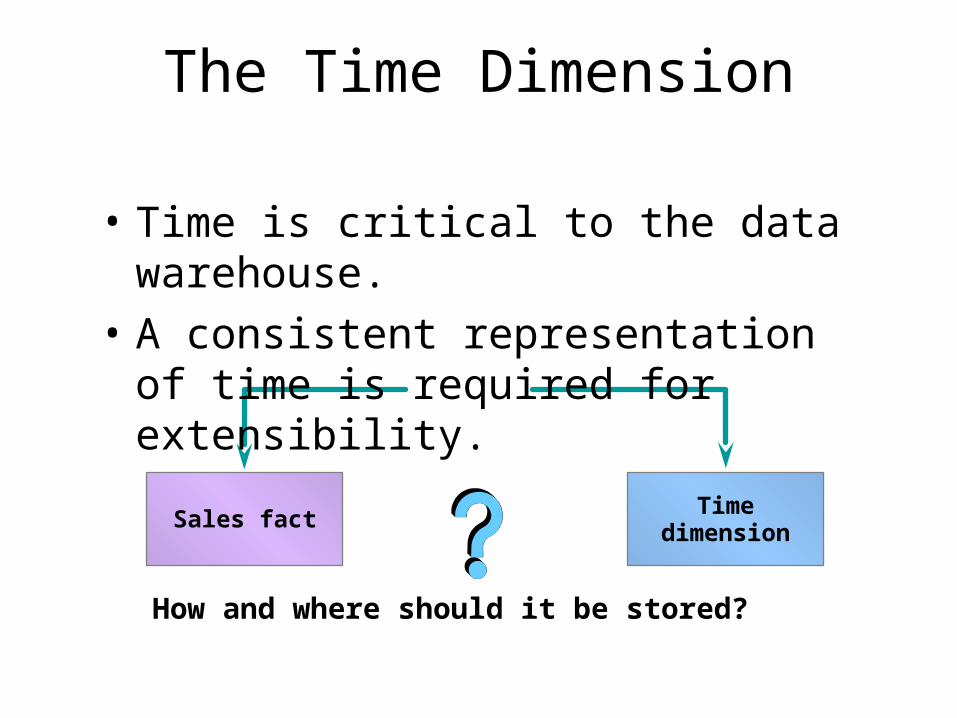
The Time Dimension
How and where should it be stored?
Timedimension
Sales fact
• Time is critical to the data warehouse.
• A consistent representation of time is required for extensibility.


![Insurance IT Strategy and Data Marts 20131016.pptx [Read-Only]€¦ · Insurance Analytics Evolution 5 Insurance IT Strategy and Data Marts November 2013 PwC ... • Execute change](https://img.pdfslide.net/doc/110x75/5f02e48c7e708231d40687eb/insurance-it-strategy-and-data-marts-read-only-insurance-analytics-evolution-5.jpg)