Embed Size (px)
Citation preview
Desktop Support KPIs: Definitions & Correlations
1 | Page © Met r i cNe t , LLC www. met r i cne t . com
Desktop Support KPIs Definitions & Correlations
Learn how each of the Desktop Support metrics
that we benchmark is defined, why it’s important,
and how it correlates with other metrics. We include
metrics from the following seven categories:
➢ Cost
➢ Productivity
➢ Service Level
➢ Quality
➢ Technician
➢ Ticket Handling
➢ Workload
MetricNet Performance Benchmarking
www.metricnet.com
703.992.8160
Desktop Support KPIs: Definitions & Correlations
1 | Page © Met r i cNe t , LLC www. met r i cne t . com
Cost Metrics
Cost per Ticket
Definition: Cost per Ticket is the total annual operating expense of Desktop
Support divided by the annual number of tickets handled by Desktop Support.
Operating expense includes all employee salaries, overtime pay, benefits,
and incentive compensation, plus all contractor, facilities, telecom, desktop
computing, software licensing, training, travel, office supplies, and
miscellaneous expenses.
Why it’s important: Cost per Ticket is one of the most important Desktop
Support metrics. It is a measure of how efficiently your organization conducts
its business. A higher-than-average Cost per Ticket is not necessarily a bad
thing, particularly if accompanied by higher-than-average quality levels.
Conversely, a low Cost per Ticket is not necessarily good, particularly if low
cost is achieved by sacrificing quality or service levels. Every Desktop
Support organization should track and trend Cost per Ticket on a monthly
basis.
Key correlations: Cost per Ticket is strongly correlated with the following
metrics:
Cost per Incident
Cost per Service Request
Technician Utilization
Incident First Visit Resolution Rate
Average Incident Work Time
Average Service Request Work Time
Average Travel Time per Ticket
𝑪𝒐𝒔𝒕 𝒑𝒆𝒓 𝑻𝒊𝒄𝒌𝒆𝒕 =(𝑻𝒐𝒕𝒂𝒍 𝑨𝒏𝒏𝒖𝒂𝒍 𝑶𝒑𝒆𝒓𝒂𝒕𝒊𝒏𝒈 𝑬𝒙𝒑𝒆𝒏𝒔𝒆)
(𝑨𝒏𝒏𝒖𝒂𝒍 𝑻𝒊𝒄𝒌𝒆𝒕 𝑽𝒐𝒍𝒖𝒎𝒆)
Desktop Support KPIs: Definitions & Correlations
2 | Page © Met r i cNe t , LLC www. met r i cne t . com
Cost Metrics (continued)
It is useful to break down Cost per Ticket into the next two metrics: Cost per
Incident and Cost per Service Request.
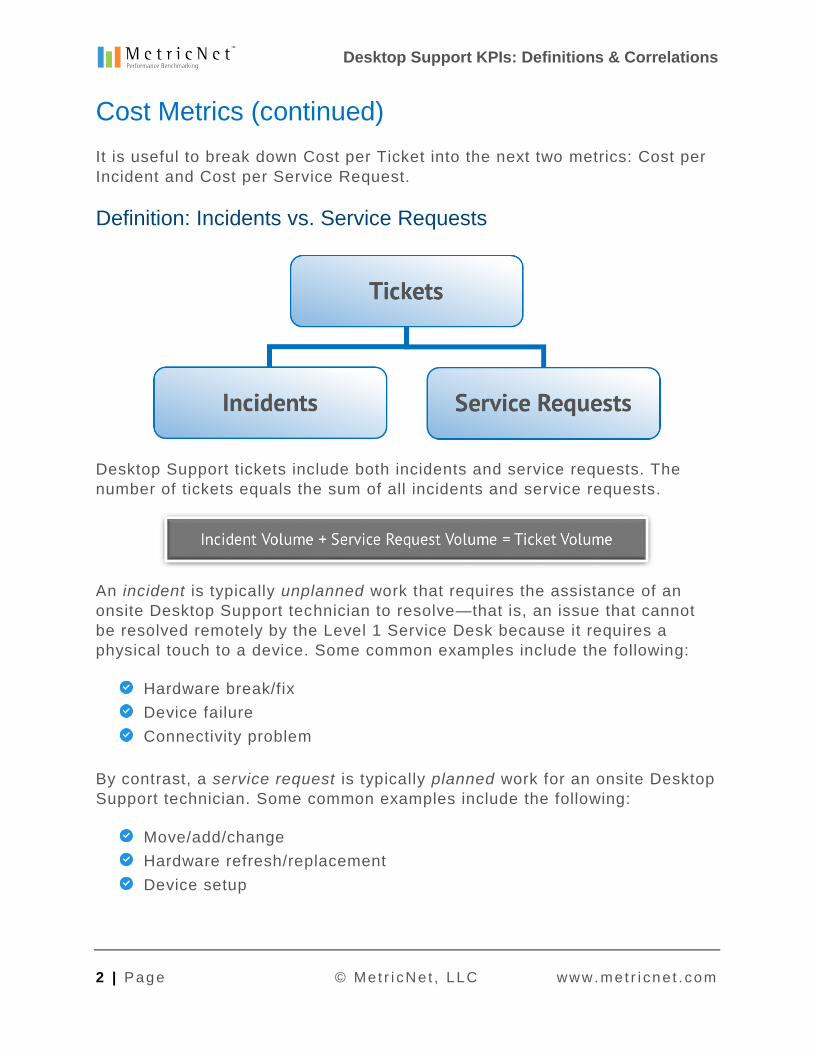
Definition: Incidents vs. Service Requests
Desktop Support tickets include both incidents and service requests. The
number of tickets equals the sum of all incidents and service requests.
An incident is typically unplanned work that requires the assistance of an
onsite Desktop Support technician to resolve—that is, an issue that cannot
be resolved remotely by the Level 1 Service Desk because it requires a
physical touch to a device. Some common examples include the following:
Hardware break/fix
Device failure
Connectivity problem
By contrast, a service request is typically planned work for an onsite Desktop
Support technician. Some common examples include the following:
Move/add/change
Hardware refresh/replacement
Device setup
Service Desk KPIs: Definitions & Correlations
3 | Page © Met r i cNe t , LLC www.met r i cne t .com
Cost Metrics (continued)
Cost per Incident
Definition: Cost per Incident is the total annual operating expense of
Desktop Support, multiplied by the incident workload as a percentage of total
workload, then divided by the annual incident volume. Incident workload
equals the annual incident volume multiplied by Average Incident Work Time
(in other words, the total time spent handling incidents in a year). Likewise,
total workload equals the annual ticket volume multiplied by the average
ticket handle time. Operating expense includes all employee salaries,
overtime pay, benefits, and incentive compensation, plus all contractor,
facilities, telecom, desktop computing, software licensing, training, travel,
office supplies, and miscellaneous expenses.
Why it’s Important: Cost per Incident is one of the most important Desktop
Support metrics. It is one of the key components of Cost per Ticket (the othe r
being Cost per Service Request). A higher-than-average Cost per Incident is
not necessarily a bad thing, particularly if accompanied by higher -than-
average quality levels. Conversely, a low Cost per Incident is not necessarily
good, particularly if low cost is achieved by sacrificing quality or service
levels. Every Desktop Support organization should track and trend Cost per
Incident on a monthly basis.
Key correlations: Cost per Incident is strongly correlated with the following
metrics:
Cost per Ticket
Cost per Service Request
Technician Utilization
Incident First Visit Resolution Rate
Average Incident Work Time
Average Travel Time per Ticket
Incidents as a % of Total Ticket Volume
𝑪𝒐𝒔𝒕 𝒑𝒆𝒓 𝑰𝒏𝒄𝒊𝒅𝒆𝒏𝒕 = 𝑶𝒑𝒆𝒓𝒂𝒕𝒊𝒏𝒈 𝑬𝒙𝒑𝒆𝒏𝒔𝒆×𝑰𝒏𝒄𝒊𝒅𝒆𝒏𝒕 𝑾𝒐𝒓𝒌𝒍𝒐𝒂𝒅
𝑻𝒐𝒕𝒂𝒍 𝑾𝒐𝒓𝒌𝒍𝒐𝒂𝒅÷ 𝑰𝒏𝒄𝒊𝒅𝒆𝒏𝒕 𝑽𝒐𝒍𝒖𝒎𝒆
Desktop Support KPIs: Definitions & Correlations
4 | Page © Met r i cNe t , LLC www. met r i cne t . com
Cost Metrics (continued)
Cost per Service Request
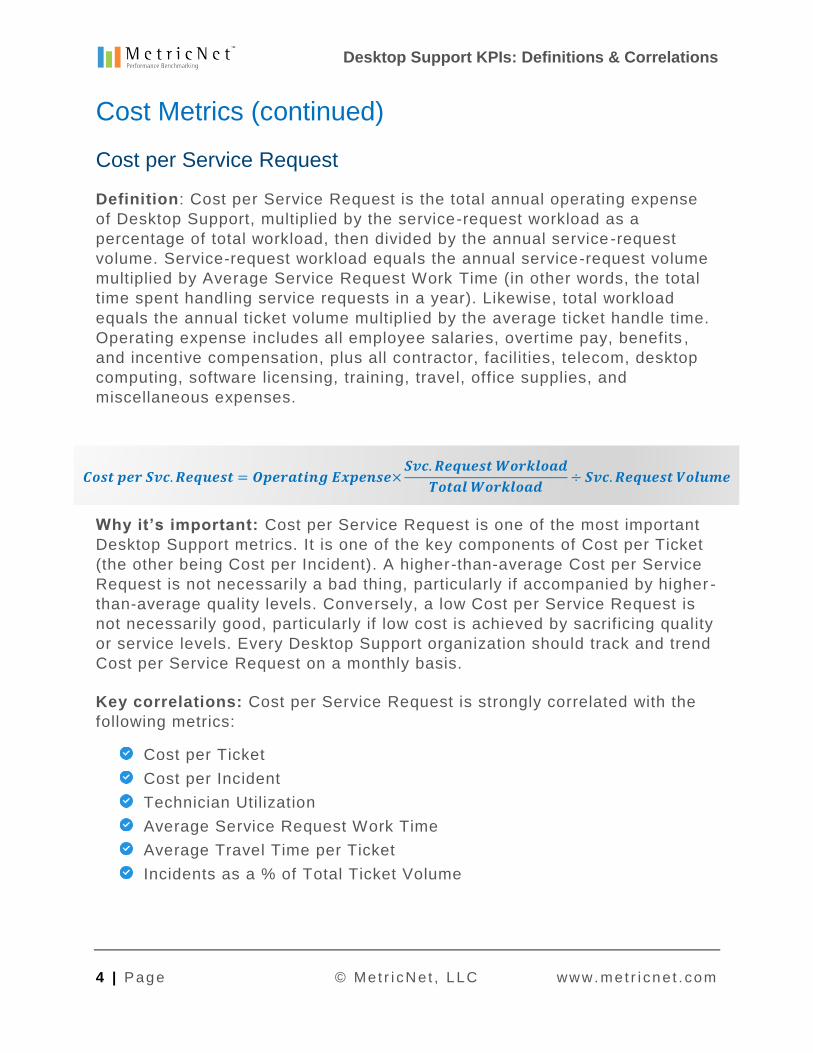
Definition: Cost per Service Request is the total annual operating expense
of Desktop Support, multiplied by the service-request workload as a
percentage of total workload, then divided by the annual service -request
volume. Service-request workload equals the annual service-request volume
multiplied by Average Service Request Work Time (in other words, the total
time spent handling service requests in a year). Likewise, total workload
equals the annual ticket volume multiplied by the average ticket handle time.
Operating expense includes all employee salaries, overtime pay, benefits ,
and incentive compensation, plus all contractor, facilities, telecom, desktop
computing, software licensing, training, travel, office supplies, and
miscellaneous expenses.
Why it’s important: Cost per Service Request is one of the most important
Desktop Support metrics. It is one of the key components of Cost per Ticket
(the other being Cost per Incident). A higher-than-average Cost per Service
Request is not necessarily a bad thing, particularly if accompanied by higher -
than-average quality levels. Conversely, a low Cost per Service Request is
not necessarily good, particularly if low cost is achieved by sacrificing quality
or service levels. Every Desktop Support organization should track and trend
Cost per Service Request on a monthly basis.
Key correlations: Cost per Service Request is strongly correlated with the
following metrics:
Cost per Ticket
Cost per Incident
Technician Utilization
Average Service Request Work Time
Average Travel Time per Ticket
Incidents as a % of Total Ticket Volume
𝑪𝒐𝒔𝒕 𝒑𝒆𝒓 𝑺𝒗𝒄. 𝑹𝒆𝒒𝒖𝒆𝒔𝒕 = 𝑶𝒑𝒆𝒓𝒂𝒕𝒊𝒏𝒈 𝑬𝒙𝒑𝒆𝒏𝒔𝒆×𝑺𝒗𝒄. 𝑹𝒆𝒒𝒖𝒆𝒔𝒕 𝑾𝒐𝒓𝒌𝒍𝒐𝒂𝒅
𝑻𝒐𝒕𝒂𝒍 𝑾𝒐𝒓𝒌𝒍𝒐𝒂𝒅÷ 𝑺𝒗𝒄. 𝑹𝒆𝒒𝒖𝒆𝒔𝒕 𝑽𝒐𝒍𝒖𝒎𝒆
Desktop Support KPIs: Definitions & Correlations
5 | Page © Met r i cNe t , LLC www. met r i cne t . com
Productivity Metrics
Technician Utilization
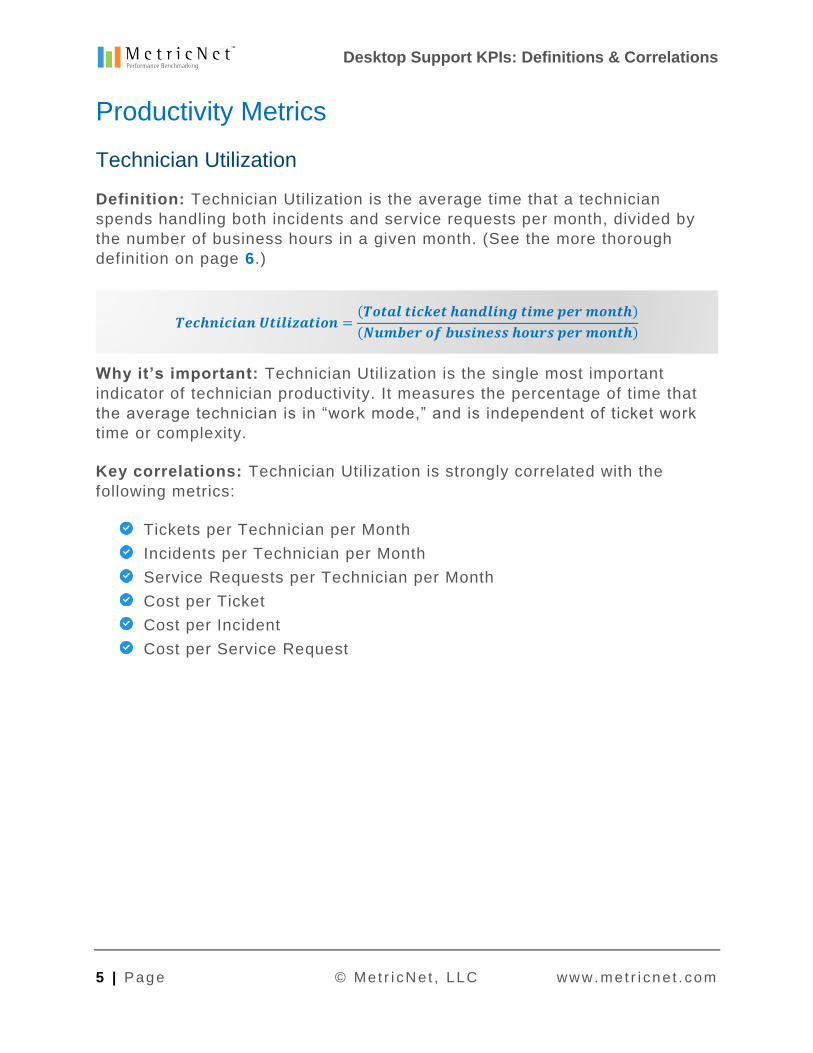
Definition: Technician Utilization is the average time that a technician
spends handling both incidents and service requests per month, divided by
the number of business hours in a given month. (See the more thorough
definition on page 6.)
Why it’s important: Technician Utilization is the single most important
indicator of technician productivity. It measures the percentage of time that
the average technician is in “work mode,” and is independent of ticket work
time or complexity.
Key correlations: Technician Utilization is strongly correlated with the
following metrics:
Tickets per Technician per Month
Incidents per Technician per Month
Service Requests per Technician per Month
Cost per Ticket
Cost per Incident
Cost per Service Request
𝑻𝒆𝒄𝒉𝒏𝒊𝒄𝒊𝒂𝒏 𝑼𝒕𝒊𝒍𝒊𝒛𝒂𝒕𝒊𝒐𝒏 =(𝑻𝒐𝒕𝒂𝒍 𝒕𝒊𝒄𝒌𝒆𝒕 𝒉𝒂𝒏𝒅𝒍𝒊𝒏𝒈 𝒕𝒊𝒎𝒆 𝒑𝒆𝒓 𝒎𝒐𝒏𝒕𝒉)
(𝑵𝒖𝒎𝒃𝒆𝒓 𝒐𝒇 𝒃𝒖𝒔𝒊𝒏𝒆𝒔𝒔 𝒉𝒐𝒖𝒓𝒔 𝒑𝒆𝒓 𝒎𝒐𝒏𝒕𝒉)
Desktop Support KPIs: Definitions & Correlations
6 | Page © Met r i cNe t , LLC www. met r i cne t . com
Technician Utilization Defined
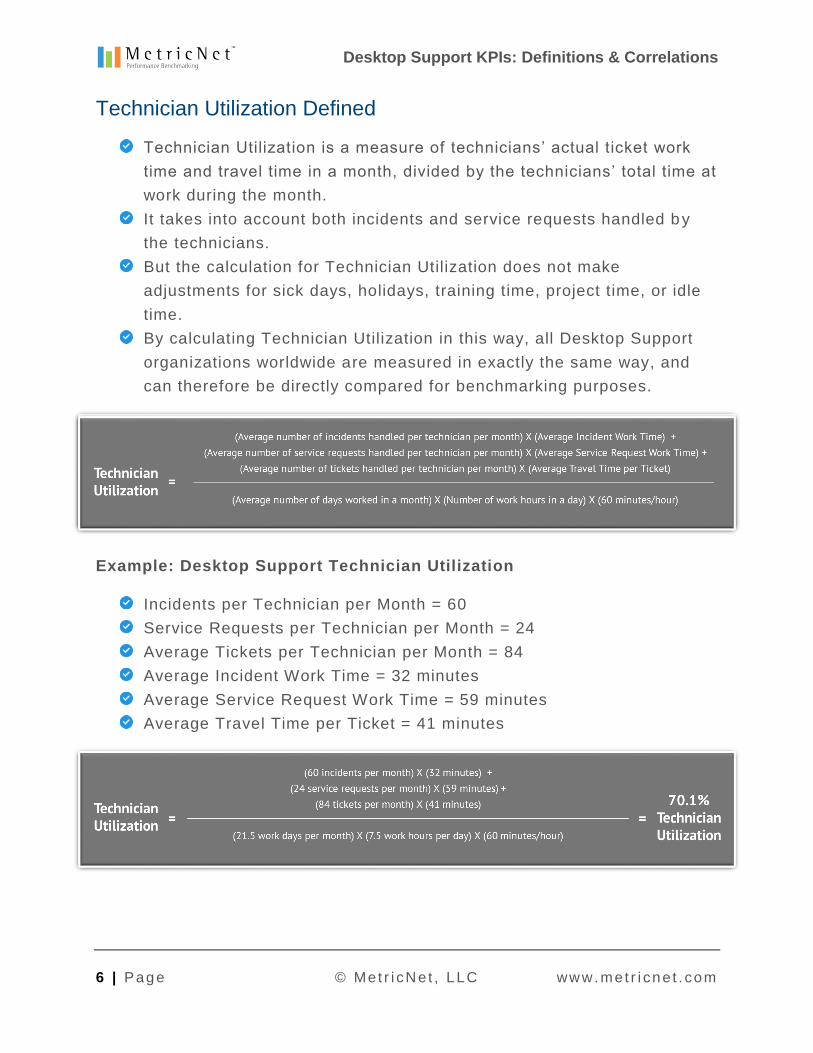
Technician Utilization is a measure of technicians’ actual ticket work
time and travel time in a month, divided by the technicians’ total time at
work during the month.
It takes into account both incidents and service requests handled by
the technicians.
But the calculation for Technician Utilization does not make
adjustments for sick days, holidays, training time, project time, or idle
time.
By calculating Technician Utilization in this way, all Desktop Support
organizations worldwide are measured in exactly the same way, and
can therefore be directly compared for benchmarking purposes.
Example: Desktop Support Technician Utilization
Incidents per Technician per Month = 60
Service Requests per Technician per Month = 24
Average Tickets per Technician per Month = 84
Average Incident Work Time = 32 minutes
Average Service Request Work Time = 59 minutes
Average Travel Time per Ticket = 41 minutes
Service Desk KPIs: Definitions & Correlations
7 | Page © Met r i cNe t , LLC www.met r i cne t .com
Productivity Metrics (continued)
Tickets per Technician per Month
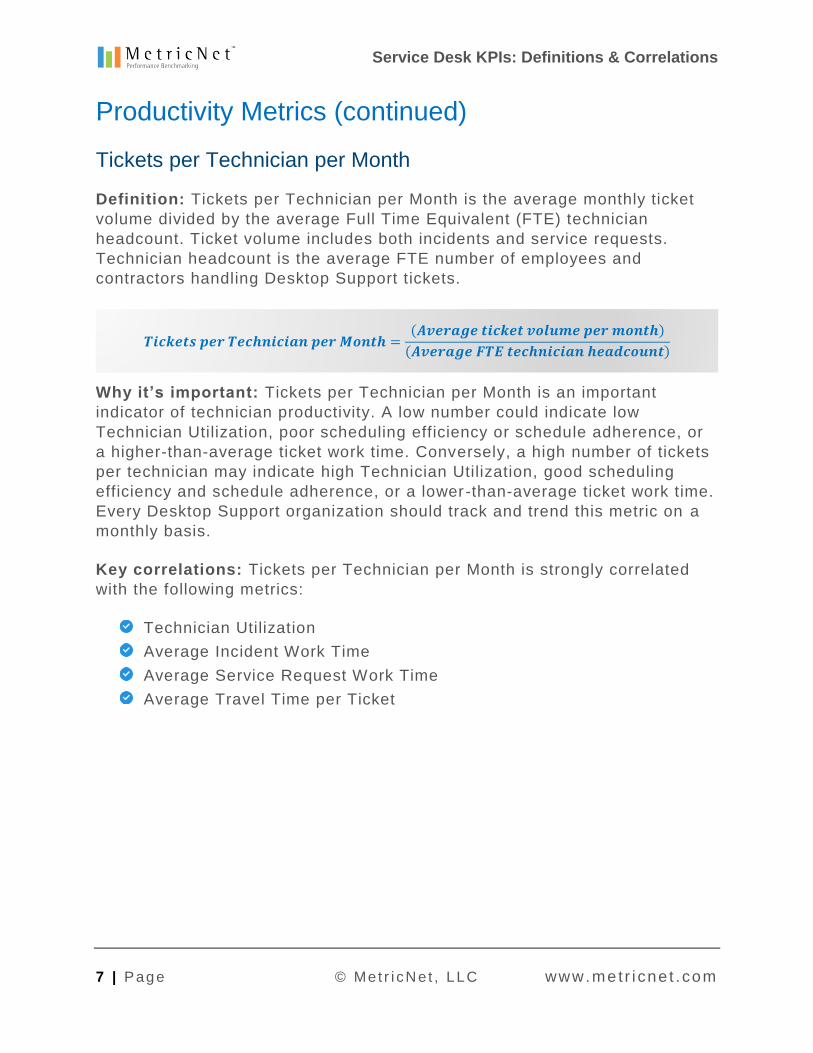
Definition: Tickets per Technician per Month is the average monthly ticket
volume divided by the average Full Time Equivalent (FTE) technician
headcount. Ticket volume includes both incidents and service requests.
Technician headcount is the average FTE number of employees and
contractors handling Desktop Support tickets.
Why it’s important: Tickets per Technician per Month is an important
indicator of technician productivity. A low number could indicate low
Technician Utilization, poor scheduling efficiency or schedule adherence, or
a higher-than-average ticket work time. Conversely, a high number of tickets
per technician may indicate high Technician Utilization, good scheduling
efficiency and schedule adherence, or a lower-than-average ticket work time.
Every Desktop Support organization should track and trend this metric on a
monthly basis.
Key correlations: Tickets per Technician per Month is strongly correlated
with the following metrics:
Technician Utilization
Average Incident Work Time
Average Service Request Work Time
Average Travel Time per Ticket
𝑻𝒊𝒄𝒌𝒆𝒕𝒔 𝒑𝒆𝒓 𝑻𝒆𝒄𝒉𝒏𝒊𝒄𝒊𝒂𝒏 𝒑𝒆𝒓 𝑴𝒐𝒏𝒕𝒉 =(𝑨𝒗𝒆𝒓𝒂𝒈𝒆 𝒕𝒊𝒄𝒌𝒆𝒕 𝒗𝒐𝒍𝒖𝒎𝒆 𝒑𝒆𝒓 𝒎𝒐𝒏𝒕𝒉)
(𝑨𝒗𝒆𝒓𝒂𝒈𝒆 𝑭𝑻𝑬 𝒕𝒆𝒄𝒉𝒏𝒊𝒄𝒊𝒂𝒏 𝒉𝒆𝒂𝒅𝒄𝒐𝒖𝒏𝒕)
Desktop Support KPIs: Definitions & Correlations
8 | Page © Met r i cNe t , LLC www. met r i cne t . com
Productivity Metrics (continued)
Incidents per Technician per Month
Definition: Incidents per Technician per Month is the average monthly
incident volume divided by the average Full Time Equivalent (FTE) technician
headcount. Technician headcount is the average FTE number of employees
and contractors handling Desktop Support tickets.
Why it’s important: Incidents per Technician per Month is an important
indicator of technician productivity. A low number could indicate low
Technician Utilization, poor scheduling efficiency or schedule adherence, or
a higher-than-average incident work time. Conversely, a high number of
incidents per technician may indicate high Technician Utilization, good
scheduling efficiency and schedule adherence, or a lower -than-average
incident work time. Every Desktop Support organization should track and
trend this metric on a monthly basis.
Key correlations: Incidents per Technician per Month is strongly correlated
with the following metrics:
Technician Utilization
Average Incident Work Time
Average Travel Time per Ticket
Incidents as a % of Total Ticket Volume
𝑰𝒏𝒄𝒊𝒅𝒆𝒏𝒕𝒔 𝒑𝒆𝒓 𝑻𝒆𝒄𝒉𝒏𝒊𝒄𝒊𝒂𝒏 𝒑𝒆𝒓 𝑴𝒐𝒏𝒕𝒉 =(𝑨𝒗𝒆𝒓𝒂𝒈𝒆 𝒊𝒏𝒄𝒊𝒅𝒆𝒏𝒕 𝒗𝒐𝒍𝒖𝒎𝒆 𝒑𝒆𝒓 𝒎𝒐𝒏𝒕𝒉)
(𝑨𝒗𝒆𝒓𝒂𝒈𝒆 𝑭𝑻𝑬 𝒕𝒆𝒄𝒉𝒏𝒊𝒄𝒊𝒂𝒏 𝒉𝒆𝒂𝒅𝒄𝒐𝒖𝒏𝒕)
Desktop Support KPIs: Definitions & Correlations
9 | Page © Met r i cNe t , LLC www. met r i cne t . com
Productivity Metrics (continued)
Service Requests per Technician per Month
Definition: Service Requests per Technician per Month is the average
monthly service request volume divided by the average Full Time Equivalent
(FTE) technician headcount. Technician headcount is the average FTE
number of employees and contractors handling Desktop Support tickets.
Why it’s important: Service Requests per Technician per Month is an
important indicator of technician productivity. A low number could indicate
low Technician Utilization, poor scheduling efficiency or schedule adherence,
or a higher-than-average service request work time. Conversely, a high
number of service requests per technician may indicate high Technician
Utilization, good scheduling efficiency and schedule adherence, or a lower -
than-average service request work time. Every Desktop Support organization
should track and trend this metric on a monthly basis.
Key correlations: Service Requests per Technician per Month is strongly
correlated with the following metrics:
Technician Utilization
Average Service Request Work Time
Average Travel Time per Ticket
Incidents as a % of Total Ticket Volume
𝑺𝒆𝒓𝒗𝒊𝒄𝒆 𝑹𝒆𝒒𝒖𝒆𝒔𝒕𝒔 𝒑𝒆𝒓 𝑻𝒆𝒄𝒉𝒏𝒊𝒄𝒊𝒂𝒏 𝒑𝒆𝒓 𝑴𝒐𝒏𝒕𝒉 =(𝑨𝒗𝒈. 𝒔𝒆𝒓𝒗𝒊𝒄𝒆 𝒓𝒆𝒒𝒖𝒆𝒔𝒕 𝒗𝒐𝒍𝒖𝒎𝒆/𝒎𝒐𝒏𝒕𝒉)
(𝑨𝒗𝒈. 𝑭𝑻𝑬 𝒕𝒆𝒄𝒉𝒏𝒊𝒄𝒊𝒂𝒏 𝒉𝒆𝒂𝒅𝒄𝒐𝒖𝒏𝒕)
Desktop Support KPIs: Definitions & Correlations
1 0 | Page © Met r i cNe t , LLC www. met r i cne t . com
Productivity Metrics (continued)
Technicians as a % of Total Headcount
Definition: This metric is the average Full Time Equivalent (FTE) technician
headcount divided by the average total Desktop Support headcount. It is
expressed as a percentage, and represents the percentage of total Desktop
Support personnel who are engaged in direct customer-support activities.
Headcount includes both employees and contractors.
Why it’s important: The technician headcount as a percentage of total
Desktop Support headcount is an important measure of management and
overhead efficiency. Since non-technicians include both management and
non-management personnel (such as supervisors and team leads, QA/QC,
trainers, etc.), this metric is not a pure measure of management span of
control. But it is a more useful metric than management span of control
because the denominator of this ratio takes into account all personnel that
are not directly engaged in customer-support activities.
Key correlations: Technicians as a % of Total Headcount is strongly
correlated with the following metrics:
Cost per Ticket
Cost per Incident
Cost per Service Request
𝑻𝒆𝒄𝒉𝒏𝒊𝒄𝒊𝒂𝒏𝒔 𝒂𝒔 𝒂 % 𝒐𝒇 𝑻𝒐𝒕𝒂𝒍 𝑯𝒆𝒂𝒅𝒄𝒐𝒖𝒏𝒕 =(𝑨𝒗𝒈. 𝑭𝑻𝑬 𝒕𝒆𝒄𝒉𝒏𝒊𝒄𝒊𝒂𝒏 𝒉𝒆𝒂𝒅𝒄𝒐𝒖𝒏𝒕)
(𝑨𝒗𝒈. 𝒕𝒐𝒕𝒂𝒍 𝑫𝒆𝒔𝒌𝒕𝒐𝒑 𝑺𝒖𝒑𝒑𝒐𝒓𝒕 𝒉𝒆𝒂𝒅𝒄𝒐𝒖𝒏𝒕)
Desktop Support KPIs: Definitions & Correlations
1 1 | Page © Met r i cNe t , LLC www. met r i cne t . com
Service Level Metrics
Mean Time to Resolve Incidents
Definition: Mean Time to Resolve Incidents is the average number of
business hours that elapse from the time an incident is reported until the
time the incident is closed. Non-business hours are excluded from the
calculation. For example, if an incident is reported a t 3:00 p.m. on Tuesday,
and the ticket is closed at 3:00 p.m. on Wednesday, the mean time to resolve
(MTTR) will be 8 hours, not 24 hours.
Why it’s important: Service levels, including the MTTR for incidents, are a
key driver of Customer Satisfaction with Desktop Support.
Key correlations: Mean Time to Resolve Incidents is strongly correlated
with the following metrics:
Customer Satisfaction
Average Incident Work Time
Average Travel Time per Ticket
% of Incidents Resolved in 8 Business Hours
𝑴𝒆𝒂𝒏 𝑻𝒊𝒎𝒆 𝒕𝒐 𝑹𝒆𝒔𝒐𝒍𝒗𝒆 𝑰𝒏𝒄𝒊𝒅𝒆𝒏𝒕𝒔 = 𝑨𝒗𝒆𝒓𝒂𝒈𝒆 𝒏𝒖𝒎𝒃𝒆𝒓 𝒐𝒇 𝒃𝒖𝒔𝒊𝒏𝒆𝒔𝒔 𝒉𝒐𝒖𝒓𝒔
𝒃𝒆𝒕𝒘𝒆𝒆𝒏 𝒕𝒉𝒆 𝒕𝒊𝒎𝒆 𝒂𝒏 𝒊𝒏𝒄𝒊𝒅𝒆𝒏𝒕 𝒊𝒔 𝒓𝒆𝒑𝒐𝒓𝒕𝒆𝒅 𝒂𝒏𝒅 𝒕𝒉𝒆 𝒕𝒊𝒎𝒆 𝒊𝒕 𝒊𝒔 𝒄𝒍𝒐𝒔𝒆𝒅
Desktop Support KPIs: Definitions & Correlations
1 2 | Page © Met r i cNe t , LLC www. met r i cne t . com
Service Level Metrics (continued)
% of Incidents Resolved in 8 Business Hours
Definition: The % of Incidents Resolved in 8 Business Hours is fairly self -
explanatory. For example, an incident that is reported at 1:00 p.m. on Friday
will be resolved in 8 business hours if the ticket is closed by 1:00 p.m. on the
following Monday.
Why it’s important: Service levels, including the % of Incidents Resolved in
8 Business Hours, are a key driver of Customer Satisfaction with Desktop
Support.
Key correlations: % of Incidents Resolved in 8 Business Hours is strongly
correlated with the following metrics:
Customer Satisfaction
Average Incident Work Time
Average Travel Time per Ticket
Mean Time to Resolve Incidents
% 𝒐𝒇 𝑰𝒏𝒄𝒊𝒅𝒆𝒏𝒕𝒔 𝑹𝒆𝒔𝒐𝒍𝒗𝒆𝒅 𝒊𝒏 𝟖 𝑩𝒖𝒔𝒊𝒏𝒆𝒔𝒔 𝑯𝒐𝒖𝒓𝒔 = 𝑻𝒉𝒆 𝒑𝒆𝒓𝒄𝒆𝒏𝒕𝒂𝒈𝒆 𝒐𝒇 𝒊𝒏𝒄𝒊𝒅𝒆𝒏𝒕𝒔
𝒕𝒉𝒂𝒕 𝒂𝒓𝒆 𝒄𝒍𝒐𝒔𝒆𝒅 𝒘𝒊𝒕𝒉𝒊𝒏 𝟖 𝒃𝒖𝒔𝒊𝒏𝒆𝒔𝒔 𝒉𝒐𝒖𝒓𝒔 𝒐𝒇 𝒃𝒆𝒊𝒏𝒈 𝒓𝒆𝒑𝒐𝒓𝒕𝒆𝒅.
Desktop Support KPIs: Definitions & Correlations
1 3 | Page © Met r i cNe t , LLC www. met r i cne t . com
Service Level Metrics (continued)
Mean Time to Fulfill Service Requests
Definition: Mean Time to Fulfill Service Requests is the average number of
business days that elapse from the time a service request is logged until the
time the service request is completed. Non-business days are excluded from
the calculation. For example, if a service request is logged at 3:00 p.m. on
Friday, and the ticket is closed at 3:00 pm on the following Tuesday, the
mean time to fulfill (MTTF) will be 2 days, not 4 days.
Why it’s important: Service levels, including the MTTF for service requests,
are a key driver of Customer Satisfaction with Desktop Support.
Key correlations: Mean Time to Fulfill Service Requests is strongly
correlated with the following metrics:
Customer Satisfaction
Average Service Request Work Time
Average Travel Time per Ticket
% of Service Requests Resolved in 24 Business Hours
𝑴𝒆𝒂𝒏 𝑻𝒊𝒎𝒆 𝒕𝒐 𝑭𝒖𝒍𝒇𝒊𝒍𝒍 𝑺𝒆𝒓𝒗𝒊𝒄𝒆 𝑹𝒆𝒒𝒖𝒆𝒔𝒕𝒔 = 𝑨𝒗𝒆𝒓𝒂𝒈𝒆 𝒏𝒖𝒎𝒃𝒆𝒓 𝒐𝒇 𝒃𝒖𝒔𝒊𝒏𝒆𝒔𝒔 𝒅𝒂𝒚𝒔
𝒃𝒆𝒕𝒘𝒆𝒆𝒏 𝒕𝒉𝒆 𝒕𝒊𝒎𝒆 𝒂 𝒔𝒆𝒓𝒗𝒊𝒄𝒆 𝒓𝒆𝒒𝒖𝒆𝒔𝒕 𝒊𝒔 𝒍𝒐𝒈𝒈𝒆𝒅 𝒂𝒏𝒅 𝒕𝒉𝒆 𝒕𝒊𝒎𝒆 𝒊𝒕 𝒊𝒔 𝒄𝒐𝒎𝒑𝒍𝒆𝒕𝒆𝒅.
Desktop Support KPIs: Definitions & Correlations
1 4 | Page © Met r i cNe t , LLC www. met r i cne t . com
Service Level Metrics (continued)
% of Service Requests Fulfilled in 24 Business Hours
Definition: The % of Service Requests Fulfilled in 24 Business Hours is
fairly self-explanatory. For example, a service request that is logged at 1:00
p.m. on Friday will be fulfilled in 24 business hours if the ticket is closed by
1:00 p.m. on the following Wednesday.
Why it’s important: Service levels, including the % of Service Requests
Fulfilled in 24 Business Hours, are a key driver of Customer Satisfaction with
Desktop Support.
Key correlations: % of Service Requests Fulfilled in 24 Business Hours is
strongly correlated with the following metrics:
Customer Satisfaction
Average Service Request Work Time
Average Travel Time per Ticket
Mean Time to Fulfill Service Requests
% 𝒐𝒇 𝑺𝒆𝒓𝒗𝒊𝒄𝒆 𝑹𝒆𝒒𝒖𝒆𝒔𝒕𝒔 𝑭𝒖𝒍𝒇𝒊𝒍𝒍𝒆𝒅 𝒊𝒏 𝟐𝟒 𝑩𝒖𝒔𝒊𝒏𝒆𝒔𝒔 𝑯𝒐𝒖𝒓𝒔 = 𝑻𝒉𝒆 𝒑𝒆𝒓𝒄𝒆𝒏𝒕𝒂𝒈𝒆 𝒐𝒇
𝒔𝒆𝒓𝒗𝒊𝒄𝒆 𝒓𝒆𝒒𝒖𝒆𝒔𝒕𝒔 𝒕𝒉𝒂𝒕 𝒂𝒓𝒆 𝒄𝒍𝒐𝒔𝒆𝒅 𝒘𝒊𝒕𝒉𝒊𝒏 𝟐𝟒 𝒃𝒖𝒔𝒊𝒏𝒆𝒔𝒔 𝒉𝒐𝒖𝒓𝒔 𝒐𝒇 𝒃𝒆𝒊𝒏𝒈 𝒍𝒐𝒈𝒈𝒆𝒅.
Desktop Support KPIs: Definitions & Correlations
1 5 | Page © Met r i cNe t , LLC www. met r i cne t . com
Quality Metrics
Customer Satisfaction
Definition: Customer Satisfaction is the percentage of customers who are
either satisfied or very satisfied with their Desktop Support experience. This
metric can be captured in a numbers of ways, including follow-up calls, email
surveys that are automatically sent out by the trouble ticket system, postal
surveys, etc.
Why it’s important: Customer Satisfaction is the single most important
measure of Desktop Support quality. Any successful Desktop Support
organization will have consistently high Customer Satisfaction ratings. Some
Desktop Support managers are under the impression that a low Cost per
Ticket may justify a lower level of Customer Satisfaction. But this is not true.
MetricNet’s research shows that even Desktop Support organizations with a
very low Cost per Ticket can achieve consistently high Customer Satisfaction
ratings.
Key correlations: Customer Satisfaction is strongly correlated with the
following metrics:
Incident First Visit Resolution Rate
Mean Time to Resolve Incidents
Mean Time to Fulfill Service Requests
𝑪𝒖𝒔𝒕𝒐𝒎𝒆𝒓 𝑺𝒂𝒕𝒊𝒔𝒇𝒂𝒄𝒕𝒊𝒐𝒏 =(𝑵𝒖𝒎𝒃𝒆𝒓 𝒐𝒇 𝒔𝒂𝒕𝒊𝒔𝒇𝒊𝒆𝒅 𝒐𝒓 𝒗𝒆𝒓𝒚 𝒔𝒂𝒕𝒊𝒔𝒇𝒊𝒆𝒅 𝒄𝒖𝒔𝒕𝒐𝒎𝒆𝒓𝒔)
(𝑵𝒖𝒎𝒃𝒆𝒓 𝒐𝒇 𝒄𝒖𝒔𝒕𝒐𝒎𝒆𝒓𝒔 𝒔𝒖𝒓𝒗𝒆𝒚𝒆𝒅)
Desktop Support KPIs: Definitions & Correlations
1 6 | Page © Met r i cNe t , LLC www. met r i cne t . com
Quality Metrics (continued)
Incident First Visit Resolution Rate
Definition: Incident First Visit Resolution Rate is the percentage of incidents
that are resolved on the first visit to the customer. Incidents that require a
second visit, or are otherwise unresolved on the first v isit for any reason, do
not qualify for Incident First Visit Resolution.
Why it’s important: Incident First Visit Resolution Rate is one of the biggest
drivers of Customer Satisfaction. A high Incident First Visit Resolution Rate
is almost always associated with high levels of Customer Satisfaction.
Desktop Support groups that emphasize training (i.e., high training hours for
new and veteran technicians) and have good technology tools generally
enjoy a higher-than-average Incident First Visit Resolution Rate.
Key correlations: Incident First Visit Resolution Rate is strongly correlated
with the following metrics:
Customer Satisfaction
New Technician Training Hours
Annual Technician Training Hours
Average Incident Work Time
𝑰𝒏𝒄𝒊𝒅𝒆𝒏𝒕 𝑭𝒊𝒓𝒔𝒕 𝑽𝒊𝒔𝒊𝒕 𝑹𝒆𝒔𝒐𝒍𝒖𝒕𝒊𝒐𝒏 𝑹𝒂𝒕𝒆 =(𝑰𝒏𝒄𝒊𝒅𝒆𝒏𝒕𝒔 𝒓𝒆𝒔𝒐𝒍𝒗𝒆𝒅 𝒐𝒏 𝒇𝒊𝒓𝒔𝒕 𝒗𝒊𝒔𝒊𝒕)
(𝑻𝒐𝒕𝒂𝒍 𝒊𝒏𝒄𝒊𝒅𝒆𝒏𝒕 𝒗𝒐𝒍𝒖𝒎𝒆)
Desktop Support KPIs: Definitions & Correlations
1 7 | Page © Met r i cNe t , LLC www. met r i cne t . com
Quality Metrics (continued)
% Resolved Level 1 Capable
Definition: % Resolved Level 1 Capable is the percentage of tickets
resolved by Desktop Support that could have been resolved by the Level 1
Service Desk. This metric is generally tracked by sampling tickets after the
fact to determine the percentage that could have been resolved at Level 1, or
by having the Desktop Support technician check a box when closing a ticket,
to indicate that the ticket could have been resolved at Level 1.
Why it’s important: Tickets resolved by Desktop Support that could have
been resolved by the Level 1 Service Desk represent defects. Since the cost
of resolution is typically much higher at Desktop Support than it is for Level 1
support, every ticket that is unnecessarily escalated by Level 1 to Desktop
Support incurs unnecessary costs. To minimize Total Cost of Ownership
(TCO) for end-user support, the % Resolved Level 1 Capable should be as
low as possible.
Key correlations: % Resolved Level 1 Capable is strongly correlated with
the following metrics:
Average Incident Work Time
Tickets per Seat per Month
Incidents per Seat per Month
% 𝑹𝒆𝒔𝒐𝒍𝒗𝒆𝒅 𝑳𝒆𝒗𝒆𝒍 𝟏 𝑪𝒂𝒑𝒂𝒃𝒍𝒆 =(𝑫𝒆𝒔𝒌𝒕𝒐𝒑 𝑺𝒖𝒑𝒑𝒐𝒓𝒕 𝒕𝒊𝒄𝒌𝒆𝒕𝒔 𝑳𝒆𝒗𝒆𝒍 𝟏 𝒄𝒐𝒖𝒍𝒅 𝒉𝒂𝒗𝒆 𝒓𝒆𝒔𝒐𝒍𝒗𝒆𝒅)
(𝑻𝒐𝒕𝒂𝒍 𝑫𝒆𝒔𝒌𝒕𝒐𝒑 𝑺𝒖𝒑𝒑𝒐𝒓𝒕 𝒕𝒊𝒄𝒌𝒆𝒕 𝒗𝒐𝒍𝒖𝒎𝒆)
Desktop Support KPIs: Definitions & Correlations
1 8 | Page © Met r i cNe t , LLC www. met r i cne t . com
Technician Metrics
Annual Technician Turnover
Definition: Annual Technician Turnover is the average percentage of
technicians that leave Desktop Support, for any reason (voluntarily or
involuntarily), in a year.
Why it’s important: Technician turnover is costly. Each time a technician
leaves the organization, a new technician needs to be hired to replace the
outgoing technician. This results in costly recruiting, hiring, and training
expenses. Additionally, it is typically several weeks or even months before a
technician is fully productive, so there is lost productivity associated with
technician turnover as well. High technician turnover is generally associated
with low technician morale in a Desktop Support organization.
Key correlations: Annual Technician Turnover is strongly correlated with the
following metrics:
Daily Technician Absenteeism
Annual Technician Training Hours
Customer Satisfaction
Incident First Visit Resolution Rate
Cost per Ticket
Technician Job Satisfaction
𝑨𝒏𝒏𝒖𝒂𝒍 𝑻𝒆𝒄𝒉𝒏𝒊𝒄𝒊𝒂𝒏 𝑻𝒖𝒓𝒏𝒐𝒗𝒆𝒓 =(𝑨𝒗𝒈. 𝒏𝒖𝒎𝒃𝒆𝒓 𝒐𝒇 𝒕𝒆𝒄𝒉𝒏𝒊𝒄𝒊𝒂𝒏𝒔 𝒕𝒉𝒂𝒕 𝒍𝒆𝒂𝒗𝒆 𝒑𝒆𝒓 𝒚𝒆𝒂𝒓)
(𝑨𝒗𝒈. 𝒕𝒐𝒕𝒂𝒍 𝒕𝒆𝒄𝒉𝒏𝒊𝒄𝒊𝒂𝒏 𝒉𝒆𝒂𝒅𝒄𝒐𝒖𝒏𝒕)
Desktop Support KPIs: Definitions & Correlations
1 9 | Page © Met r i cNe t , LLC www. met r i cne t . com
Technician Metrics (continued)
Daily Technician Absenteeism
Definition: Daily Technician Absenteeism is the average percentage of
technicians with an unexcused absence on any given day. It is calculated by
dividing the average number of unexcused absent technicians per day by the
average total number of technicians per day that are scheduled to be at
work.
Why it’s important: High Technician Absenteeism is problematic because it
makes it difficult for a Desktop Support organization to schedule resources
efficiently. High absenteeism can severely harm Desktop Support’s operating
performance and increase the likelihood that serv ice-level targets will be
missed. Mean Time to Resolve Incidents and Mean Time to Fulfill Service
Requests will typically suffer when absenteeism is high. Also, chronically
high absenteeism is often a sign of low technician morale.
Key correlations: Daily Technician Absenteeism is strongly correlated with
the following metrics:
Annual Technician Turnover
Technician Job Satisfaction
Technician Utilization
Cost per Ticket
Tickets per Technician per Month
𝑫𝒂𝒊𝒍𝒚 𝑻𝒆𝒄𝒉𝒏𝒊𝒄𝒊𝒂𝒏 𝑨𝒃𝒔𝒆𝒏𝒕𝒆𝒆𝒊𝒔𝒎 =(𝑨𝒗𝒈. 𝒖𝒏𝒆𝒙𝒄𝒖𝒔𝒆𝒅 𝒂𝒃𝒔𝒆𝒏𝒕 𝒕𝒆𝒄𝒉𝒏𝒊𝒄𝒊𝒂𝒏𝒔 𝒑𝒆𝒓 𝒅𝒂𝒚)
(𝑨𝒗𝒈. 𝒕𝒆𝒄𝒉𝒏𝒊𝒄𝒊𝒂𝒏𝒔 𝒔𝒄𝒉𝒆𝒅𝒖𝒍𝒆𝒅 𝒕𝒐 𝒘𝒐𝒓𝒌 𝒑𝒆𝒓 𝒅𝒂𝒚)
Desktop Support KPIs: Definitions & Correlations
2 0 | Page © Met r i cNe t , LLC www. met r i cne t . com
Technician Metrics (continued)
New Technician Training Hours
Definition: The name of this metric is somewhat self -explanatory. New
Technician Training Hours is the number of training hours (inc luding
classroom, computer-based training, self-study, shadowing, being coached,
and on-the-job training) that a new technician receives before he or she is
allowed to handle Desktop Support tickets independently.
Why it’s important: New Technician Training Hours are strongly correlated
with Customer Satisfaction and Incident First Visit Resolution Rate,
especially during a technician’s first few months on the job. The more
training that new technicians receive, the higher that Customer Satisfaction
and Incident First Visit Resolution will typically be. This, in turn, has a
positive effect on other performance metrics. Perhaps most importantly,
training levels strongly impact technician morale—technicians who receive
more training typically have higher leve ls of job satisfaction.
Key correlations: New Technician Training Hours are strongly correlated
with the following metrics:
Incident First Visit Resolution Rate
Customer Satisfaction
Average Incident Work Time
Average Service Request Work Time
Technician Job Satisfaction
𝑵𝒆𝒘 𝑻𝒆𝒄𝒉𝒏𝒊𝒄𝒊𝒂𝒏 𝑻𝒓𝒂𝒊𝒏𝒊𝒏𝒈 𝑯𝒐𝒖𝒓𝒔 = 𝑨𝒗𝒆𝒓𝒂𝒈𝒆 𝒏𝒖𝒎𝒃𝒆𝒓 𝒐𝒇 𝒕𝒓𝒂𝒊𝒏𝒊𝒏𝒈 𝒉𝒐𝒖𝒓𝒔
𝒓𝒆𝒒𝒖𝒊𝒓𝒆𝒅 𝒃𝒆𝒇𝒐𝒓𝒆 𝒂 𝒏𝒆𝒘 𝒕𝒆𝒄𝒉𝒏𝒊𝒄𝒊𝒂𝒏 𝒎𝒂𝒚 𝒉𝒂𝒏𝒅𝒍𝒆 𝒕𝒊𝒄𝒌𝒆𝒕𝒔 𝒊𝒏𝒅𝒆𝒑𝒆𝒏𝒅𝒆𝒏𝒕𝒍𝒚
Desktop Support KPIs: Definitions & Correlations
2 1 | Page © Met r i cNe t , LLC www. met r i cne t . com
Technician Metrics (continued)
Annual Technician Training Hours
Definition: Annual Technician Training Hours is the average number of
training hours (including classroom, computer-based training, self-study,
shadowing, etc.) that a technician receives on an annual basis. This number
includes any training hours that a technician receives that are not part of the
technician’s initial (new-technician) training. But it does not include routine
team meetings, shift handoffs, or other activities that do not involve formal
training.
Why it’s important: Annual Technician Training Hours are strongly
correlated with Incident First Visit Resolution Rate and Customer
Satisfaction. Perhaps most importantly, training levels strongly impact
technician morale—technicians who receive more training typically have
higher levels of job satisfaction.
Key correlations: Annual Technician Training Hours are strongly correlated
with the following metrics:
Incident First Visit Resolution Rate
Customer Satisfaction
Average Incident Work Time
Average Service Request Work Time
Technician Job Satisfaction
𝑨𝒏𝒏𝒖𝒂𝒍 𝑻𝒆𝒄𝒉𝒏𝒊𝒄𝒊𝒂𝒏 𝑻𝒓𝒂𝒊𝒏𝒊𝒏𝒈 𝑯𝒐𝒖𝒓𝒔 = 𝑨𝒗𝒆𝒓𝒂𝒈𝒆 𝒏𝒖𝒎𝒃𝒆𝒓 𝒐𝒇 𝒇𝒐𝒓𝒎𝒂𝒍 𝒕𝒓𝒂𝒊𝒏𝒊𝒏𝒈
𝒉𝒐𝒖𝒓𝒔 𝒑𝒆𝒓 𝒕𝒆𝒄𝒉𝒏𝒊𝒄𝒊𝒂𝒏 𝒑𝒆𝒓 𝒚𝒆𝒂𝒓, 𝒆𝒙𝒄𝒍𝒖𝒅𝒊𝒏𝒈 𝒏𝒆𝒘– 𝒕𝒆𝒄𝒉𝒏𝒊𝒄𝒊𝒂𝒏 𝒕𝒓𝒂𝒊𝒏𝒊𝒏𝒈
Desktop Support KPIs: Definitions & Correlations
2 2 | Page © Met r i cNe t , LLC www. met r i cne t . com
Technician Metrics (continued)
Technician Tenure
Definition: Technician Tenure is the average number of months that each
technician has worked in a particular Desktop Support organization.
Why it’s important: Technician Tenure is a measure of technician
experience. Almost every metric related to Desktop Support cost and quality
is impacted by the level of experience the technicians have.
Key correlations: Technician Tenure is strongly correlated with the following
metrics:
Cost per Ticket
Customer Satisfaction
Incident First Visit Resolution Rate
Annual Technician Turnover
Technician Training Hours
Technician Coaching Hours
Average Incident Work Time
Average Service Request Work Time
Technician Job Satisfaction
𝑻𝒆𝒄𝒉𝒏𝒊𝒄𝒊𝒂𝒏 𝑻𝒆𝒏𝒖𝒓𝒆 = 𝑨𝒗𝒆𝒓𝒂𝒈𝒆 𝒏𝒖𝒎𝒃𝒆𝒓 𝒐𝒇 𝒎𝒐𝒏𝒕𝒉𝒔 𝒕𝒉𝒂𝒕 𝒆𝒂𝒄𝒉
𝒕𝒆𝒄𝒉𝒏𝒊𝒄𝒊𝒂𝒏 𝒉𝒂𝒔 𝒘𝒐𝒓𝒌𝒆𝒅 𝒊𝒏 𝒚𝒐𝒖𝒓 𝑫𝒆𝒔𝒌𝒕𝒐𝒑 𝑺𝒖𝒑𝒑𝒐𝒓𝒕 𝒐𝒓𝒈𝒂𝒏𝒊𝒛𝒂𝒕𝒊𝒐𝒏
Desktop Support KPIs: Definitions & Correlations
2 3 | Page © Met r i cNe t , LLC www. met r i cne t . com
Technician Metrics (continued)
Technician Job Satisfaction
Definition: Technician Job Satisfaction is the percentage of technicians in a
Desktop Support organization who are either satisfied or very satisfied with
their jobs.
Why it’s important: Technician Job Satisfaction is a proxy for technician
morale. And morale, while difficult to measure, affects performance on
almost every metric in Desktop Support. High-performance Desktop Support
organizations almost always have high levels of Technician Job Satisfaction.
A Desktop Support organization can control and improve its performance on
this metric through training, coaching, and career pathing.
Key correlations: Technician Job Satisfaction is strongly correlated with the
following metrics:
Annual Technician Turnover
Daily Technician Absenteeism
Technician Training Hours
Technician Coaching Hours
Customer Satisfaction
Incident First Visit Resolution Rate
Average Incident Work Time
Average Service Request Work Time
Cost per Ticket
𝑻𝒆𝒄𝒉𝒏𝒊𝒄𝒊𝒂𝒏 𝑱𝒐𝒃 𝑺𝒂𝒕𝒊𝒔𝒇𝒂𝒄𝒕𝒊𝒐𝒏 =(𝑵𝒖𝒎𝒃𝒆𝒓 𝒐𝒇 𝒔𝒂𝒕𝒊𝒔𝒇𝒊𝒆𝒅 𝒐𝒓 𝒗𝒆𝒓𝒚 𝒔𝒂𝒕𝒊𝒔𝒇𝒊𝒆𝒅 𝒕𝒆𝒄𝒉𝒔)
(𝑻𝒐𝒕𝒂𝒍 𝒏𝒖𝒎𝒃𝒆𝒓 𝒐𝒇 𝒕𝒆𝒄𝒉𝒔)
Desktop Support KPIs: Definitions & Correlations
2 4 | Page © Met r i cNe t , LLC www. met r i cne t . com
Ticket Handling Metrics
Average Incident Work Time
Definition: Average Incident Work Time is the average time (in minutes) that
a technician spends to resolve an incident. This does not include travel time
to and from the customer, or time between visits if multiple visits are required
to the user’s desktop to resolve an incident. It includes only the time that a
technician spends actually working on an incident.
Why it’s important: Incident Work Time is one of the basic units of work in
Desktop Support. Average Incident Work Time, therefore, represents the
amount of labor required to complete one unit of work.
Key correlations: Average Incident Work Time is strongly correlated with
the following metrics:
Cost per Incident
Incidents per Technician per Month
Incident First Visit Resolution Rate
𝑨𝒗𝒆𝒓𝒂𝒈𝒆 𝑰𝒏𝒄𝒊𝒅𝒆𝒏𝒕 𝑾𝒐𝒓𝒌 𝑻𝒊𝒎𝒆 =(𝑻𝒐𝒕𝒂𝒍 𝒎𝒊𝒏𝒖𝒕𝒆𝒔 𝒔𝒑𝒆𝒏𝒕 𝒘𝒐𝒓𝒌𝒊𝒏𝒈 𝒐𝒏 𝒊𝒏𝒄𝒊𝒅𝒆𝒏𝒕𝒔)
(𝑻𝒐𝒕𝒂𝒍 𝒊𝒏𝒄𝒊𝒅𝒆𝒏𝒕 𝒗𝒐𝒍𝒖𝒎𝒆)
Desktop Support KPIs: Definitions & Correlations
2 5 | Page © Met r i cNe t , LLC www. met r i cne t . com
Ticket Handling Metrics (continued)
Average Service Request Work Time
Definition: Average Service Request Work Time is the average time (in
minutes) that a technician spends to fulfill a service request. This does not
include travel time to and from the customer, or time between visits if
multiple visits are required to fulfill a service request. It includes only the
time that a technician spends actually fulfilling a service request.
Why it’s important: Service Request Work Time is one of the basic units of
work in Desktop Support. Average Service Request Work Time, therefore,
represents the amount of labor required to complete one unit of work.
Key correlations: Average Service Request Work Time is strongly
correlated with the following metrics:
Cost per Service Request
Service Requests per Technician per Month
𝑨𝒗𝒈. 𝑺𝒆𝒓𝒗𝒊𝒄𝒆 𝑹𝒆𝒒𝒖𝒆𝒔𝒕 𝑾𝒐𝒓𝒌 𝑻𝒊𝒎𝒆 =(𝑻𝒐𝒕𝒂𝒍 𝒎𝒊𝒏𝒖𝒕𝒆𝒔 𝒔𝒑𝒆𝒏𝒕 𝒇𝒖𝒍𝒇𝒊𝒍𝒍𝒊𝒏𝒈 𝒔𝒗𝒄. 𝒓𝒆𝒒𝒖𝒆𝒔𝒕𝒔)
(𝑻𝒐𝒕𝒂𝒍 𝒔𝒗𝒄. 𝒓𝒆𝒒𝒖𝒆𝒔𝒕 𝒗𝒐𝒍𝒖𝒎𝒆)
Desktop Support KPIs: Definitions & Correlations
2 6 | Page © Met r i cNe t , LLC www. met r i cne t . com
Ticket Handling Metrics (continued)
Average Travel Time per Ticket
Definition: Average Travel Time per Ticket is the average round-trip travel
time to get to and from the site of a user or device being serviced. In a high -
density user environment (e.g., a high-rise office building) the Average
Travel Time per Ticket will typically be less than 20 minutes. By contrast, in
a more distributed user environment (e.g., field or campus locations), the
Average Travel Time per Ticket will be correspondingly longer.
Why it’s important: Unlike the Level 1 Service Desk, where support is
provided remotely, Desktop Support, by definition, requires onsite support.
Getting to and from the site of a ticket can be very time consuming and will
affect the number of tickets that a technician can handle in a day or a month.
This, in turn, affects the staffing level required in the Desktop Support
organization.
Key correlations: Average Travel Time per Ticket is strongly correlated with
the following metrics:
Cost per Ticket
Incidents per Technician per Month
Service Requests per Technician per Month
𝑨𝒗𝒈. 𝑻𝒓𝒂𝒗𝒆𝒍 𝑻𝒊𝒎𝒆 𝒑𝒆𝒓 𝑻𝒊𝒄𝒌𝒆𝒕 =(𝑻𝒐𝒕𝒂𝒍 𝒎𝒊𝒏𝒖𝒕𝒆𝒔 𝒕𝒓𝒂𝒗𝒆𝒍𝒊𝒏𝒈 𝒕𝒐/𝒇𝒓𝒐𝒎 𝒕𝒊𝒄𝒌𝒆𝒕 𝒘𝒐𝒓𝒌𝒔𝒊𝒕𝒆𝒔)
(𝑻𝒐𝒕𝒂𝒍 𝒕𝒊𝒄𝒌𝒆𝒕 𝒗𝒐𝒍𝒖𝒎𝒆)
Desktop Support KPIs: Definitions & Correlations
2 7 | Page © Met r i cNe t , LLC www. met r i cne t . com
Workload Metrics
Tickets per Seat per Month
Definition: Tickets per Seat per Month measures the volume of Desktop
Support work generated by a given user population. The number of Tickets
per Seat per Month can vary dramatically from one organization to another,
driven by factors such as the age of devices being supported, the number of
laptop computers, the number of other mobile devices, the location of users
(office, home, field), and myriad other factors.
Why it’s important: The number of Tickets per Seat per Month will drive the
workload, and hence the staffing for a Desktop Support organization.
Desktop Support staffing decisions should be based on this metric, rather
than on the number of users being supported.
Key correlations: Tickets per Seat per Month is strongly correlated with the
following metrics:
Incidents per Seat per Month
Service Requests per Seat per Month
𝑻𝒊𝒄𝒌𝒆𝒕𝒔 𝒑𝒆𝒓 𝑺𝒆𝒂𝒕 𝒑𝒆𝒓 𝑴𝒐𝒏𝒕𝒉 =(𝑨𝒗𝒈. 𝒕𝒐𝒕𝒂𝒍 𝒎𝒐𝒏𝒕𝒉𝒍𝒚 𝒕𝒊𝒄𝒌𝒆𝒕 𝒗𝒐𝒍𝒖𝒎𝒆)
(𝑨𝒗𝒈. 𝒕𝒐𝒕𝒂𝒍 𝒏𝒖𝒎𝒃𝒆𝒓 𝒐𝒇 𝒔𝒆𝒂𝒕𝒔 𝒔𝒖𝒑𝒑𝒐𝒓𝒕𝒆𝒅)
Desktop Support KPIs: Definitions & Correlations
2 8 | Page © Met r i cNe t , LLC www. met r i cne t . com
Workload Metrics (continued)
Incidents per Seat per Month
Definition: Incidents per Seat per Month is a key measure of the volume of
Desktop Support work generated by a given user population. The number of
Incidents per Seat per Month can vary dramatically from one organization to
another, driven by factors such as the age of devices being supported, the
number of laptop computers, the number of other mobile devices, the
location of users (office, home, field), and myriad other factors.
Why it’s important: The number of Incidents per Seat per Month is a major
workload driver, and will therefore have a strong impact on staffing decisions
for Desktop Support.
Key correlations: Incidents per Seat per Month is strongly correlated with
the following metrics:
Tickets per Seat per Month
𝑰𝒏𝒄𝒊𝒅𝒆𝒏𝒕𝒔 𝒑𝒆𝒓 𝑺𝒆𝒂𝒕 𝒑𝒆𝒓 𝑴𝒐𝒏𝒕𝒉 =(𝑨𝒗𝒈. 𝒕𝒐𝒕𝒂𝒍 𝒎𝒐𝒏𝒕𝒉𝒍𝒚 𝒊𝒏𝒄𝒊𝒅𝒆𝒏𝒕 𝒗𝒐𝒍𝒖𝒎𝒆)
(𝑨𝒗𝒈. 𝒕𝒐𝒕𝒂𝒍 𝒏𝒖𝒎𝒃𝒆𝒓 𝒐𝒇 𝒔𝒆𝒂𝒕𝒔 𝒔𝒖𝒑𝒑𝒐𝒓𝒕𝒆𝒅)
Desktop Support KPIs: Definitions & Correlations
2 9 | Page © Met r i cNe t , LLC www. met r i cne t . com
Workload Metrics (continued)
Service Requests per Seat per Month
Definition: Service Requests per Seat per Month is a key measure of the
volume of Desktop Support work generated by a given user population. The
number of Service Requests per Seat per Month can vary dramatically from
one organization to another, driven by factors such as the number of
move/add/change requests, the age of devices being supported, the
frequency of device refreshes, the location of users (office, home, field), and
myriad other factors.
Why it’s important: The number of Service Requests per Seat per Month is
a major workload driver, and will therefore have a strong impact on staffing
decisions for Desktop Support.
Key correlations: Service Requests per Seat per Month is strongly
correlated with the following metrics:
Tickets per Seat per Month
𝑺𝒆𝒓𝒗𝒊𝒄𝒆 𝑹𝒆𝒒𝒖𝒆𝒔𝒕𝒔 𝒑𝒆𝒓 𝑺𝒆𝒂𝒕 𝒑𝒆𝒓 𝑴𝒐𝒏𝒕𝒉 =(𝑨𝒗𝒈. 𝒕𝒐𝒕𝒂𝒍 𝒎𝒐𝒏𝒕𝒉𝒍𝒚 𝒔𝒗𝒄. 𝒓𝒆𝒒𝒖𝒆𝒔𝒕 𝒗𝒐𝒍𝒖𝒎𝒆)
(𝑨𝒗𝒈. 𝒕𝒐𝒕𝒂𝒍 𝒏𝒖𝒎𝒃𝒆𝒓 𝒐𝒇 𝒔𝒆𝒂𝒕𝒔 𝒔𝒖𝒑𝒑𝒐𝒓𝒕𝒆𝒅)
Desktop Support KPIs: Definitions & Correlations
3 0 | Page © Met r i cNe t , LLC www. met r i cne t . com
Workload Metrics (continued)
Incidents as a % of Total Ticket Volume
Definition: Incidents as a % of Total Ticket Volume is a fairly self -
explanatory metric. It indicates the mix of work (incidents vs. service
requests) handled by a Desktop Support organization. Most Desktop Support
organizations receive more incidents than service requests. Since incidents
are generally less costly to resolve than service requests, the higher that
Incidents as a % of Total Ticket Volume is, the lower the Cost per Ticket will
be.
Why it’s important: Incidents are generally unplanned work (e.g., device
break/fix), while the majority of service requests are planned work (e.g.,
move/add/change). Incidents as a % of Total Ticket Volume therefore
measures the percentage of Desktop Support work that is made up of
unplanned work (incidents).
Key correlations: Incidents as a % of Total Ticket Volume is strongly
correlated with the following metrics:
Cost per Ticket
Tickets per Technician per Month
𝑰𝒏𝒄𝒊𝒅𝒆𝒏𝒕𝒔 𝒂𝒔 𝒂 % 𝒐𝒇 𝑻𝒐𝒕𝒂𝒍 𝑻𝒊𝒄𝒌𝒆𝒕 𝑽𝒐𝒍𝒖𝒎𝒆 =(𝑻𝒐𝒕𝒂𝒍 𝒊𝒏𝒄𝒊𝒅𝒆𝒏𝒕 𝒗𝒐𝒍𝒖𝒎𝒆)
(𝑻𝒐𝒕𝒂𝒍 𝒕𝒊𝒄𝒌𝒆𝒕 𝒗𝒐𝒍𝒖𝒎𝒆)
Desktop Support KPIs: Definitions & Correlations
3 1 | Page © Met r i cNe t , LLC www. met r i cne t . com
About MetricNet
MetricNet, LLC is the leading source of benchmarks, scorecards, and performance
metrics for Information Technology and Call Center Professionals worldwide. Our
mission is to provide you with the benchmarks you need to run your business more
effectively.
MetricNet has pioneered a number of innovative techniques to ensure that you receive
fast, accurate benchmarks, with a minimum of time and effort:
The One Year Path to World-Class Performance , a continuous Desktop
Support improvement program.
Downloadable industry benchmarks that walk you through the process of
benchmarking your performance against Desktop Support organizations in your
geographic region.
Benchmarking data files for those who wish to conduct their own
benchmarking analysis.
Comprehensive peer group benchmarks that compare your performance to
others in your vertical market.
Free Resources
Every month, MetricNet presents a live training webcast. Thousands of professionals
attend each year and many of our clients have their entire teams attend. These events
are a great way to boost Annual Agent Training Hours! Topics include Service Desk
Best Practices and KPIs, Desktop Support Best Practices and KPIs, Call Center Best
Practices and KPIs, and more. Sign up for our Free Webcasts.
We also have developed an extensive resource library fil led with free training
materials for Information Technology and Call Center professionals. Each resource is
available to download in PDF format. Browse our resource library.