Embed Size (px)
Citation preview
Detailed Financial Analysis
Socialist Republic of Vietnam 48189-002 - VIE: Support to Border Areas Development Project Provincial People’s Committee – Kon Tum Provincial People’s Committee – Gia Lai Provincial People’s Committee – Dak Lak Provincial People’s Committee – Dak Nong Provincial People’s Committee – Binh Phuoc
Financial Analysis (Supplementary)
Provincial Peoples’ Committee of Kon Tum, Gia Lai, Dak Lak, Dak Nong and Binh Phuoc
June 2016 i
Table of Contents
I. INTRODUCTION ............................................................................................................... 1
II. STATE BUDGET SYSTEM ............................................................................................... 1
III. PROJECT COSTS AND FINANCING ............................................................................... 2
IV. KON TUM.......................................................................................................................... 3
A. Past Financial Condition .................................................................................................. 3
B. Projected Financial Condition and Project Affordability .................................................... 4
V. GIA LAI ............................................................................................................................. 4
A. Past Financial Condition .................................................................................................. 4
B. Projected Financial Condition and Project Affordability .................................................... 5
VI. DAK LAK ........................................................................................................................... 6
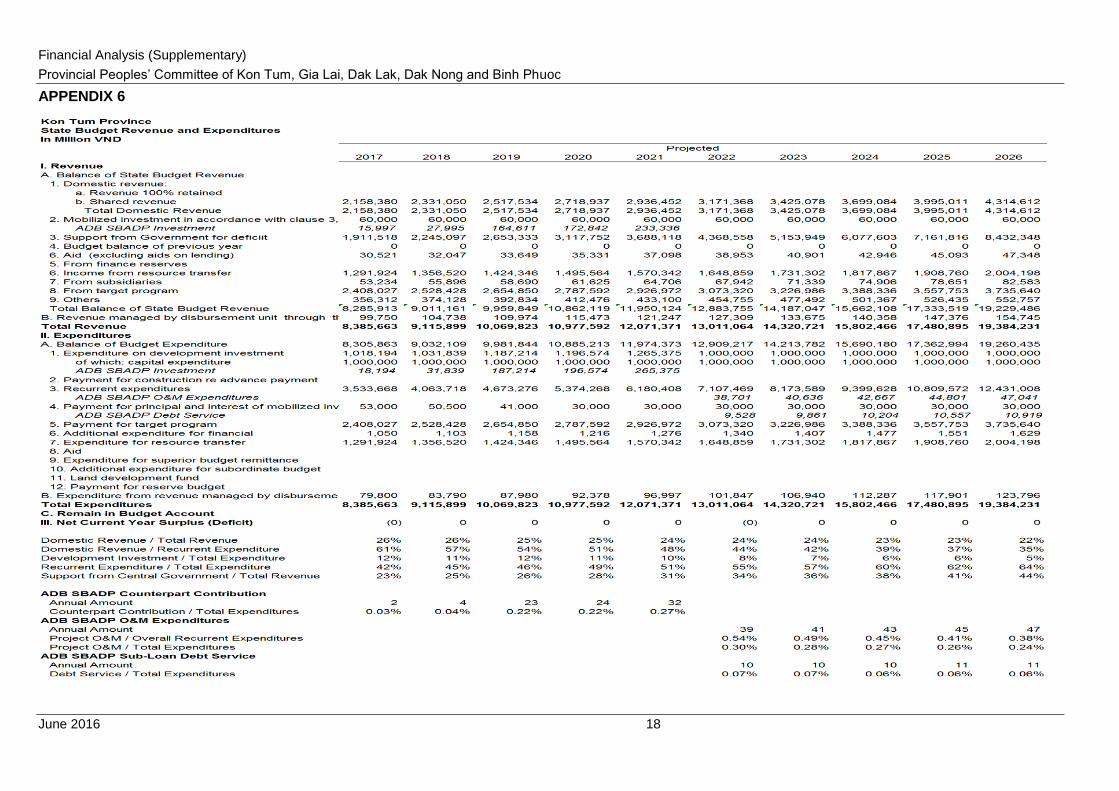
A. Past Financial Condition .................................................................................................. 6
B. Projected Financial Condition and Project Affordability .................................................... 7
VII. DAK NONG ....................................................................................................................... 8
A. Past Financial Condition .................................................................................................. 8
B. Projected Financial Condition and Project Affordability .................................................... 9
VIII. BINH PHUOC .................................................................................................................... 9
A. Past Financial Condition .................................................................................................. 9
B. Projected Financial Condition and Project Affordability ...................................................10
List of Tables
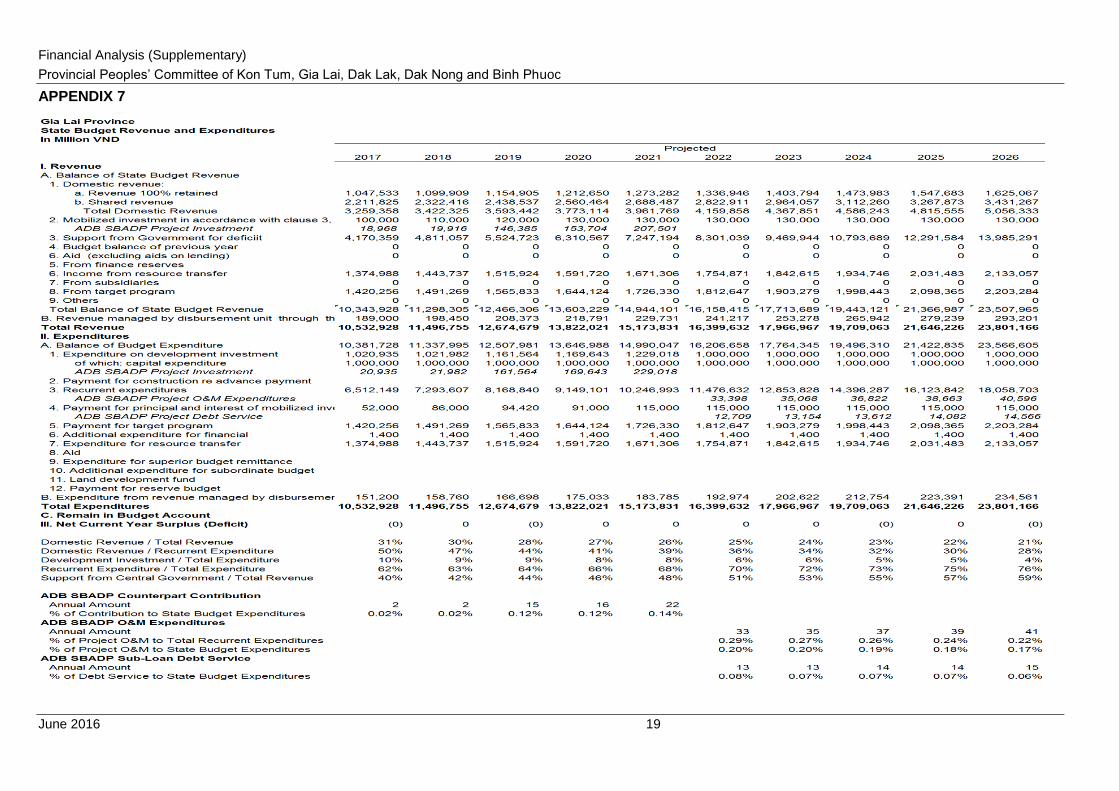
Table 1: Project Investment Plan ($ million) ............................................................................... 2
Table 2: Financing Plan ($ million) ............................................................................................. 3
Table 3: Summary of Past Financial Performance – Kon Tum ................................................... 3
Table 4: Summary of Projected Financial Performance – Kon Tum ........................................... 4
Table 5: Summary of Past Financial Performance – Gia Lai ...................................................... 5
Table 6: Summary of Projected Financial Performance – Gia Lai............................................... 6
Table 7: Summary of Past Financial Performance – Dak Lak ..................................................... 7
Table 8: Summary of Projected Financial Performance – Dak Lak ............................................. 7
Table 9: Summary of Past Financial Performance – Dak Nong .................................................. 8
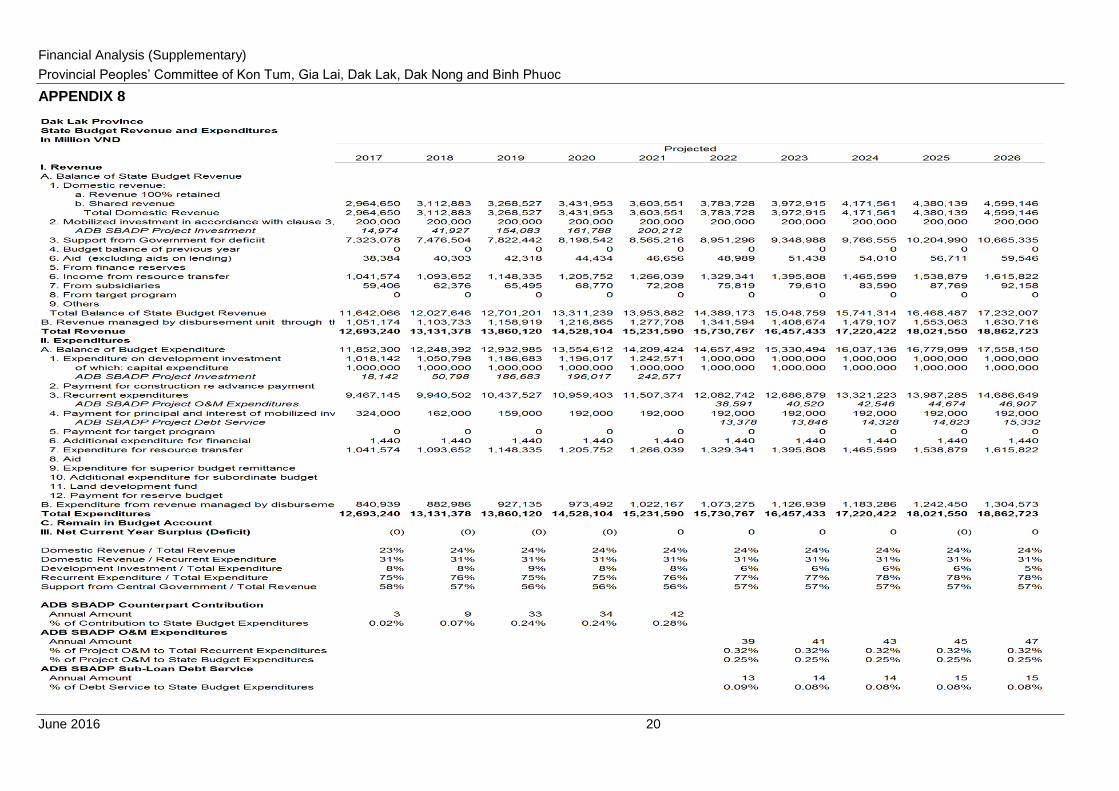
Financial Analysis (Supplementary)
Provincial Peoples’ Committee of Kon Tum, Gia Lai, Dak Lak, Dak Nong and Binh Phuoc
June 2016 ii
Table 10: Summary of Projected Financial Performance – Dak Nong ........................................ 9
Table 11: Summary of Past Financial Performance – Binh Phuoc.............................................10
Table 12: Summary of Projected Financial Performance – Binh Phuoc .....................................10
List of Appendices
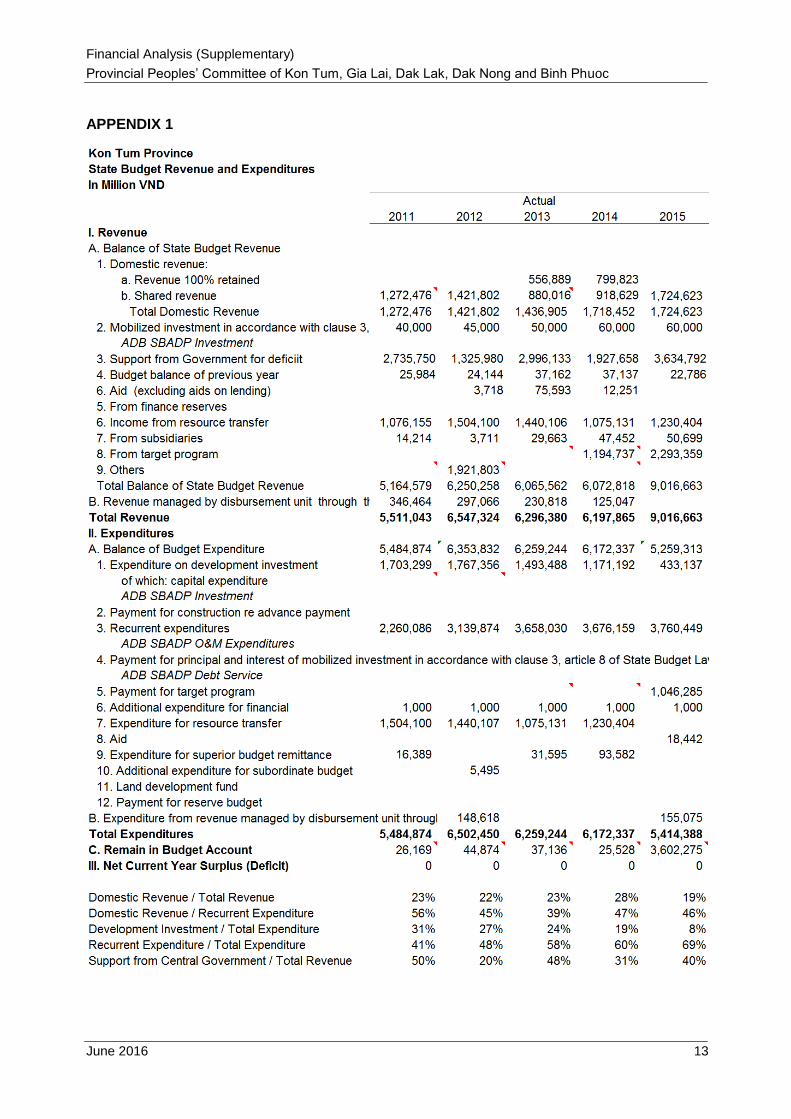
Appendix 1 – 2011-2015 State Budget Revenue and Expenditures – Kon Tum
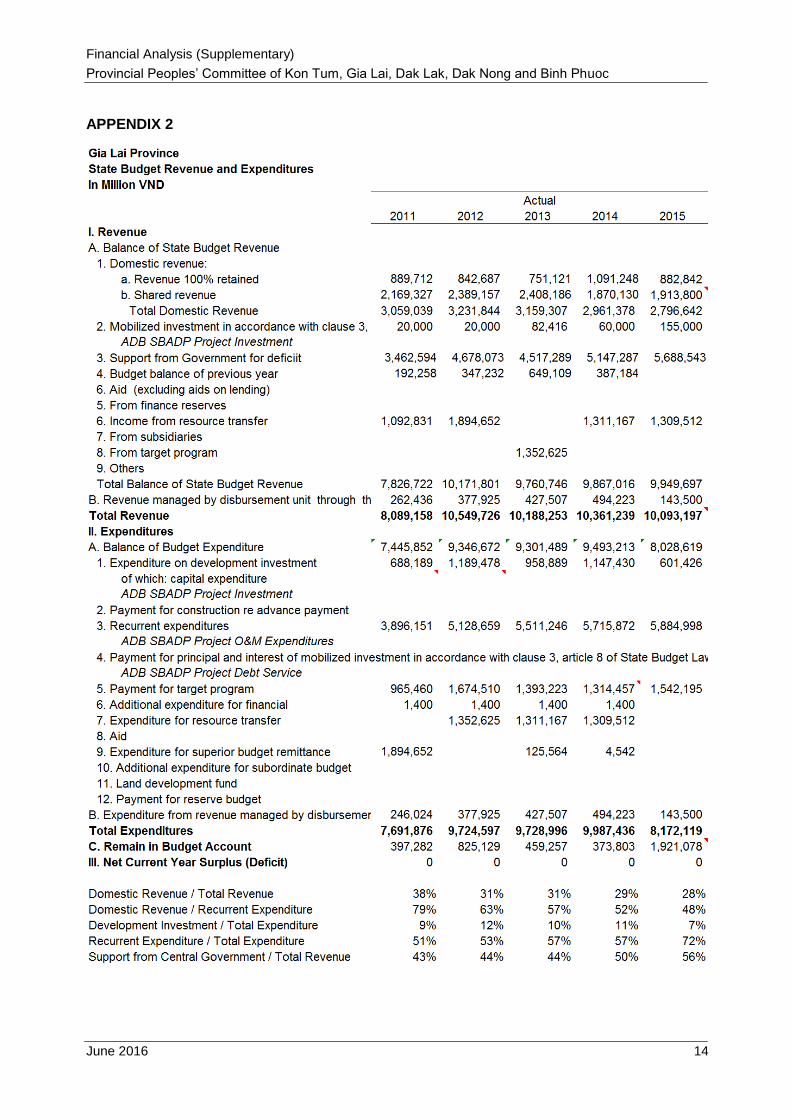
Appendix 2 – 2011-2015 State Budget Revenue and Expenditures – Gia Lai
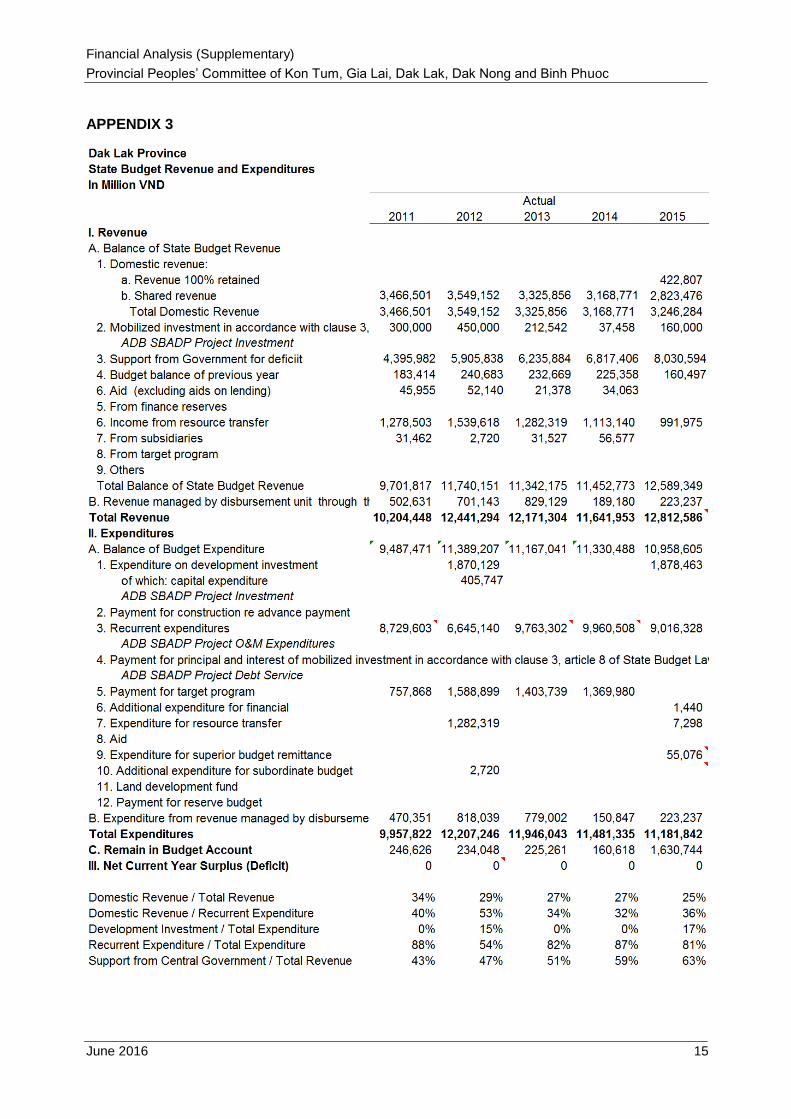
Appendix 3 – 2011-2015 State Budget Revenue and Expenditures – Dak Lak
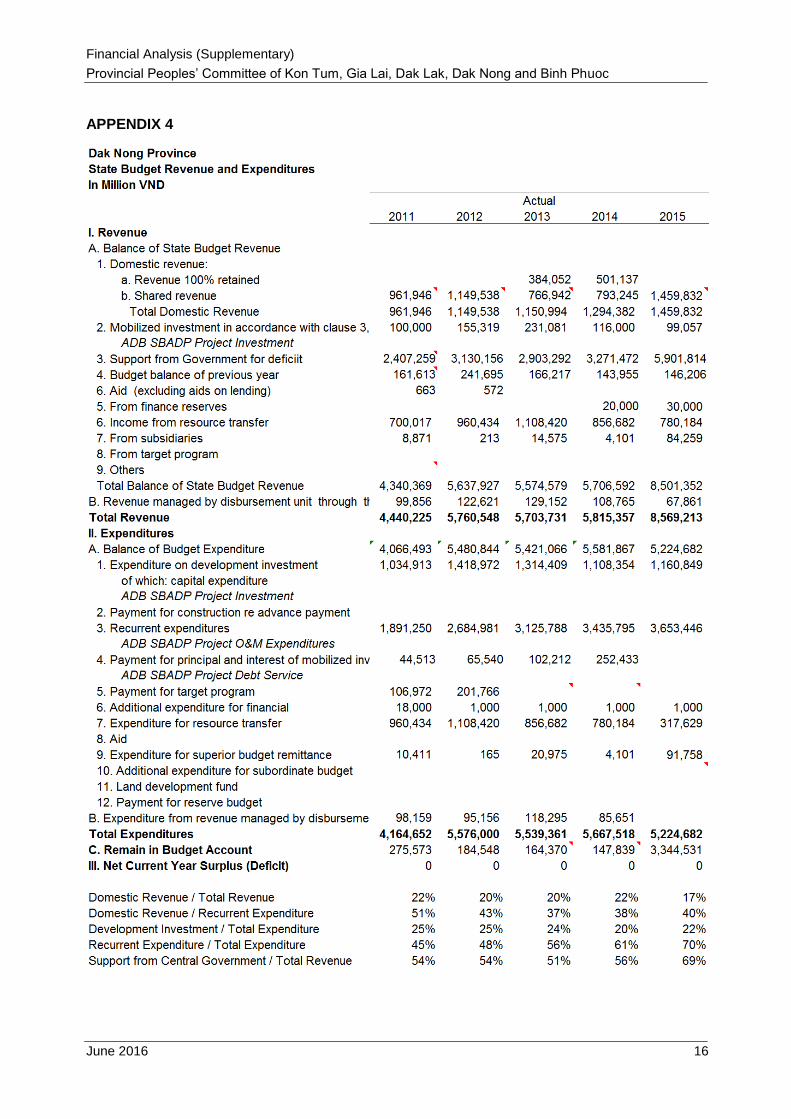
Appendix 4 – 2011-2015 State Budget Revenue and Expenditures – Dak Nong
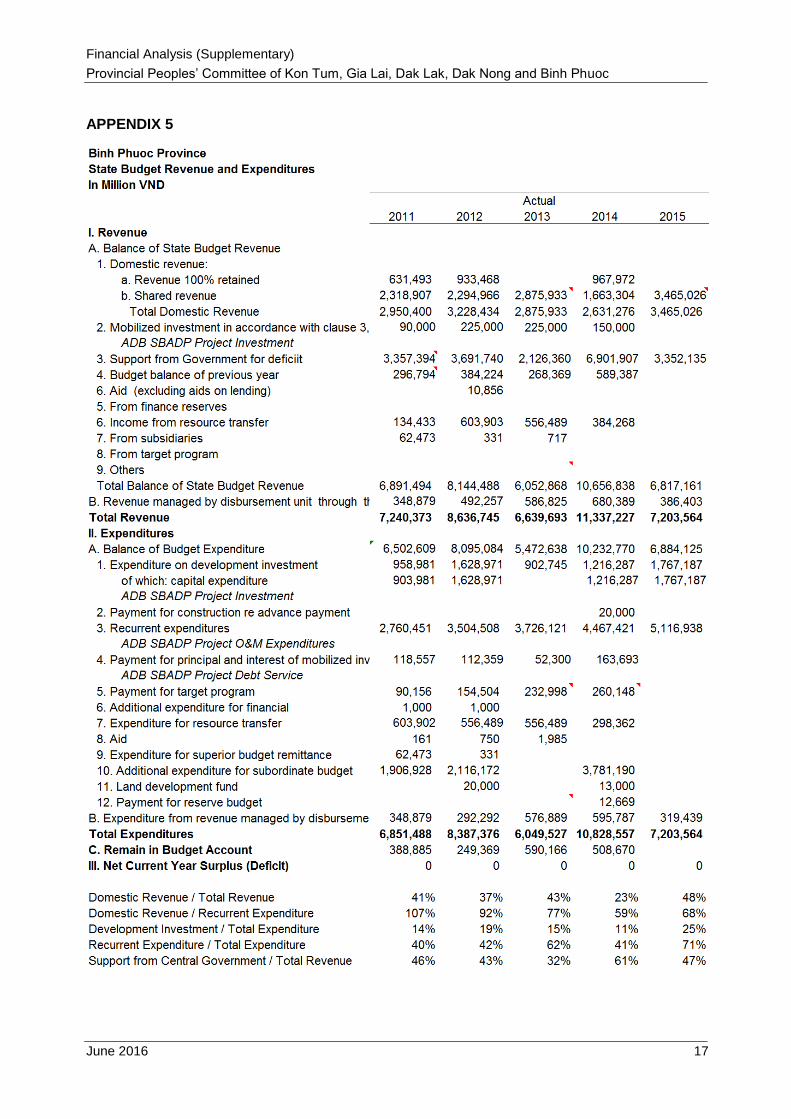
Appendix 5 – 2011-2015 State Budget Revenue and Expenditures – Binh Phuoc
Appendix 6 – 2017-2026 State Budget Revenue and Expenditures – Kon Tum
Appendix 7 – 2017-2026 State Budget Revenue and Expenditures – Gia Lai
Appendix 8 – 2017-2026 State Budget Revenue and Expenditures – Dak Lak
Appendix 9 – 2017-2026 State Budget Revenue and Expenditures – Dak Nong
Appendix 10 – 2017-2026 State Budget Revenue and Expenditures – Binh Phuoc
Financial Analysis (Supplementary)
Provincial Peoples’ Committee of Kon Tum, Gia Lai, Dak Lak, Dak Nong and Binh Phuoc
June 2016 1
I. INTRODUCTION
1. An assessment of the financial condition of the Provincial Peoples’ Committee of Kon Tum, Gia Lai, Dak Lak, Dak Nong and Binh Phuoc was conducted for the project. The objective of the assessment is to determine the financial capability of each province to contribute the required counterpart funds, repay debt service arising from the project and to maintain the infrastructure sustainably after construction completion. The financial assessment comprises of review of the past financial condition of each province and the forecast of their financial condition in the next ten years.
II. STATE BUDGET SYSTEM
2. Vietnam’s budget system consist of central budget and local budget, in which local budget consists of budgets of local authorities having People’s Council and People’s Committee. Local budget includes provincial budget (consisting of provincial and district budget); district budget (consisting of district and commune budget); and commune budget. The budget of lower level of administration is a component of the budget of higher level of administration. This means that local budgets do not show deficits as they are balanced at the higher level of administration.1
3. The revenue of the province can be broadly classified into 3 major types of revenue source: (i) domestic revenue; ii) support from central budget; and (iii) other external revenue source. Domestic revenue consists of revenues that are retained 100% by local authorities and revenues that are shared between local and central authorities. Revenues that are retained 100% are taxes and fees related to land (e.g. land and housing tax, tax on transfer of land use rights, transfer of land use rights, rental of land and water), natural resource tax (except petroleum), registration fees, licensing fees, and other local fees and charges. Shared revenues are VAT (except VAT on imports), corporate income tax (except enterprises with uniform accounting), personal income tax, special consumption tax on domestic goods and services; and environmental protection tax.
4. Autonomy of local authorities in revenue generation is limited. Tax bases and tax rates for revenue types that are retained 100% by local authorities are set by the central government. Shared revenues, especially VAT and corporate income tax, are shared between central and local authorities based on where the revenues are actually collected rather than where they are incurred.
5. The expenditures of the province can be broadly classified into 3 major types of expenditures: (i) expenditure on development investment; (ii) recurrent expenditures; and (iii) other expenditures. Expenditures on development investment consist of: (i) investment in the construction of socioeconomic infrastructures with locally managed capital; (ii) investment in and support for enterprises, economic organizations and financial organizations of the State under the provisions of law; (iii) development investment portions in the national programs implemented by local agencies; and (iv) other development investment expenditures as prescribed by law. Recurrent expenditures are broadly classified into: (i) expenditures on general public administration; (ii) expenditures on economic services; (iii) expenditures on social relief, e.g. education and training, health care, pension and others; and (iv) other recurrent expenditures
6. The 5 participating provinces of the project are among the 50 provinces that are beneficiaries of the national equalization budget system; their budgets show no deficits as they
1 Presentation material “Fiscal Decentralization in Vietnam: Outcomes and the Way Forward” of Truong Ba Tuan,
National Institute for Finance, Ministry of Finance, Vietnam for the Asian Regional Seminar on Public Financial Management in Phnom Penh, 25-26 November 2014.
Financial Analysis (Supplementary)
Provincial Peoples’ Committee of Kon Tum, Gia Lai, Dak Lak, Dak Nong and Binh Phuoc
June 2016 2
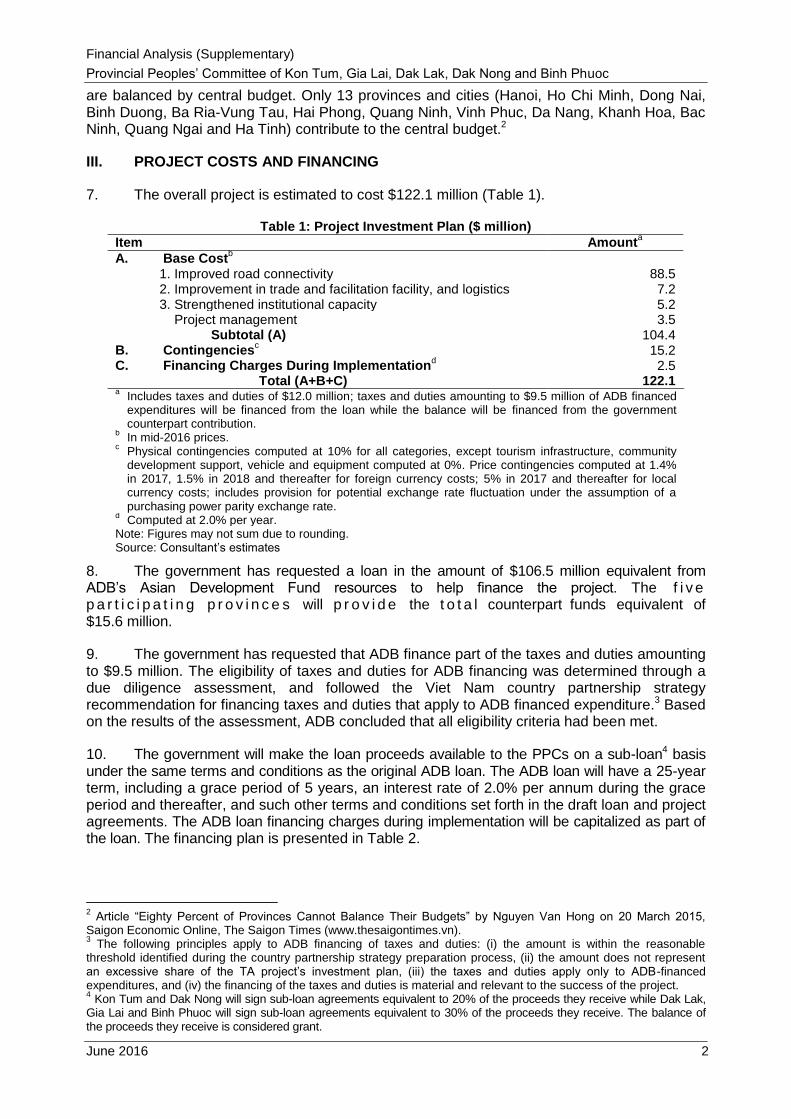
are balanced by central budget. Only 13 provinces and cities (Hanoi, Ho Chi Minh, Dong Nai, Binh Duong, Ba Ria-Vung Tau, Hai Phong, Quang Ninh, Vinh Phuc, Da Nang, Khanh Hoa, Bac Ninh, Quang Ngai and Ha Tinh) contribute to the central budget.2
III. PROJECT COSTS AND FINANCING
7. The overall project is estimated to cost $122.1 million (Table 1).
Table 1: Project Investment Plan ($ million)
Item Amounta
A. Base Costb
1. Improved road connectivity 88.5 2. Improvement in trade and facilitation facility, and logistics 7.2 3. Strengthened institutional capacity 5.2 Project management 3.5 Subtotal (A) 104.4 B. Contingencies
c 15.2
C. Financing Charges During Implementationd 2.5
Total (A+B+C) 122.1 a Includes taxes and duties of $12.0 million; taxes and duties amounting to $9.5 million of ADB financed
expenditures will be financed from the loan while the balance will be financed from the government counterpart contribution.
b In mid-2016 prices.
c Physical contingencies computed at 10% for all categories, except tourism infrastructure, community
development support, vehicle and equipment computed at 0%. Price contingencies computed at 1.4% in 2017, 1.5% in 2018 and thereafter for foreign currency costs; 5% in 2017 and thereafter for local currency costs; includes provision for potential exchange rate fluctuation under the assumption of a purchasing power parity exchange rate.
d Computed at 2.0% per year.
Note: Figures may not sum due to rounding. Source: Consultant’s estimates
8. The government has requested a loan in the amount of $106.5 million equivalent from ADB’s Asian Development Fund resources to help finance the project. The f i v e p a r t i c i p a t i n g p r o v i n c e s will p r o v i d e the t o t a l counterpart funds equivalent of $15.6 million.
9. The government has requested that ADB finance part of the taxes and duties amounting to $9.5 million. The eligibility of taxes and duties for ADB financing was determined through a due diligence assessment, and followed the Viet Nam country partnership strategy recommendation for financing taxes and duties that apply to ADB financed expenditure.3 Based on the results of the assessment, ADB concluded that all eligibility criteria had been met.
10. The government will make the loan proceeds available to the PPCs on a sub-loan4 basis under the same terms and conditions as the original ADB loan. The ADB loan will have a 25-year term, including a grace period of 5 years, an interest rate of 2.0% per annum during the grace period and thereafter, and such other terms and conditions set forth in the draft loan and project agreements. The ADB loan financing charges during implementation will be capitalized as part of the loan. The financing plan is presented in Table 2.
2 Article “Eighty Percent of Provinces Cannot Balance Their Budgets” by Nguyen Van Hong on 20 March 2015,
Saigon Economic Online, The Saigon Times (www.thesaigontimes.vn). 3 The following principles apply to ADB financing of taxes and duties: (i) the amount is within the reasonable
threshold identified during the country partnership strategy preparation process, (ii) the amount does not represent an excessive share of the TA project’s investment plan, (iii) the taxes and duties apply only to ADB-financed expenditures, and (iv) the financing of the taxes and duties is material and relevant to the success of the project. 4 Kon Tum and Dak Nong will sign sub-loan agreements equivalent to 20% of the proceeds they receive while Dak Lak,
Gia Lai and Binh Phuoc will sign sub-loan agreements equivalent to 30% of the proceeds they receive. The balance of the proceeds they receive is considered grant.
Financial Analysis (Supplementary)
Provincial Peoples’ Committee of Kon Tum, Gia Lai, Dak Lak, Dak Nong and Binh Phuoc
June 2016 3
Table 2: Financing Plan ($ million)
Source Amount Share of Total (%)
Asian Development Bank 106.5 87.2 Provincial Peoples’ Committee
Kon Tum 3.1 2.6
Gia Lai 2.1 1.7
Dak Lak 4.5 3.7
Dak Nong 3.6 2.9
Binh Phuoc 2.3 1.9
Subtotal 15.6 12.8
Total 122.1 100.0 Source: Consultant’s estimates
IV. KON TUM
A. Past Financial Condition
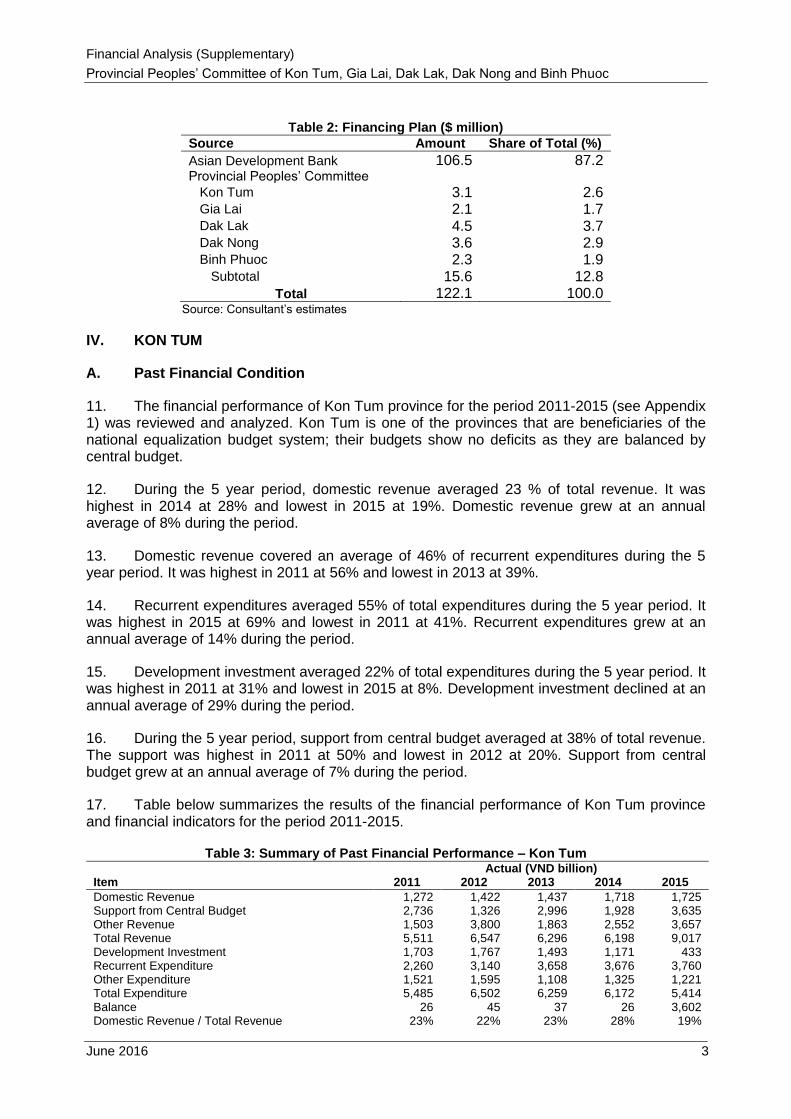
11. The financial performance of Kon Tum province for the period 2011-2015 (see Appendix 1) was reviewed and analyzed. Kon Tum is one of the provinces that are beneficiaries of the national equalization budget system; their budgets show no deficits as they are balanced by central budget.
12. During the 5 year period, domestic revenue averaged 23 % of total revenue. It was highest in 2014 at 28% and lowest in 2015 at 19%. Domestic revenue grew at an annual average of 8% during the period.
13. Domestic revenue covered an average of 46% of recurrent expenditures during the 5 year period. It was highest in 2011 at 56% and lowest in 2013 at 39%.
14. Recurrent expenditures averaged 55% of total expenditures during the 5 year period. It was highest in 2015 at 69% and lowest in 2011 at 41%. Recurrent expenditures grew at an annual average of 14% during the period.
15. Development investment averaged 22% of total expenditures during the 5 year period. It was highest in 2011 at 31% and lowest in 2015 at 8%. Development investment declined at an annual average of 29% during the period.
16. During the 5 year period, support from central budget averaged at 38% of total revenue. The support was highest in 2011 at 50% and lowest in 2012 at 20%. Support from central budget grew at an annual average of 7% during the period.
17. Table below summarizes the results of the financial performance of Kon Tum province and financial indicators for the period 2011-2015.
Table 3: Summary of Past Financial Performance – Kon Tum
Actual (VND billion)
Item 2011 2012 2013 2014 2015
Domestic Revenue 1,272 1,422 1,437 1,718 1,725 Support from Central Budget 2,736 1,326 2,996 1,928 3,635 Other Revenue 1,503 3,800 1,863 2,552 3,657 Total Revenue 5,511 6,547 6,296 6,198 9,017 Development Investment 1,703 1,767 1,493 1,171 433 Recurrent Expenditure 2,260 3,140 3,658 3,676 3,760 Other Expenditure 1,521 1,595 1,108 1,325 1,221 Total Expenditure 5,485 6,502 6,259 6,172 5,414 Balance 26 45 37 26 3,602 Domestic Revenue / Total Revenue 23% 22% 23% 28% 19%
Financial Analysis (Supplementary)
Provincial Peoples’ Committee of Kon Tum, Gia Lai, Dak Lak, Dak Nong and Binh Phuoc
June 2016 4
Actual (VND billion)
Item 2011 2012 2013 2014 2015
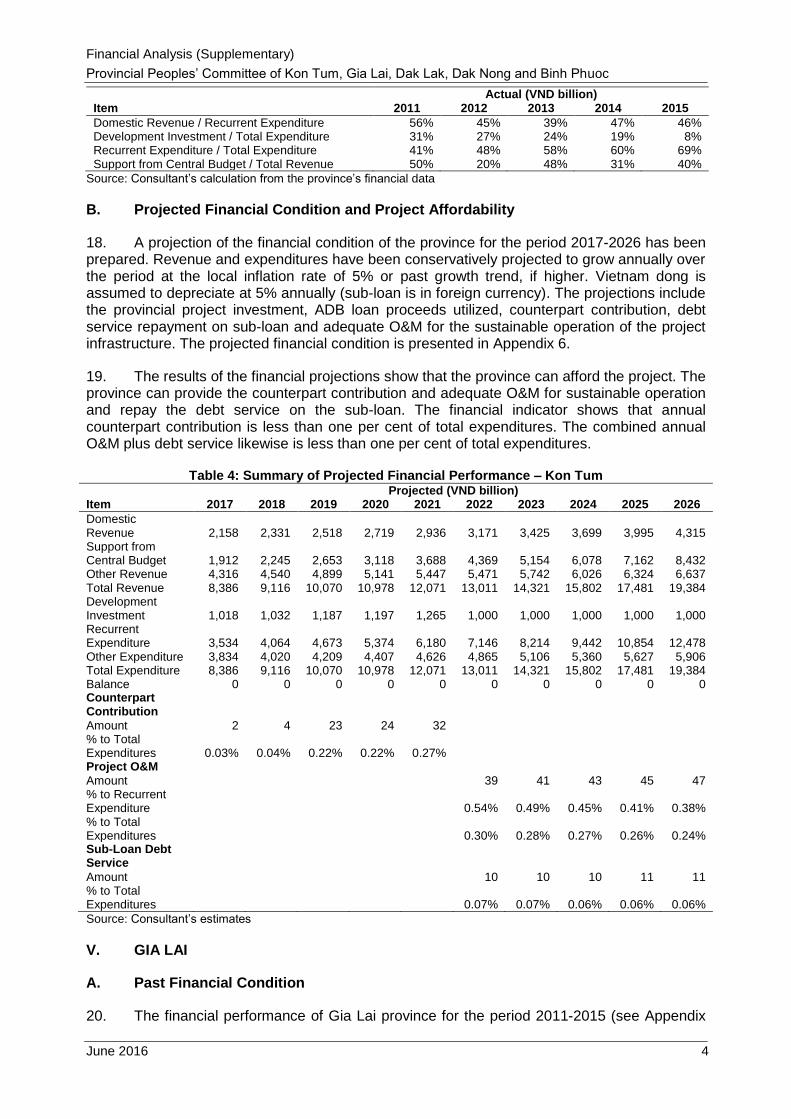
Domestic Revenue / Recurrent Expenditure 56% 45% 39% 47% 46% Development Investment / Total Expenditure 31% 27% 24% 19% 8% Recurrent Expenditure / Total Expenditure 41% 48% 58% 60% 69% Support from Central Budget / Total Revenue 50% 20% 48% 31% 40%
Source: Consultant’s calculation from the province’s financial data
B. Projected Financial Condition and Project Affordability
18. A projection of the financial condition of the province for the period 2017-2026 has been prepared. Revenue and expenditures have been conservatively projected to grow annually over the period at the local inflation rate of 5% or past growth trend, if higher. Vietnam dong is assumed to depreciate at 5% annually (sub-loan is in foreign currency). The projections include the provincial project investment, ADB loan proceeds utilized, counterpart contribution, debt service repayment on sub-loan and adequate O&M for the sustainable operation of the project infrastructure. The projected financial condition is presented in Appendix 6.
19. The results of the financial projections show that the province can afford the project. The province can provide the counterpart contribution and adequate O&M for sustainable operation and repay the debt service on the sub-loan. The financial indicator shows that annual counterpart contribution is less than one per cent of total expenditures. The combined annual O&M plus debt service likewise is less than one per cent of total expenditures.
Table 4: Summary of Projected Financial Performance – Kon Tum Projected (VND billion) Item 2017 2018 2019 2020 2021 2022 2023 2024 2025 2026
Domestic Revenue 2,158 2,331 2,518 2,719 2,936 3,171 3,425 3,699 3,995 4,315 Support from Central Budget 1,912 2,245 2,653 3,118 3,688 4,369 5,154 6,078 7,162 8,432 Other Revenue 4,316 4,540 4,899 5,141 5,447 5,471 5,742 6,026 6,324 6,637 Total Revenue 8,386 9,116 10,070 10,978 12,071 13,011 14,321 15,802 17,481 19,384 Development Investment 1,018 1,032 1,187 1,197 1,265 1,000 1,000 1,000 1,000 1,000 Recurrent Expenditure 3,534 4,064 4,673 5,374 6,180 7,146 8,214 9,442 10,854 12,478 Other Expenditure 3,834 4,020 4,209 4,407 4,626 4,865 5,106 5,360 5,627 5,906 Total Expenditure 8,386 9,116 10,070 10,978 12,071 13,011 14,321 15,802 17,481 19,384 Balance 0 0 0 0 0 0 0 0 0 0 Counterpart Contribution
Amount 2 4 23 24 32 % to Total
Expenditures 0.03% 0.04% 0.22% 0.22% 0.27% Project O&M
Amount
39 41 43 45 47 % to Recurrent Expenditure
0.54% 0.49% 0.45% 0.41% 0.38%
% to Total Expenditures
0.30% 0.28% 0.27% 0.26% 0.24%
Sub-Loan Debt Service
Amount
10 10 10 11 11 % to Total Expenditures
0.07% 0.07% 0.06% 0.06% 0.06%
Source: Consultant’s estimates
V. GIA LAI
A. Past Financial Condition
20. The financial performance of Gia Lai province for the period 2011-2015 (see Appendix
Financial Analysis (Supplementary)
Provincial Peoples’ Committee of Kon Tum, Gia Lai, Dak Lak, Dak Nong and Binh Phuoc
June 2016 5
2) was reviewed and analyzed. Gia Lai is one of the provinces that are beneficiaries of the national equalization budget system; their budgets show no deficits as they are balanced by central budget.
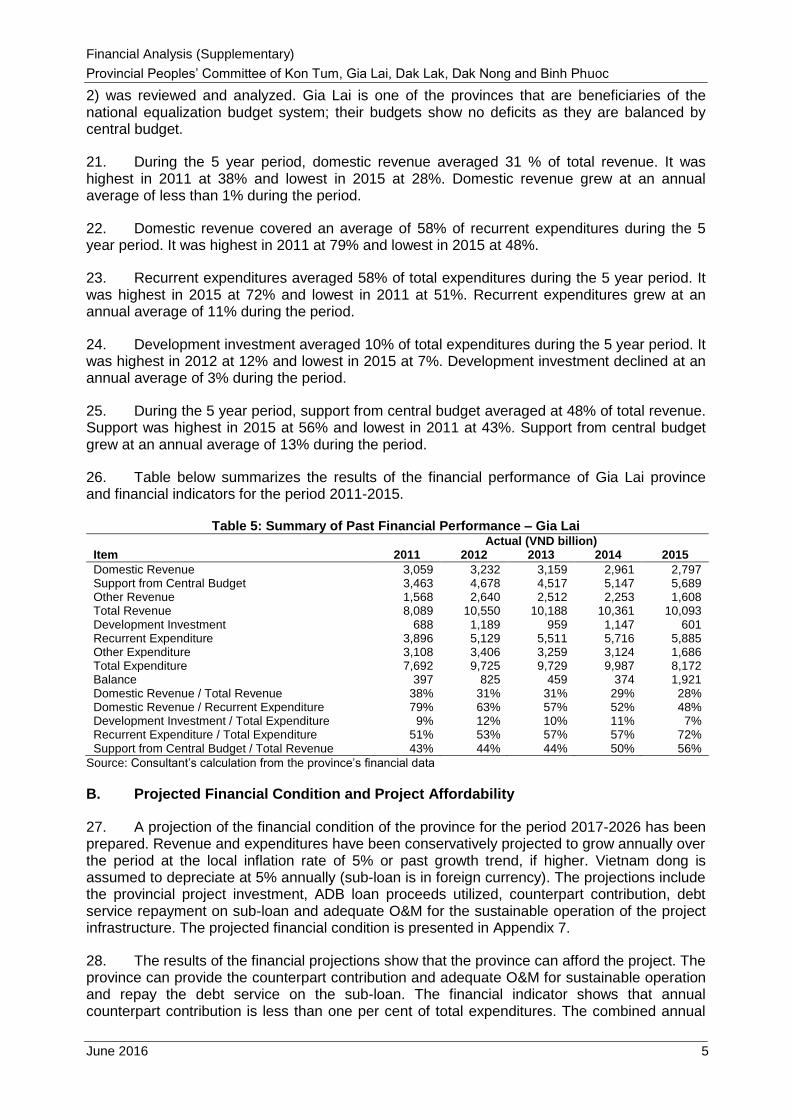
21. During the 5 year period, domestic revenue averaged 31 % of total revenue. It was highest in 2011 at 38% and lowest in 2015 at 28%. Domestic revenue grew at an annual average of less than 1% during the period.
22. Domestic revenue covered an average of 58% of recurrent expenditures during the 5 year period. It was highest in 2011 at 79% and lowest in 2015 at 48%.
23. Recurrent expenditures averaged 58% of total expenditures during the 5 year period. It was highest in 2015 at 72% and lowest in 2011 at 51%. Recurrent expenditures grew at an annual average of 11% during the period.
24. Development investment averaged 10% of total expenditures during the 5 year period. It was highest in 2012 at 12% and lowest in 2015 at 7%. Development investment declined at an annual average of 3% during the period.
25. During the 5 year period, support from central budget averaged at 48% of total revenue. Support was highest in 2015 at 56% and lowest in 2011 at 43%. Support from central budget grew at an annual average of 13% during the period.
26. Table below summarizes the results of the financial performance of Gia Lai province and financial indicators for the period 2011-2015.
Table 5: Summary of Past Financial Performance – Gia Lai
Actual (VND billion)
Item 2011 2012 2013 2014 2015
Domestic Revenue 3,059 3,232 3,159 2,961 2,797 Support from Central Budget 3,463 4,678 4,517 5,147 5,689 Other Revenue 1,568 2,640 2,512 2,253 1,608 Total Revenue 8,089 10,550 10,188 10,361 10,093 Development Investment 688 1,189 959 1,147 601 Recurrent Expenditure 3,896 5,129 5,511 5,716 5,885 Other Expenditure 3,108 3,406 3,259 3,124 1,686 Total Expenditure 7,692 9,725 9,729 9,987 8,172 Balance 397 825 459 374 1,921 Domestic Revenue / Total Revenue 38% 31% 31% 29% 28% Domestic Revenue / Recurrent Expenditure 79% 63% 57% 52% 48% Development Investment / Total Expenditure 9% 12% 10% 11% 7% Recurrent Expenditure / Total Expenditure 51% 53% 57% 57% 72% Support from Central Budget / Total Revenue 43% 44% 44% 50% 56%
Source: Consultant’s calculation from the province’s financial data
B. Projected Financial Condition and Project Affordability
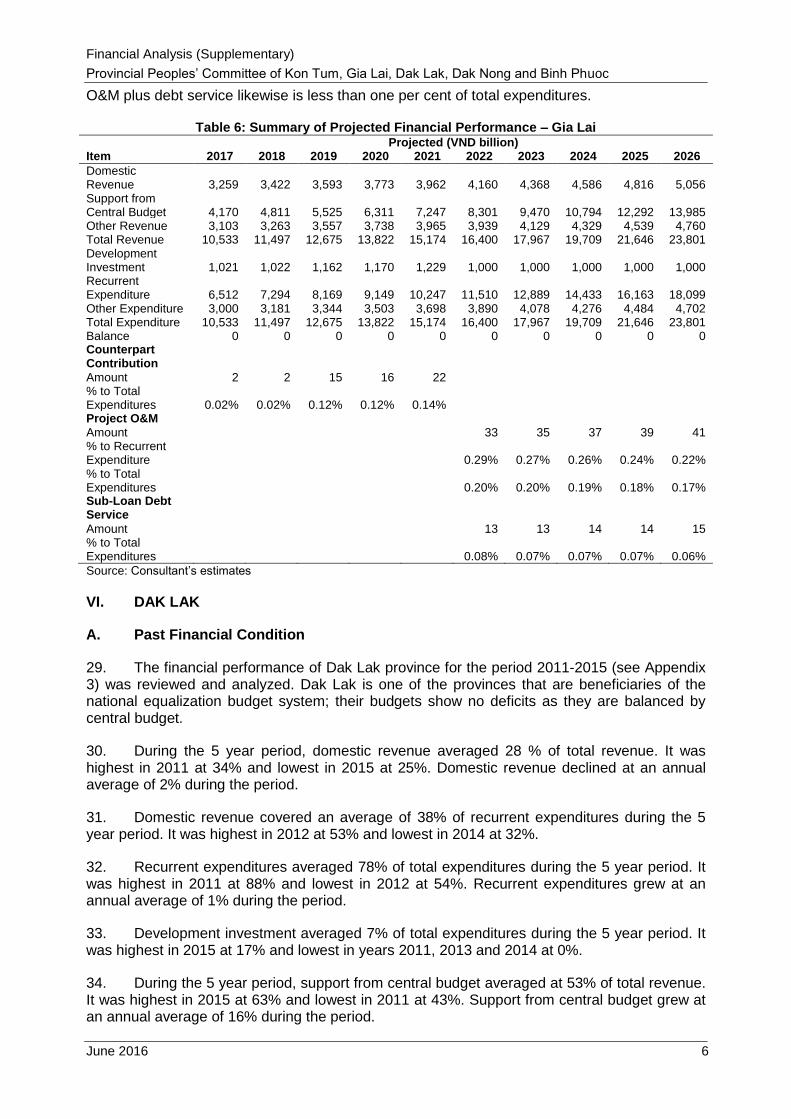
27. A projection of the financial condition of the province for the period 2017-2026 has been prepared. Revenue and expenditures have been conservatively projected to grow annually over the period at the local inflation rate of 5% or past growth trend, if higher. Vietnam dong is assumed to depreciate at 5% annually (sub-loan is in foreign currency). The projections include the provincial project investment, ADB loan proceeds utilized, counterpart contribution, debt service repayment on sub-loan and adequate O&M for the sustainable operation of the project infrastructure. The projected financial condition is presented in Appendix 7.
28. The results of the financial projections show that the province can afford the project. The province can provide the counterpart contribution and adequate O&M for sustainable operation and repay the debt service on the sub-loan. The financial indicator shows that annual counterpart contribution is less than one per cent of total expenditures. The combined annual
Financial Analysis (Supplementary)
Provincial Peoples’ Committee of Kon Tum, Gia Lai, Dak Lak, Dak Nong and Binh Phuoc
June 2016 6
O&M plus debt service likewise is less than one per cent of total expenditures.
Table 6: Summary of Projected Financial Performance – Gia Lai Projected (VND billion) Item 2017 2018 2019 2020 2021 2022 2023 2024 2025 2026
Domestic Revenue 3,259 3,422 3,593 3,773 3,962 4,160 4,368 4,586 4,816 5,056 Support from Central Budget 4,170 4,811 5,525 6,311 7,247 8,301 9,470 10,794 12,292 13,985 Other Revenue 3,103 3,263 3,557 3,738 3,965 3,939 4,129 4,329 4,539 4,760 Total Revenue 10,533 11,497 12,675 13,822 15,174 16,400 17,967 19,709 21,646 23,801 Development Investment 1,021 1,022 1,162 1,170 1,229 1,000 1,000 1,000 1,000 1,000 Recurrent Expenditure 6,512 7,294 8,169 9,149 10,247 11,510 12,889 14,433 16,163 18,099 Other Expenditure 3,000 3,181 3,344 3,503 3,698 3,890 4,078 4,276 4,484 4,702 Total Expenditure 10,533 11,497 12,675 13,822 15,174 16,400 17,967 19,709 21,646 23,801 Balance 0 0 0 0 0 0 0 0 0 0 Counterpart Contribution
Amount 2 2 15 16 22 % to Total
Expenditures 0.02% 0.02% 0.12% 0.12% 0.14% Project O&M
Amount
33 35 37 39 41 % to Recurrent Expenditure
0.29% 0.27% 0.26% 0.24% 0.22%
% to Total Expenditures
0.20% 0.20% 0.19% 0.18% 0.17%
Sub-Loan Debt Service
Amount
13 13 14 14 15 % to Total Expenditures
0.08% 0.07% 0.07% 0.07% 0.06%
Source: Consultant’s estimates
VI. DAK LAK
A. Past Financial Condition
29. The financial performance of Dak Lak province for the period 2011-2015 (see Appendix 3) was reviewed and analyzed. Dak Lak is one of the provinces that are beneficiaries of the national equalization budget system; their budgets show no deficits as they are balanced by central budget.
30. During the 5 year period, domestic revenue averaged 28 % of total revenue. It was highest in 2011 at 34% and lowest in 2015 at 25%. Domestic revenue declined at an annual average of 2% during the period.
31. Domestic revenue covered an average of 38% of recurrent expenditures during the 5 year period. It was highest in 2012 at 53% and lowest in 2014 at 32%.
32. Recurrent expenditures averaged 78% of total expenditures during the 5 year period. It was highest in 2011 at 88% and lowest in 2012 at 54%. Recurrent expenditures grew at an annual average of 1% during the period.
33. Development investment averaged 7% of total expenditures during the 5 year period. It was highest in 2015 at 17% and lowest in years 2011, 2013 and 2014 at 0%.
34. During the 5 year period, support from central budget averaged at 53% of total revenue. It was highest in 2015 at 63% and lowest in 2011 at 43%. Support from central budget grew at an annual average of 16% during the period.
Financial Analysis (Supplementary)
Provincial Peoples’ Committee of Kon Tum, Gia Lai, Dak Lak, Dak Nong and Binh Phuoc
June 2016 7
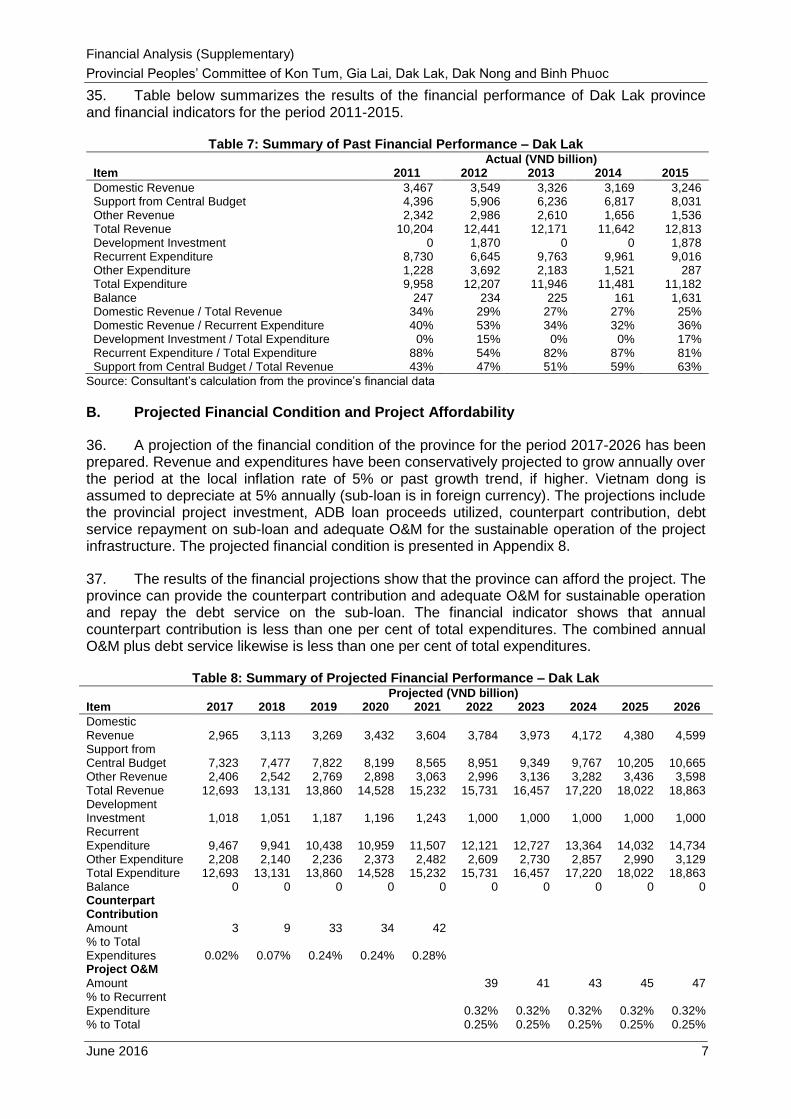
35. Table below summarizes the results of the financial performance of Dak Lak province and financial indicators for the period 2011-2015.
Table 7: Summary of Past Financial Performance – Dak Lak
Actual (VND billion)
Item 2011 2012 2013 2014 2015
Domestic Revenue 3,467 3,549 3,326 3,169 3,246 Support from Central Budget 4,396 5,906 6,236 6,817 8,031 Other Revenue 2,342 2,986 2,610 1,656 1,536 Total Revenue 10,204 12,441 12,171 11,642 12,813 Development Investment 0 1,870 0 0 1,878 Recurrent Expenditure 8,730 6,645 9,763 9,961 9,016 Other Expenditure 1,228 3,692 2,183 1,521 287 Total Expenditure 9,958 12,207 11,946 11,481 11,182 Balance 247 234 225 161 1,631 Domestic Revenue / Total Revenue 34% 29% 27% 27% 25% Domestic Revenue / Recurrent Expenditure 40% 53% 34% 32% 36% Development Investment / Total Expenditure 0% 15% 0% 0% 17% Recurrent Expenditure / Total Expenditure 88% 54% 82% 87% 81% Support from Central Budget / Total Revenue 43% 47% 51% 59% 63%
Source: Consultant’s calculation from the province’s financial data
B. Projected Financial Condition and Project Affordability
36. A projection of the financial condition of the province for the period 2017-2026 has been prepared. Revenue and expenditures have been conservatively projected to grow annually over the period at the local inflation rate of 5% or past growth trend, if higher. Vietnam dong is assumed to depreciate at 5% annually (sub-loan is in foreign currency). The projections include the provincial project investment, ADB loan proceeds utilized, counterpart contribution, debt service repayment on sub-loan and adequate O&M for the sustainable operation of the project infrastructure. The projected financial condition is presented in Appendix 8.
37. The results of the financial projections show that the province can afford the project. The province can provide the counterpart contribution and adequate O&M for sustainable operation and repay the debt service on the sub-loan. The financial indicator shows that annual counterpart contribution is less than one per cent of total expenditures. The combined annual O&M plus debt service likewise is less than one per cent of total expenditures.
Table 8: Summary of Projected Financial Performance – Dak Lak Projected (VND billion) Item 2017 2018 2019 2020 2021 2022 2023 2024 2025 2026
Domestic Revenue 2,965 3,113 3,269 3,432 3,604 3,784 3,973 4,172 4,380 4,599 Support from Central Budget 7,323 7,477 7,822 8,199 8,565 8,951 9,349 9,767 10,205 10,665 Other Revenue 2,406 2,542 2,769 2,898 3,063 2,996 3,136 3,282 3,436 3,598 Total Revenue 12,693 13,131 13,860 14,528 15,232 15,731 16,457 17,220 18,022 18,863 Development Investment 1,018 1,051 1,187 1,196 1,243 1,000 1,000 1,000 1,000 1,000 Recurrent Expenditure 9,467 9,941 10,438 10,959 11,507 12,121 12,727 13,364 14,032 14,734 Other Expenditure 2,208 2,140 2,236 2,373 2,482 2,609 2,730 2,857 2,990 3,129 Total Expenditure 12,693 13,131 13,860 14,528 15,232 15,731 16,457 17,220 18,022 18,863 Balance 0 0 0 0 0 0 0 0 0 0 Counterpart Contribution
Amount 3 9 33 34 42 % to Total
Expenditures 0.02% 0.07% 0.24% 0.24% 0.28% Project O&M
Amount
39 41 43 45 47 % to Recurrent Expenditure
0.32% 0.32% 0.32% 0.32% 0.32%
% to Total
0.25% 0.25% 0.25% 0.25% 0.25%
Financial Analysis (Supplementary)
Provincial Peoples’ Committee of Kon Tum, Gia Lai, Dak Lak, Dak Nong and Binh Phuoc
June 2016 8
Projected (VND billion) Item 2017 2018 2019 2020 2021 2022 2023 2024 2025 2026
Expenditures Sub-Loan Debt Service
Amount
13 14 14 15 15 % to Total Expenditures
0.09% 0.08% 0.08% 0.08% 0.08%
Source: Consultant’s estimates
VII. DAK NONG
A. Past Financial Condition
38. The financial performance of Dak Nong province for the period 2011-2015 (see Appendix 4) was reviewed and analyzed. Dak Nong is one of the provinces that are beneficiaries of the national equalization budget system; their budgets show no deficits as they are balanced by central budget.
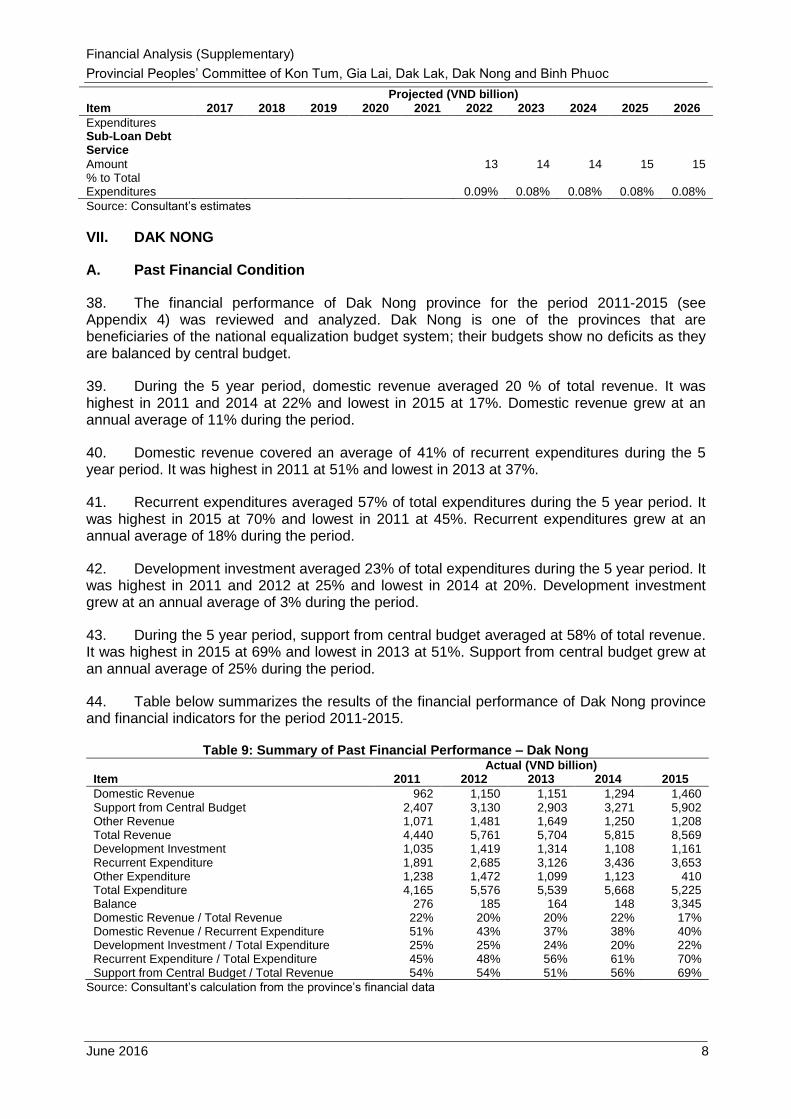
39. During the 5 year period, domestic revenue averaged 20 % of total revenue. It was highest in 2011 and 2014 at 22% and lowest in 2015 at 17%. Domestic revenue grew at an annual average of 11% during the period.
40. Domestic revenue covered an average of 41% of recurrent expenditures during the 5 year period. It was highest in 2011 at 51% and lowest in 2013 at 37%.
41. Recurrent expenditures averaged 57% of total expenditures during the 5 year period. It was highest in 2015 at 70% and lowest in 2011 at 45%. Recurrent expenditures grew at an annual average of 18% during the period.
42. Development investment averaged 23% of total expenditures during the 5 year period. It was highest in 2011 and 2012 at 25% and lowest in 2014 at 20%. Development investment grew at an annual average of 3% during the period.
43. During the 5 year period, support from central budget averaged at 58% of total revenue. It was highest in 2015 at 69% and lowest in 2013 at 51%. Support from central budget grew at an annual average of 25% during the period.
44. Table below summarizes the results of the financial performance of Dak Nong province and financial indicators for the period 2011-2015.
Table 9: Summary of Past Financial Performance – Dak Nong
Actual (VND billion)
Item 2011 2012 2013 2014 2015
Domestic Revenue 962 1,150 1,151 1,294 1,460 Support from Central Budget 2,407 3,130 2,903 3,271 5,902 Other Revenue 1,071 1,481 1,649 1,250 1,208 Total Revenue 4,440 5,761 5,704 5,815 8,569 Development Investment 1,035 1,419 1,314 1,108 1,161 Recurrent Expenditure 1,891 2,685 3,126 3,436 3,653 Other Expenditure 1,238 1,472 1,099 1,123 410 Total Expenditure 4,165 5,576 5,539 5,668 5,225 Balance 276 185 164 148 3,345 Domestic Revenue / Total Revenue 22% 20% 20% 22% 17% Domestic Revenue / Recurrent Expenditure 51% 43% 37% 38% 40% Development Investment / Total Expenditure 25% 25% 24% 20% 22% Recurrent Expenditure / Total Expenditure 45% 48% 56% 61% 70% Support from Central Budget / Total Revenue 54% 54% 51% 56% 69%
Source: Consultant’s calculation from the province’s financial data
Financial Analysis (Supplementary)
Provincial Peoples’ Committee of Kon Tum, Gia Lai, Dak Lak, Dak Nong and Binh Phuoc
June 2016 9
B. Projected Financial Condition and Project Affordability
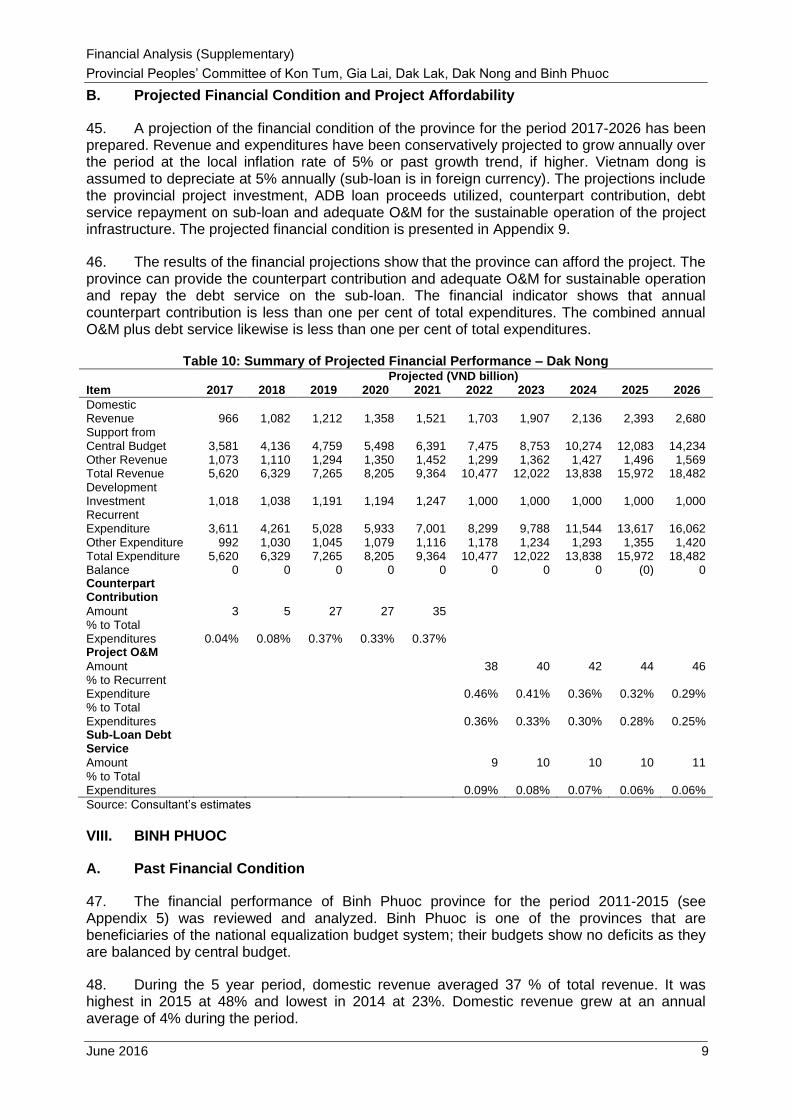
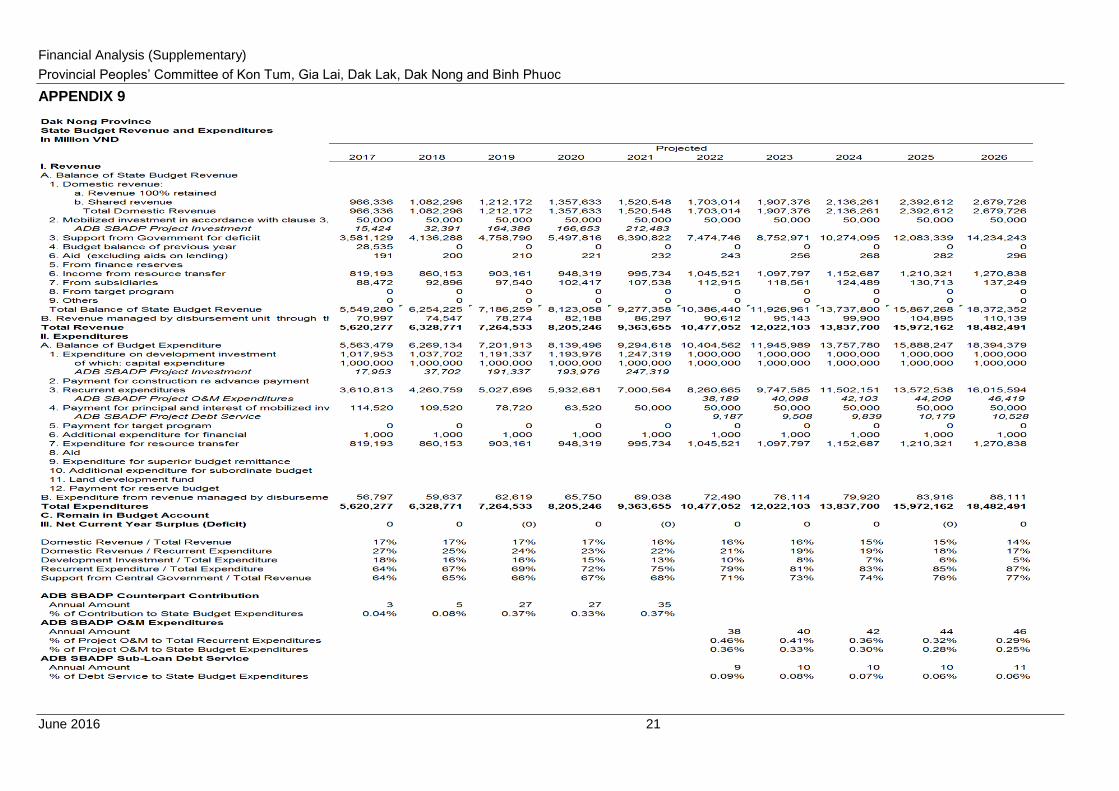
45. A projection of the financial condition of the province for the period 2017-2026 has been prepared. Revenue and expenditures have been conservatively projected to grow annually over the period at the local inflation rate of 5% or past growth trend, if higher. Vietnam dong is assumed to depreciate at 5% annually (sub-loan is in foreign currency). The projections include the provincial project investment, ADB loan proceeds utilized, counterpart contribution, debt service repayment on sub-loan and adequate O&M for the sustainable operation of the project infrastructure. The projected financial condition is presented in Appendix 9.
46. The results of the financial projections show that the province can afford the project. The province can provide the counterpart contribution and adequate O&M for sustainable operation and repay the debt service on the sub-loan. The financial indicator shows that annual counterpart contribution is less than one per cent of total expenditures. The combined annual O&M plus debt service likewise is less than one per cent of total expenditures.
Table 10: Summary of Projected Financial Performance – Dak Nong Projected (VND billion) Item 2017 2018 2019 2020 2021 2022 2023 2024 2025 2026
Domestic Revenue 966 1,082 1,212 1,358 1,521 1,703 1,907 2,136 2,393 2,680 Support from Central Budget 3,581 4,136 4,759 5,498 6,391 7,475 8,753 10,274 12,083 14,234 Other Revenue 1,073 1,110 1,294 1,350 1,452 1,299 1,362 1,427 1,496 1,569 Total Revenue 5,620 6,329 7,265 8,205 9,364 10,477 12,022 13,838 15,972 18,482 Development Investment 1,018 1,038 1,191 1,194 1,247 1,000 1,000 1,000 1,000 1,000 Recurrent Expenditure 3,611 4,261 5,028 5,933 7,001 8,299 9,788 11,544 13,617 16,062 Other Expenditure 992 1,030 1,045 1,079 1,116 1,178 1,234 1,293 1,355 1,420 Total Expenditure 5,620 6,329 7,265 8,205 9,364 10,477 12,022 13,838 15,972 18,482 Balance 0 0 0 0 0 0 0 0 (0) 0 Counterpart Contribution
Amount 3 5 27 27 35 % to Total
Expenditures 0.04% 0.08% 0.37% 0.33% 0.37% Project O&M
Amount
38 40 42 44 46 % to Recurrent Expenditure
0.46% 0.41% 0.36% 0.32% 0.29%
% to Total Expenditures
0.36% 0.33% 0.30% 0.28% 0.25%
Sub-Loan Debt Service
Amount
9 10 10 10 11 % to Total Expenditures
0.09% 0.08% 0.07% 0.06% 0.06%
Source: Consultant’s estimates
VIII. BINH PHUOC
A. Past Financial Condition
47. The financial performance of Binh Phuoc province for the period 2011-2015 (see Appendix 5) was reviewed and analyzed. Binh Phuoc is one of the provinces that are beneficiaries of the national equalization budget system; their budgets show no deficits as they are balanced by central budget.
48. During the 5 year period, domestic revenue averaged 37 % of total revenue. It was highest in 2015 at 48% and lowest in 2014 at 23%. Domestic revenue grew at an annual average of 4% during the period.
Financial Analysis (Supplementary)
Provincial Peoples’ Committee of Kon Tum, Gia Lai, Dak Lak, Dak Nong and Binh Phuoc
June 2016 10
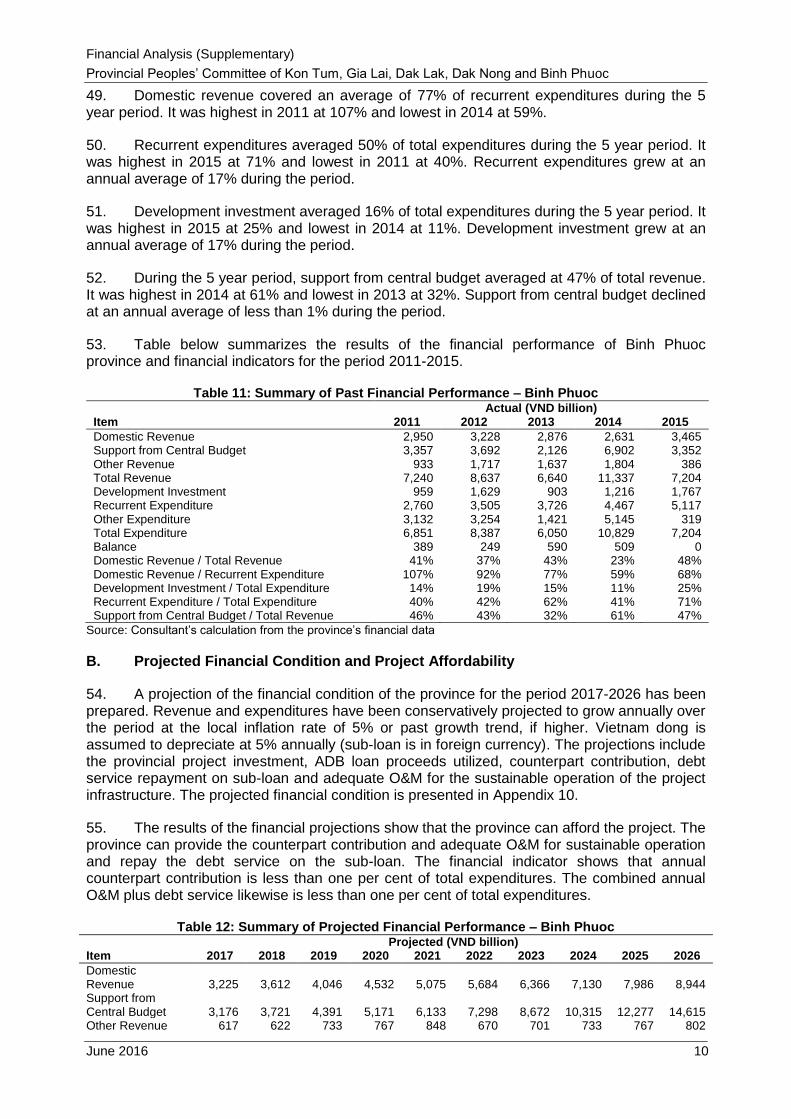
49. Domestic revenue covered an average of 77% of recurrent expenditures during the 5 year period. It was highest in 2011 at 107% and lowest in 2014 at 59%.
50. Recurrent expenditures averaged 50% of total expenditures during the 5 year period. It was highest in 2015 at 71% and lowest in 2011 at 40%. Recurrent expenditures grew at an annual average of 17% during the period.
51. Development investment averaged 16% of total expenditures during the 5 year period. It was highest in 2015 at 25% and lowest in 2014 at 11%. Development investment grew at an annual average of 17% during the period.
52. During the 5 year period, support from central budget averaged at 47% of total revenue. It was highest in 2014 at 61% and lowest in 2013 at 32%. Support from central budget declined at an annual average of less than 1% during the period.
53. Table below summarizes the results of the financial performance of Binh Phuoc province and financial indicators for the period 2011-2015.
Table 11: Summary of Past Financial Performance – Binh Phuoc
Actual (VND billion)
Item 2011 2012 2013 2014 2015
Domestic Revenue 2,950 3,228 2,876 2,631 3,465 Support from Central Budget 3,357 3,692 2,126 6,902 3,352 Other Revenue 933 1,717 1,637 1,804 386 Total Revenue 7,240 8,637 6,640 11,337 7,204 Development Investment 959 1,629 903 1,216 1,767 Recurrent Expenditure 2,760 3,505 3,726 4,467 5,117 Other Expenditure 3,132 3,254 1,421 5,145 319 Total Expenditure 6,851 8,387 6,050 10,829 7,204 Balance 389 249 590 509 0 Domestic Revenue / Total Revenue 41% 37% 43% 23% 48% Domestic Revenue / Recurrent Expenditure 107% 92% 77% 59% 68% Development Investment / Total Expenditure 14% 19% 15% 11% 25% Recurrent Expenditure / Total Expenditure 40% 42% 62% 41% 71% Support from Central Budget / Total Revenue 46% 43% 32% 61% 47%
Source: Consultant’s calculation from the province’s financial data
B. Projected Financial Condition and Project Affordability
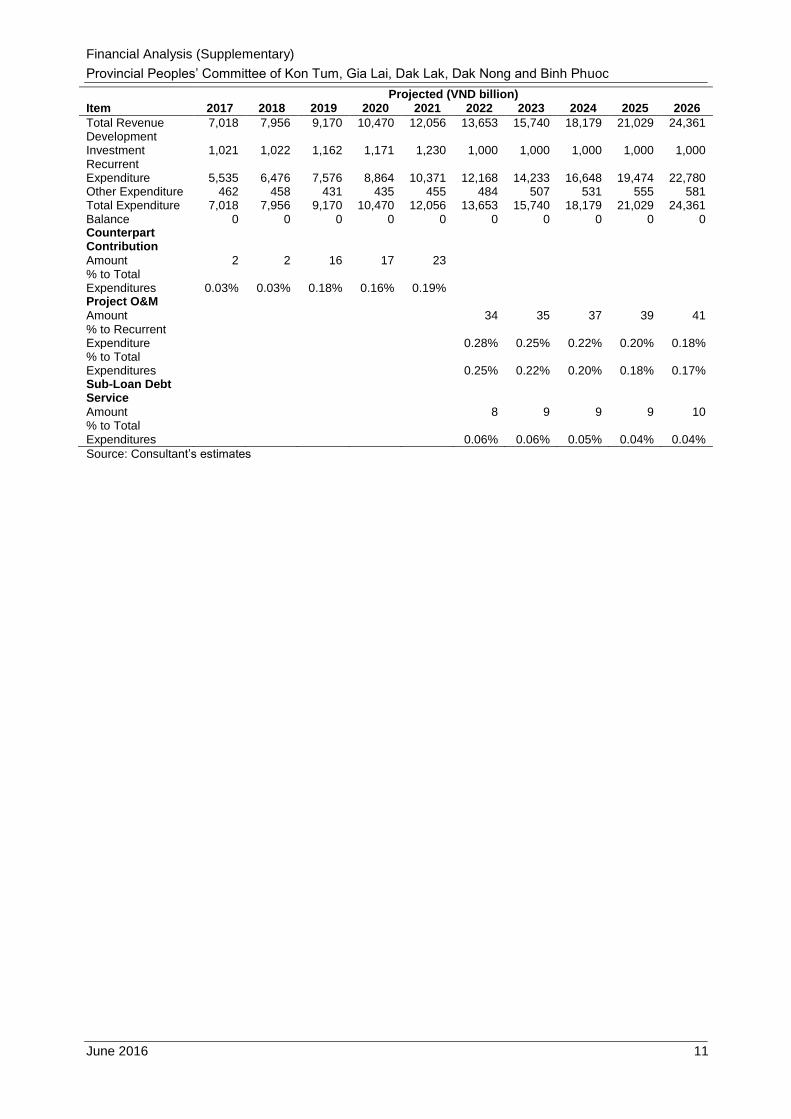
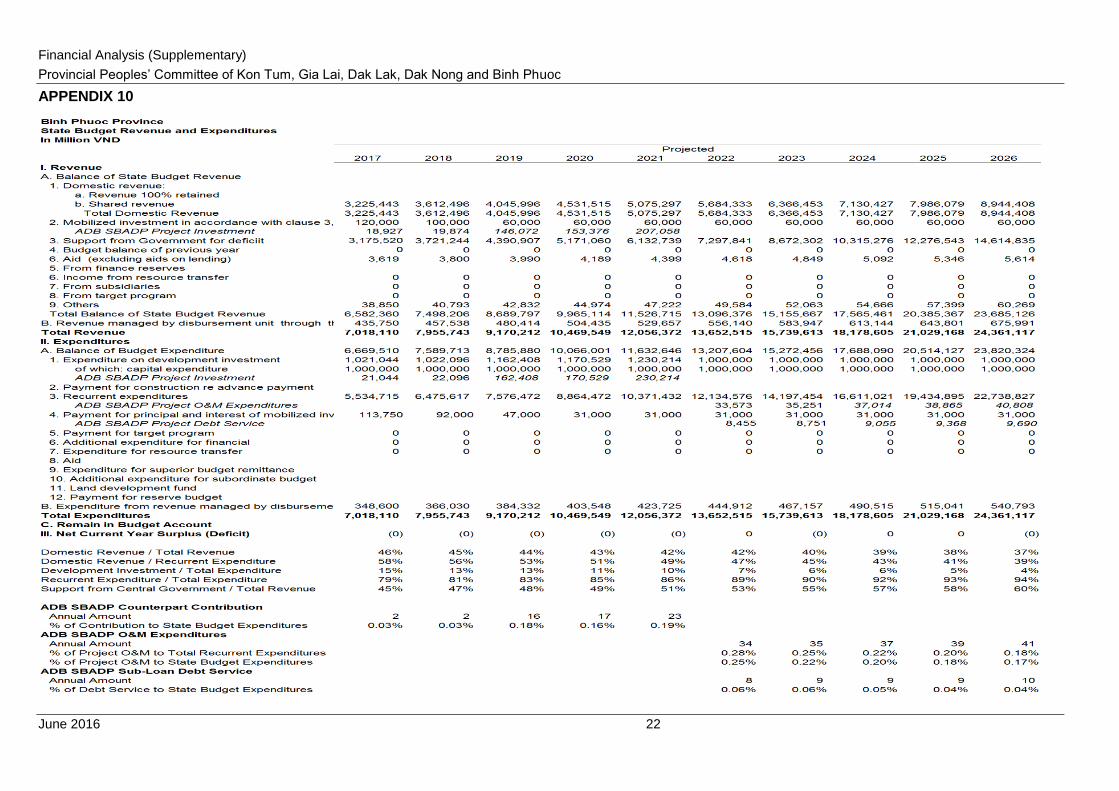
54. A projection of the financial condition of the province for the period 2017-2026 has been prepared. Revenue and expenditures have been conservatively projected to grow annually over the period at the local inflation rate of 5% or past growth trend, if higher. Vietnam dong is assumed to depreciate at 5% annually (sub-loan is in foreign currency). The projections include the provincial project investment, ADB loan proceeds utilized, counterpart contribution, debt service repayment on sub-loan and adequate O&M for the sustainable operation of the project infrastructure. The projected financial condition is presented in Appendix 10.
55. The results of the financial projections show that the province can afford the project. The province can provide the counterpart contribution and adequate O&M for sustainable operation and repay the debt service on the sub-loan. The financial indicator shows that annual counterpart contribution is less than one per cent of total expenditures. The combined annual O&M plus debt service likewise is less than one per cent of total expenditures.
Table 12: Summary of Projected Financial Performance – Binh Phuoc Projected (VND billion) Item 2017 2018 2019 2020 2021 2022 2023 2024 2025 2026
Domestic Revenue 3,225 3,612 4,046 4,532 5,075 5,684 6,366 7,130 7,986 8,944 Support from Central Budget 3,176 3,721 4,391 5,171 6,133 7,298 8,672 10,315 12,277 14,615 Other Revenue 617 622 733 767 848 670 701 733 767 802
Financial Analysis (Supplementary)
Provincial Peoples’ Committee of Kon Tum, Gia Lai, Dak Lak, Dak Nong and Binh Phuoc
June 2016 11
Projected (VND billion) Item 2017 2018 2019 2020 2021 2022 2023 2024 2025 2026
Total Revenue 7,018 7,956 9,170 10,470 12,056 13,653 15,740 18,179 21,029 24,361 Development Investment 1,021 1,022 1,162 1,171 1,230 1,000 1,000 1,000 1,000 1,000 Recurrent Expenditure 5,535 6,476 7,576 8,864 10,371 12,168 14,233 16,648 19,474 22,780 Other Expenditure 462 458 431 435 455 484 507 531 555 581 Total Expenditure 7,018 7,956 9,170 10,470 12,056 13,653 15,740 18,179 21,029 24,361 Balance 0 0 0 0 0 0 0 0 0 0 Counterpart Contribution
Amount 2 2 16 17 23 % to Total
Expenditures 0.03% 0.03% 0.18% 0.16% 0.19% Project O&M
Amount
34 35 37 39 41 % to Recurrent Expenditure
0.28% 0.25% 0.22% 0.20% 0.18%
% to Total Expenditures
0.25% 0.22% 0.20% 0.18% 0.17%
Sub-Loan Debt Service
Amount
8 9 9 9 10 % to Total Expenditures
0.06% 0.06% 0.05% 0.04% 0.04%
Source: Consultant’s estimates
Financial Analysis (Supplementary)
Provincial Peoples’ Committee of Kon Tum, Gia Lai, Dak Lak, Dak Nong and Binh Phuoc
June 2016 12
APPENDICES
Financial Analysis (Supplementary)
Provincial Peoples’ Committee of Kon Tum, Gia Lai, Dak Lak, Dak Nong and Binh Phuoc
June 2016 13
APPENDIX 1
Financial Analysis (Supplementary)
Provincial Peoples’ Committee of Kon Tum, Gia Lai, Dak Lak, Dak Nong and Binh Phuoc
June 2016 14
APPENDIX 2
Financial Analysis (Supplementary)
Provincial Peoples’ Committee of Kon Tum, Gia Lai, Dak Lak, Dak Nong and Binh Phuoc
June 2016 15
APPENDIX 3
Financial Analysis (Supplementary)
Provincial Peoples’ Committee of Kon Tum, Gia Lai, Dak Lak, Dak Nong and Binh Phuoc
June 2016 16
APPENDIX 4
Financial Analysis (Supplementary)
Provincial Peoples’ Committee of Kon Tum, Gia Lai, Dak Lak, Dak Nong and Binh Phuoc
June 2016 17
APPENDIX 5
Financial Analysis (Supplementary)
Provincial Peoples’ Committee of Kon Tum, Gia Lai, Dak Lak, Dak Nong and Binh Phuoc
June 2016 18
APPENDIX 6
Financial Analysis (Supplementary)
Provincial Peoples’ Committee of Kon Tum, Gia Lai, Dak Lak, Dak Nong and Binh Phuoc
June 2016 19
APPENDIX 7
Financial Analysis (Supplementary)
Provincial Peoples’ Committee of Kon Tum, Gia Lai, Dak Lak, Dak Nong and Binh Phuoc
June 2016 20
APPENDIX 8
Financial Analysis (Supplementary)
Provincial Peoples’ Committee of Kon Tum, Gia Lai, Dak Lak, Dak Nong and Binh Phuoc
June 2016 21
APPENDIX 9
Financial Analysis (Supplementary)
Provincial Peoples’ Committee of Kon Tum, Gia Lai, Dak Lak, Dak Nong and Binh Phuoc
June 2016 22
APPENDIX 10