Embed Size (px)
Citation preview
Detecting and Avoiding Errors in Clinical Pathology Labs with Special
Emphasis on Lab Automation
How Information Technology and Automation Can Positively Impact Clinical Laboratory
Processes and Quality
Charles D. Hawker, PhD, MBA, FACBProfessor (Adjunct) of Pathology, Univ. of Utah School of Medicine
Scientific Director, Automation and Special Projects, ARUP Laboratories
labinfotechsummitMarch 16, 2009
OUTLINE OF DISCUSSIONPre-Analytic• Guiding physicians to order correct tests• Laboratory ordering processes• Specimen or shipment tracking (referral labs)• Accessioning processes• Automation of aliquotting, quality inspections, transport,
and sortingAnalytic• Middleware, QC, autoverification, special calculated
results, reflexive testingPost-Analytic• Specimen archive and retrieval (add or repeat tests, R&D)• Finished specimen discardSummary
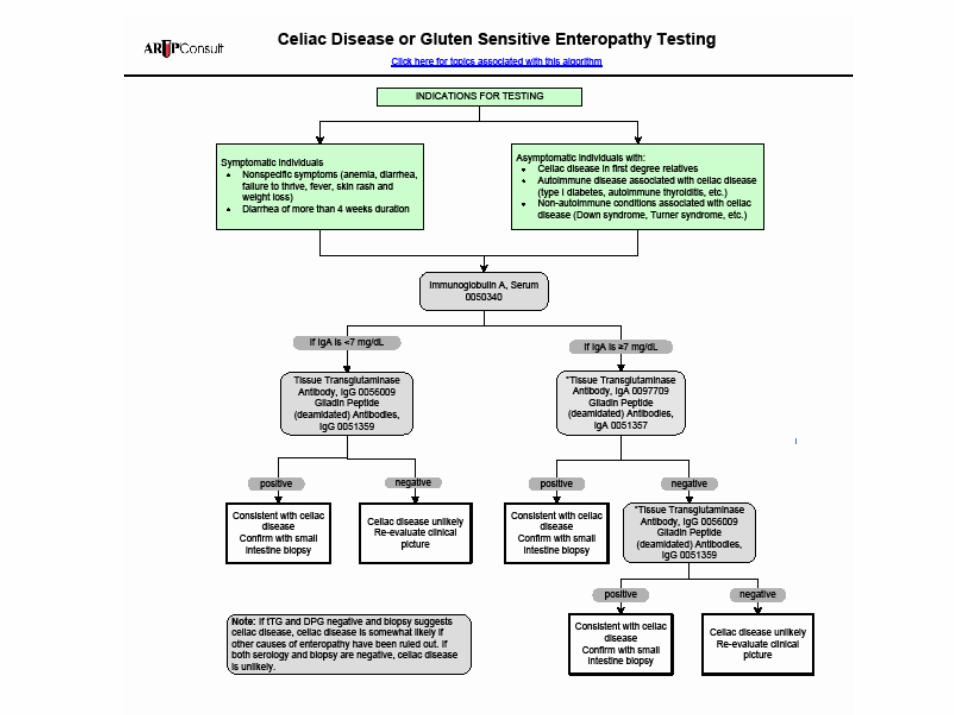
Pre-Analytic ActivitiesGuiding Physicians to Order
Correct TestsMosby’s Diagnostic and Laboratory Test Reference
available at www.elsevier.comNACB Guidelines www.nacb.org
www.webmd.comwww.labtestsonline.orgwww.arupconsult.com
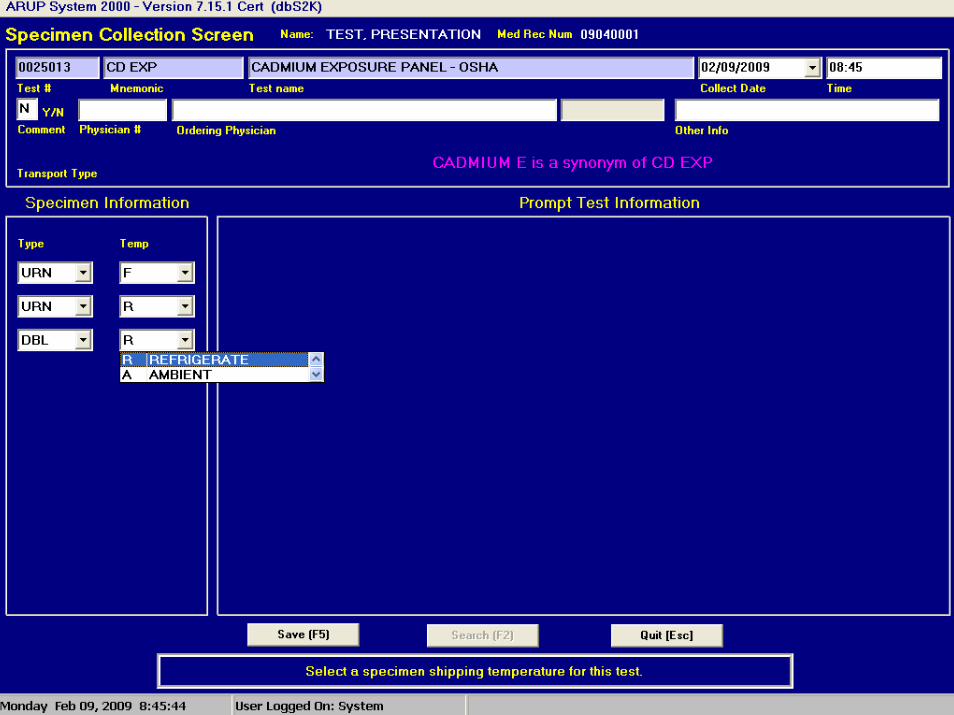
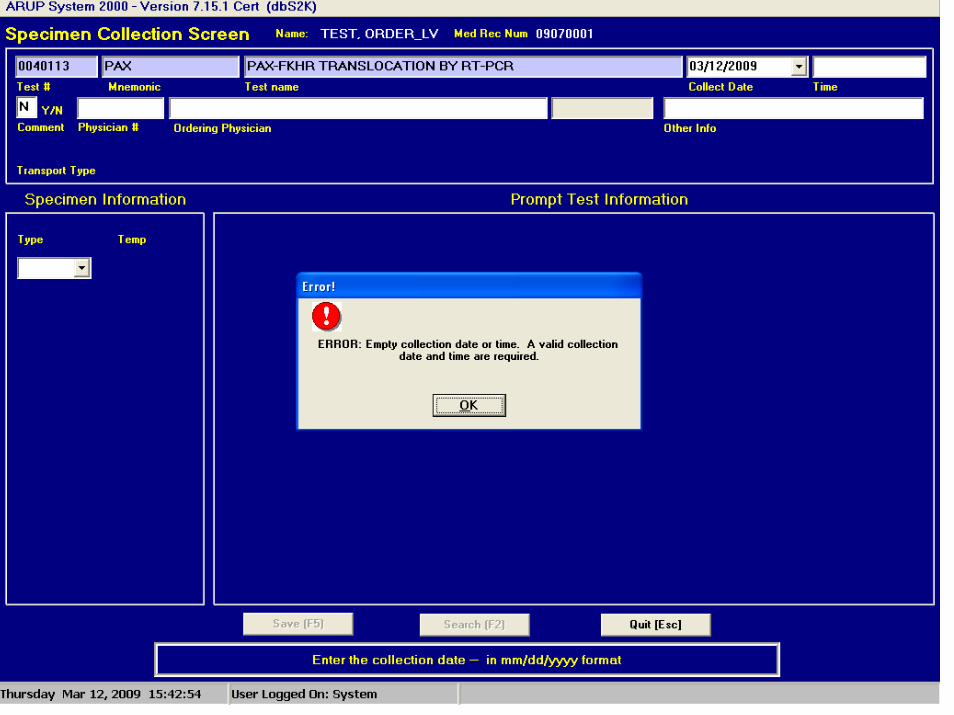
Pre-Analytic Activities
Laboratory Ordering Processese.g., ARUP System 2000
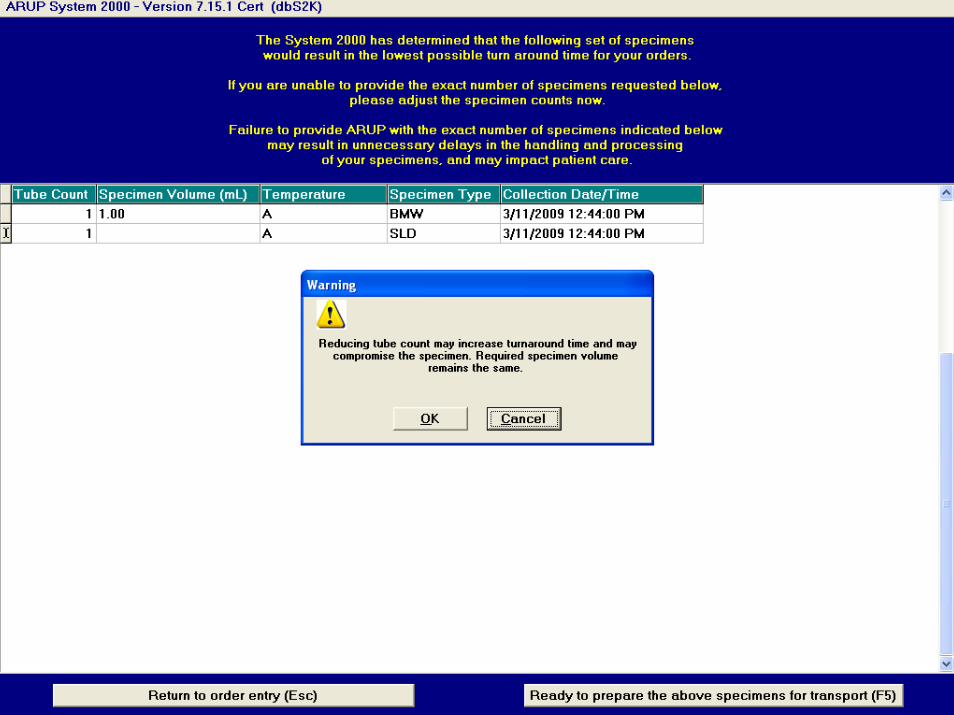
Pre-Analytic Activities
Specimen or Shipment Tracking(Referral Labs)
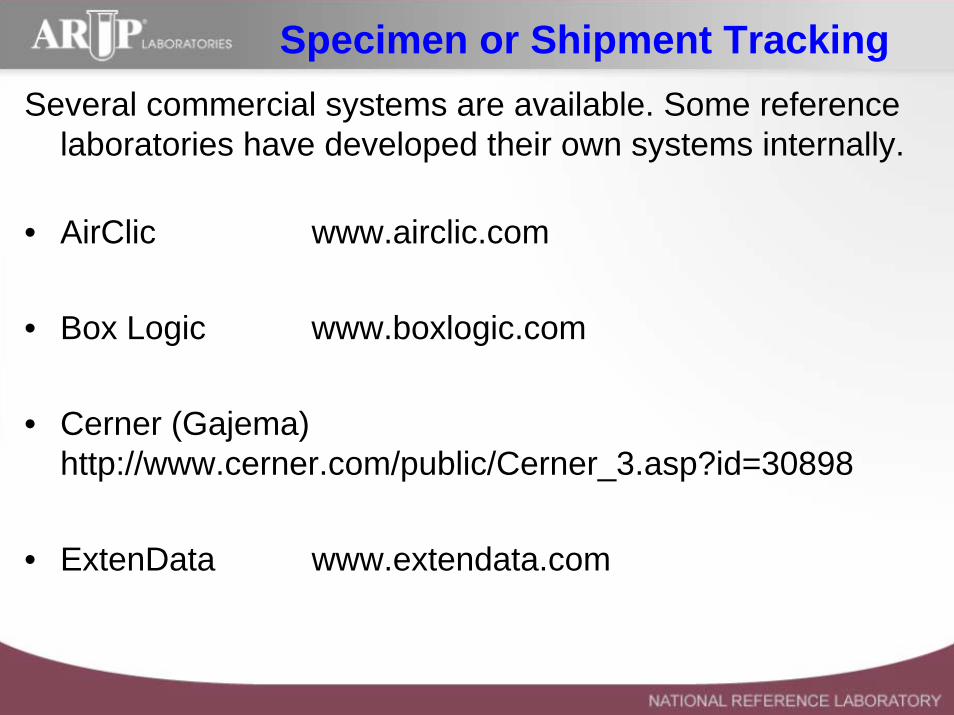
Specimen or Shipment TrackingSeveral commercial systems are available. Some reference
laboratories have developed their own systems internally.
• AirClic www.airclic.com
• Box Logic www.boxlogic.com
• Cerner (Gajema) http://www.cerner.com/public/Cerner_3.asp?id=30898
• ExtenData www.extendata.com
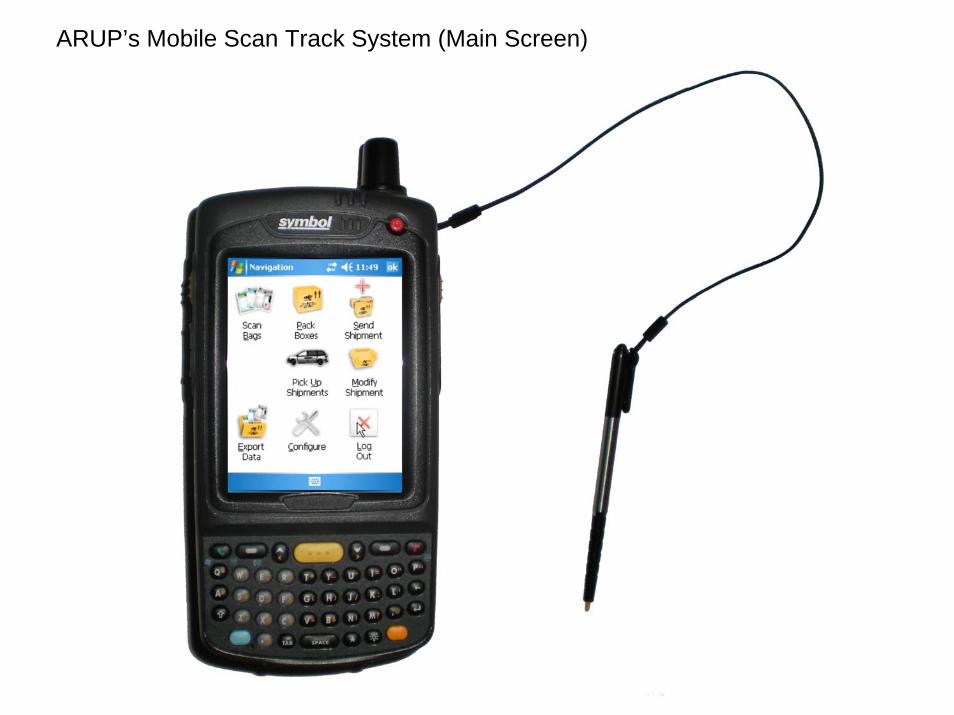
ARUP’s Mobile Scan Track System (Main Screen)
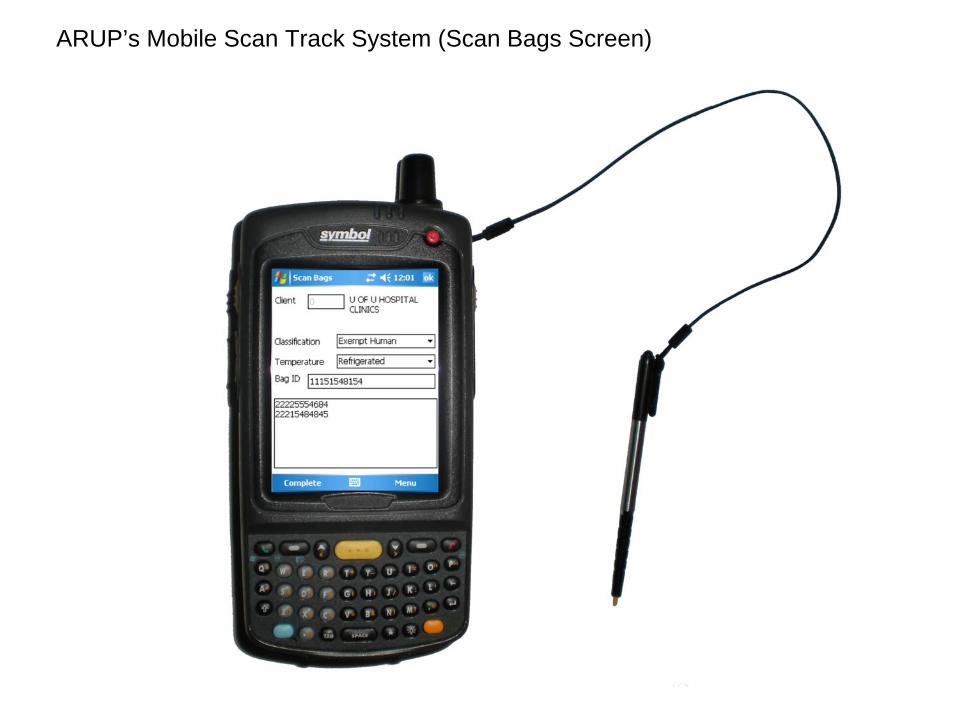
ARUP’s Mobile Scan Track System (Scan Bags Screen)
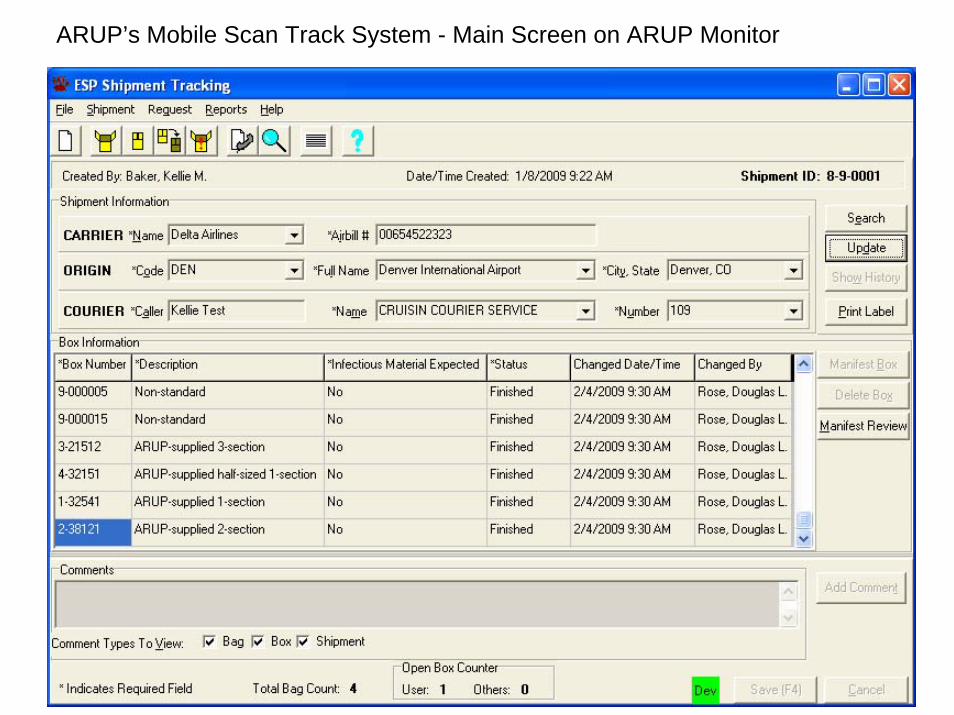
ARUP’s Mobile Scan Track System - Main Screen on ARUP Monitor
Pre-Analytic Activities
Accessioning Processes
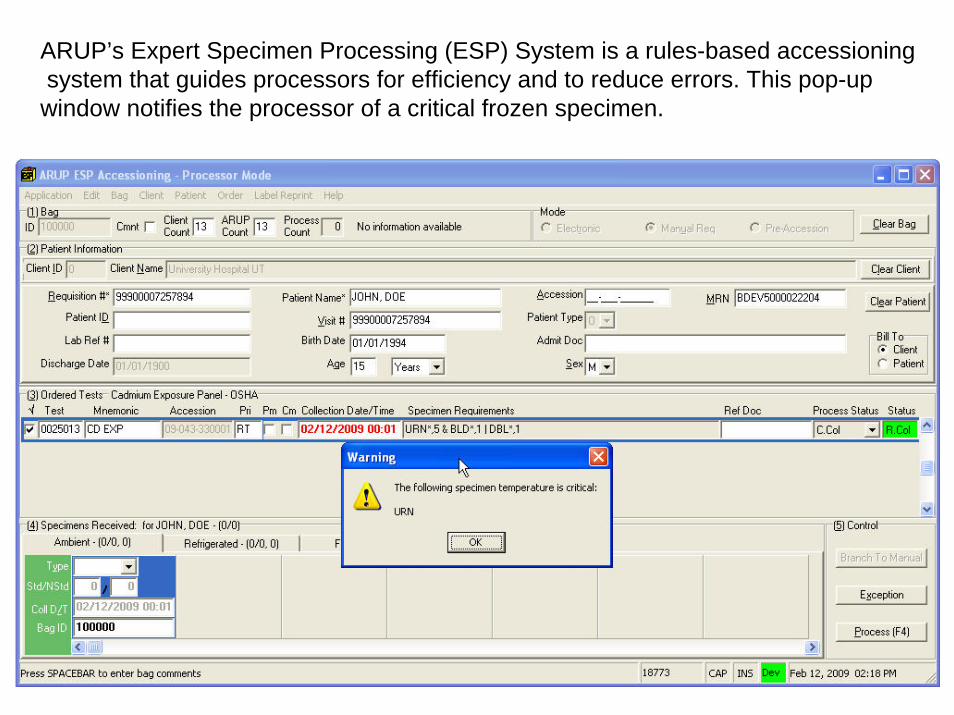
ARUP’s Expert Specimen Processing (ESP) System is a rules-based accessioningsystem that guides processors for efficiency and to reduce errors. This pop-up window notifies the processor of a critical frozen specimen.
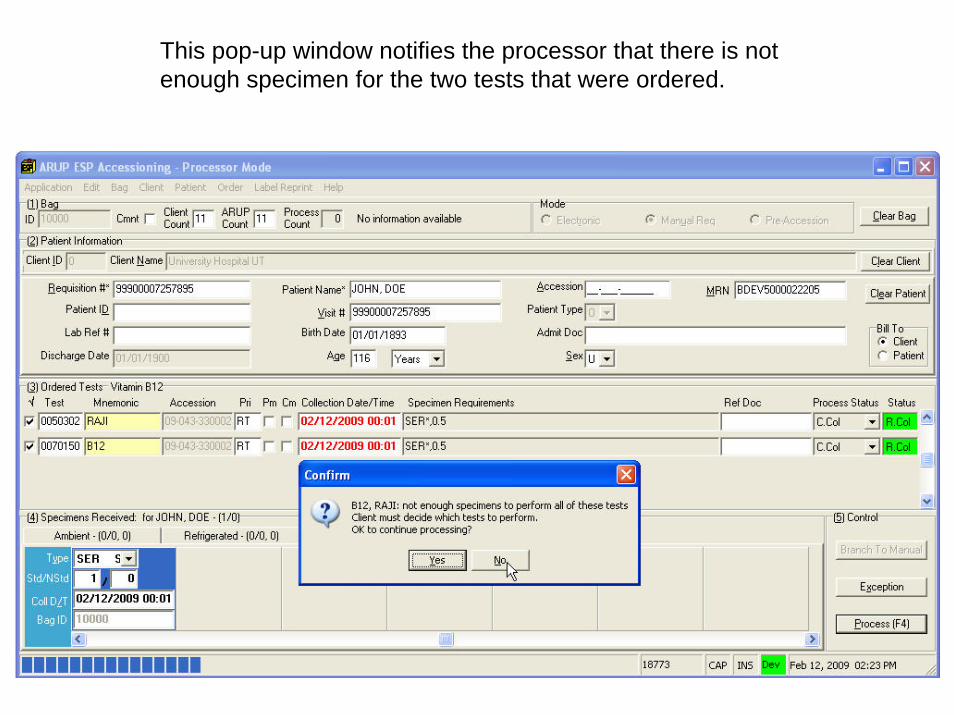
This pop-up window notifies the processor that there is not enough specimen for the two tests that were ordered.
Pre-Analytic Activities
Automation
Automated Aliquotting
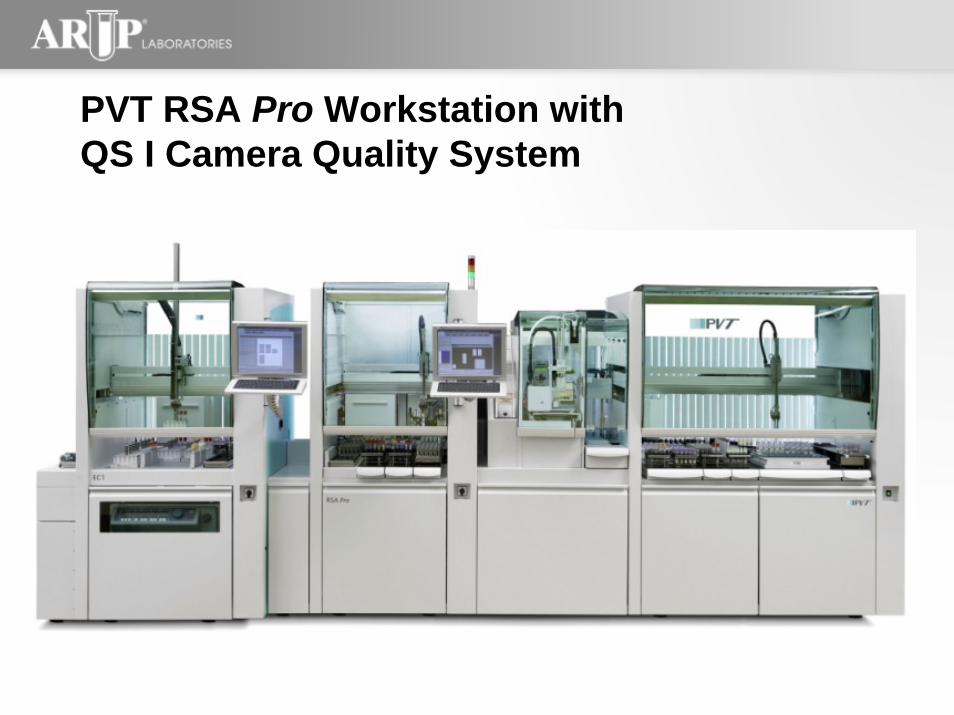
PVT RSA Pro Workstation withQS I Camera Quality System
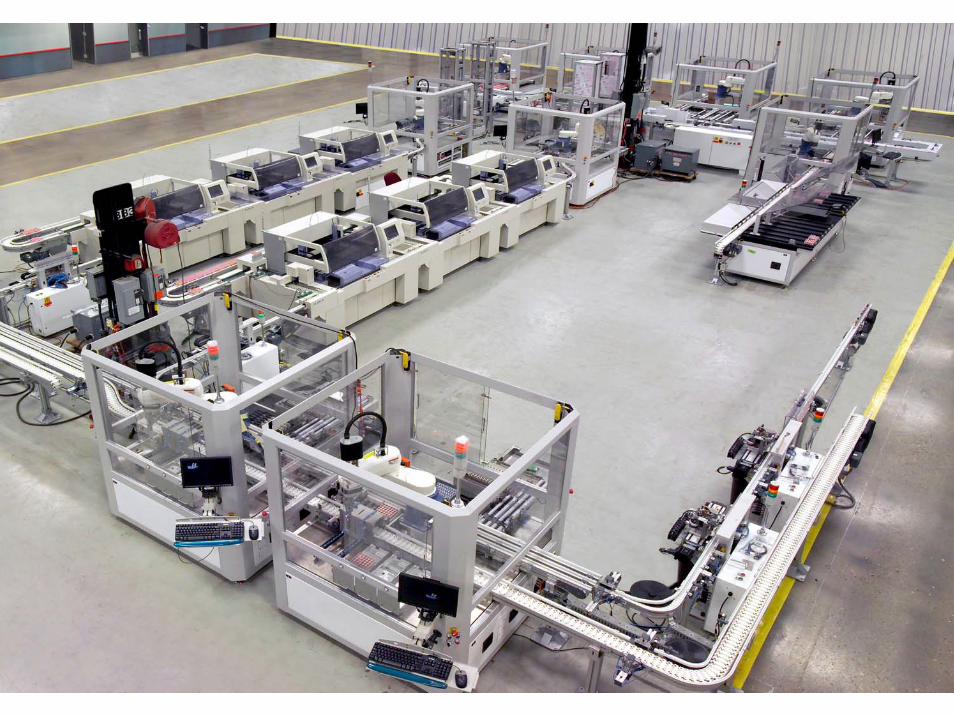
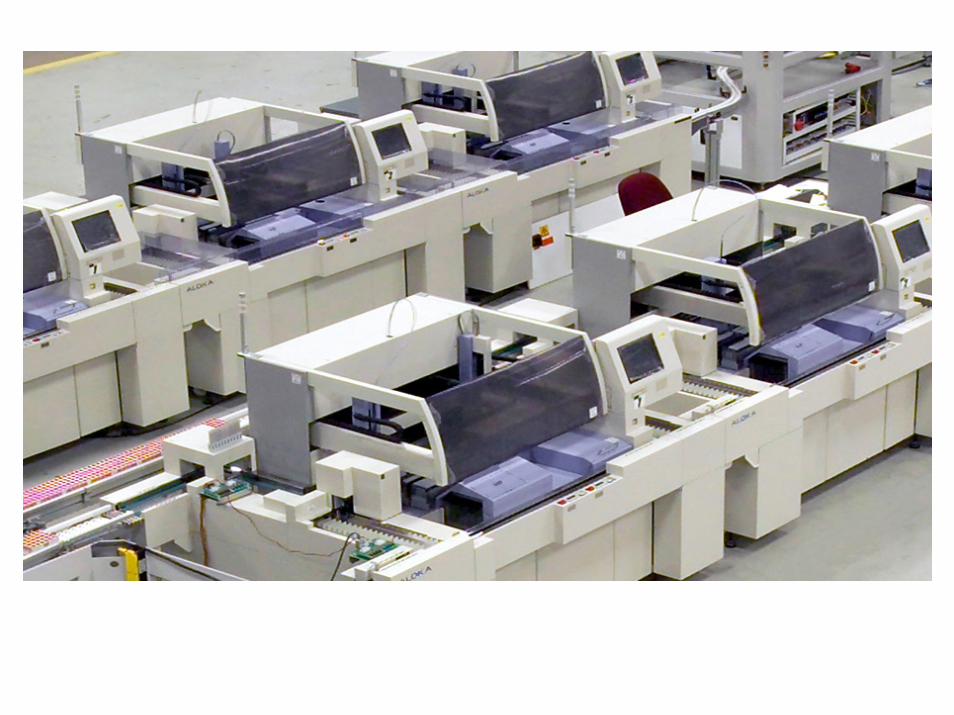
Pre-Analytic Activities
Automation
Automated Transport and Sorting

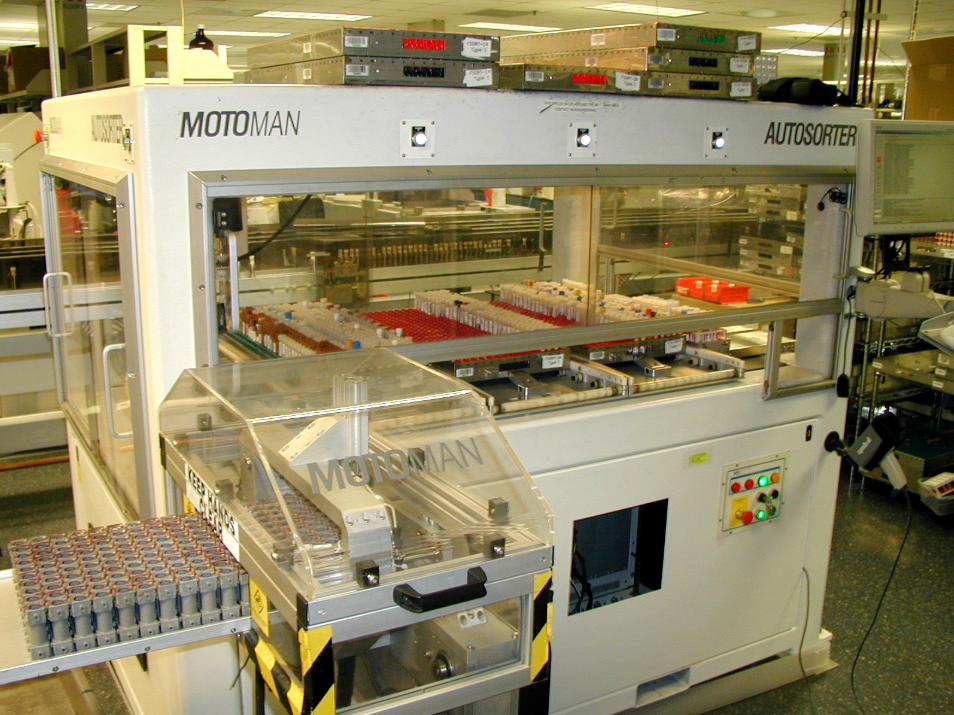
Pre-Analytic Activities
Automation
Automation of Quality InspectionsCommercially Available Systems
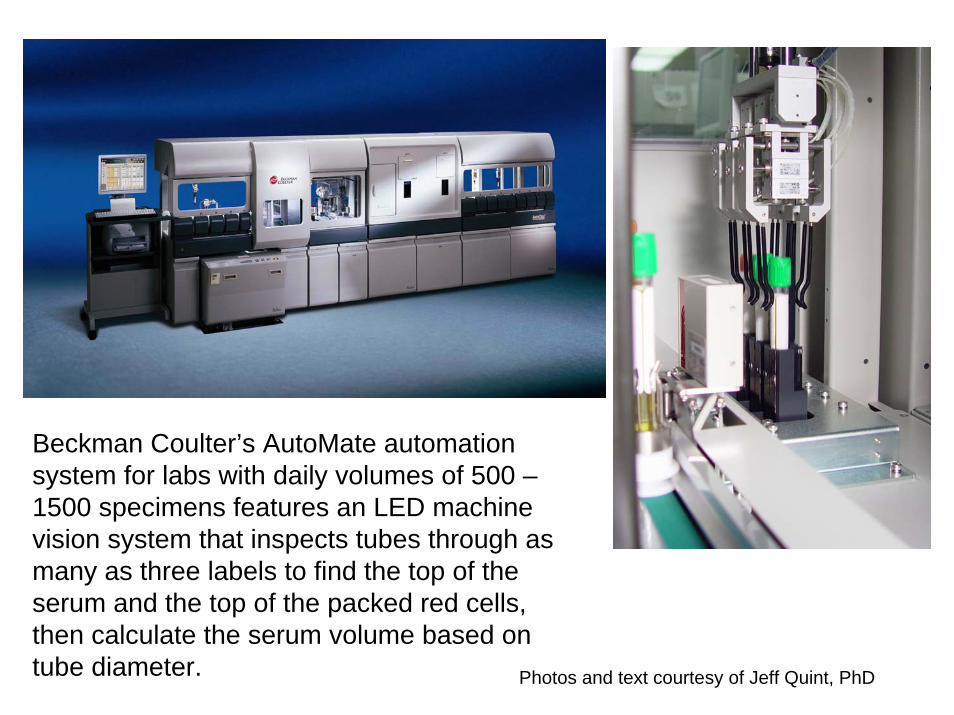
Beckman Coulter’s AutoMate automation system for labs with daily volumes of 500 –1500 specimens features an LED machine vision system that inspects tubes through as many as three labels to find the top of the serum and the top of the packed red cells, then calculate the serum volume based on tube diameter. Photos and text courtesy of Jeff Quint, PhD
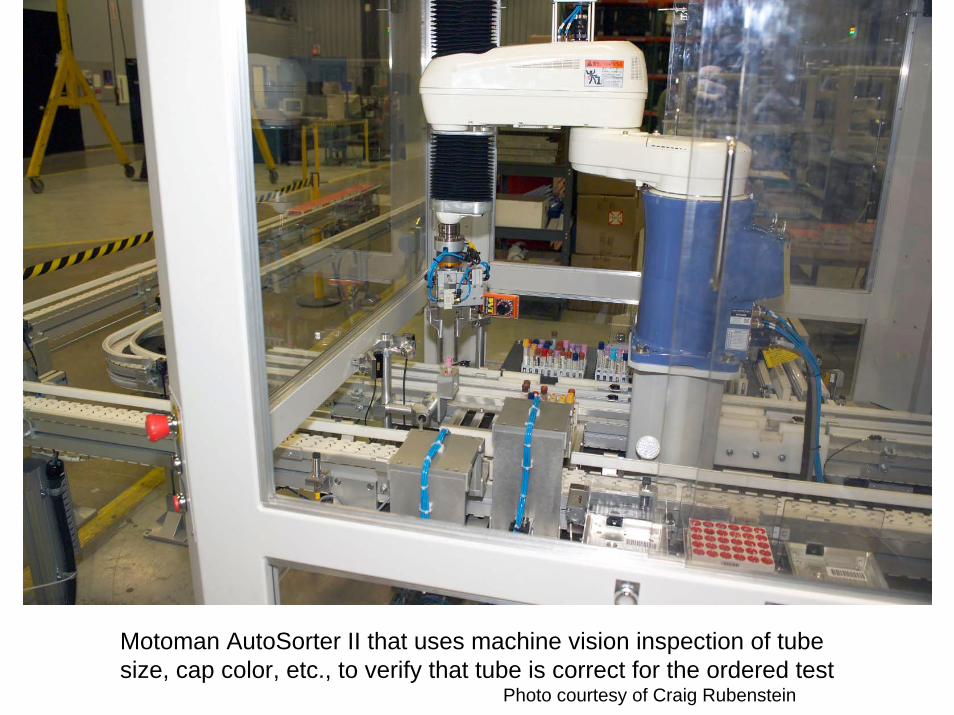
Motoman AutoSorter II that uses machine vision inspection of tube size, cap color, etc., to verify that tube is correct for the ordered test
Photo courtesy of Craig Rubenstein
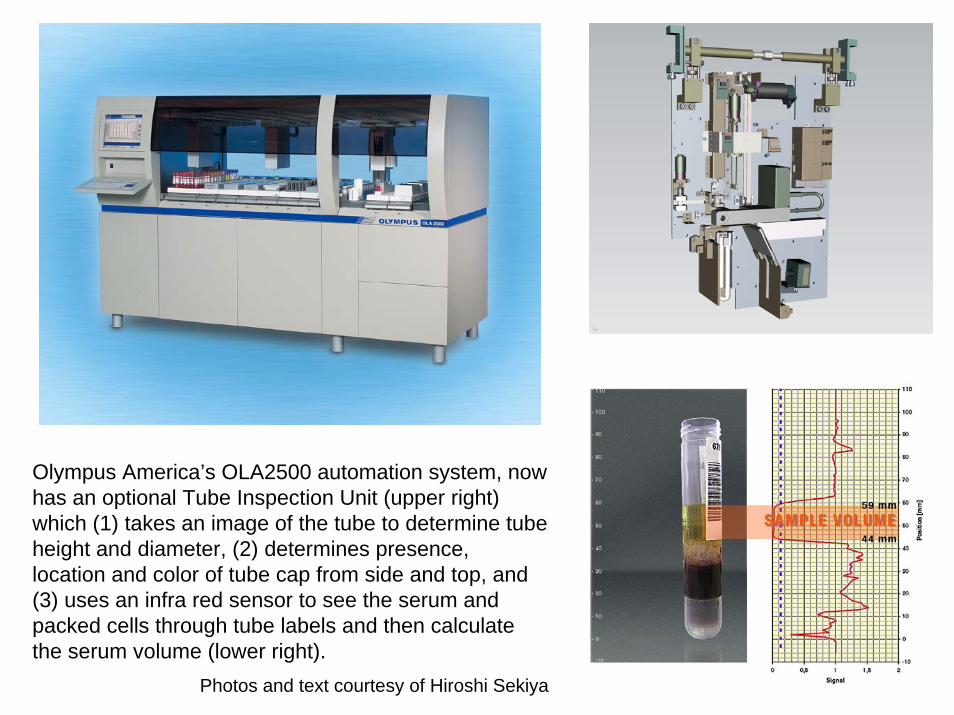
Olympus America’s OLA2500 automation system, now has an optional Tube Inspection Unit (upper right) which (1) takes an image of the tube to determine tube height and diameter, (2) determines presence, location and color of tube cap from side and top, and (3) uses an infra red sensor to see the serum and packed cells through tube labels and then calculate the serum volume (lower right).
Photos and text courtesy of Hiroshi Sekiya
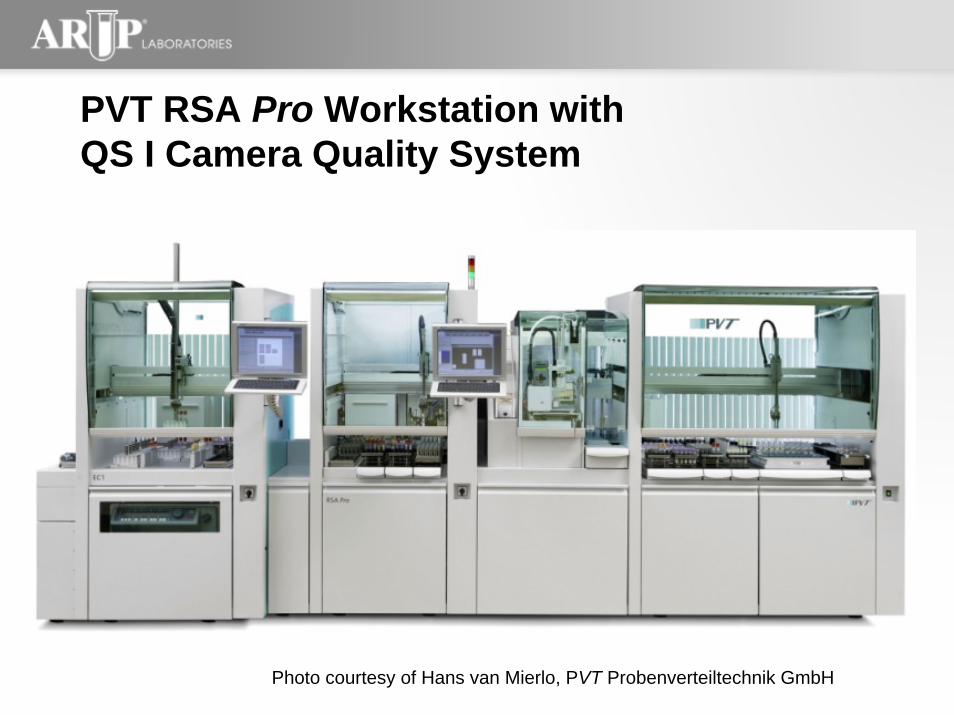
PVT RSA Pro Workstation withQS I Camera Quality System
Photo courtesy of Hans van Mierlo, PVT Probenverteiltechnik GmbH
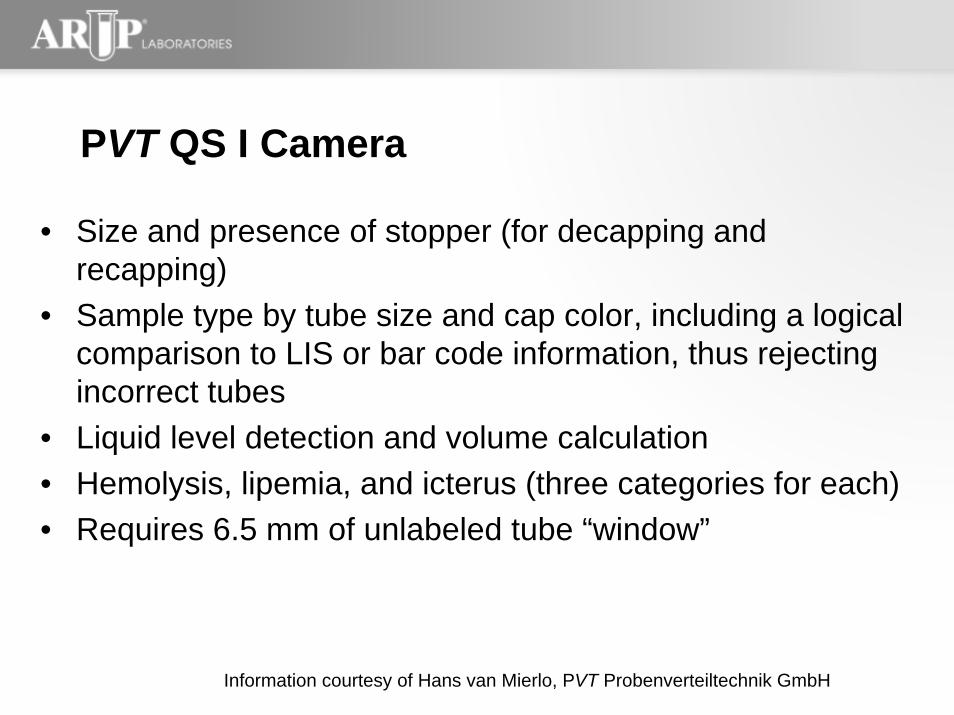
PVT QS I Camera
• Size and presence of stopper (for decapping and recapping)
• Sample type by tube size and cap color, including a logical comparison to LIS or bar code information, thus rejecting incorrect tubes
• Liquid level detection and volume calculation• Hemolysis, lipemia, and icterus (three categories for each)• Requires 6.5 mm of unlabeled tube “window”
Information courtesy of Hans van Mierlo, PVT Probenverteiltechnik GmbH
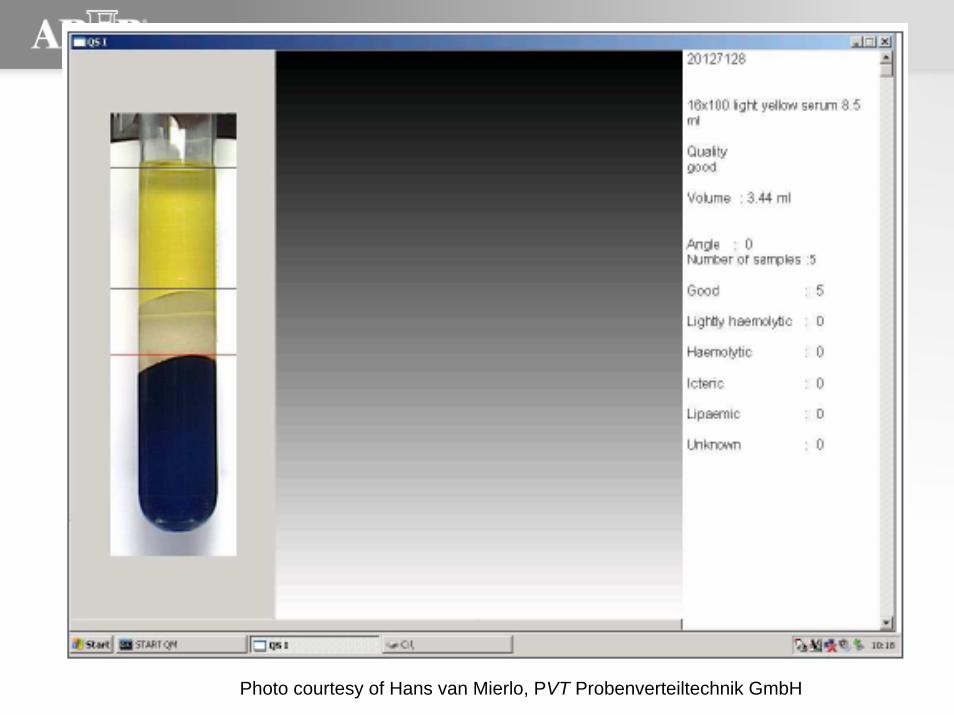
Photo courtesy of Hans van Mierlo, PVT Probenverteiltechnik GmbH
Pre-Analytic Activities
Automation
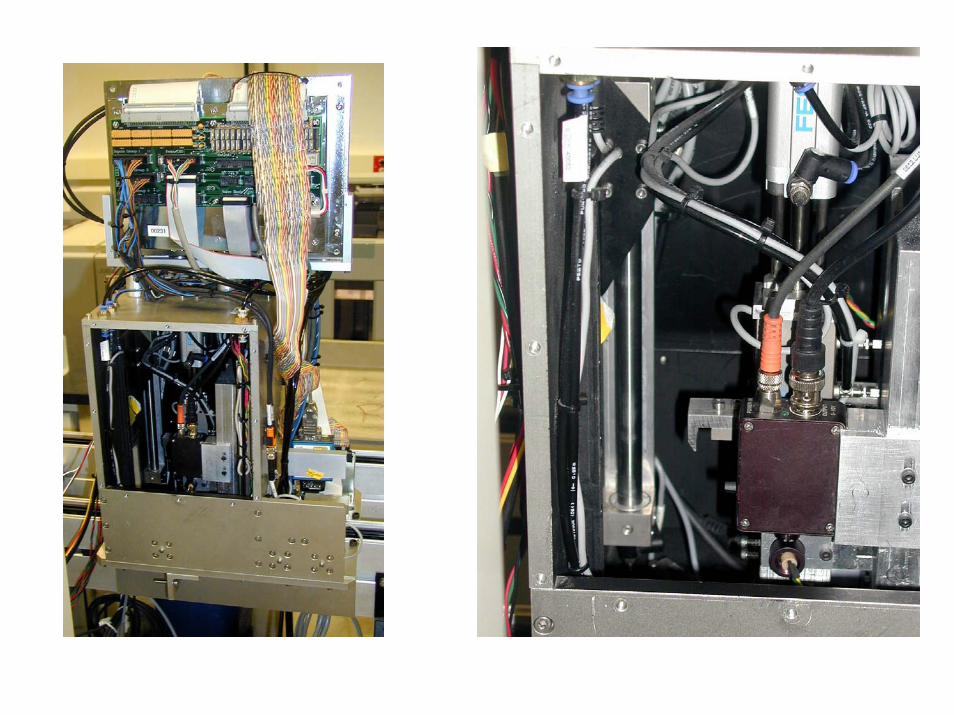
Automation of Quality InspectionsR&D Projects at ARUP Laboratories:
Detection of Minimum & Maximum VolumesDetection of Mislabeled Specimens
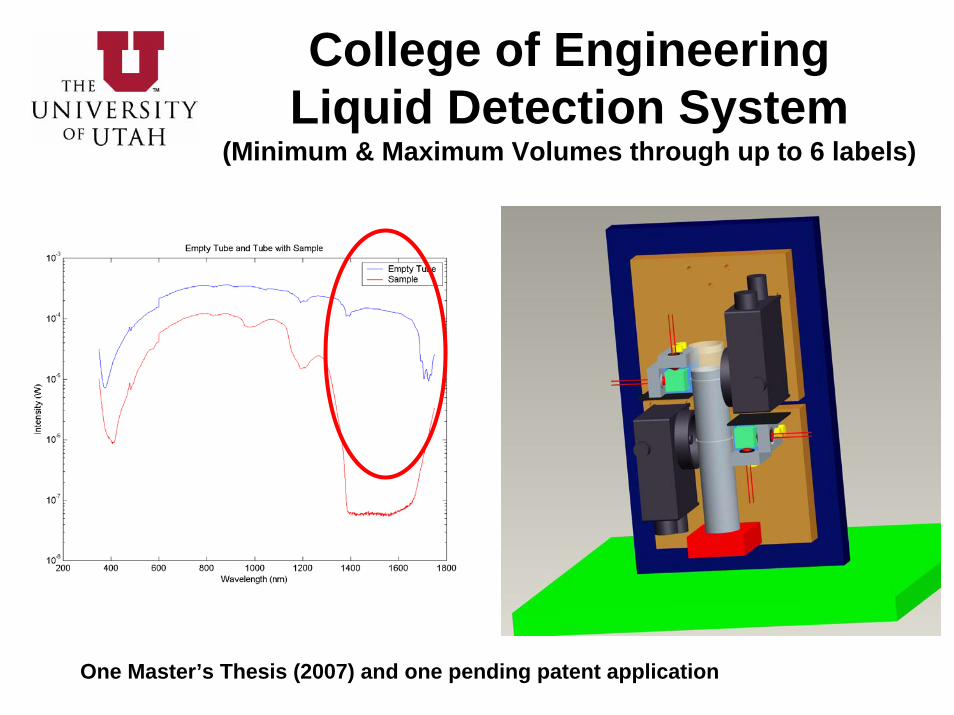
Liquid DetectionCollege of EngineeringLiquid Detection System
(Minimum & Maximum Volumes through up to 6 labels)
One Master’s Thesis (2007) and one pending patent application
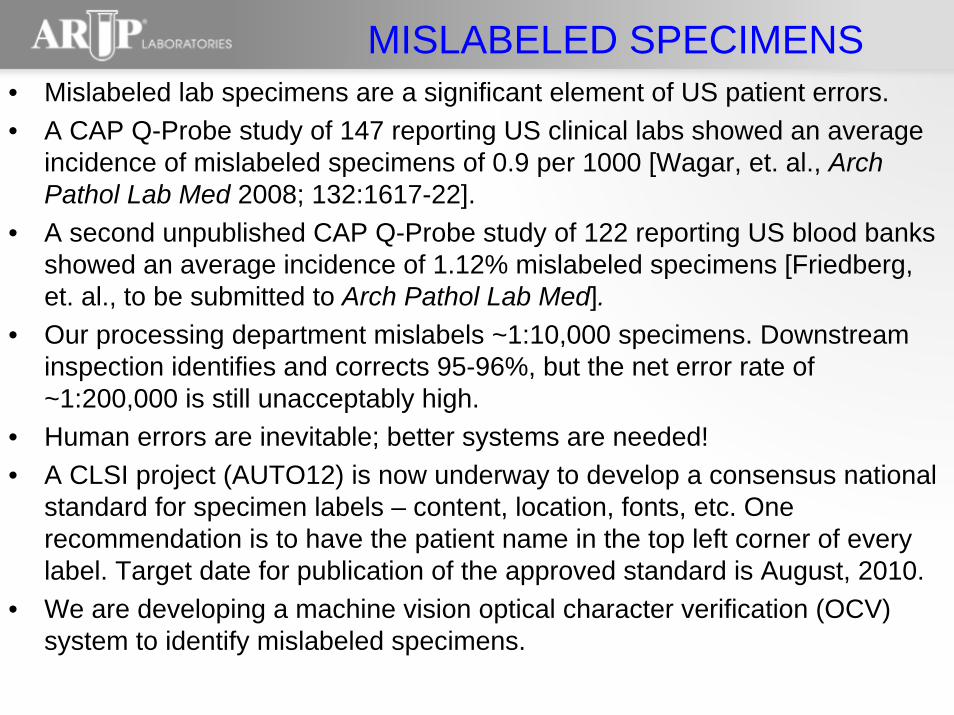
MISLABELED SPECIMENS• Mislabeled lab specimens are a significant element of US patient errors.• A CAP Q-Probe study of 147 reporting US clinical labs showed an average
incidence of mislabeled specimens of 0.9 per 1000 [Wagar, et. al., Arch Pathol Lab Med 2008; 132:1617-22].
• A second unpublished CAP Q-Probe study of 122 reporting US blood banks showed an average incidence of 1.12% mislabeled specimens [Friedberg, et. al., to be submitted to Arch Pathol Lab Med].
• Our processing department mislabels ~1:10,000 specimens. Downstream inspection identifies and corrects 95-96%, but the net error rate of ~1:200,000 is still unacceptably high.
• Human errors are inevitable; better systems are needed!• A CLSI project (AUTO12) is now underway to develop a consensus national
standard for specimen labels – content, location, fonts, etc. One recommendation is to have the patient name in the top left corner of every label. Target date for publication of the approved standard is August, 2010.
• We are developing a machine vision optical character verification (OCV) system to identify mislabeled specimens.
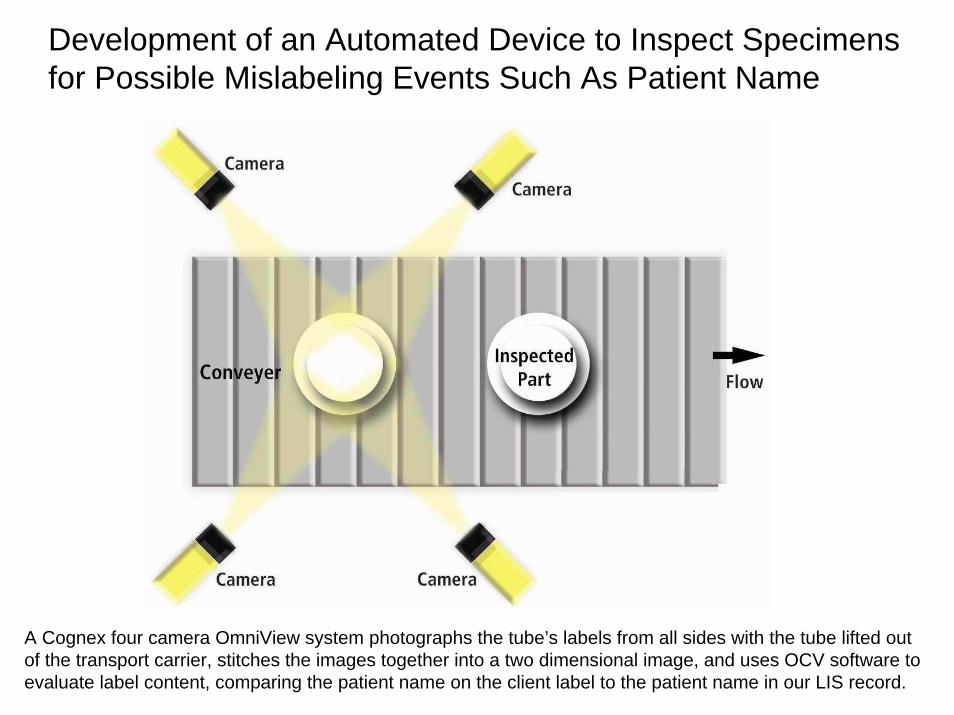
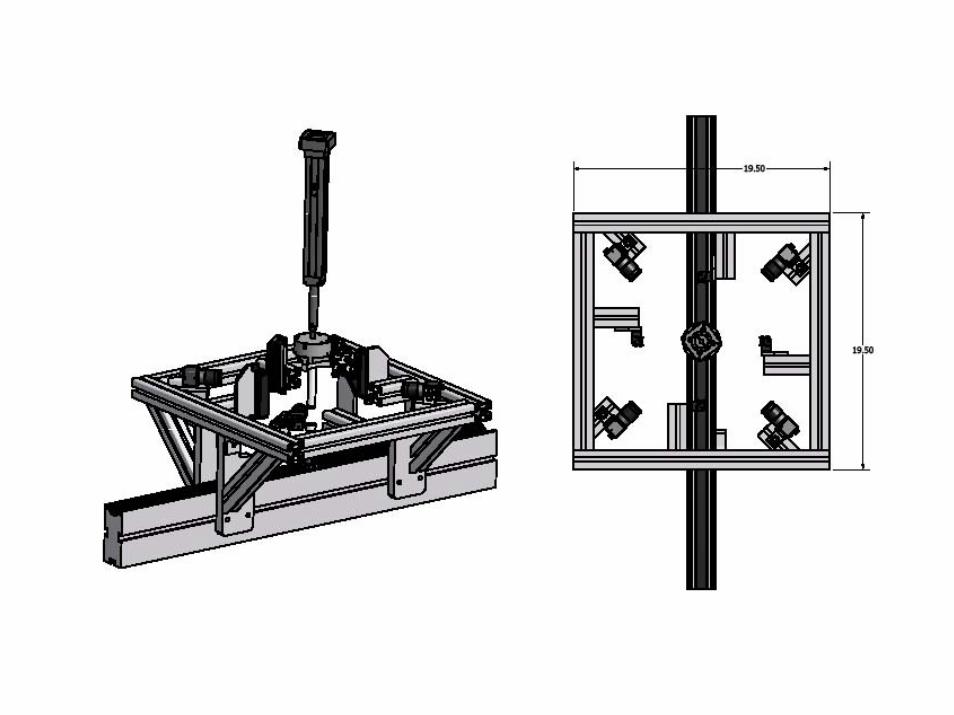
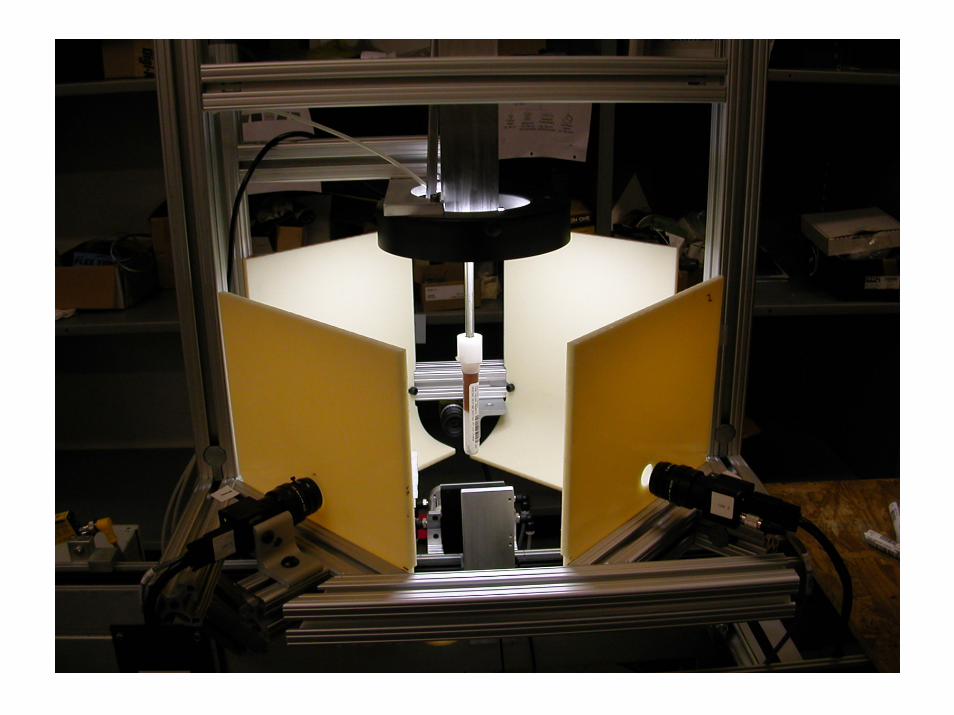
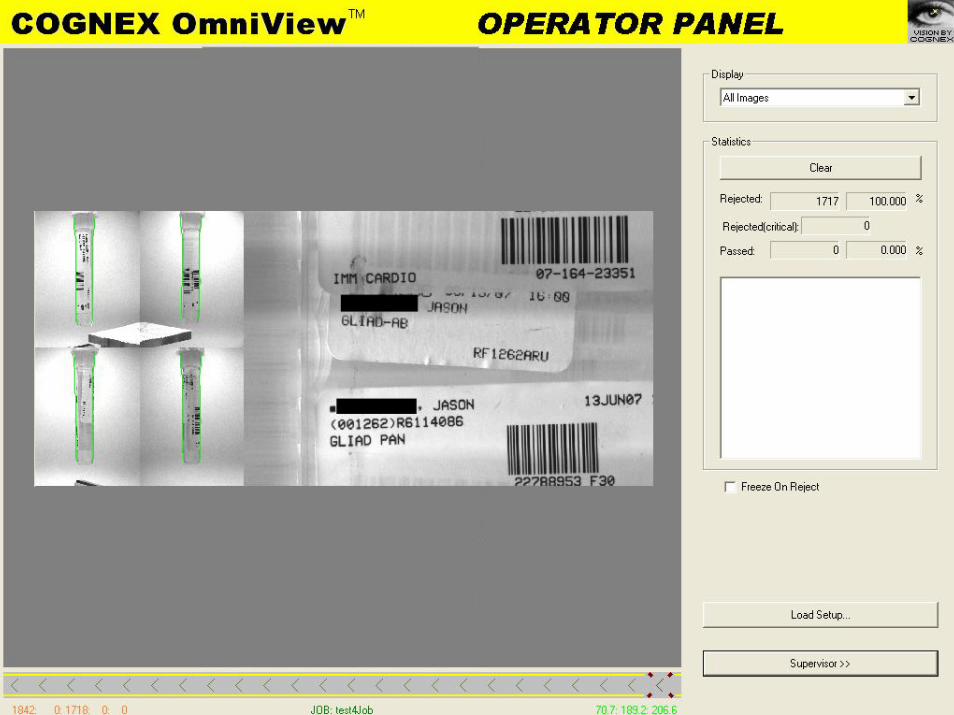
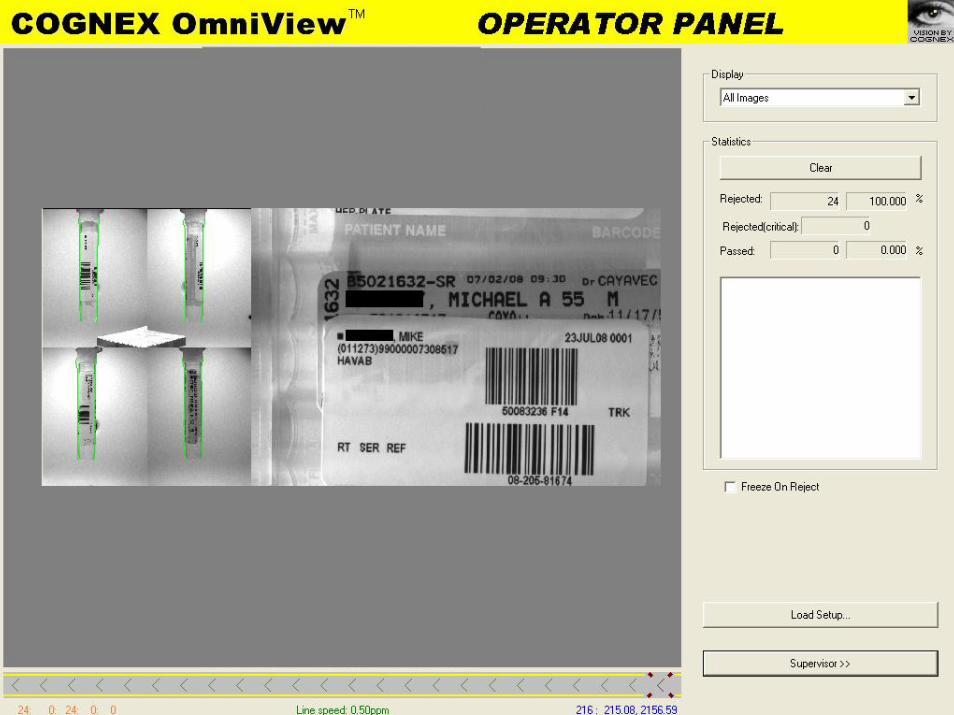
Development of an Automated Device to Inspect Specimens for Possible Mislabeling Events Such As Patient Name
A Cognex four camera OmniView system photographs the tube’s labels from all sides with the tube lifted out of the transport carrier, stitches the images together into a two dimensional image, and uses OCV software to evaluate label content, comparing the patient name on the client label to the patient name in our LIS record.
Analytic Activities
MiddlewareAutoverificationQuality Control
Special Calculated ResultsReflexive Testing
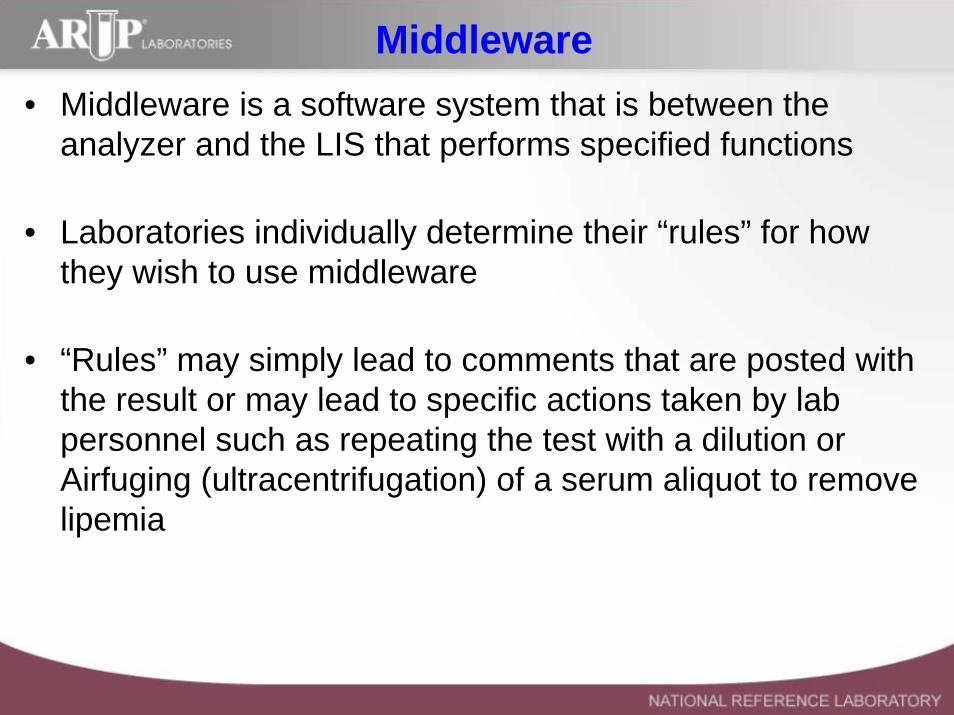
Middleware• Middleware is a software system that is between the
analyzer and the LIS that performs specified functions
• Laboratories individually determine their “rules” for how they wish to use middleware
• “Rules” may simply lead to comments that are posted with the result or may lead to specific actions taken by lab personnel such as repeating the test with a dilution or Airfuging (ultracentrifugation) of a serum aliquot to remove lipemia
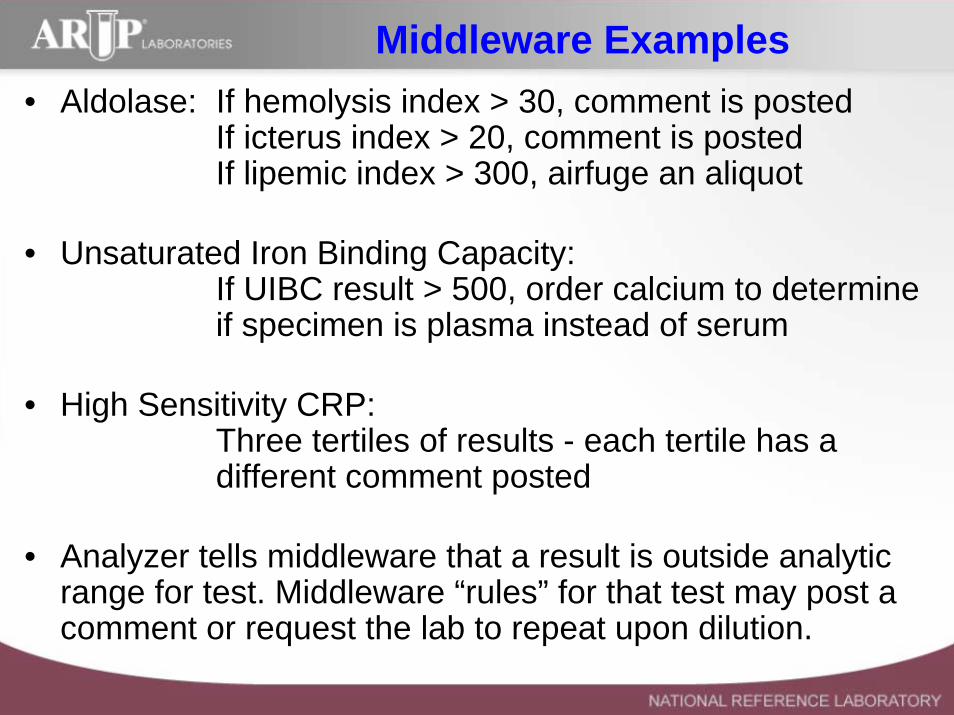
Middleware Examples• Aldolase: If hemolysis index > 30, comment is posted
If icterus index > 20, comment is postedIf lipemic index > 300, airfuge an aliquot
• Unsaturated Iron Binding Capacity:If UIBC result > 500, order calcium to determine if specimen is plasma instead of serum
• High Sensitivity CRP:Three tertiles of results - each tertile has a different comment posted
• Analyzer tells middleware that a result is outside analytic range for test. Middleware “rules” for that test may post a comment or request the lab to repeat upon dilution.
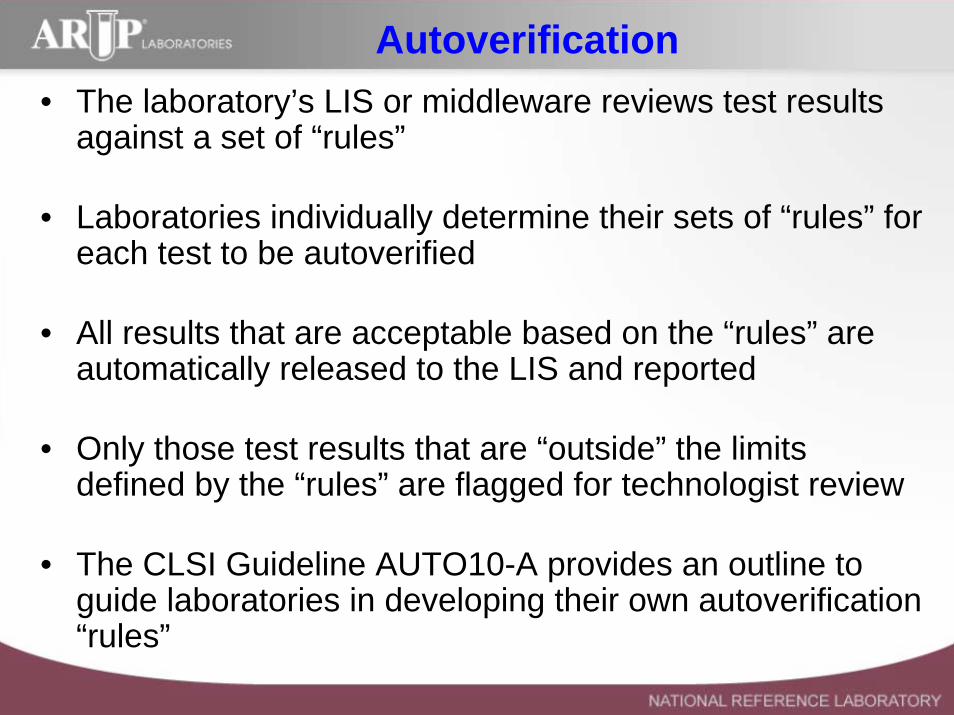
Autoverification• The laboratory’s LIS or middleware reviews test results
against a set of “rules”
• Laboratories individually determine their sets of “rules” for each test to be autoverified
• All results that are acceptable based on the “rules” are automatically released to the LIS and reported
• Only those test results that are “outside” the limits defined by the “rules” are flagged for technologist review
• The CLSI Guideline AUTO10-A provides an outline to guide laboratories in developing their own autoverification“rules”
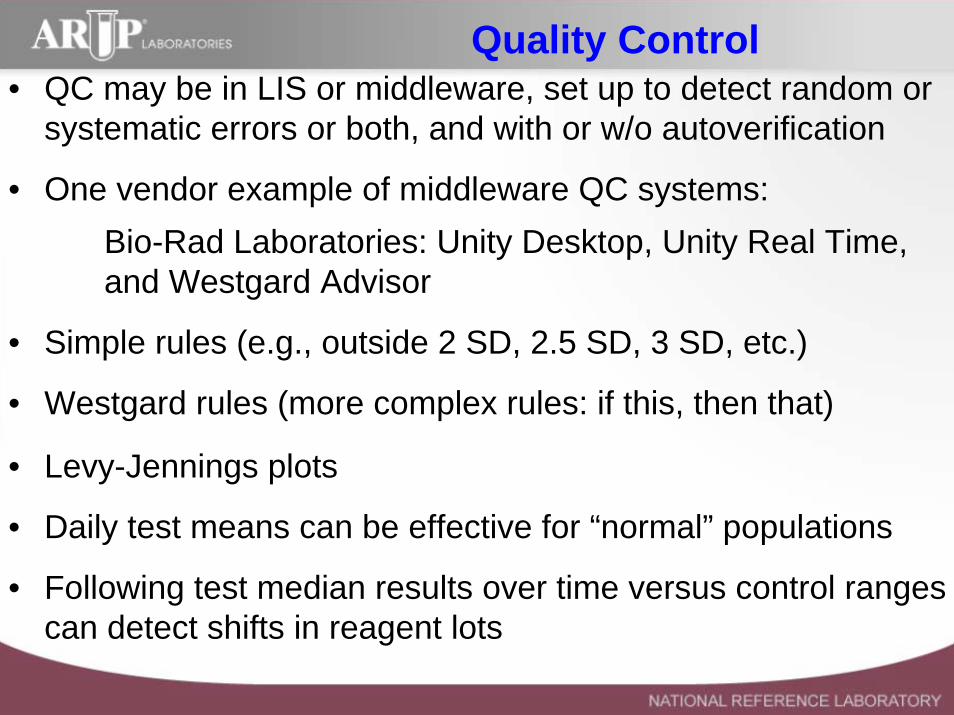
Quality Control• QC may be in LIS or middleware, set up to detect random or
systematic errors or both, and with or w/o autoverification
• One vendor example of middleware QC systems:Bio-Rad Laboratories: Unity Desktop, Unity Real Time, and Westgard Advisor
• Simple rules (e.g., outside 2 SD, 2.5 SD, 3 SD, etc.)
• Westgard rules (more complex rules: if this, then that)
• Levy-Jennings plots
• Daily test means can be effective for “normal” populations
• Following test median results over time versus control ranges can detect shifts in reagent lots
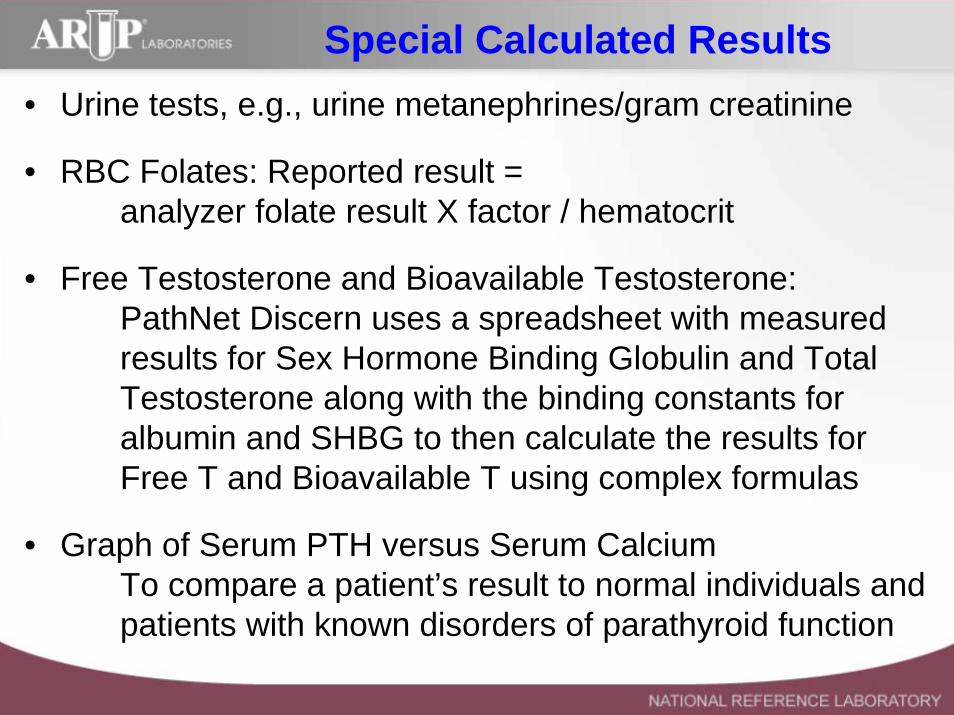
Special Calculated Results• Urine tests, e.g., urine metanephrines/gram creatinine
• RBC Folates: Reported result = analyzer folate result X factor / hematocrit
• Free Testosterone and Bioavailable Testosterone:PathNet Discern uses a spreadsheet with measured results for Sex Hormone Binding Globulin and Total Testosterone along with the binding constants for albumin and SHBG to then calculate the results for Free T and Bioavailable T using complex formulas
• Graph of Serum PTH versus Serum CalciumTo compare a patient’s result to normal individuals and patients with known disorders of parathyroid function
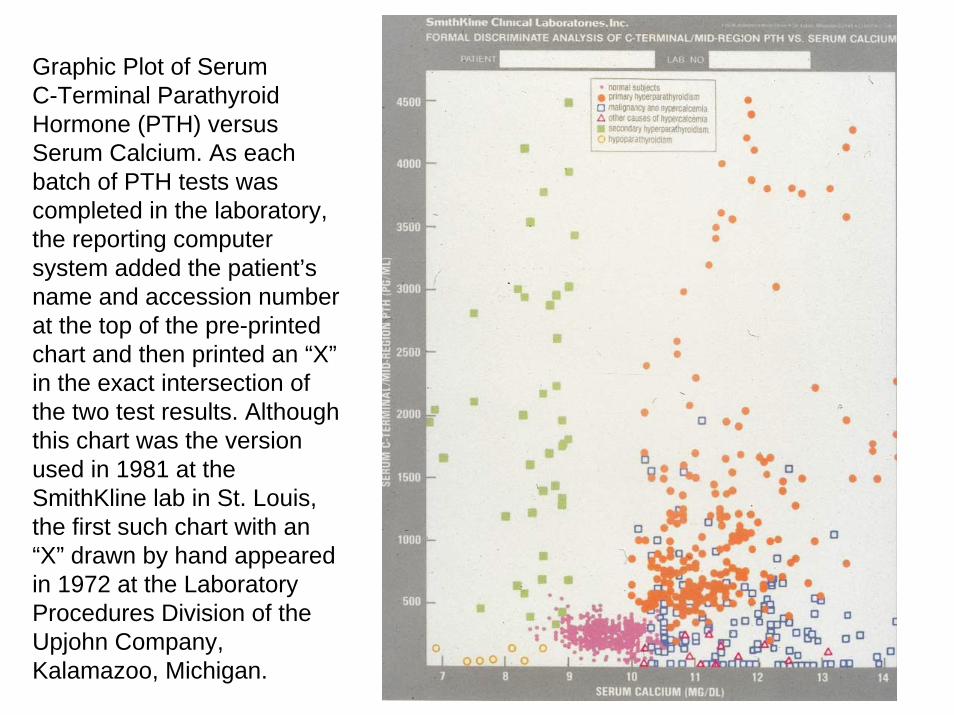
Graphic Plot of SerumC-Terminal Parathyroid Hormone (PTH) versus Serum Calcium. As each batch of PTH tests was completed in the laboratory, the reporting computer system added the patient’s name and accession number at the top of the pre-printed chart and then printed an “X” in the exact intersection of the two test results. Although this chart was the version used in 1981 at the SmithKline lab in St. Louis, the first such chart with an “X” drawn by hand appeared in 1972 at the Laboratory Procedures Division of the Upjohn Company, Kalamazoo, Michigan.
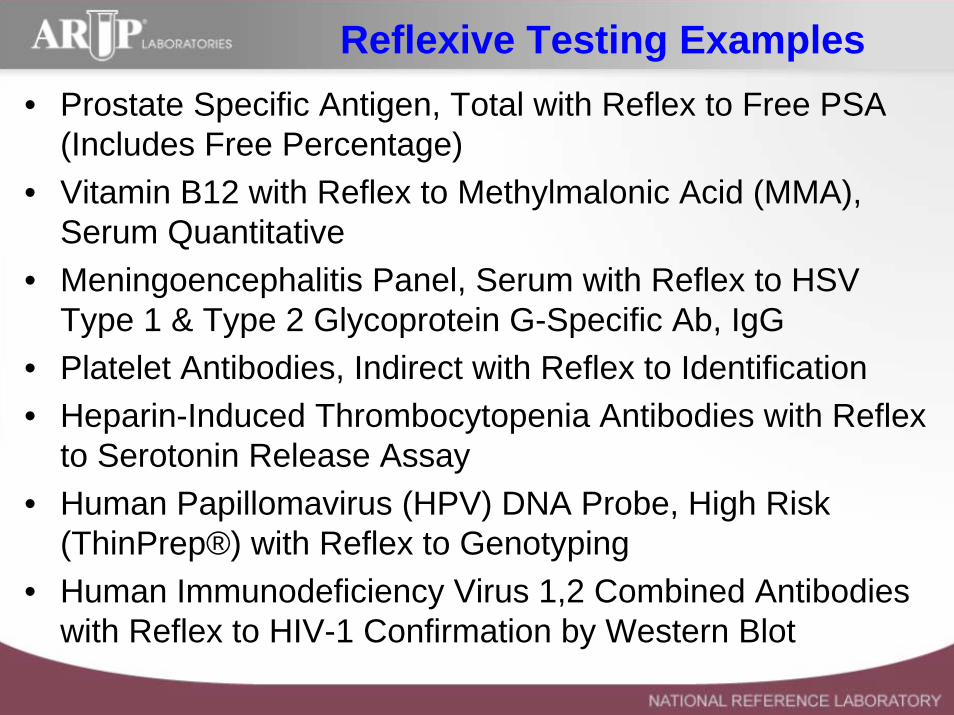
Reflexive Testing Examples• Prostate Specific Antigen, Total with Reflex to Free PSA
(Includes Free Percentage)• Vitamin B12 with Reflex to Methylmalonic Acid (MMA),
Serum Quantitative • Meningoencephalitis Panel, Serum with Reflex to HSV
Type 1 & Type 2 Glycoprotein G-Specific Ab, IgG• Platelet Antibodies, Indirect with Reflex to Identification• Heparin-Induced Thrombocytopenia Antibodies with Reflex
to Serotonin Release Assay• Human Papillomavirus (HPV) DNA Probe, High Risk
(ThinPrep®) with Reflex to Genotyping• Human Immunodeficiency Virus 1,2 Combined Antibodies
with Reflex to HIV-1 Confirmation by Western Blot
Post-Analytic Activities
Specimen Archive
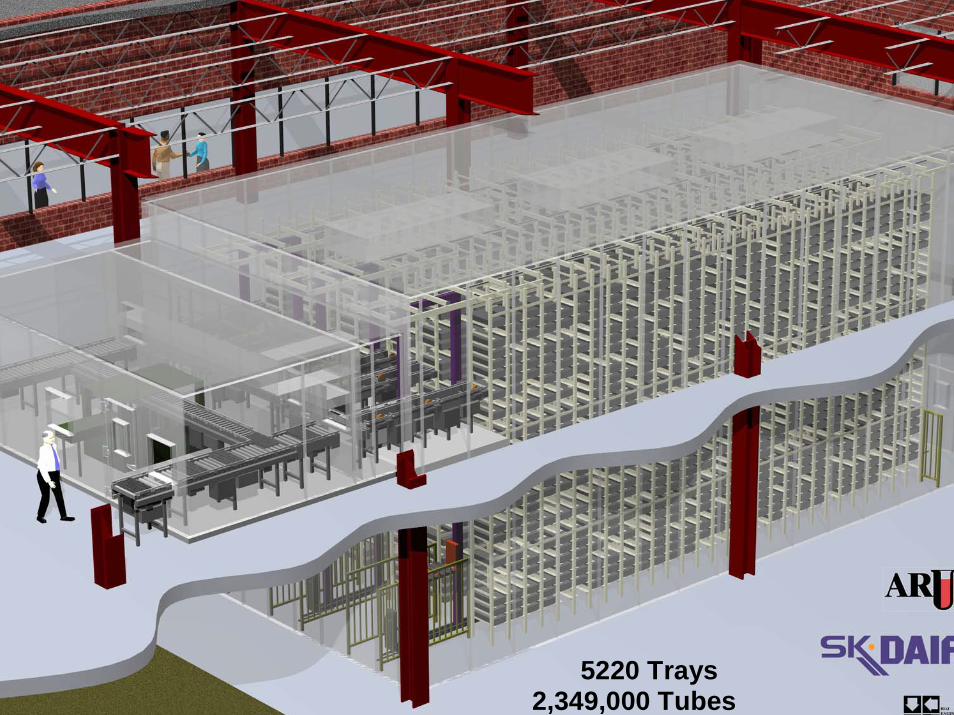
5220 Trays 2,349,000 Tubes
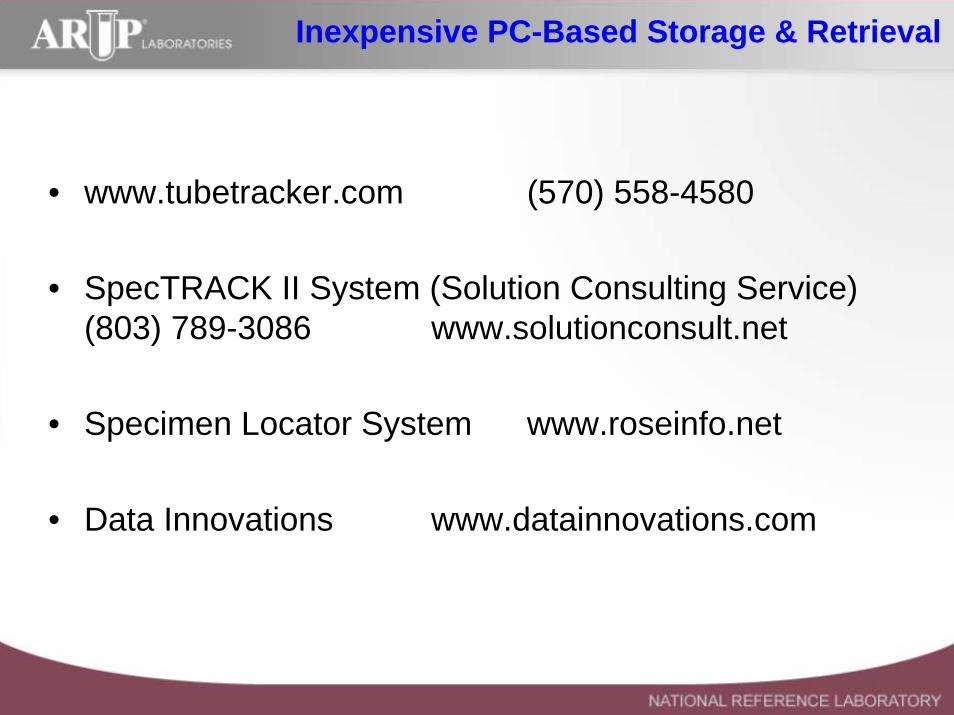
Inexpensive PC-Based Storage & Retrieval
• www.tubetracker.com (570) 558-4580
• SpecTRACK II System (Solution Consulting Service)(803) 789-3086 www.solutionconsult.net
• Specimen Locator System www.roseinfo.net
• Data Innovations www.datainnovations.com
Post-Analytic Activities
Specimen Retrieval
Additional TestsRepeat Tests
R & D
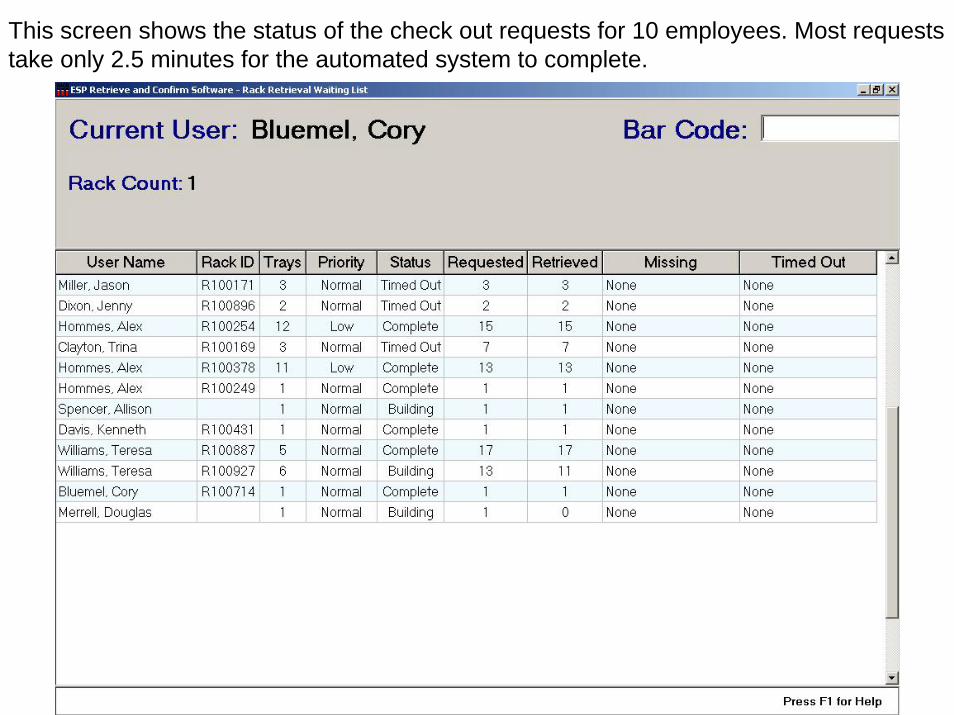
This screen shows the status of the check out requests for 10 employees. Most requests take only 2.5 minutes for the automated system to complete.
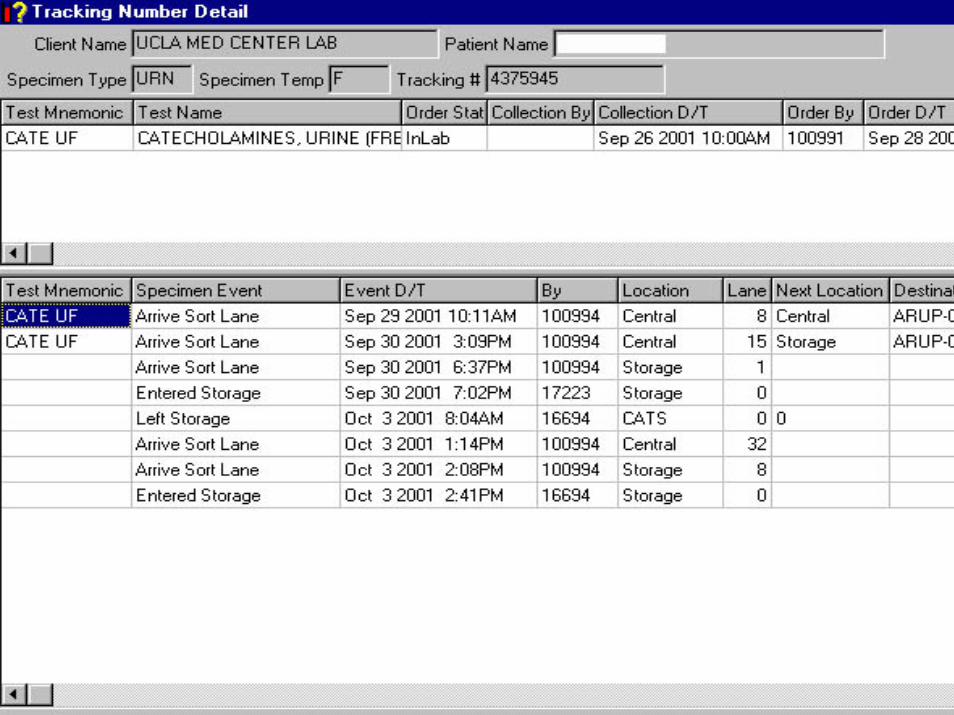
Post-Analytic Activities
Specimen Tracking
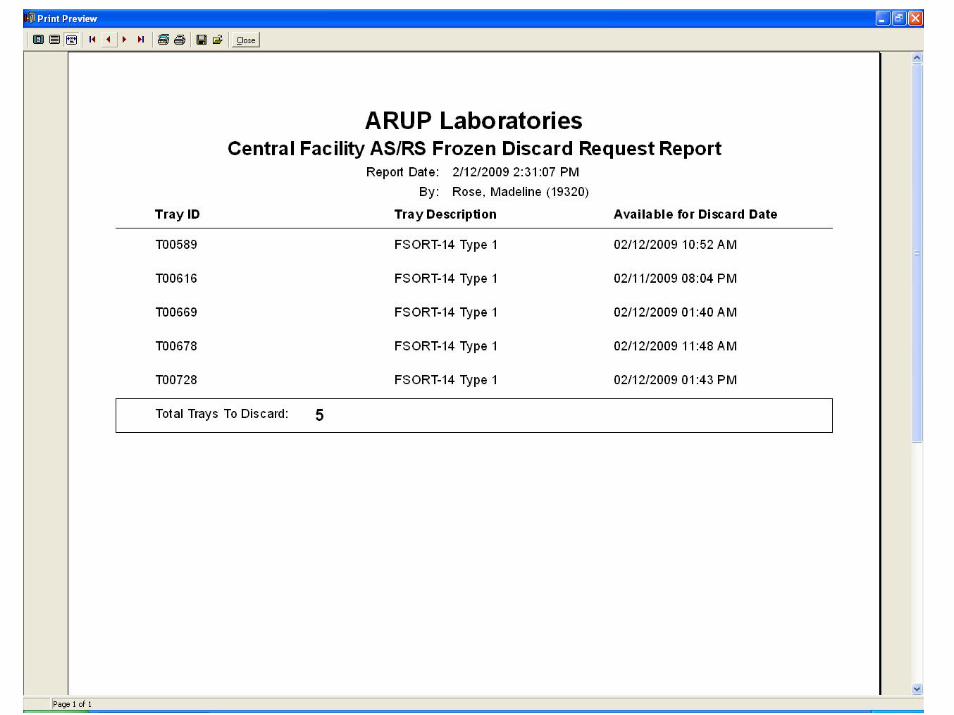
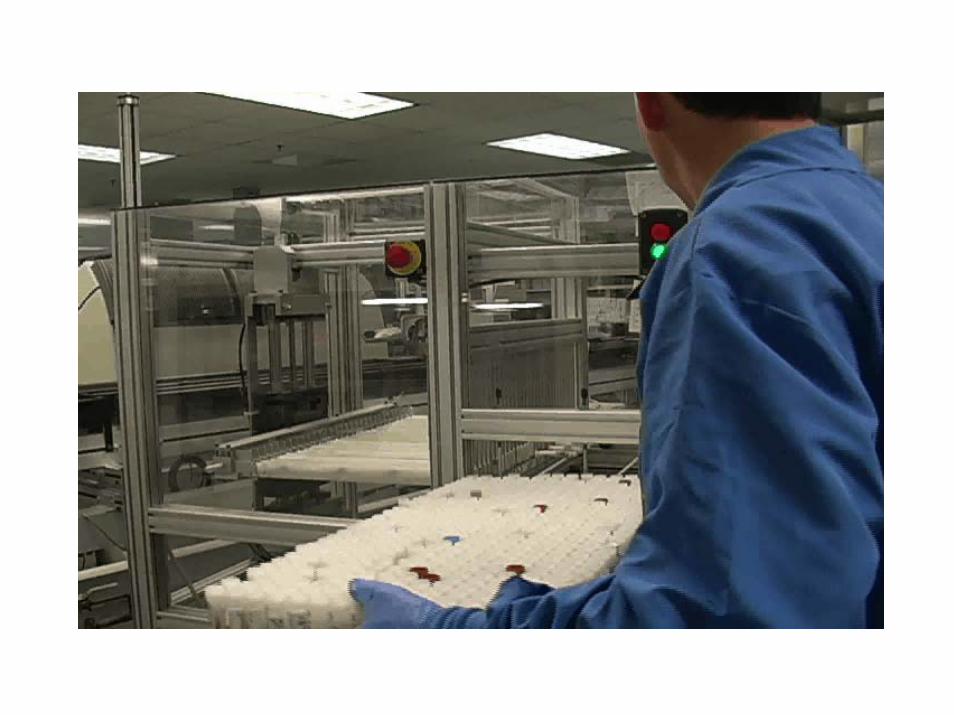
Post-Analytic Activities
Discard of Finished Specimens
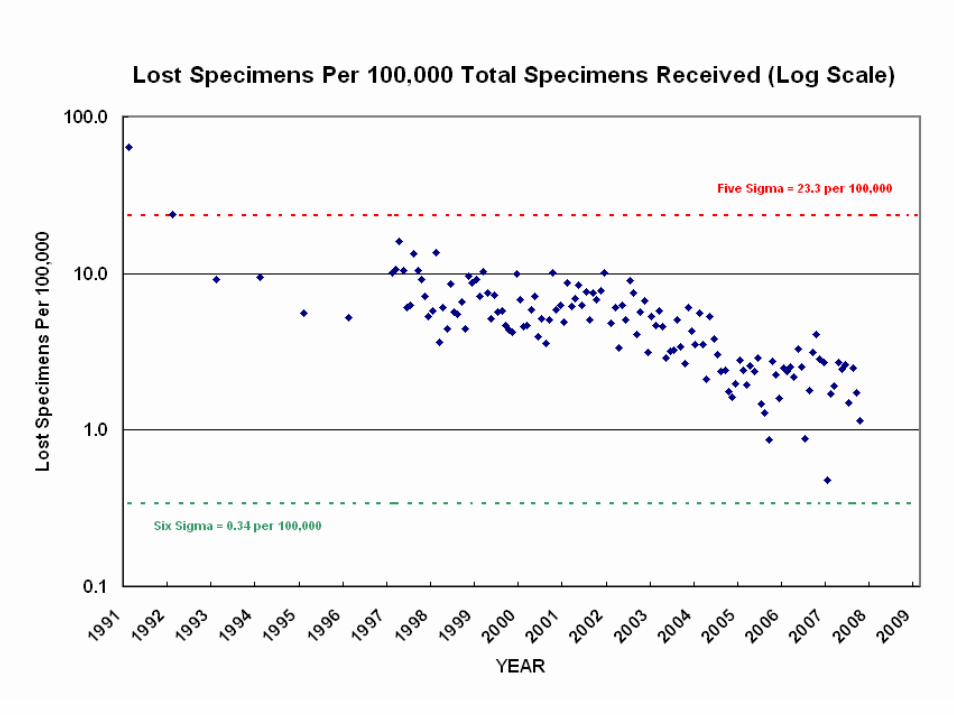
Will Information Technology and Automation in the Clinical Laboratory Actually Reduce
Patient Errors?
Summary• Information Technology can impact every aspect of clinical
laboratory testing from the creation of the test order to the disposal of specimens after testing is complete.
• Information Technology provides numerous opportunities for automating manual processes – beyond the automation that is based on robotics.
• Through the elimination of tiresome manual steps and review of routine results, Information Technology can significantly improve the quality of clinical laboratory testing and reduce patient errors.
• Automation by itself is usually not successful without good supporting Information Technology systems.
Thank you
Questions?


![UNICODE SECURITY MECHANISMS · 2019. 1. 9. · Unicode Technical Report #36, "Unicode Security Considerations" [UTR36] provides guidelines for detecting and avoiding security problems](https://img.pdfslide.net/doc/110x75/612671dcd11d326c8e2c475f/unicode-security-mechanisms-2019-1-9-unicode-technical-report-36-unicode.jpg)


![Detecting Carbon Monoxide Poisoning Detecting Carbon ...2].pdf · Detecting Carbon Monoxide Poisoning Detecting Carbon Monoxide Poisoning. Detecting Carbon Monoxide Poisoning C arbon](https://img.pdfslide.net/doc/110x75/5f551747b859172cd56bb119/detecting-carbon-monoxide-poisoning-detecting-carbon-2pdf-detecting-carbon.jpg)